the Creative Commons Attribution 4.0 License.
the Creative Commons Attribution 4.0 License.
 | 20 Jan 2025
Setup of a densely distributed and quality-controlled meteorological sensor network in Pune, India, for urban microclimate research and citizen participation in the context of climate change adaptation
Nils Eingrüber
Wolfgang Korres
Ulrich Löhnert
Karl Schneider
Urban areas are particularly affected by climate change. Excessive heat waves, droughts and extreme precipitation events are the most detrimental meteorological events affecting cities and their population worldwide. Adaptation and mitigation measures must be specific for the given climatic, socio-economic and cultural conditions. To better understand differences in the natural and social environment and their effects upon climate adaptation strategies in humid and monsoon-driven climates, a densely distributed meteorological sensor network was established in an urban high-density neighbourhood in Pune, India, in 2023 for continuous long-term data collection (12 stations, 59 sensors) following the prototype network installed in the city of Cologne, Germany, in 2021 (14 stations, 58 sensors). Climate change mitigation and adaptation requires activation and participation of citizens. In order to connect the needs of research with citizen participation, it is essential (i) to provide quality-controlled microclimatic measurements with high spatial and temporal resolution; (ii) to provide a basis to analyse cause-and-effect relationships in a given urban microclimatic setting; (iii) to enable suitable climate change adaptation measures to be identified and the participation potential of stakeholders to be assessed; and (iv) to support the building of a community of learners, participants and activists towards becoming actively involved in climate change adaptation in their own living environment. The transferability and expandability of the approach requires that the measurement network must be affordable to facilitate citizen participation. Scientists can use the measurement data for example to validate physically based microclimate models like ENVI-met to simulate adaptation effects. The measurement locations of the standardized, low cost and expandable measurement network in Pune cover the full range of surface characteristics from vegetated parks to street canyons and from built-up inner courtyards to open areas, representing the heterogeneity of the microclimatic conditions within that study area. The similarity of the sensor network in both cities allows for comparison of the functionality of the system under different environmental conditions and assessment of stakeholder and citizen activation and participation in two different countries. Despite challenges arising from discontinuous power supply and radio signal interruptions due to sensor wetness during the rainy season in Pune, the data quality shows that the measurement setup is also suitable for tropical monsoon climates. Stakeholder participation was assessed by statistical analyses of the usage statistics of the NETATMO app by the citizen scientists. Significant differences in the number of app activities between Pune and Cologne were found. Despite differences in the form and intensity of active participation, citizens in both cities show great interest in getting involved in climate research and pathways for climate change adaptation, indicating the high potential of activating citizens in the transformative process towards climate-sensitive urban development.
- Article
(1630 KB) - Full-text XML
- BibTeX
- EndNote


Due to climate change, many urban areas worldwide are increasingly affected by extreme heat events. Indian cities face a prolonged pre-monsoon season, with extreme heat leading to significantly increasing health issues and mortality rates in recent decades (Jha et al., 2022; Singh et al., 2021; Banerjee and Maharaj, 2020). The heat waves in India during May and June 2022 and 2023 had strong impacts on the economy and health of the affected population (Karrevula et al., 2023). Heat events associated with extreme drought can cause considerable health and economic consequences, and downscaling methods of global circulation models show that the frequency and the intensity of climatological and hydrological extremes are expected to significantly increase in future (Eingrüber and Korres, 2022). To reduce heat stress and improve thermal comfort in urban areas, current and future urban development must address suitable adaptation measures, especially in rapidly growing and densely populated cities like Pune, India (Khan et al., 2020). Successful and sustainable heat mitigation requires knowledge of cause-and-effect relationships in the context of climate change. Active citizen participation is needed to realize the potential of these measures. The increasing abundance of low-cost weather stations indicates the public interest in these topics. However, significant differences in the number of weather stations between India and Germany can be found. In India, for example, currently fewer than 100 private DAVIS weather stations report data, while more than 1500 were operated in Germany in 2023. While only 2 NETATMO weather stations were providing data in the city of Pune, India, at the beginning of 2023, ca. 900 stations were available in the city of Cologne, Germany. To harness the potential of private weather stations for urban climate research, the measurements must be comparable and quality-controlled (Fenner et al., 2021). To facilitate or strengthen citizen participation in local communities, hands-on experience in the citizens' own living environment based on such measurements combined with a networking approach is a promising pathway (Callaghan et al., 2019). While quality-controlled and suitably distributed microclimatic measurements are essential for research, experience in the citizens' own living environment and evidence based on data is essential for citizens to identify and understand a suitable course of action towards implementing adaptation measures (Phillips et al., 2019).
Measurement systems for urban climatology integrating the scientific needs and the needs of citizen scientists are very rare. Thus, there is a need to design and test a microclimate measurement system setup that addresses both the scientific requirements and the needs of citizen science. Categories describing the scientific requirements include data accuracy, comparability of measurements, temporal and spatial resolution suitable to address the research questions, and completeness of the data set. Citizen science requirements address categories such as costs and longevity of the instruments, accessibility of own data and ease of use, relevance for own decision-making, access to data of others, protection of personal information, access to collaborative networks, and feedback from scientists. Ideally, the sensor network addresses all these categories. Initial experience with the setup of a research-grade and citizen science microclimatic measurement network utilizing NETATMO low-cost sensors was gathered by Eingrüber et al. (2023a) for urban climate studies in Cologne, Germany. The measurements taken by this network were used to identify the microclimatic properties of different types of surfaces and to analyse the effects of technical and nature-based solutions like unsealed areas, facade greening or street trees on thermal comfort in the study area in Cologne (Eingrüber et al., 2024a, 2025, 2023c). Núñez-Peiró et al. (2023) have provided evidence for the high potential of crowd-sourced data derived from systems such as NETATMO due to the observed exponential increase in the number of installed sensors worldwide in recent years.
The goal of this paper is (i) to inform about the setup, characteristics, application and quality-control measures of a low-cost urban climate network in Pune, India; (ii) to show the scientific suitability of the system for identifying microclimatic variations within the study area for an excessive heat period; and (iii) to assess indicators of citizen participation and activation. Thus, the first goal addresses technical issues regarding the suitability, measurement quality and usability of a low-cost NETATMO system for urban microclimate studies in Pune. The second goal addresses the potential of the system to measure microclimatic heterogeneity caused by local climate factors, and the third goal addresses a pertinent issue of human–environment interaction investigating the potentials of activation and citizen participation in their own living environment in response to the need for climate change adaptation and mitigation. In this paper, we present the setup of the research-grade citizen science measurements network which was established in 2023, consisting of 59 sensors measuring air temperature, relative humidity, rainfall intensity, wind speed and wind direction, as well as carbon dioxide concentrations, in a 16 ha urban study area in Pune, India. Based on first measurements, we show the suitability of the approach for scientific purposes to identify local microclimatic effects and analyse participation using NETATMO app usage reports of the citizen scientists as an indicator for their activities and interest in the measurements and topic. Finally, we will show the potential for further scientific applications and modelling approaches as well as for further community building of citizen scientists and spin-off effects.
2.1 Objectives of the low-cost measurement system
To enable continuous long-term high-quality measurements with real-time data transfer, NETATMO low-cost sensors were selected. Already more than 2 million of these crowd-sourced weather stations are operated by citizens worldwide, with a fast-growing trend. For India, however, crowd-sourced weather stations are still rare. For the entire agglomeration area of Pune, only two NETATMO stations and one DAVIS station were registered before 2023. Governmental stations are similarly rare. To our knowledge, there is currently no dense urban microclimate monitoring network operating in India. For our research, we acquired 12 semi-professional NETATMO base stations consisting of an indoor module, which is connected via Wi-Fi, and up to four outdoor modules. Their indoor modules measure indoor temperature, relative humidity, air pressure and carbon dioxide concentration. They serve mainly as gateway to the outdoor sensors communicating via radio signal. In our measurement system, we regularly connected two outdoor modules to each of the 12 base stations measuring air temperature, relative air humidity and carbon dioxide, yielding in total 24 regular outdoor modules. Each of the 12 base stations was also equipped with an ultrasonic anemometer measuring wind speed and wind direction (12 in total), as well as one tipping-bucket precipitation gauge measuring rainfall amount and intensity (12 in total). The basic instrument setup for each of the 12 base stations along with the mounting system is shown in Fig. 1. Two outdoor mounts are used for each base station to attach one temperature–humidity–CO2 sensor each as well as either a wind speed–wind direction sensor or a precipitation sensor. A standardized mounting system is required to provide comparable measurement conditions of the outdoor measurements. The mount places the sensors at a distance of 50 cm from facades or vegetation. This distance was chosen to scientifically use the sensor measurements for validation of physically based urban microclimate models like ENVI-met which have a spatial resolution of 1 m, since a distance of 50 cm corresponds to the centre of one 1 m3 grid cell in the model domain (Eingrüber et al., 2024b). At the same time, citizen scientists are most interested in the microclimatic conditions in their living environment and the air volume directly affecting them and their thermal comfort, for example, on their balcony, in their front garden or in front of their windows that they open for room ventilation. Thus, a minimum distance of 50 cm of the sensors from facades enables us to take into account personal needs of the citizen scientists as well as scientific requirements for microclimate analyses and model evaluation, while still enabling ventilation of the sensors.
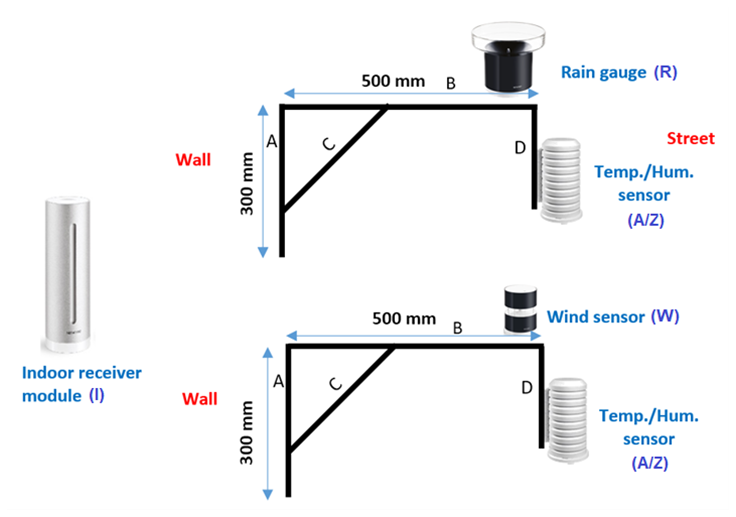
Figure 1Measurement system: schematic representation of a NETATMO weather station with an indoor receiver module (air pressure, Wi-Fi gateway) and two outdoor mounting arms. Mounts attach one temperature–humidity–CO2 sensor within a radiation protection shield each and either an ultrasonic anemometer or a tipping-bucket rainfall gauge.
Our citizen science sensor network design has different goals than the recommendations of the WMO guidance for sensor positioning in urban environments aiming to identify the general urban canopy layer conditions of neighbourhoods, with suggested minimum distances of 1 m from obstacles (WMO, 2023a, b). Our proposed design better suits the purpose of citizen scientists' requirements for monitoring their own direct living environment as well as scientific requirements for high-resolution urban microclimate model validation. While our sensor network design is difficult to use for more general urban canopy layer monitoring serving larger populations, it can specifically serve citizen scientists to identify small-scale microclimatic effects and impacts of local climate change adaptation measures personally influencing their heat exposure and thermal comfort and to intercompare conditions at very specific locations, which is not possible with sensor networks according to the WMO standards. At the same time, our sensor network design can be more suitable for scientists when validating urban microclimate models like ENVI-met to check the model performance for extreme conditions like critical sites close to obstacles to evaluate if physical processes and energy fluxes like reflected shortwave radiation, longwave radiation, and latent and sensible heat flux are reproduced correctly in the model simulations. If participating citizen scientists implement climate change adaptation measures in their living environment due to their observations, and scientists develop adaptation strategies for urban planning based on modelling analyses, entire neighbourhoods and larger populations can benefit from the resulting heat mitigation effects. Thus, the presented citizen science sensor network design in this paper can be an add-on to more general sensor networks following the WMO guidance.

Figure 2Urban study area in southern Pune, India: locations of the 12 installed NETATMO weather stations with their 59 sensor modules (A/Z represents the regular temperature–humidity modules, R represents the rainfall sensors, W represents the wind sensors, and I represents the indoor temperature–humidity modules and Wi-Fi gateways), as well as locations of the two research-grade meteorological reference stations (M). The red border represents the model domain to be used for micrometeorological model simulations with ENVI-met. © OpenStreetMap contributors 2023. Distributed under the Open Data Commons Open Database License (ODbL) v1.0.
The temperature and relative humidity sensors are quality-checked and calibrated against a high-accuracy research-grade reference sensor (Rotronic and TFA high-accuracy reference sensors) under laboratory conditions using a three-point calibration procedure (i) before installing the sensors in the study area and (ii) after every 6 months of measurements. The same quality assurance procedure was used in the study area in Cologne (Eingrüber et al., 2022a). To ensure high-quality measurements in the long term, recalibration procedures of the sensors under laboratory conditions and rotations are planned every 6 months. For precise measurements in the field, the temperature–humidity sensors are shielded with white radiation shields, allowing for air throughflow provided by the manufacturer TFA to minimize the radiation effects and protect the sensors against precipitation. Each basic station setup (four outdoor sensors) could also be augmented by up to two additional temperature–humidity–CO2 sensors (six outdoor sensors in total). As an additional point of reference for the quality-checked NETATMO sensors in the field, data from two research-grade meteorological stations of the Indian Meteorological Service (IMS) and the System of Air Quality and Weather Forecasting and Research (SAFAR system) of the Indian Institute of Tropical Meteorology (IITM) in the study area are used. The locations of the NETATMO modules and the meteorological stations are shown in Fig. 2. The meteorological stations also provide valuable data on various air-quality variables and additional meteorological variables like incoming shortwave solar radiation, which is not measured by the NETATMO sensors.
All NETATMO sensors are continuously measuring at a 5 min interval. Data are continuously transmitted in real time if Wi-Fi access is given. If the system if offline, data are stored by the NETATMO stations for up to 5 d, and the stored data are transmitted to the server once internet access is provided again. The data can be accessed in real time by the scientists as well as the citizen scientists using the NETATMO browser-based web app or the mobile phone app. These apps also provide simple statistics, line plots, and user-defined smart-home functions and weather alarms, etc. Thus, after standardized installation and calibration, the NETATMO weather stations fulfil the scientific requirements regarding comparability, reproducibility and data quality for urban climate research as well as the requirements of stakeholder involvement and citizen science regarding actuality, customized reporting and relevance to the own living environment. This setup provides a bridge between expert utilization and citizen science. In addition, the open data access of the outdoor measurements allows the participants to compare measurements of different locations around their home. Their observations and this experience can help them to assess cause-and-effect relationships of environmental conditions (e.g. the effect of shading measures, green spaces) upon air temperature in the own neighbourhood to facilitate active participation in climate change adaptation.
2.2 Site selection criteria of the measurement network
The main reasons for choosing the study area in southern Pune were a densely populated residential area with heterogeneous societal groups to facilitate citizen participation, variation of different surface types driving variations in air temperature in terms of radiation fluxes, latent heat fluxes and ventilation, access to the community, access to key societal multiplies closeness such as schools, and proximity to Bharati Vidyapeeth University (BVU) to facilitate synergies between research and education. The selected 16 ha study area outlined in Fig. 2 reflects these different requirements. The study area is a mainly sealed, dense residential district characterized by mostly regular building structures along the main roads and irregularly arranged single buildings in the backyards. Partially unsealed areas can be found in the north-western part of the study area where an urban park with meadow is located, as well as in the eastern part of the study area where a university campus with scattered development of freestanding bigger institute buildings and student hostels as well as lots of large trees is located.
A key concept for the selection of the individual station sites within the study area is to enable paired comparisons of measurements at different locations maximizing the impact of one particular factor. To observe the full heterogeneity of the microclimate within the urban study area and to capture extreme conditions, contrasting locations have been preselected. Therefore, the following requirements were sought for the test area based on this logic of process drivers: natural character (green spaces like urban parks as “natural” point of reference or greened streets) versus dense development areas without any vegetation (latent heat flux versus sensible heat flux); open areas and street canyons versus inner courtyards (open ventilation versus blocked ventilation); north exposure versus south exposure (low radiative input versus high radiative input); and access to schools, parishes and/or universities as societal multipliers. Thus, the microclimatic measurement network was designed to continuously measure the local climate character of the streets, backyards and open areas; to identify the variability of the local microclimate based on the street, development and building type character, ventilation through the open areas, and vegetation and greening; and to facilitate citizen participation due to low-cost weather sensors, allowing for a future extension of this network. At least one NETATMO station was located in each described space unit. For example, station PU05 represents the open unsealed green park area with several sport fields in the north-west. Station PU06 and PU07 represent a wider street with mainly five-story buildings. While station PU07 is located close to several trees, station PU06 has no vegetation in close proximity. Station PU03 is a station in a narrow street canyon with limited ventilation. Scattered development with plenty of ventilation and open green areas can be found around station PU01 within the BVU campus area in the east.
Table 1Classified categories of sensor locations for the outdoor 47 modules of the 12 NETATMO stations within the study area (A/Z represents regular temperature–humidity modules, R represents rainfall sensors and W represents wind sensors). Classes: open space (O), street side (R) divided into fully ventilated street (f) and street with restricted ventilation (r), and unventilated inner courtyard or backstreet (B); mounted at a facade or balcony (F) and mounted away from facades (A); vegetation within 10 m distance (V), no vegetation within 10 m distance (L); mounting height above ground level – < 3 m (I), 3 to < 6 m (II), 6 to < 9 m (III) and 9 to < 24 m (IV); sun exposure of the sensor when facade-mounted – north (N), west (W), south (S) and east (E).
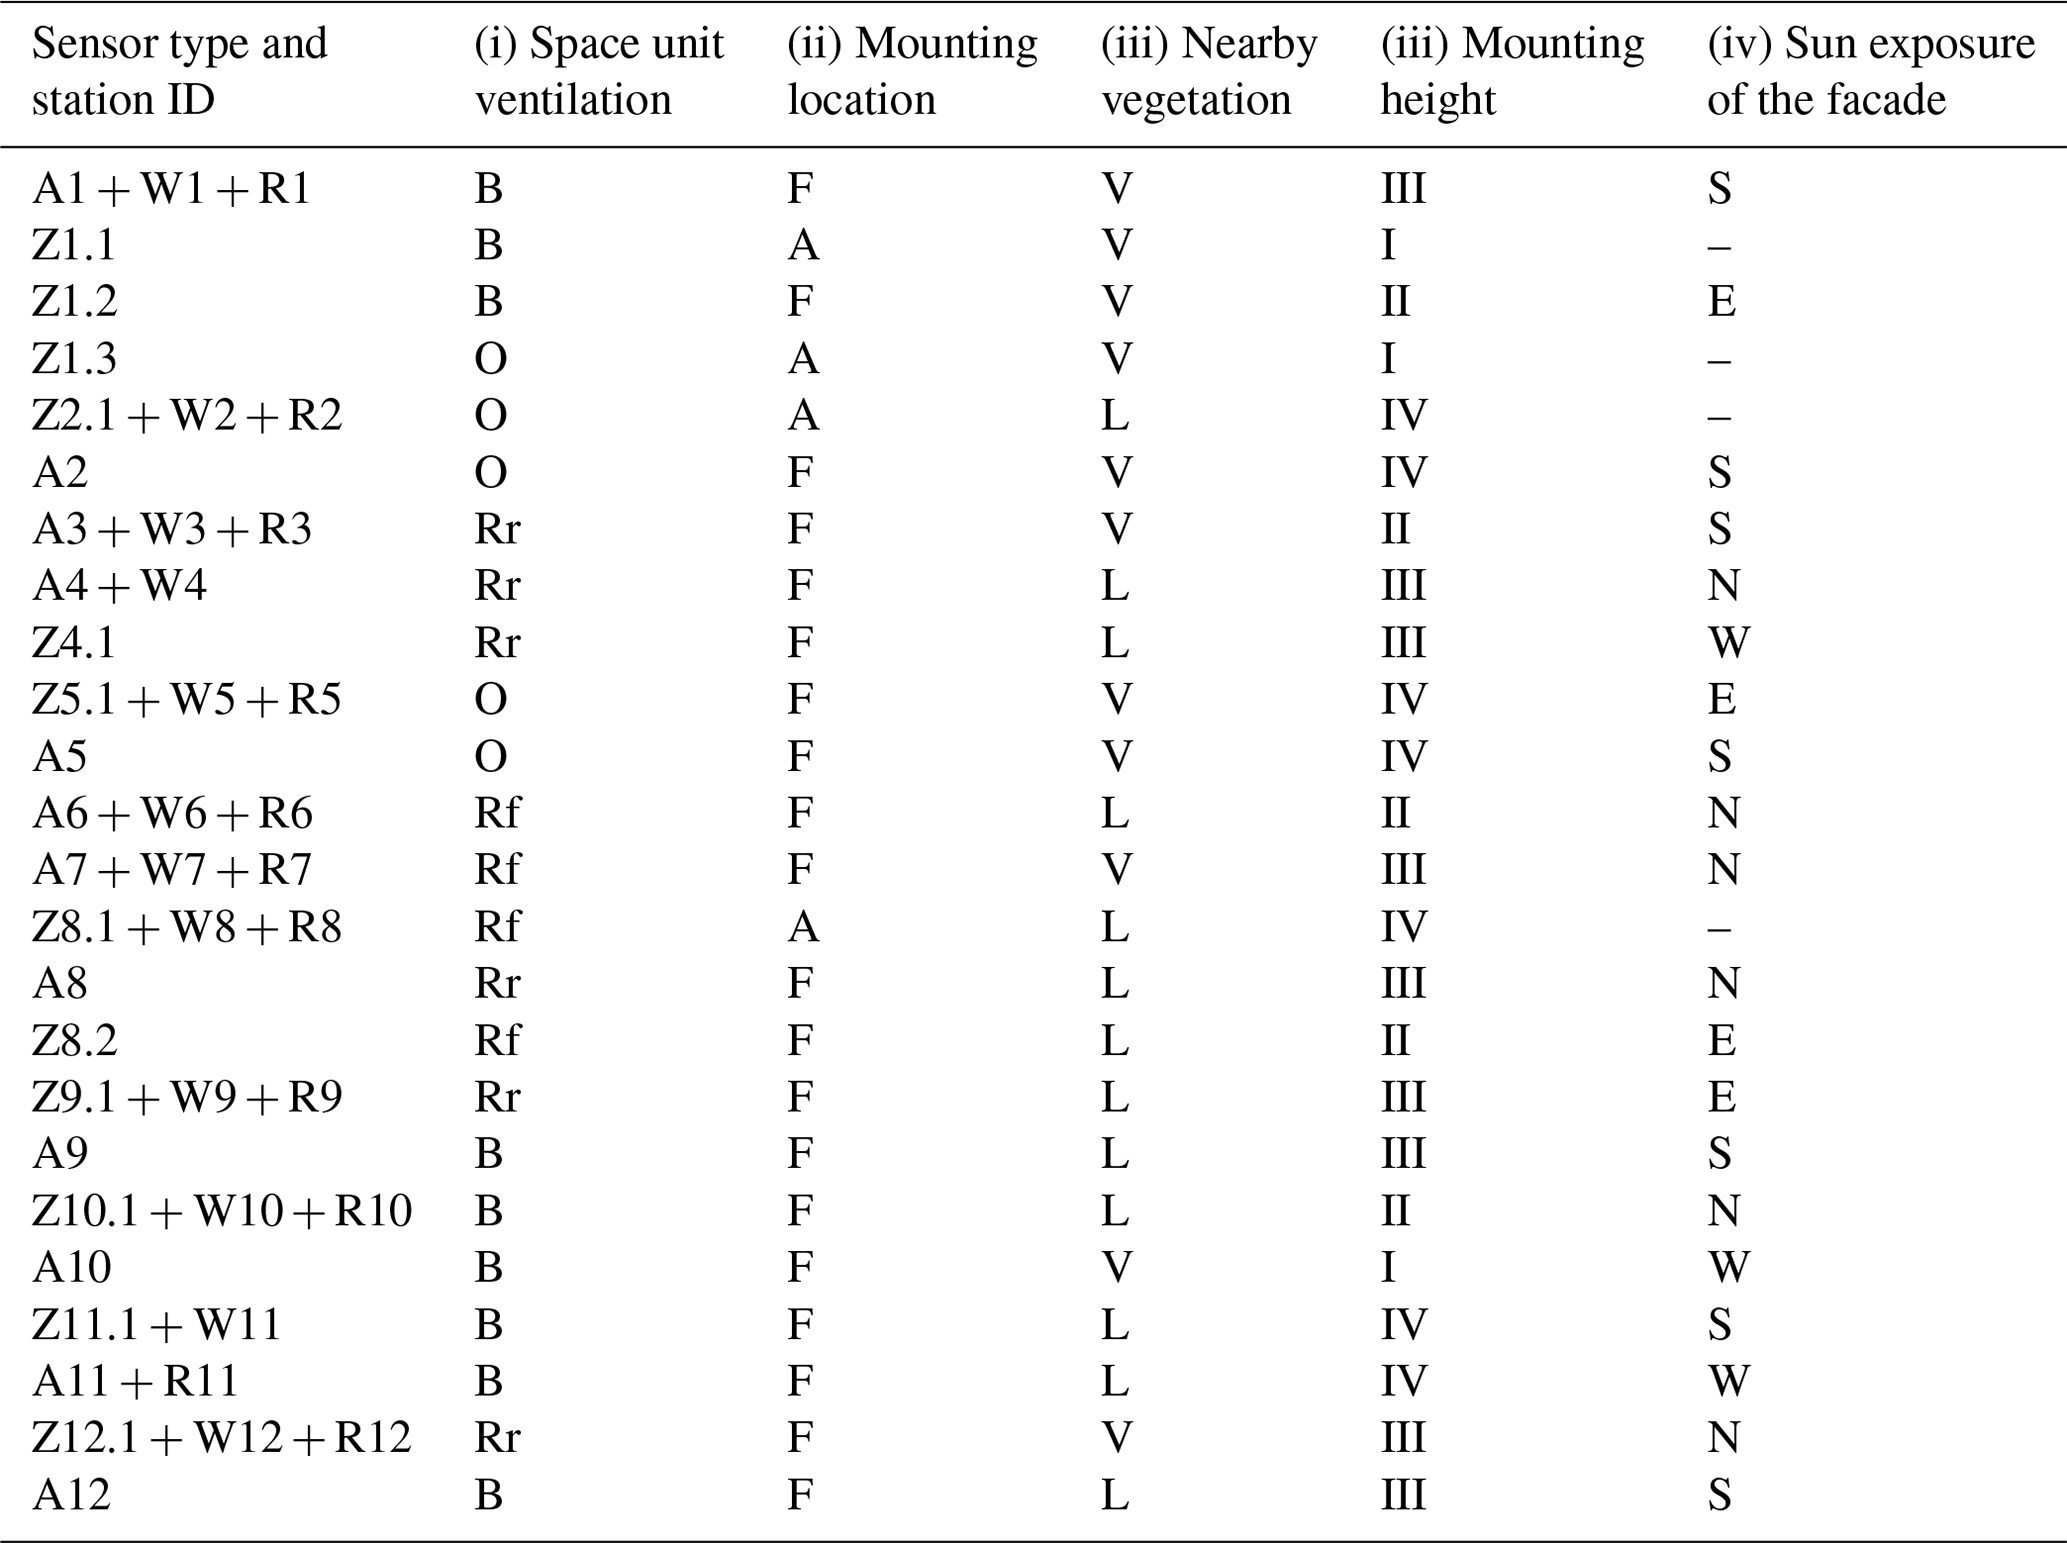
The exact positions of the installed sensors were classified into the following categories: (i) space unit character – open space (O), street side (R) divided into fully ventilated street (f) and street with restricted ventilation (r) and unventilated inner courtyard or backstreet (B); (ii) character of the mounting location – mounted at a facade or balcony (F) or mounted away from facades like a site in an open space (e.g. garden, parking lot, rooftop terrace) (A); (iii) nearby vegetation – vegetation within 10 m distance (V) and no vegetation within 10 m distance (L); (iv) mounting height above ground level (classes I – < 3 m, class II – 3 to < 6 m, class III – 6 to < 9 m, class IV – 9 to < 24 m); and (v) sun exposure of the sensor when facade-mounted – north (N), west (W), south (S) and east (E) orientation of the facade. The assignment of each sensor to a category was done during an on-site visit in March 2023 (see Table 1).
2.3 Integration of stakeholders in the sensor network establishment
To analyse differences in participation of the stakeholders, the weather stations are installed at private places as well as in the schools Bharati Vidyapeeth English Medium High School (station PU02) and BVU Institute of Environment Education and Research (station PU01). Building a reliable cooperative environment and acknowledging the different interests of the participants are essential as the system utilizes private resources in terms of power supply and connection to the private Wi-Fi. Therefore, our citizen science approach is based on addressing existing networks and local multipliers (e.g. known individuals interested in local microclimatic research, school directors, parishes or NGOs). A useful way to address issues like microclimatic effects and climate change adaptation is to use formal and informal networks within the study area as reliable multipliers. Thus, the first step for establishing the network was to identify individuals and local institutions with a high contact range and reputation in the local communities or even a high number of members living in that area, and inform them about the general project goals. These can be either schools, universities or parishes as multipliers, but also settled companies or well-connected representatives. In a second step, these networks are used to detect and reach individuals living within the study area at suitable locations based on the above-mentioned criteria. Reliable network representatives arrange the first contacts to interested individuals and later also join the first meetings of the scientists with the citizens in their homes. A possible third step can be snowball effects if citizens already cooperating with us can initiate further contacts in their communities by promoting the project with their friends, neighbours or relatives close by who might be interested in their installed sensors. Thus, we envision participation of additional citizens based upon promotion of the project by the current participants. Participation types can range from sharing data and information to adding their own privately financed weather station as long as this station adheres to the installation and documentation standards.
In the specific case of the study area in Pune, India, local communities were mainly contacted in February and March 2023, primarily based on private acquaintances of employees of the BVU, Pune. Staff members of BVIEER, which are very well connected in the local communities of the study area, provided the first point of contact and could directly contact friends or relatives living nearby to explain the purpose of the measurement sensors. Recommendations in their social networks were also fundamental for reaching a wider audience. Students and retired staff members from BVIEER also had an important role as multipliers for providing contacts and gaining trust from the local communities. Also, other institutions like nearby institutes of BVU and the English Medium High School were involved. After contact was made by the intermediaries, and the pertinent information regarding especially the scope of the project, the use of the data and the opportunities for the participants was provided, the interested citizens declared their willingness to set up the NETATMO sensors. Scientists and translators made home visits to show them the measuring devices, explain the research project in an easy-to-understand way and show them their options for using the data on their own in the app. In this context, the optimal locations for the sensors on their houses/properties were examined and selected in agreement with the house owner. The NETATMO weather stations were finally installed by an expert scientist in their private spaces (front gardens, building facades/balconies and courtyards) at various heights above ground level. The sensors automatically store and synchronize the measured data in real time via the wireless internet connection of the citizens. All participating citizen scientists were engaged free of charge. They received an NETATMO account and data access in order to monitor their measurements in real time with the appropriate smartphone app. This app also provides background knowledge and information on the measurements as well as easily understandable data plots and statistics.
Overall, the network consists of 59 NETATMO sensors assigned to the 12 base stations, which were uniformly installed in the study area in this way according to our defined quality standards. The sensor locations cover all prior defined site categories and place characters to monitor the microclimatic differences within the urban study area (see Fig. 2). The measurement network has been operational since March 2023. While the initial setup was based upon research considerations and the sensor systems are provided by the researchers and funded through a DAAD grant, additional participants are welcome and invited to add their private NETATMO stations to the network by following the defined measurement standards. The establishment of the cooperative network and the installation of the sensor systems will be followed up by regular formal and informal meetings of the scientists with the participants. The citizen participants represent a wide range of societal groups from a lower education/income milieus to a higher education/income milieus. However, there is a dominance of participants with close ties to academia (e.g. school teachers and professors, university assistant employees, doctoral candidates, and students from BVU and other universities). Further central actors are, for example, IT company employees, civil engineers, junior school pupils and retired staff members. For many of these stakeholders, the entire families ranging from small children to grandparents and further degrees of relationship like their aunts and uncles are included and involved in this citizen science project. In total, at these 12 stations, 63 citizen scientists are currently directly or indirectly participating, using the measurement data for own observations and interacting in the cooperative network.
For all sensors in the study area, metadata on the exact locations and heights above ground level, distances to facades and vegetation, ground surface properties and albedo, and facade properties and albedo are documented. Also, measurement protocols are kept, for example, to document changes in the conditions around the sensors, which are also based on reports, photos, and exchange between the citizen scientists and the research scientists.
2.4 Analyses of measurement data and citizen activities
The measurements of the sensors are quality-flagged by the scientists and statistically analysed. Based on descriptive statistical parameters and pairwise comparisons, air temperature, relative humidity, and wind speed and wind direction differences between the measurement sites are identified. The time series also allow different daily cycles of these variables between the sensors to be investigated and thus different patterns to be evaluated between the above-mentioned site categories, which can directly be related to the appropriate process drivers and microclimate factors like effects related to street orientation, street character, facade character, or sun exposure of the building facades. Example time series for two opposite sensor sites are plotted and discussed for this paper.
To identify the interest of the stakeholders in the measurements, we are using app usage reports as an indirect indicator. The cumulative number of activities of the citizen scientists like opening the NETATMO weather app for their station, clicking on individual sensors and viewing current measurements from the sensors, taking on-demand measurements, viewing historical data by line plots, downloading data files, creating weather alarms or notifications, or following nearby stations in the study area is recorded and documented for the weather stations PU01 to PU12 based on the app reports for a 4-month period from March 2023 to June 2023. The level of interaction of the science team with the citizens was nearly the same in both study areas during that time period. In this way, it is possible to absolutely and relatively quantify the interest of the citizens in the measurement data over time. The activities are analysed in this paper by descriptive statistical parameters. To detect differences between the interest in this study area in comparison to Germany, the same activity quantifications and analyses are also performed for the 14 NETATMO stations with 58 sensors within the similar study area in Cologne. This allows for a comparison of the activity magnitudes and pattern between the Indian and German stakeholders in the two study areas.
Due to the quality control of the sensors and regular recalibration procedures in comparison to Rotronic and TFA high-accuracy reference sensors, a very good mean RMSE of 0.084 °C for air temperature and 1.40 % for relative air humidity was found, even after 6 months of installation, showing a high long-term consistency and stability of the measurement system. As the RMSE values are on the same level as for the sensors in Cologne, no significant differences in the sensor accuracy were observed between India and Germany (Eingrüber et al., 2022b). Thus, due to recalibrations every 6 months, the low-cost measurement network has a high precision comparable to research-grade systems. As all sensors are measuring on the same calibration basis and are referenced to each other, significant differences between microclimatic conditions of the various measurement sites in the study area can be identified, which can clearly be attributed to local small-scale climate factors. Thus, the sensors proved to reliably provide data with a high quality to observe microclimatic effects. This demonstrates that the network is suitable to monitor the heterogeneity of the urban microclimate within this study area and discloses temperature variations of several degrees over short distances like between streetside and inner courtyard locations or between different space units like unventilated street canyons, open areas or green infrastructures.
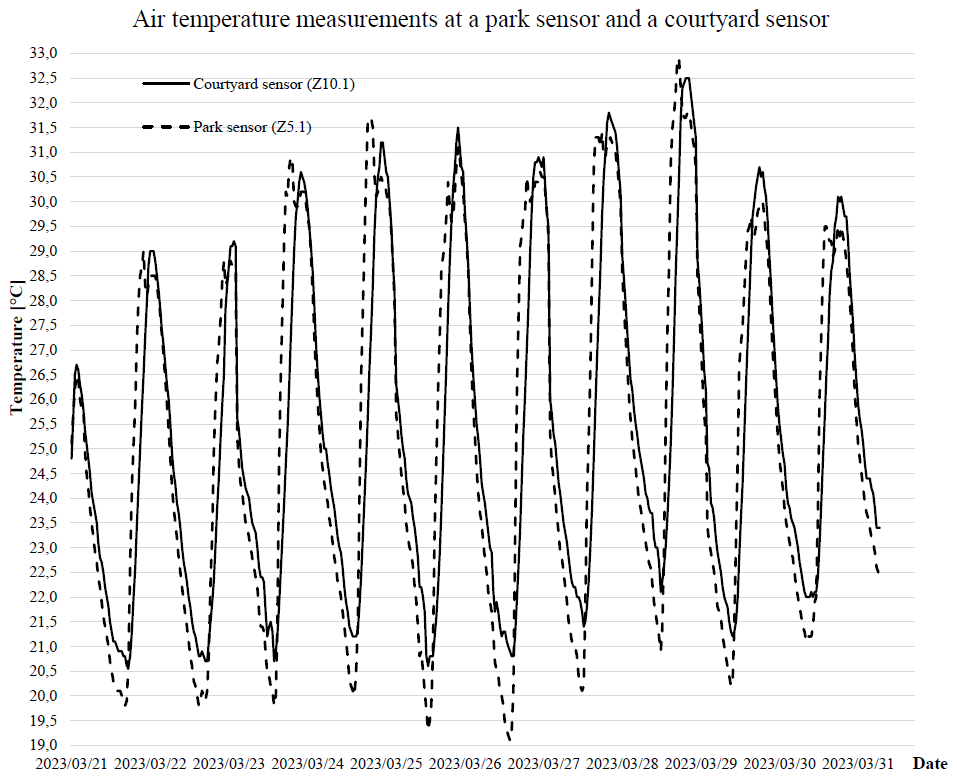
Figure 3Comparison of the measured air temperatures in Pune, India, at the NETATMO stations PU05 (sensor Z5.1: open park space, 14 m height above ground level, east-facing, facade-mounted) and PU10 (sensor Z10.1: inner courtyard with restricted ventilation, 4 m height above ground level, north-facing, facade-mounted) during a 11 d pre-monsoon season period.
Time series of air temperature measurements of two sensors at contrasting sites in terms of ventilation and greenery are presented and compared in Fig. 3 for an 11 d pre-monsoon hot season time period which represents a typical heat wave dominated by different wind directions so that the microclimatic differences between the sensors can be identified for different wind flow conditions. While the NETATMO sensor Z5.1 of station PU05 is located directly close to an open park area with meadow and several trees at 14 m height above ground level and east-facing to a building facade, the sensor Z10.1 of station PU10 is positioned within a narrow courtyard without greenery and with very restricted ventilation conditions at 4 m height above ground level and north-facing to a building facade. Significant temperature differences can be identified as well as different daily course patterns. While the park sensor is heating up much faster in the mornings due to the sun orientation of the facade, higher noon and afternoon air temperatures of up to +0.8 °C difference can be observed for the courtyard sensor. Furthermore, for 7 of the 11 d, the highest daily maximum air temperatures were identified for the courtyard sensor. In all nights, air temperatures are constantly cooler at the park sensor. This significant cooling effect of the greened area averages −1.1 °C and reaches up to −1.9 °C. This example clearly demonstrates that the measurement network enables a high spatial and temporal resolving monitoring of microclimatic differences in the study area and supports observing thermal effects of climate change adaptation measures like nature-based solutions.
In comparison to the similar German study area, we found that data transfer rates in Pune are significantly lower. While data gaps in time series in Cologne are very seldom (98 % transmission), Indian time series are regularly interrupted (46 % transmission). Gaps in Pune occur mainly due to recurring (prolonged) power shortages and on the other hand due to the fact that many Indian stakeholders do not have a permanent Wi-Fi router and perennially activate mobile hotspots of their smartphones to synchronize the measurement data of the weather station when on-site. As NETATMO weather stations can only save a limited number of measurement data for a period of around 4 d, longer absence from home or oblivion of hotspot activation can then sometimes lead to obvious data gaps in the time series. Current increasing trends of Wi-Fi router installations in India make clear that this connection problem will decrease in future. Further factors that have caused gaps in the time series were insect implantations in sensors or connectivity problems during the Indian monsoon season. The radio signal stability of the outdoor modules to the indoor modules was temporarily interrupted during the rainy season when sensor covers were fully wetted or water was flowing into the sensor cover or when heavy monsoon precipitation and high relative humidity reduced the overall radio signal conductivity of the air. Nevertheless, a transmission rate of 46 % still implies that a measurement is taken almost every 10 min on average for all 12 stations which represents an extensive high-resolution data set.
Table 2Cumulative number of activities of the citizen scientists at the 12 weather stations PU01 to PU12 in the urban study area of Pune, India, quantified by the NETATMO weather app usage reports for a 4-month period from March 2023 to June 2023.
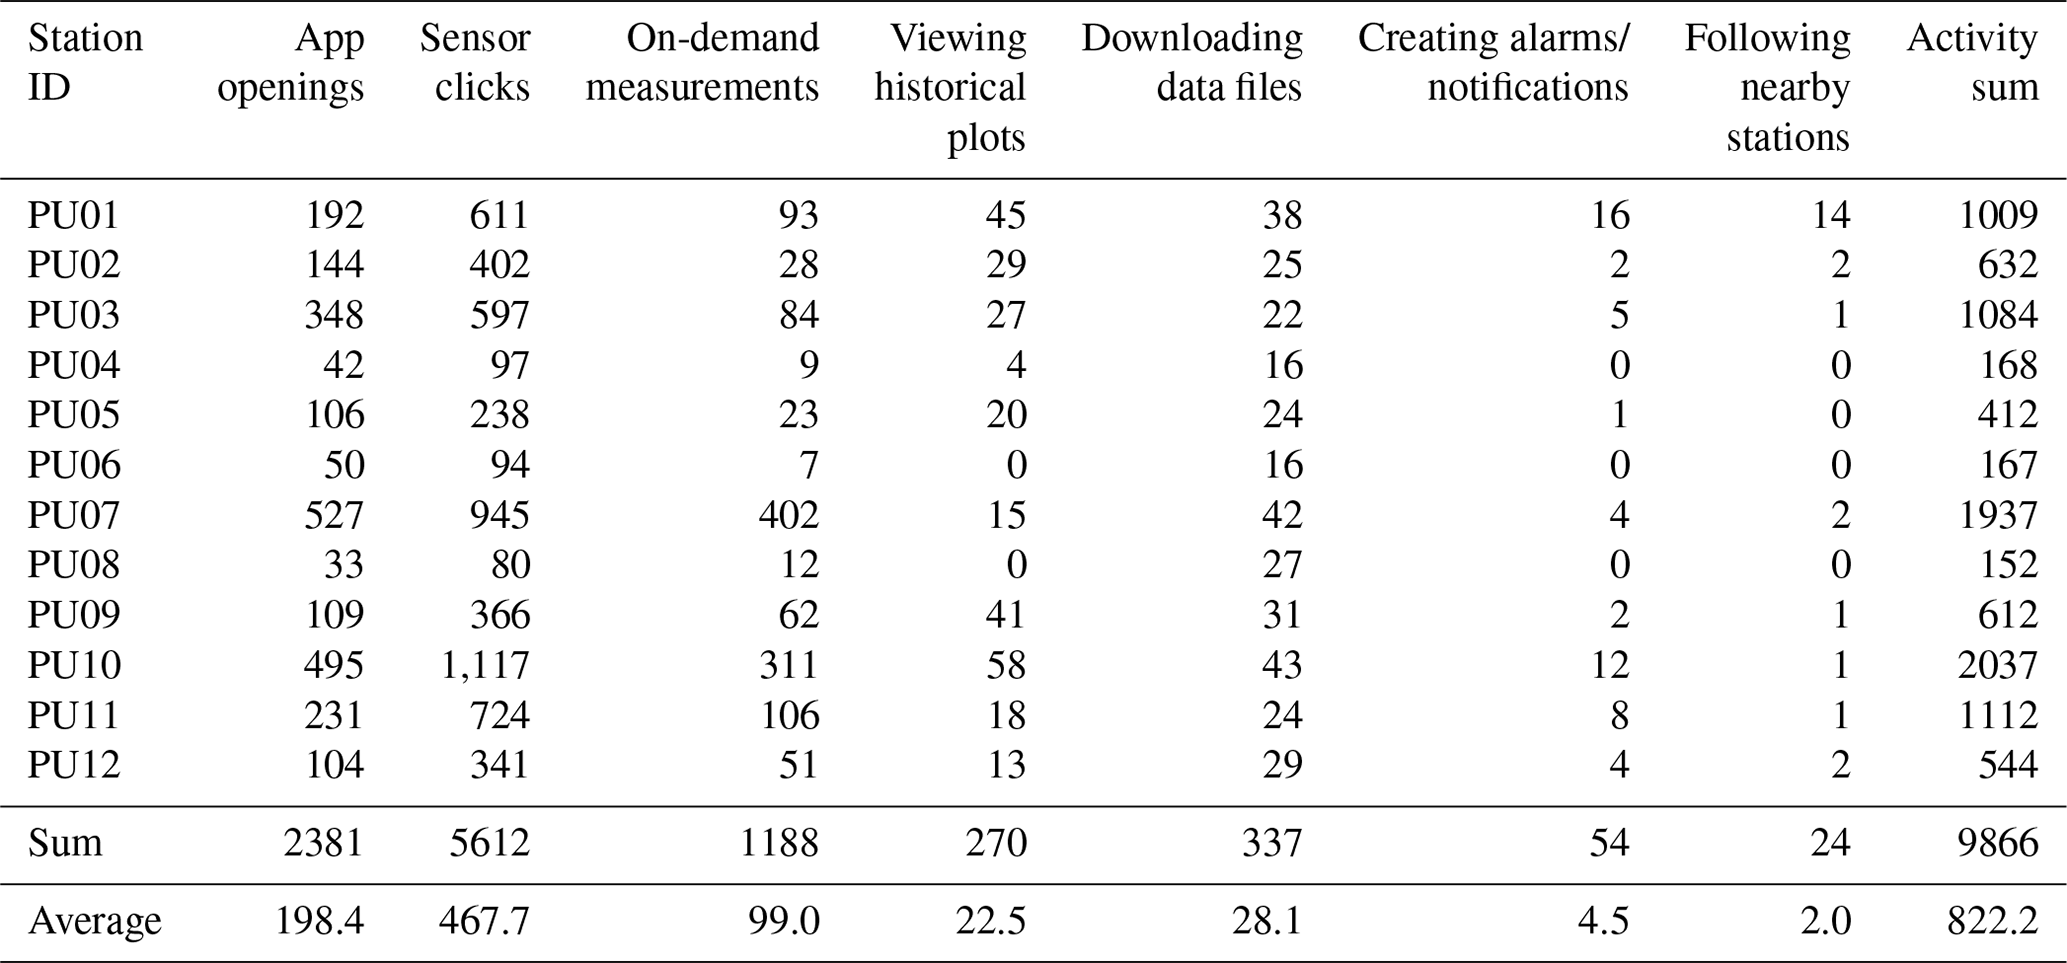
Table 3Cumulative number of activities of the citizen scientists at the 13 weather stations in the urban study area of Cologne, Germany, quantified by the NETATMO weather app usage reports for a 4-month period from March 2023 to June 2023.
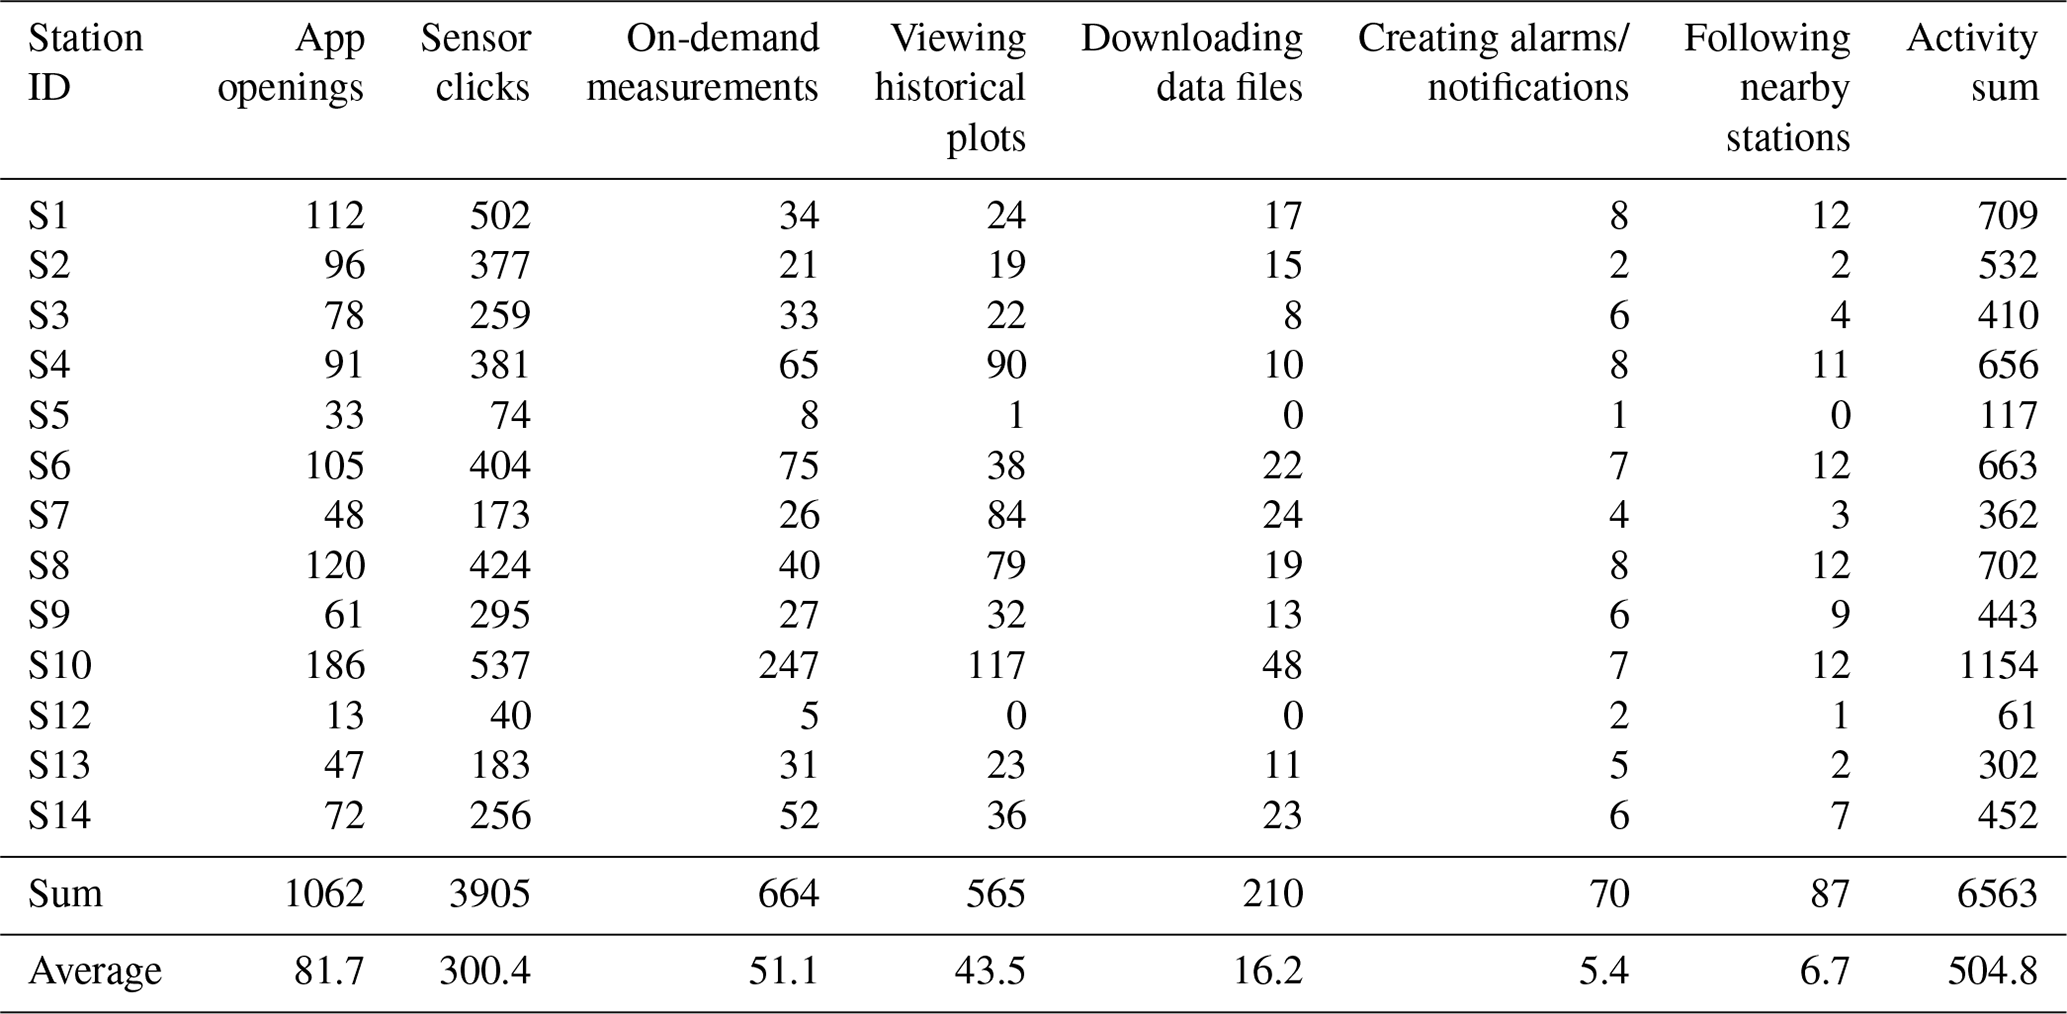
The fact that these measurement data are also intensively used by the participating citizen scientists becomes particularly clear from the app usage evaluations. In Table 2, the cumulative number of activities of the citizen scientists at the weather stations PU01 to PU12 in the urban study area is quantified based on the NETATMO weather app reports for a 4-month period from March to June 2023. Although there is a high variability between the different stations in the number of activities like app openings, sensor clicks, individual on-demand measurements, viewing historical data line plots, downloading data CSV files, creating weather alarms or notifications, or following other nearby stations of this measurement network, a very high activity level could be found in general, with 2381 app openings, 5612 sensor clicks and 1188 on-demand measurements. In a direct comparison between the German and Indian study areas, it becomes clear that Indian citizen scientists are significantly more active than the citizen scientists within the similar study area in Cologne. The cumulative number of activities of the German citizen scientists at the 13 NETATMO stations was detected exactly in the same way using the app usage for the same 4-month period from March 2023 to June 2023 (see Table 3). While high numbers of 9866 app activities in total have been detected in Pune, which corresponds to around 822.2 activities per base station on average, only 6563 app activities in total and an arithmetic mean of 504.8 activities per station were observed for Cologne. The relation of around 38 % lower app activities in Cologne clearly shows that there is an even higher interest of the involved Indian citizens in the topic of climate change adaptation and heat mitigation in their living environment. Although there are higher numbers of app openings, sensor clicks and followings in India, some more advanced activities like viewing historical data or creating individual notifications were conducted more frequently by German stakeholders. Within the given short time frame of about 1 year after installation of the sensor network in Pune, no significant trend or relationship between length of time and number of activities was found. Nonetheless, seasonal variability, fluctuations and pattern were observed, showing a higher interest in the measurements during the hot seasons. Overall, the high number of activities in Pune demonstrates that Indian citizen scientists are continuously using the weather app and the measurement data for own observations and comparisons.
This own perception of the microclimate conditions can be a central basis for local communities and individuals to take action and may increase the willingness to act and to implement climate change adaptation strategies in the future. This may be either precautionary adaptation of personal behaviour to reduce heat stress like warnings, the reduction of exposure during the hottest periods, staying in shaded areas or rooms, reducing metabolism, strategic room ventilation and window openings, and drinking but also the personal direct implementation of adaptation measures in their private environment ranging from nature-based solutions like facade greening, roof greening, surface unsealing or trees to technical solutions like high albedo ground and building surfaces; insulation and building materials with low heat storage capacity and thermal conductivity; photovoltaics (PV) for air conditioning or water pumping for misting or wet roofs; or awnings, shutters and sun sails as shading measures. An indirect adaptation pathway may also be an increase in the willingness to pay for climate change adaptation measures implemented by the city department in their nearby public street canyons or urban squares like street trees or other green and blue infrastructures in the form of a corresponding tax or levy.
As a spin-off of the activation and participation approaches using the citizen weather sensors, the engaged community of the involved stakeholders in Pune also organizes itself and exchanges thoughts and observations intensively with each other. Their self-motivated organization shows high dynamics. For example, in a highly active messenger app group (called “Sensor Community Pune”), 22 citizens are already communicating regularly with each other about the measuring network, the data, and their experiences and observations. The scientists are also in intensive exchange with the citizen scientists via social media as well as by organizing information events together with the citizen scientists. Interested and involved participants also meet regularly at BVIEER for current updates on the research project as well as for posing questions on urban microclimate in general and getting in touch with each other more intensively. Another way of communication of scientists in Germany with the citizens in Pune is remotely via video conference meetings like an information presentation streamed for the pupils and teachers of the cooperating English Medium High School in Pune in autumn 2023, where we provided information about the sensors and our current research activities in an easily understandable language. Furthermore, at BVIEER, several urban microclimate excursions for interested students have been conducted and recorded in this study area. German students could also participate in the excursion using augmented reality software to interact with the Indian students and the stakeholders on-site in Pune. The recorded resources are also used as part of an international interdisciplinary teaching collaboration between the University of Cologne in Germany; IISc in Bangalore, India; and BVU in Pune, India, as part of the INGENIoS project (“Indo-German Network Interaction of Scientists”). The measurements of the sensor network are also used for bachelor and master theses and university teaching classes on urban climatology and microclimatological modelling as part of the IDEaL teaching platform (“International Digital Education and Learning” platform) in which students from several research institutions all over the world and from different environmental study programmes like the IMES (“International Master of Environmental Sciences”) learn and work together with the data from this study area.
As a scientific outlook, this quality-controlled data set could be used by researchers for advanced investigations to analyse climate change adaptation potentials. Due to the fact that our analyses showed the suitability of this measurement network to identify the local microclimate character and differences between the sites in this urban study area, the data could serve as a reference for physically based microclimate models for the simulation of effects of hypothetical climate change adaptation measures and pathways (Dang and Pitts, 2020). Even if those measurements do not fulfil the scientific requirements for meteorological forcing data to drive a microclimate model and do not record all relevant variables like direct and diffuse solar radiation or cloud cover, the quality-controlled NETATMO data could be used to drive and initialize microclimate models in data-scarce regions where hardly any other forcing data or remote sensing data are available using a one-dimensional modelling approach for forced/closed lateral boundary conditions. Due to the densely distributed character of this sensor network and the arrangement of the measurement sites according to different process driver categories and conditions like various heights, this holistic data set enables an intensive model calibration and output validation of high-resolution 3D gridded microclimate models like ENVI-met (Eingrüber et al., 2023b). Therefore, the marked study area within the red border of Fig. 1 will be represented as an ENVI-met model domain in further research, and the measurements of the sensor network will be used to evaluate how reliable and accurate the model can reproduce the actual measured time series of the different sensors. The scientific benefit of the described sensor network design for validation purposes of urban microclimate models like ENVI-met is only given if high-resolution input data for model parameterizations are available. Spatial input data sets, for example, on geometric structures of buildings and surface properties like albedo are required at least on a 1 m scale to represent the model physics and the relevant processes at that microscale for a meaningful intercomparison of the model outputs with the sensor measurements. With a validated model, scenario analyses of various adaptation pathways and options like facade/roof greening or shading measures to assess their heat mitigation potentials can then be performed at a spatial scale that is relevant to local decision-makers. Modelling can for example show the potentials of balancing technical solutions like solar-powered air conditioning systems and nature-based solutions like green or blue infrastructures in the urban design.
From a citizen science perspective, a questionnaire survey is planned in ongoing research to identify the (change in) willingness of citizens in Pune to act and pay for climate change adaptation measures as a consequence of the participation in our activities. After some years of measurements, changes and trends in app activities can be investigated and compared between the two study areas. Results can also be compared to similar investigations in other cities of different climate zones. As there is a fast-growing increase in installed crowed-sourced sensors (mainly NETATMO) worldwide, the presented approach of a quality-controlled, standardized and documented sensor network can enable a future expansion of this existing measurement network or further similar networks under scientific standards. In contrast to measurement networks following the WMO guidance to represent the general urban canopy layer conditions of urban neighbourhoods and thus serving the needs of a collective of citizens, our presented standardized sensor network setup primarily and directly serves the needs of individual citizen scientists rather than the collective as the measurements are only valid for specific locations. If several individuals implement climate change adaptation measures in their living environment and even serve as incentives for imitators, thus starting snowball effects, the heat mitigation potential of adaptation measures implemented by many individuals can serve the collective of entire neighbourhoods. In the same way, the collective can benefit if scientists use the data for modelling analyses to support decision-making in future urban planning. Thus, the presented citizen science sensor network design in this paper can be an add-on to more general sensor networks following the WMO guidance. To expand such quality-controlled networks beyond local networks of communities or to initiate new such sensor networks in other regions and countries worldwide going beyond the direct intervention and resources of scientists, our defined quality-control requirements (like the standardized criteria of site selection, mounting, installation, radiation protection, metadata documentation and long-term measurement condition control) can also be implemented by interested citizen scientists themselves without the direct contact to scientists. This could be realized by providing these standards and criteria in a user-friendly and freely available citizen science protocol for standardized guidance and documentation. This protocolized guidance could be implemented, for example, in a smartphone app with corresponding instructions and metadata documentation to be submitted and selected in a global database or directly in integrated apps like the NETATMO weather app or other frequently used citizen science apps.
As successful climate change adaptation requires extensive further research as well as citizen activation using knowledge acquisition and hands-on experience by their own measurements and observations, this approach can support in terms of both taking action as individuals and decision-making as urban planners. Only the combination of empiricism and science can facilitate compliance and action as a basis for the implementation of climate change adaptation measures in the context of transformation and management to design adapted and climate resilient cities, mitigate future heat stress and improve thermal comfort in urban areas.
With regard to scarcity of urban climate data for microclimatological investigations in Indian cities which are increasingly affected by climate change impacts like extreme heat events, a densely distributed measurement network of 59 quality-controlled meteorological low-cost sensors was set up in a 16 ha urban study area in Pune, India, in February 2023 for continuous long-term data collection with a very high spatial and temporal resolution. A standardized measurement system of NETATMO low-cost weather sensors was chosen. As the measurement system is quality-controlled and regularly recalibrated, showing a high consistency and very low RMSE values compared to high-precision reference sensors in the laboratory, and the sensors are mounted by an expert, the system is suitable for scientific applications. The measurement sites were selected according to scientific process-based criteria to identify microclimatic different and contrasting conditions within the urban study area. The setup of the measurement network was realized in private spaces using a citizen science approach to involve, engage and activate local communities.
This paper showed that significant microclimatic differences between the measurement sites can be identified with this sensor network, which can be explained by different site conditions and clearly be attributed to small-scale climatological process drivers. Thus, the urban microclimate of the study area can realistically be differentiated with the developed measurement network, which is a proof of concept demonstrating the suitability of this approach. Evaluations of the NETATMO app usage reports showed that the involved stakeholders are highly interested and active in using and monitoring the measurement data in their own living environment. In total, 9866 app activities of the participating citizens were counted during a 4-month period, which demonstrates that activating residents through their own conducted measurements is a promising approach for participation in climate change adaptation. This enables them to identify environmental issues and adaptation potentials in their own neighbourhoods and strengthens community building of citizen scientists. In this way, the choice of these low-cost sensors for citizen science applications can facilitate science-based identification of the effects of suitable climate change adaptation strategies and measures that may be implemented by the citizens in future.
Overall, we can conclude that the quality-controlled, regularly recalibrated and standardized mounted measurement system of the NETATMO low-cost sensors is well suited for microclimatic modelling applications as well as citizen activation and participation. Due to trust-building social contacts, networks and partners, a densely distributed monitoring network of 59 sensors in total was successfully established in our 16 ha urban study in Pune, India, based on previously defined scientific site categories with process drivers as criteria to represent the heterogeneity of microclimatic conditions within that area. This developed measurement network allows significant differences to be identified in air temperature, relative humidity, and wind speed and wind direction between the measurement sites with a high spatial and temporal resolution in the long term. The citizen scientists are highly interested and active in using the corresponding weather app to monitor their local measurement data and inform themselves about microclimatic effects, which reveals the high potential of citizen activation and participation in climate change adaptation. Furthermore, the developed sensor network enables a future expansion under scientific standards, and this valuable long-term microclimatic data set can be used by scientists for further research, for example, as an input data for urban microclimate models or as a reference for validating microclimate model simulation outputs. However, the measurements of the described sensor network design are only suitable for a causal validation of urban microclimate models like ENVI-met if high-resolution input data for model parameterizations (e.g. geometric structures of buildings and vegetation and surface properties like albedo) are available to precisely represent the relevant physical processes at that microscale.
Technically, the low-cost sensor measurement system has a good accuracy and usability but with lower data transmission rates/higher gaps in Pune, India, than in Cologne, Germany. Scientifically, microclimatic effects and differences can be identified with the setup measurement network in Pune in the same way as in Cologne. Socially, these weather stations facilitate and strengthen citizen activation and participation and forms of (self-)organization but with higher interest in Pune (indicated by app activities) than in Cologne and also more self-activated community building in India in relation to individual interests and single participation of German stakeholders without any kind of self-organization. Transformatively, this approach has a high potential for establishing science-based self-help measures for local communities confronted by climate change impacts.
Data and metadata are currently not publicly available and will be published at a later state of the research.
NE set up the sensor network on-site in Pune. KS and WK supported the implementation of the measurement concept. NE performed the sensor recalibrations and data analyses, as well as preparing the manuscript draft. WK, KS and UL participated in writing and supervising the work. All read and accepted the manuscript for submission.
The contact author has declared that none of the authors has any competing interests.
Publisher's note: Copernicus Publications remains neutral with regard to jurisdictional claims made in the text, published maps, institutional affiliations, or any other geographical representation in this paper. While Copernicus Publications makes every effort to include appropriate place names, the final responsibility lies with the authors.
We would like to thank all citizen scientists and local cooperation partners within the study area who made it possible to carry out our measurements in private spaces. Further thanks go to our student assistants Alina Sophie Domm and Charlotte Krekeler, who supported in the sensor location visualization, as well as to Shamita Kumar and her scientific assistants and the staff members, driver, technicians and janitors of BVIEER (BVU, Pune) for their support during the sensor installation phase. We acknowledge support from the DAAD-funded projects “INGENIoS” and “A new passage to India”. We acknowledge financial support for the article processing charges from the DFG (German Research Foundation, grant no. 491454339).
This research has been supported by the DFG – German Research Foundation (grant no. 491454339).
This open-access publication was funded by Universität zu Köln.
This paper was edited by Thomas Fröhlich and reviewed by two anonymous referees.
Banerjee, R. and Maharaj, R: Heat, infant mortality, and adaptation: Evidence from India, J. Dev. Econ., 143, 102378, https://doi.org/10.1016/j.jdeveco.2019.102378, 2020.
Callaghan, C. T., Rowley, J. J., Cornwell, W. K., Poore, A. G., and Major, R. E.: Improving big citizen science data: Moving beyond haphazard sampling, PLoS Biology, 17, e3000357, https://doi.org/10.1371/journal.pbio.3000357, 2019.
Dang, H. T. and Pitts, A.: Urban morphology and outdoor microclimate around the “Shophouse” dwellings in Ho Chi Minh City, Vietnam, Buildings, 10, 40, https://doi.org/10.3390/buildings10030040, 2020.
Eingrüber, N. and Korres, W.: Climate change simulation and trend analysis of extreme precipitation and floods in the mesoscale Rur catchment in western Germany until 2099 using Statistical Downscaling Model (SDSM) and the Soil & Water Assessment Tool (SWAT model), Sci. Total Environ., 838, 155775, https://doi.org/10.1016/j.scitotenv.2022.155775, 2022.
Eingrüber, N., Korres, W., and Schneider, K.: Microclimatic field measurements to support microclimatological modelling with ENVI-met for an urban study area in Cologne, Adv. Sci. Res., 19, 81–90, https://doi.org/10.5194/asr-19-81-2022, 2022a.
Eingrüber, N., Schneider, K., Korres, W., and Löhnert, U.: Sensitivity analyses and validation of an ENVI-met microclimate model for a greened urban study area in Cologne Südstadt under various typical weather conditions, EMS Annual Meeting 2022, Bonn, Germany, 5–9 September 2022, EMS2022-42, https://doi.org/10.5194/ems2022-42, 2022b.
Eingrüber, N., Schneider, K., and Korres, W.: Evaluation of microclimatic variations and adaptation effects in a central European city during the most excessive heat wave in summer 2022 by ENVI-met modelling, EGU General Assembly 2023, Vienna, Austria, 24–28 April 2023, EGU23-11806, https://doi.org/10.5194/egusphere-egu23-11806, 2023a.
Eingrüber, N., Korres, W., Löhnert, U., and Schneider, K.: Investigation of the ENVI-met model sensitivity to different wind direction forcing data in a heterogeneous urban environment, Adv. Sci. Res., 20, 65–71, https://doi.org/10.5194/asr-20-65-2023, 2023b.
Eingrüber, N., Krekeler, C., Korres, W., Löhnert, U., and Schneider, K.: High-Resolution Microclimate Modelling to Evaluate Urban Heat Mitigation Potentials of Rainfed Climate Change Adaptation Measures on Buildings under Various Climatic Conditions, AGU Fall Meeting 2023, San Francisco, CA, USA, 11–15 December 2023, H23V-1850, https://doi.org/10.22541/essoar.171052572.20758573/v1, 2023c.
Eingrüber, N., Korres, W., and Schneider, K.: Comparison of heat mitigation effects of blue roofs and green roofs on building wall temperature and thermal outdoor comfort based on scenario analyses using 3D microclimate modelling for a dense urban district, EGU General Assembly 2024, Vienna, Austria, 14–19 April 2024, EGU24-9967, https://doi.org/10.5194/egusphere-egu24-9967, 2024a.
Eingrüber, N., Berg, P., Korres, W., Löhnert, U., and Schneider, K: Parameterization and Validation of a High-Resolution Microclimate Model to Identify Temperature Patterns in a Climate Change Adapted Urban High-Density Area, SSRN, 4912045, https://doi.org/10.2139/ssrn.4912045, 2024b.
Eingrüber, N., Domm, A., Korres, W., and Schneider, K.: Simulation of the heat mitigation potential of unsealing measures in cities by parameterizing grass grid pavers for urban microclimate modelling with ENVI-met (V5), Geosci. Model Dev., 18, 141–160, https://doi.org/10.5194/gmd-18-141-2025, 2025.
Fenner, D., Bechtel, B., Demuzere, M., Kittner, J., and Meier, F.: CrowdQC+ – a quality-control for crowdsourced air-temperature observations enabling world-wide urban climate applications, Front. Environ. Sci., 9, 720747, https://doi.org/10.3389/fenvs.2021.720747, 2021.
Jha, R., Mondal, A., Devanand, A., Roxy, M. K., and Ghosh, S.: Limited influence of irrigation on pre-monsoon heat stress in the Indo-Gangetic Plain, Nat. Commun., 13, 4275, https://doi.org/10.1038/s41467-022-31962-5, 2022.
Karrevula, N. R., Ramu, D. A., Nageswararao, M. M., and Rao, A. S.: Inter-annual variability of pre-monsoon surface air temperatures over India using the North American Multi-Model Ensemble models during the global warming era, Theor. Appl. Climatol., 151, 133–151, https://doi.org/10.1007/s00704-022-04269-0, 2023.
Khan, A. S., Ramachandran, A., and Palanivelu, K.: Urban Climate Change Adaptation Framework for Chennai City, India, Handbook of Climate Change Management: Research, Leadership, Transformation, edited by: Leal Filho, W., Luetz, J., and Ayal, D., Cham Springer International, 1–23, https://doi.org/10.1007/978-3-030-22759-3_32-1, 2020.
Núñez-Peiró, M., Khosla, R., McCulloch, M., and Lizana, J.: Citizen data for global mapping of atmospheric urban heat islands, Research Square [preprint], https://doi.org/10.21203/rs.3.rs-2924752/v1, 9 June 2023.
Phillips, T. B., Ballard, H. L., Lewenstein, B. V., and Bonney, R.: Engagement in science through citizen science: Moving beyond data collection, Sci. Educ., 103, 665–690, https://doi.org/10.1002/sce.21501, 2019.
Singh, S., Mall, R. K., and Singh, N.: Changing spatio-temporal trends of heat wave and severe heat wave events over India: An emerging health hazard, Int. J. Climatol., 41, E1831–E1845, https://doi.org/10.1002/joc.6814, 2021.
WMO: Guide to Instruments and Methods of Observation, Volume III – Observing Systems, Chap. 9 Urban Systems, WMO-No. 8, ISBN 978-92-63-10008-5, 2023a.
WMO: Guidance on Measuring, Modelling and Monitoring the Canopy Layer Urban Heat Island (CL-UHI), Chap. 5, WMO-No. 1292, ISBN 978-92-63-11292-2, 2023b.