the Creative Commons Attribution 4.0 License.
the Creative Commons Attribution 4.0 License.
 | 08 Aug 2025
Investigating the variation of thermal conductivity with temperature to improve a portable gas chromatography (GC) system's specificity
Murielle Jurdit
Jean-François Bêche
Emilie Lefrançois
Florence Ricoul
Alexandre Teulle
Jean-Baptiste Tissot
In the context of field thermal conductivity detector (TCD)-based gas chromatography (GC), we investigate a method to improve the system's specificity. The ratio of signals of two TCDs biased at two different voltages is calculated, allowing us to be independent of the analyte concentration and to exploit the fact that the thermal conductivity of any gaseous species varies uniquely with temperature. However, theoretical predictions as well as experiments indicate that this method helps peak identification only if the local analyte concentrations are far (2 to 3 orders of magnitude) beyond the typical concentrations encountered by portable trace analyzers.
- Article
(2262 KB) - Full-text XML
- BibTeX
- EndNote


Gas chromatography (GC) is a popular separation technique that can really benefit from miniaturization: reduced footprint, shorter analysis time, smaller volume of a carrier gas, and lower power consumption (Wardencki and Witkiewicz, 2021; Zampolli et al., 2020). Portable instruments have a wide variety of on-field applications like air quality monitoring (Garg et al., 2015; Leidinger et al., 2016), chemical warfare agent analysis (Manginell et al., 2011; Qualley et al., 2020), exhaled breath measurement (Lee et al., 2016; Zhou et al., 2019), space exploration (Szopa et al., 2017). As stated in the comprehensive reviews of Crucello et al. (2022), Regmi and Agah (2018), or Haghighi et al. (2015), the term “portable GC” encompasses a large range of commercially available or laboratory-made instruments, with very different sizes. Alternatively, µ-GC systems can be defined as a particular branch of portable instruments that comprises at least one micro–electro–mechanical system (MEMS)-based component. The µ-component can address the injection step (µ-pre-concentrator, Yeom, 2015; Chappuis et al., 2018), the separation step (micro-column, Wang et al., 2014; Hsieh and Kim, 2016) or the detection step (metal oxide semiconductor sensors (MOS) (Baur et al., 2018); photoionization detectors (PIDs) (Narayanan et al., 2014); thermal conductivity detectors (TCDs) (Cruz et al., 2007; Rastrello et al., 2012; Bourlon et al., 2017); Mach–Zender interferometers (MZIs) (Hirschauer et al., 2025, etc.).
Typical separation columns for µ-GC systems are 1 to 10 m long (Crucello et al., 2022), which increases the risk of co-elution or makes it difficult to unambiguously identify a peak in a time window where two possible compounds can elute. In this paper, we consider the case of a µ-GC–TCD system, and we investigate whether there is a possible strategy for increasing the system's specificity and improving peak identification by exploiting the variation of thermal conductivity with temperature, as has been successfully demonstrated for carbon dioxide (CO2) quantification in air (Bourlon et al., 2018).
A TCD is a universal detector whose operation is based upon Fourier's law and implies a change in the heat loss of a heated element in the presence of a gas (Gardner et al., 2023; Rastrello et al., 2012). In our case, the sensing elements are suspended heaters manufactured using MEMS technology (Bourlon et al., 2018) in a traditional straight structure (Wang et al., 2022).
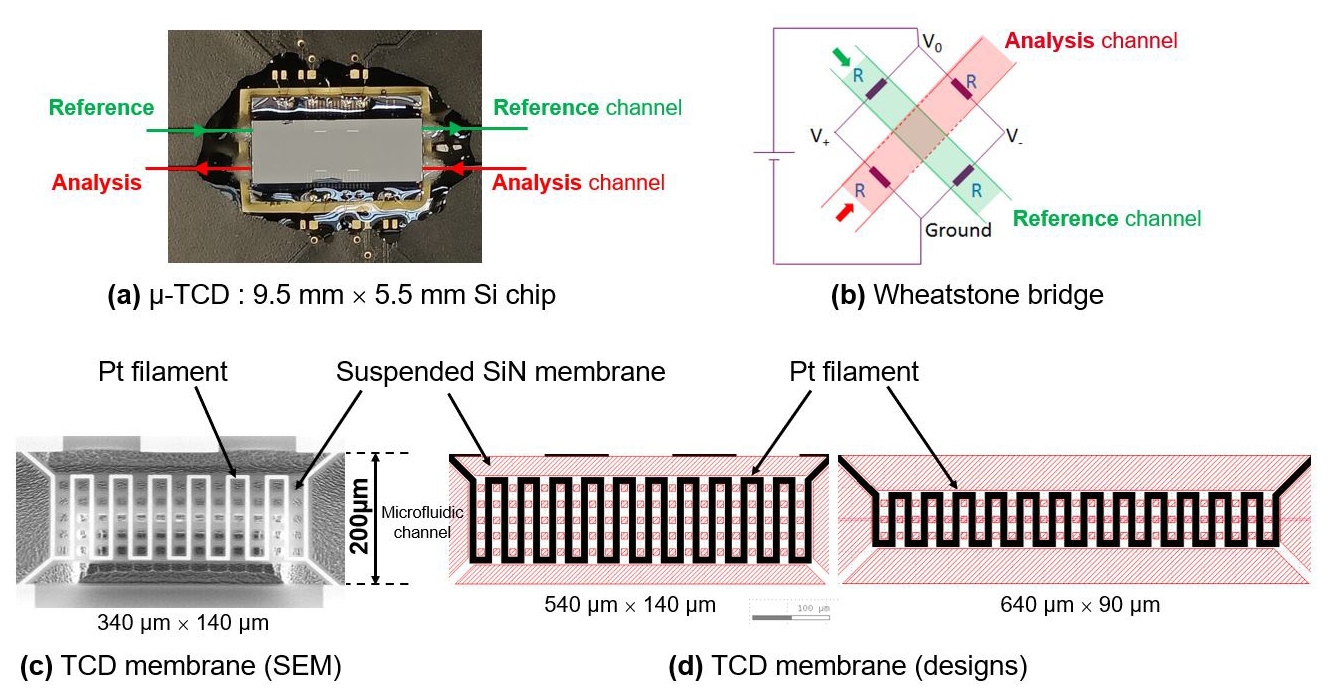
Figure 1(a) Photograph of our MEMS µ-TCD chip containing four membranes, wire-bonded to a printed circuit board (PCB). (b) Wheatstone bridge mounting of the four membranes. Zoomed pictures of a single TCD filament: (c) scanning electron microscopy (SEM) picture of a 340 µm × 140 µm (shorter) filament. (d) Computer-assisted design (CAD) pictures of a 540 µm × 140 µm (intermediate) or 640 µm × 90 µm (longer) filament.
Even with a carrier gas flow (forced convection), the predominant phenomenon is diffusion through the surrounding gas due to the dimensions of this µ-component, while conduction via the substrate is minimized by design (suspended platinum (Pt) filaments on silicon nitride (SixNy) membranes). The working principle relies on the emergence of a thermal imbalance between filaments located in a reference channel (where the pure carrier gas is circulating, helium (He) in our case) and filaments located in the analytical channel (where the column effluent is circulating). The DC electrically heated Pt filaments (with a typical bias of 3 to 15 V) reach an equilibrium temperature in steady-state analysis. When an analyte elutes, the thermal conductivity is reduced, causing the filament to heat up, which in turn increases its resistance (typical resistances are 400 to 600 Ω, according to the design; Pt temperature coefficient of resistance TCR ∼ 0.0019 K−1).
The resistance increase is sensed by a Wheatstone bridge circuit, which produces a measurable voltage change (see Fig. 1).
The thermal conductivity (λ) of a gas usually increases with temperature, as illustrated in Fig. 2 for common gases.
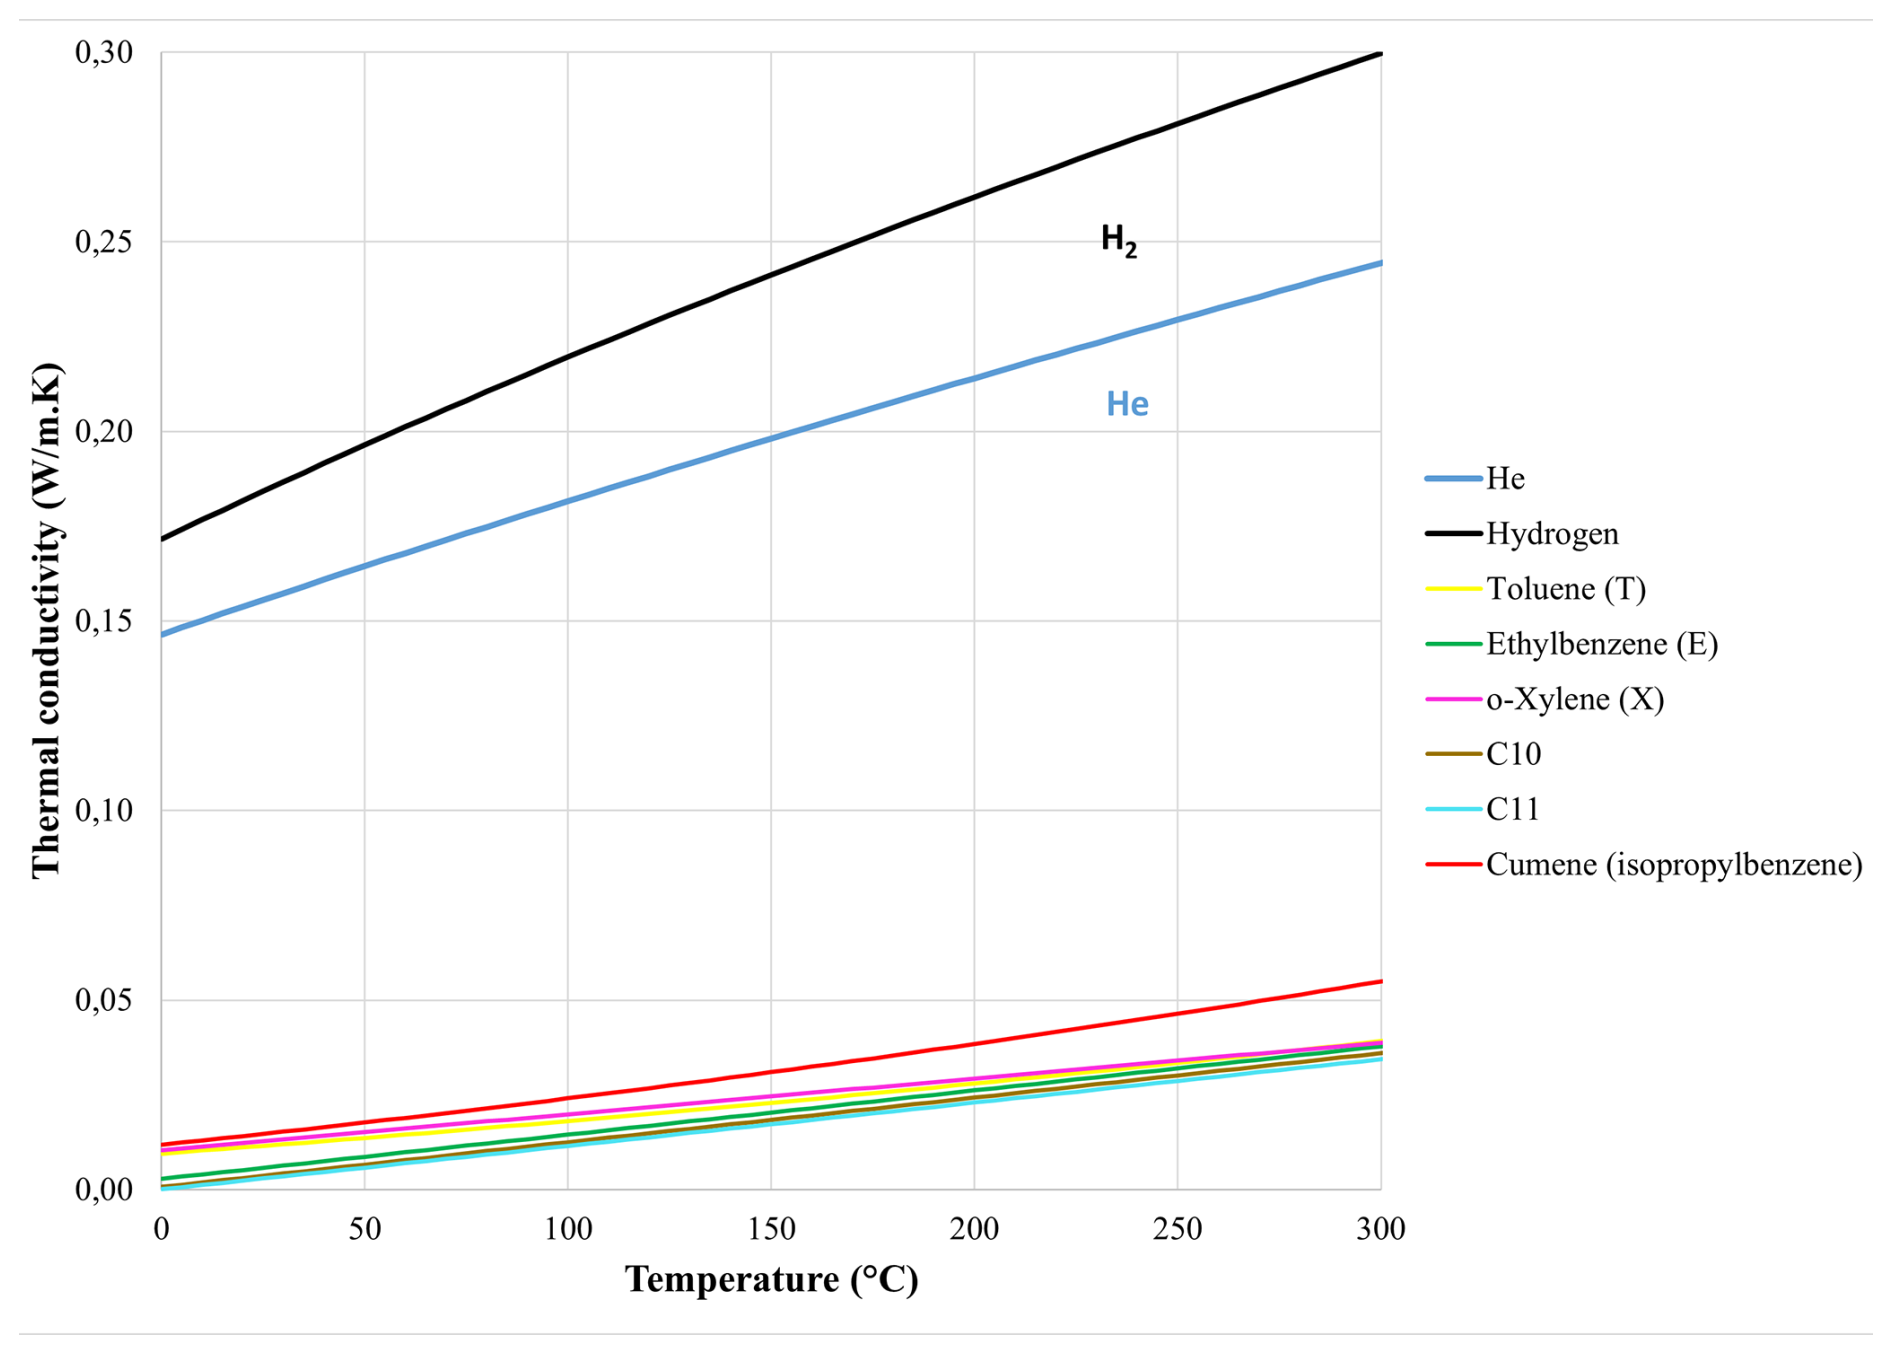
Figure 2Thermal conductivity of various gaseous species (helium, hydrogen, toluene, ethylbenzene, o-xylene, decane, undecane, and cumene) as a function of temperature (adapted from Le Neindre, 1998).
Figure 2 highlights that He and hydrogen (H2) have a very high thermal conductivity compared to any other gases; therefore, they are a preferred choice as a carrier gas in GC–TCD, bringing contrast. The graph also shows that every gas has a unique λ(T) law, a property that we suggest exploiting to possibly add some specificity by interrogating the TCD sensor at two different temperatures. This approach is investigated both theoretically and experimentally in the following sections.
When a compound elutes from a chromatography column, we can assume that the peak is a binary mixture of a majority carrier gas (He) and a small concentration n of analyte A (relative molar concentration). If the analyte concentration is very small in He, then the thermal conductivity of the mixture can be approximated by the linear combination of the individual thermal conductivities λA and λHe (Poling et al., 2001). Consecutively, the Wheatstone bridge signal S will be proportional to the analyte relative molar concentration n and the thermal conductivity difference between the analyte and carrier gas, as expressed in Eq. (1):
Since the analyte concentration is unknown when the peak elutes, we suggest eliminating this term by taking the ratio of two TCD signals S2 and S1, as expressed in Eq. (2). This is achievable either by using two TCDs connected in series and biased at two different voltages (voltage V1, with filaments reaching an equilibrium temperature T1, and voltage V2, reaching a temperature T2) or by using a single TCD successively examined at the two different voltages V1 and V2:
The theoretical calculations were performed for a typical TCD membrane (540 µm × 140 µm geometry; see Fig. 1d) biased at 6 and 15 V and for the following compounds: toluene (T), ethylbenzene (E), o-xylene (X), pentane (C5H12, denoted C5), decane (C10H22, denoted C10), cumene (C9H12), and undecane (C11H24, denoted C11). The ratios of these TCD membranes appear to be very close, with at most only a ∼1 % difference between all of the compounds (see Table 1).
To determine whether such small differences can be detected by our µ-GC–TCD system, we need to introduce the experimental noise, which we extract from the experiment as ±5 µV (typical noise (3σ) for our portable µ-GC–TCD components, measured in a ∼30 s flat area without any peaks; see Fig. 5 in the experimental part).
When the analyte concentration is important around TCD filaments, the TCD signals are high and the experimental noise appears negligible. Therefore, the ratio will be measured precisely and will be close to the theoretical value. However, when the analyte's relative local concentration is lower, the experimental noise will introduce uncertainty into the ratio, with values possibly lying anywhere between the dotted lines (see Fig. 3).
Table 1Theoretical calculations of ratios for a 540 µm × 140 µm TCD membrane biased at V1=6 V and V2=15 V for a number of compounds of interest (T, E, X, C5, C10, C11, and cumene).
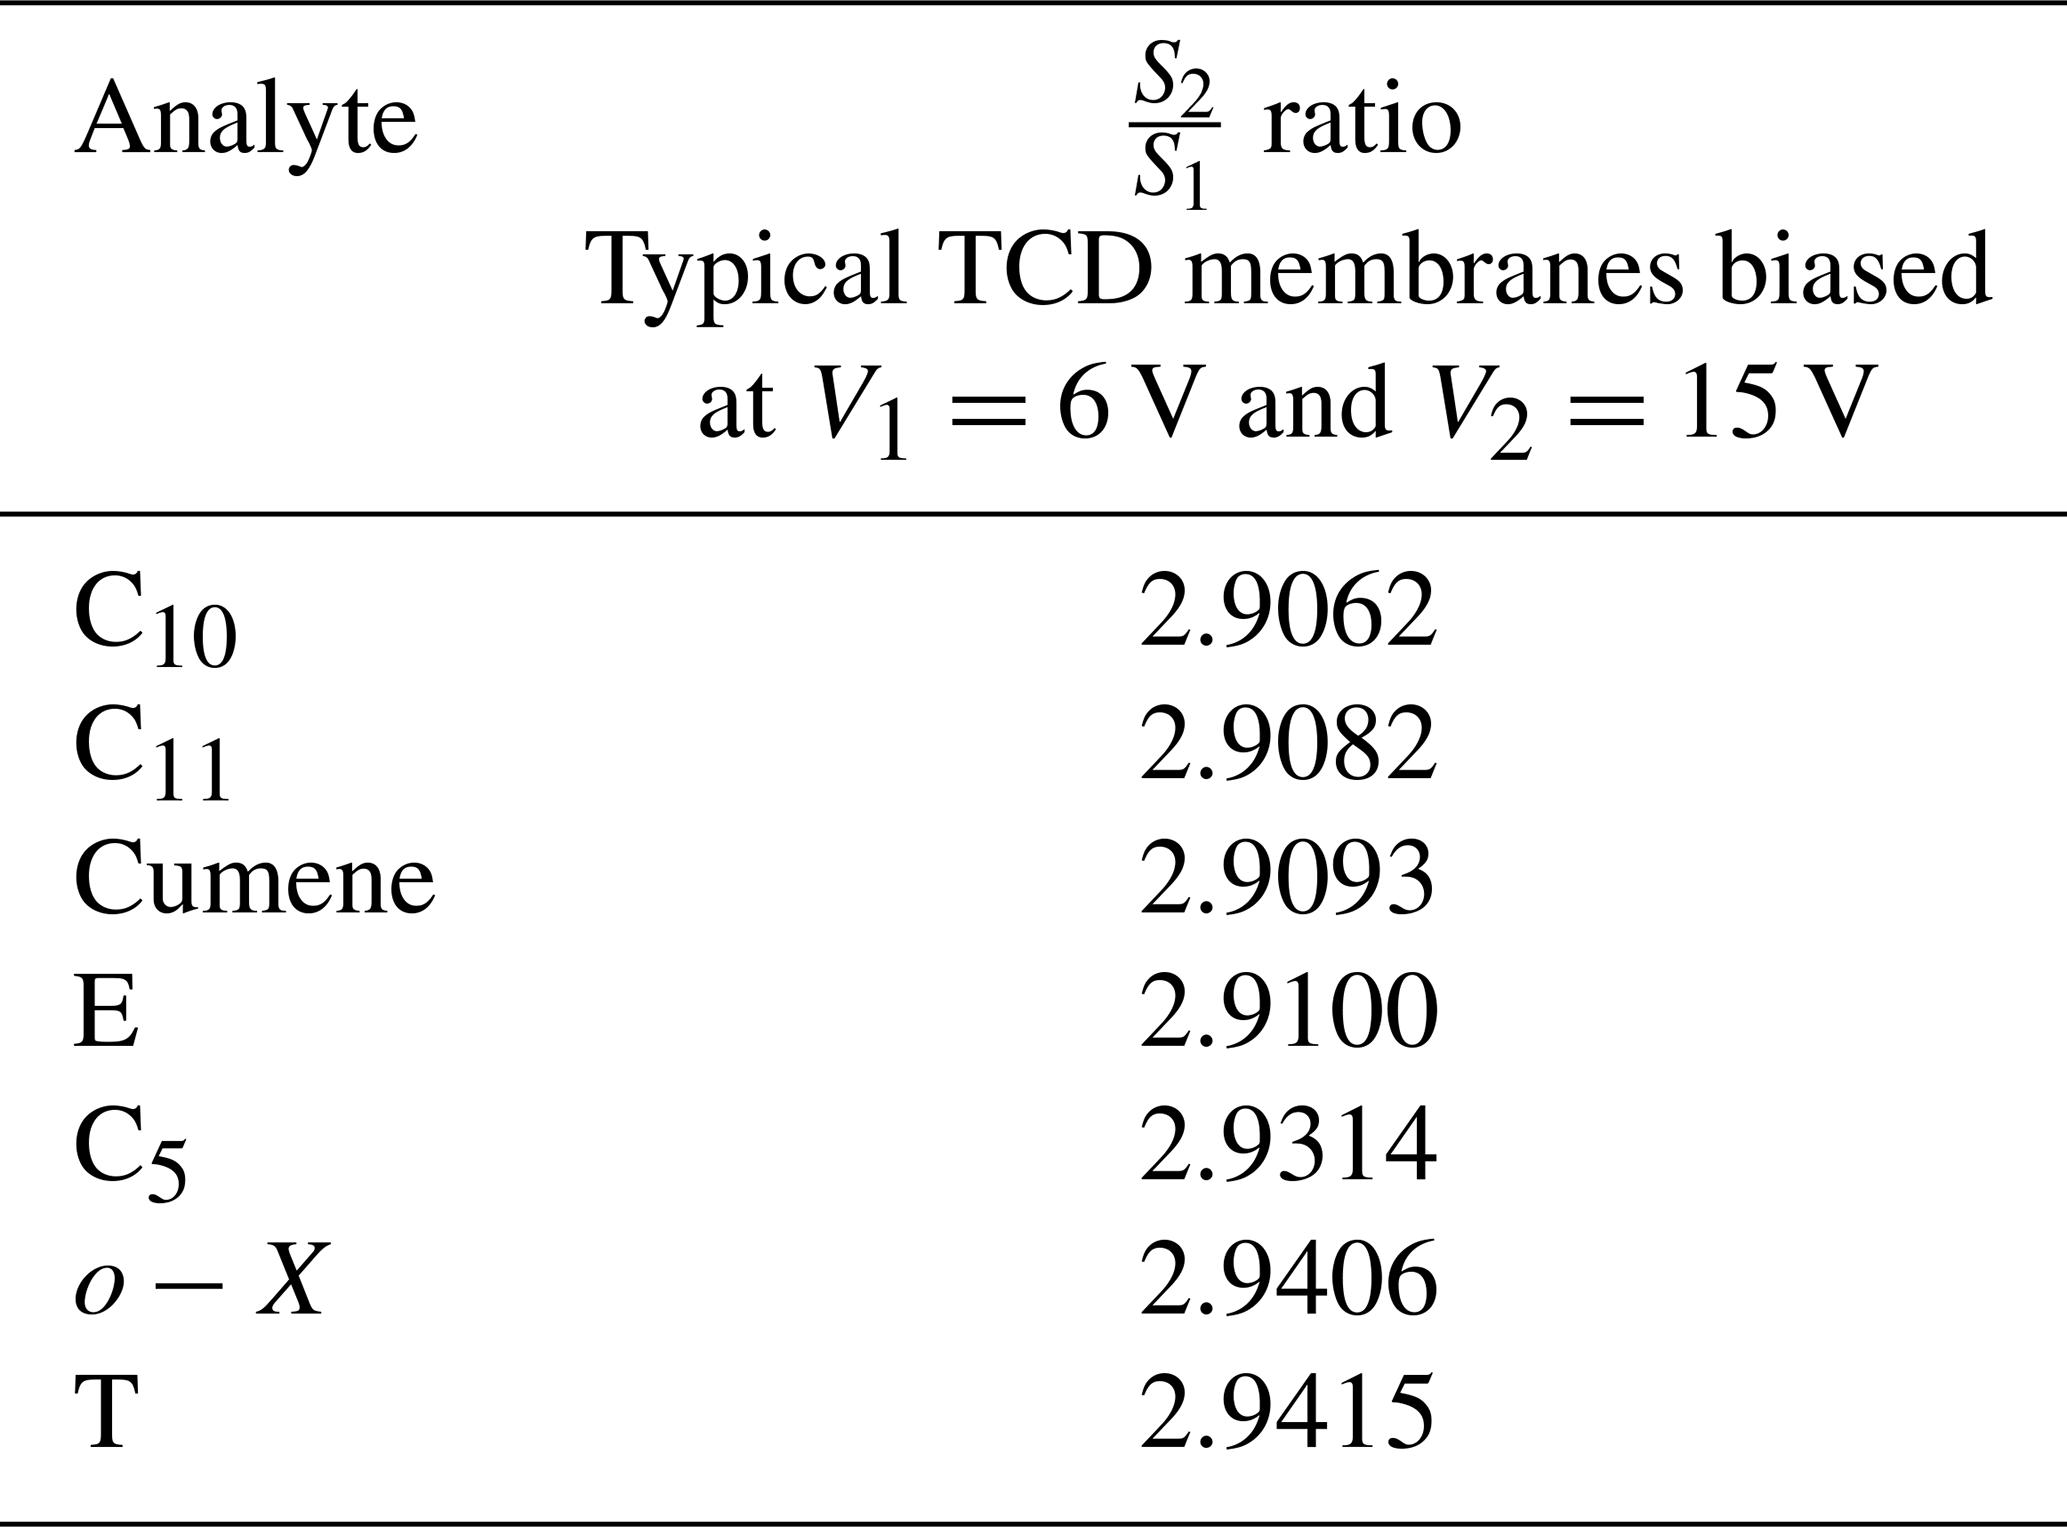
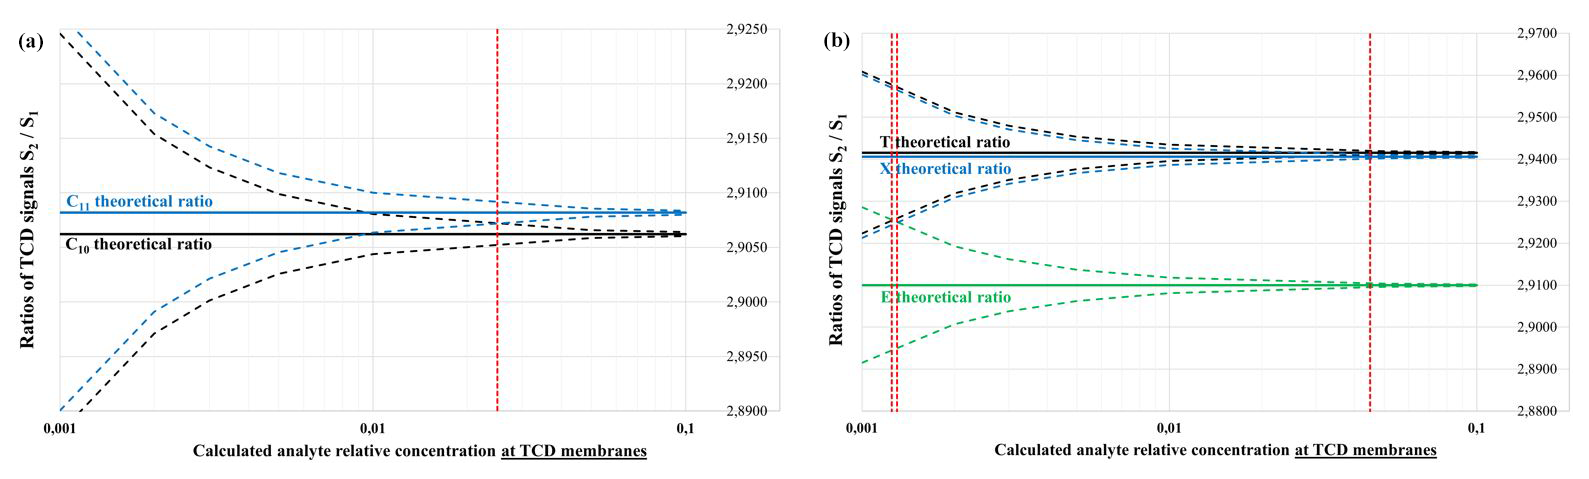
Figure 3Theoretical calculations for the ratio versus analyte concentrations (concentration relative to He, locally around TCD filaments), with a ±5 µV measurement noise: the case of C10 (black) and C11 (blue) compounds (a) and the case of T (black), E (green), and X (blue) compounds (b).
Clusters of curves will only stop overlapping when the analyte local relative concentration exceeds a certain threshold (red vertical bars). Consequently, the compounds will be unambiguously discriminated with this ratio method: this happens around 2 % vol. relative local concentration around the TCD membranes in the case of C10–C11 distinction, around 4 %,vol. in the case of T–X distinction, or around 0.1 % vol. for T–E or X–E distinctions. Unfortunately, these local concentration values (0.1 % vol.–5 % vol.) are at least 2 orders of magnitude too high to be interesting for a trace analysis portable GC system: indeed, we aim to work close to the limit of detection of the TCD sensor (a few tens parts per million (ppm) volume, i.e., ∼0.001 % vol., in the vicinity of TCD membranes), corresponding to an air sample concentration of a few tens parts per billion (ppb) volume before the pre-concentrator enrichment (of a typical factor ∼1000).
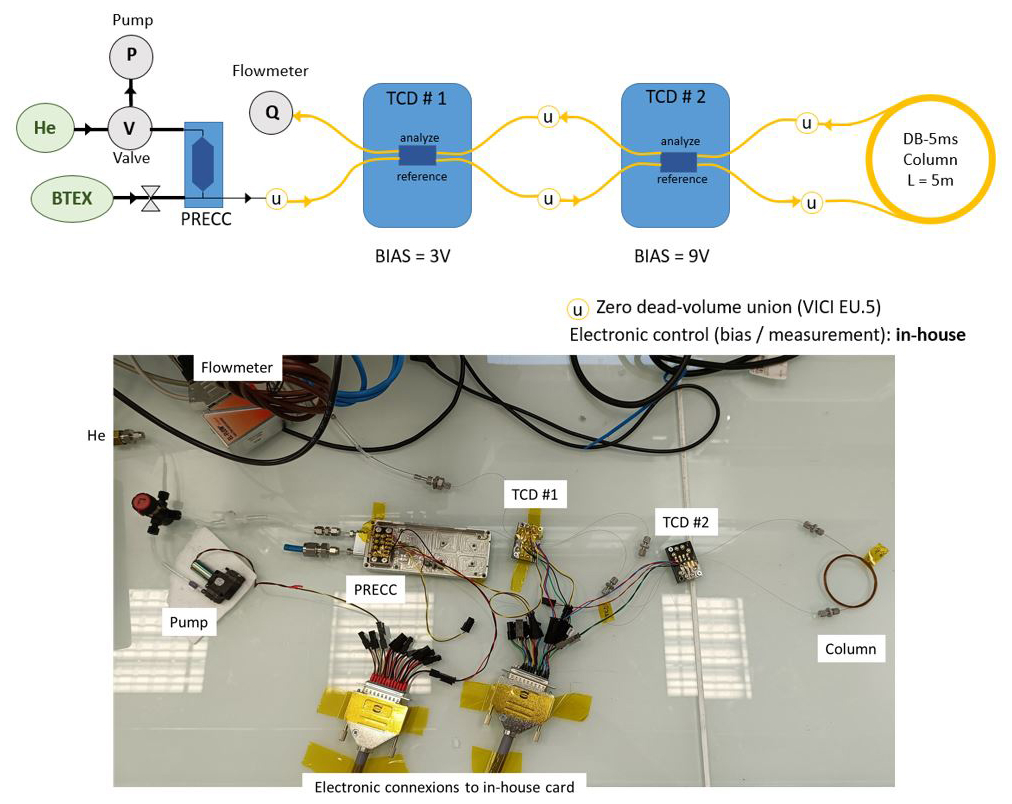
We prepared an experimental validation of the predicted calculations using an exploded setup of a µ-GC–TCD system with a µ-pre-concentrator, a short-separation capillary column, and two µ-TCDs in series, as shown in Fig. 4. The MEMS components were micro-fabricated in our 200 mm clean-room facilities. The µ-pre-concentrator is a 7.7 mm × 21 mm silicon chip with a 400 µm deep central cavity etched by DRIE (deep reactive ion etching), sealed to a Pyrex glass by anodic bonding, and including on its back side a Ti–Pt thin-film heater as well as thermo-resistive probes deposited by sputtering. The µ-TCD is a 5.9 mm × 9.5 mm silicon chip with four Pt filaments suspended on 300 nm thick silicon nitride membranes located in 200 µm deep micro-channels etched by DRIE.
In this table-top arrangement, the column is not heated. Therefore, only light molecules are tested. A TEX mixture (10 ppm vol. or 500 ppb vol. in N2) prepared in a 1 L Tedlar® bag (Supelco, 24633) was sampled 15 or 60 s for 10 ppm vol. and 40 s for 500 ppb vol. on our µ-pre-concentrator (13 µL cavity filled with TENAX TA 60–80 mesh powder, Supelco 11982) at a flow rate of ∼200 mL min−1 by a diaphragm pump (SP 100 EC-DU, Schwarzer). The trapped gas was then thermally desorbed in backflush mode at 230 °C for 30 s at a flow rate of ∼1 mL min−1 with He as the carrier gas (BIP He, Air Products). The backflush mode was enabled by manually switching a four-port valve (Idex Health and Science, V-101L). The collected gas traveled through the reference channels of two TCD chips in series (with 640 µm × 90 µm design; see Fig. 1) biased at 3 and 9 V, respectively. The mixture was separated into a 5 m long DB-5MS capillary column (250 µm inner diameter, 0.25 µm thick phase; Supelco 28471-U), and the peaks eluting from the column traveled through the analytical channels of the TCDs for the detection. We chose this configuration to minimize the flow variations between the reference channel and the analysis channel of each TCD, because TCD baselines can be affected by any gas flow rate or pressure fluctuation. All fluidic connections were made with zero dead-volume (0.79 mm) external unions (VICI EU.5). In-house electronics were used to control the pre-concentrator's thermo-desorption, to bias the TCDs and amplify and digitize their signals, and to control the pump.
Typical chromatograms are shown in Fig. 5. We observe peak fronting, which is a signature of overload of the column. This will not alter the conclusions to be drawn later.
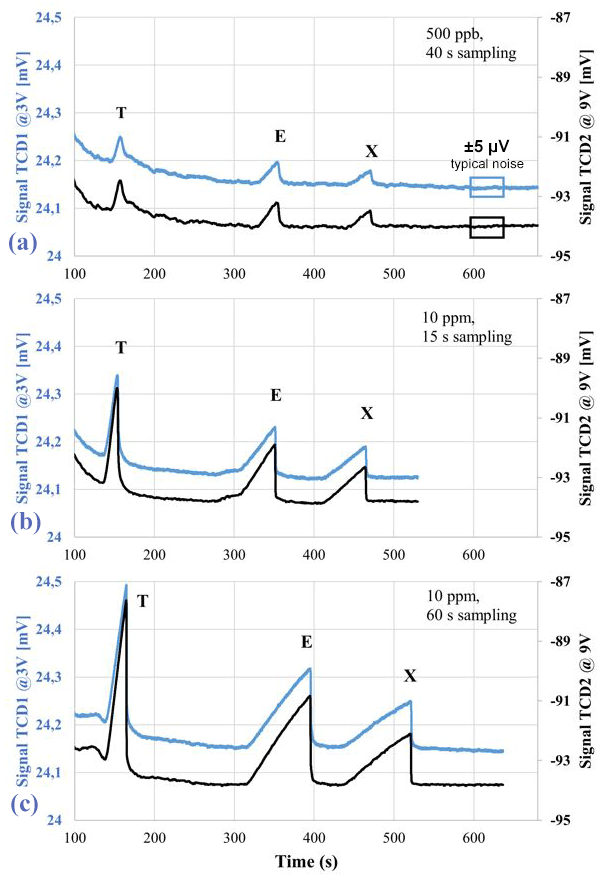
Figure 5Typical chromatograms registered by the two TCDs, one of them biased at 3 V (blue) and the other one biased at 9 V (black). The TEX mixture is 500 ppb vol. sampled for 40 s (a) and 10 ppm vol. sampled for 15 s (b) or 60 s (c).
We repeated the experiments a minimum of five times to get representative statistics for three different mixture concentrations, and for each peak (T, E, and X), we plotted the ratio as a function of the calculated local concentration of the analyte around the TCD filaments. To achieve this, we assumed that 100 % of the analyte sampled in the µ-pre-concentrator was efficiently desorbed, separated, and detected by TCD chips. While the initial mixture contained equal concentrations of T, E, and X, the local concentration around TCD membranes differs for each compound, as the column retained the molecules differently, resulting in peaks of varying durations.
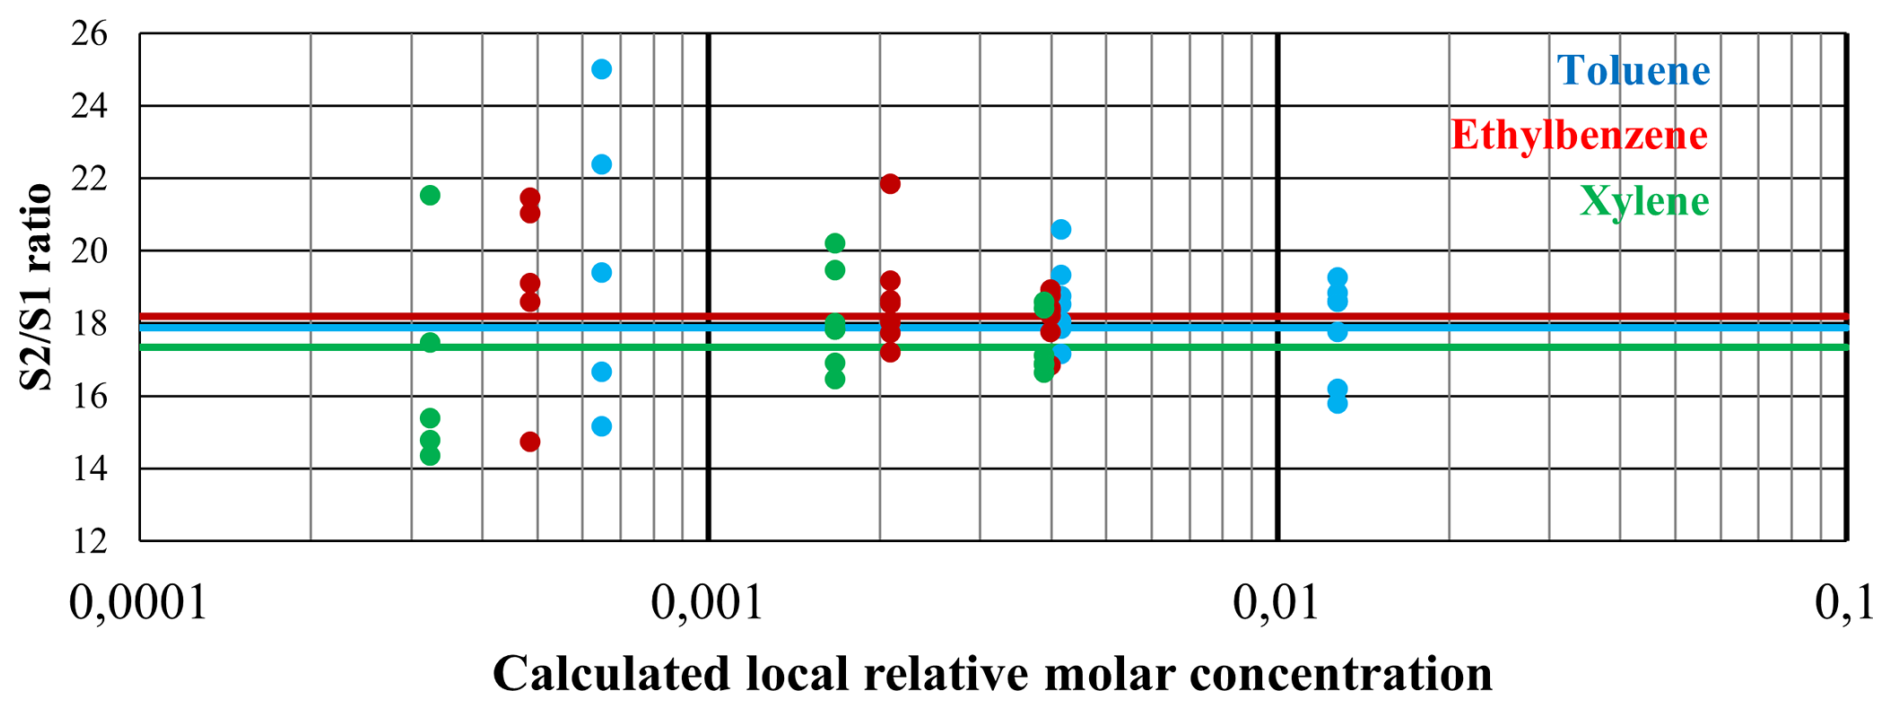
The experiments show a converging distribution of the data points when concentrations increase (see Fig. 6), as predicted by the calculations. We also confirm experimentally that the method does not allow us to distinguish between T, E, or X, because the results are too noisy and too similar between the compounds (see also Fig. 7, where all data are merged). As a reminder, the experiments were conducted at the highest concentrations enabled by the separation column's capacity (indeed, column saturation can already be observed), and yet they are still not high enough to overcome the measurement noise effect. The conclusions will therefore be the same for lower concentrations, which are more representative of the intended use case.
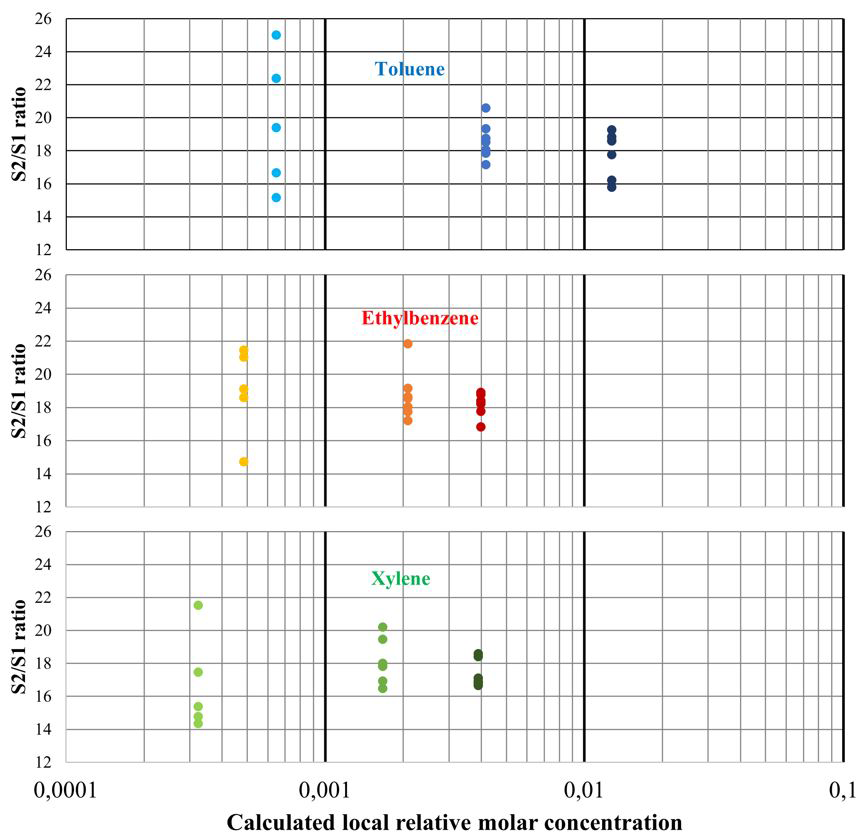
Figure 6Experimental ratios versus calculated relative molar concentrations for T, E, and X compounds.
In a µ-GC–TCD system, when confusion exists between two compounds eluting at close retention times, we demonstrate that a double-measurement approach (measurement of the ratio of two TCDs biased at two different voltages, i.e., at two different equilibrium temperatures, in order to be independent of the unknown analyte concentration) is not relevant in helping identification. Theoretical calculations as well as experimental data indicate that this method could only work with high local analyte concentrations (∼0.1 % vol.–5 % vol. around TCD membranes, i.e., ∼0.0001 % vol.–0.005 % vol. (1–50 ppm vol.) at the system entrance, using a typical ∼1000 enrichment factor with the pre-concentration step). Such concentrations are way beyond the scope of a trace analysis system, which would rather aim at 1–10 ppb vol. concentrations at the system entrance. Reducing the measurement noise, working with a higher TCR for the TCD filament, or being able to use more distant biases (mainly higher V2) are improvement paths for enhancing this method but might not be enough to gain a few orders of magnitude.
Therefore, improving a µ-GC–TCD system's specificity for low-concentration measurement might only be achieved by more traditional approaches, e.g., by using a second parallel separation column with a distinct well-selected stationary phase or by working with a 2D approach (comprehensive GC × GC; Chen et al., 2013; Huang et al., 2022).
The software code is available upon request.
Data are available upon request.
MJ, EL, and FR designed the pre-concentration chip. JBT manufactured and diced the chips. JFB conceived the electronics, and EL coded the software. MJ conducted the TCD simulation study, and AT kept a critical eye on it. EL, MJ, and FR conceived the table-top experiments. EL carried out the acquisitions. EL and MJ processed the data. MJ prepared the paper with contributions from all of the co-authors.
Publisher's note: Copernicus Publications remains neutral with regard to jurisdictional claims made in the text, published maps, institutional affiliations, or any other geographical representation in this paper. While Copernicus Publications makes every effort to include appropriate place names, the final responsibility lies with the authors.
This article is part of the special issue “Eurosensors 2024”. It is a result of the EUROSENSORS XXXVI, Debrecen, Hungary, 1–4 September 2024.
The work was supported by Bertin Technologies (France).
This paper was edited by Thomas Fröhlich and reviewed by two anonymous referees.
Baur, T., Schultealbert, C., Schütze, A., and Sauerwald, T.: Novel method for the detection of short trace gas pulses with metal oxide semiconductor gas sensors, J. Sens. Sens. Syst., 7, 411–419, https://doi.org/10.5194/jsss-7-411-2018, 2018.
Bourlon, B., Pham Ho, B.-A., Ricoul, F., Chappuis, T., Bellemin Compte, A., Constantin, O., and Icard, B.: Revisiting gas sampling and analysis with microtechnology: Feasibility of low cost handheld gas chromatographs, in: Proceedings of 2016 IEEE Sensors, 30 October–3 November 2016, Orlando, FL, USA, https://doi.org/10.1109/icsens.2016.7808672, 2017.
Bourlon, B., Pham Ho, B.-A., Bêche, J.-F., and Constantin, O.: Feasibility of a thermal conductivity based CO2 and humidity low cost sensor, in: 22nd International Conference on Miniaturized Systems for Chemistry and Life Sciences (MicroTAS 2018), 11–15 November 2018, Kaohsiung, Taiwan, 922–924, 2018.
Chappuis, T.-H., Pham Ho, B.-A., Ceillier, M., Ricoul, F., Alessio, M., Bêche, J.-F., Corne, C., Besson, G., Vial, J., Thiébaut, D., and Bourlon, B.: Miniaturization of breath sampling with silicon chip: application to volatile tobacco markers tracking, J. Breath Res., 12, 046011, https://doi.org/10.1088/1752-7163/aad384, 2018.
Chen, B.-X., Hung, T.-Y., Jian, R.-S., and Lu, C.-J.: A multidimensional micro gas chromatograph employing a parallel separation multi-column chip and stop-flow µGC × µGCs configuration, Lab Chip, 13, 1333, https://doi.org/10.1039/c2lc41179b, 2013.
Crucello, J., De Oliveira, A. M., Sampaio, N. M. F. M., and Hantao, L. W.: Miniaturized systems for gas chromatography: Developments in sample preparation and instrumentation, J. Chromatogr. A, 1685, 463603, https://doi.org/10.1016/j.chroma.2022.463603, 2022.
Cruz, D., Chang, J., Showalter, S., Gelbard, F., Manginell, R., and Blain, M.: Microfabricated thermal conductivity detector for the micro-ChemLabTM, Sensors Actuat. B, 121, 414–422, https://doi.org/10.1016/j.snb.2006.04.107, 2007.
Gardner, E. L. W., Gardner, J. W., and Udrea, F.: Micromachined thermal gas sensors – A review, Sensors, 23, 681, https://doi.org/10.3390/s23020681, 2023.
Garg, A., Akbar, M., Vejerabo, E., Narayanan, S., Nazhandali, L., Marr, L. C., and Agah, M.: Zebra GC: A mini gas chromatography system for trace-level determination of hazardous air pollutants, Sensors Actuat. B: 212, 145–154, https://doi.org/10.1016/j.snb.2014.12.136, 2015.
Haghighi, F., Talebpour, Z., and Sanati-Nezhad, A.: Through the years with on-a-chip gas chromatography: a review, Lab Chip, 15, 2559–2575, https://doi.org/10.1039/C5LC00283D, 2015.
Hirschauer, P., Paris, B., Messaoudene, S., Fournier, M., Bourlon, B., Hou, Y., Ricoul, F., and Laplatine, L.: Integrated interferometers as a new platform for low cost gas chromatography detection, Talanta, 281, 126659, https://doi.org/10.1016/j.talanta.2024.126659, 2025.
Hsieh, H.-C. and Kim, H.: A miniature closed-loop gas chromatography system, Lab Chip, 16, 1002–1012, https://doi.org/10.1039/c5lc01553g, 2016.
Huang, X., Li, M. W.-H., Zang, W., Huang, X., Sivakumar, A. D., Sharma, R., and Fan, X.: Portable comprehensive two-dimensional micro-gas chromatography using an integrated flow-restricted pneumatic modulator, Microsyst. Nanoeng., 8, 115, https://doi.org/10.1038/s41378-022-00452-5, 2022.
Lee, J., Park, T. H., Kang, H. S., and Lim, S.-H.: Miniaturized gas chromatography module with micro posts embedded MEMS colum for the separation of exhaled breath gas mixtures, in: IEEE Sensors 2016, 30 October–3 November 2016, Orlando, FL, USA, https://doi.org/10.1109/ICSENS.2016.7808674, 2016.
Leidinger, M., Rieger, M., Sauerwald, T., Alépée, C., and Schütze, A.: Integrated pre-concentrator gas sensor microsystem for ppb level benzene detection, Sensors Actuat. B, 236, 988–996, https://doi.org/10.1016/j.snb.2016.04.064, 2016.
Le Neindre, B.: Conductivité thermique des liquides et des gaz, Techniques de l'ingénieur Caractérisation et propriétés de la matière, TIP510WEB, https://doi.org/10.51257/a-v1-k427, 1998.
Manginell, R. P., Bauer, J. M., Moorman, M. W., Sanchez, L. J., Anderson, J. M., Whiting, J. J., Porter, D. A., Copic, D., and Achyuthan, K. E.: A Monolithically-Integrated µGC Chemical Sensor System, Sensors, 11, 6517–6532, https://doi.org/10.3390/s110706517, 2011.
Narayanan, S., Rice, G., and Agah, M.: A micro-discharge photoionization detector for micro-gas chromatography, Microchim. Acta, 181, 493–499, https://doi.org/10.1007/s00604-013-1146-9, 2014.
Poling, B. E., Prausnitz, J. M., and O'Connell, J. P.: Properties of Gases and Liquids, in: section 10-6, 5th Edn., McGraw-Hill Education, New York, ISBN 9780070116825, 2001.
Qualley, A., Hughes, G. T., and Rubenstein, M. H.: Data quality improvement for field-portable gas chromatography-mass spectrometry through the use of isotopic analogues for in-situ calibration, Environ. Chem., 17, 28–38, https://doi.org/10.1071/EN19134, 2020.
Rastrello, F., Placidi, P., Scorzoni, A., Cozzani, E., Messina, M., Elmi, I., Zampolli, S., and Cardinali, G. C.: Thermal conductivity detector compact Spice model based on experimental measurements and 3D simulations, Sensors Actuat. A, 178, 49–56, https://doi.org/10.1016/j.sna.2012.02.008, 2012.
Regmi, B. P. and Agah, M.: Micro gas chromatography: an overview of critical components and their integration, Anal. Chem., 90, 13133–13150, https://doi.org/10.1021/acs.analchem.8b01461, 2018.
Szopa, C., Coscia, D., Cabane, M., and Buch, A.: Miniaturized gas chromatography for space exploration : a 50 years history, in: 2017 Symposium on Design, Test, Integration and Packaging of MEMS/MOEMS (DTIP), 29 May–1 June 2017, Bordeaux, France, 1–4, https://doi.org/10.1109/DTIP.2017.7984486, 2017.
Wang, A., Hynynen, S., Hawkins, A. R., Tolley, S. E., Tolley, H. D., and Lee, M. L.: Axial thermal gradients in microchip gas chromatography, J. Chromatogr. A, 1374, 216–223, https://doi.org/10.1016/j.chroma.2014.11.035, 2014.
Wang, J, Liu, Y., Zhou, H., Wang, Y., Wu, M., Huang, G., and Li, T.: Thermal conductivity gas sensor with enhanced flow-rate independence, Sensors, 22, 1308, https://doi.org/10.3390/s22041308, 2022.
Wardencki, W. and Witkiewicz, Z.: Developments in miniaturization of gas chromatography, Curr. Adv. Chem. Biochem., 4, 24–42, https://doi.org/10.9734/bpi/cacb/v4/7175D, 2021.
Yeom, J.: Micro-preconcentrator technology for portable gas chromatography system, Encyclopedia of nanotechnology, 1–8, https://doi.org/10.1007/978-94-007-6178-0_100964-1, 2015.
Zampolli, S., Elmi, I., Cardinali, G. C., Masini, L., Bonafè, F., and Zardi, F.: Compact-GC platform: A flexible system integration strategy for a completely microsystems-based gas-chromatograph, Sensors Actuat. B, 305, 127444, https://doi.org/10.1016/j.snb.2019.127444, 2020.
Zhou, M., Sharma, R., Zhu, H., Li, Z., Li, J., Wang, S., Bisco, E., Massey, J., Pennington, A., Sjoding, M., Dickson, R. P., Park, P., Hyzy, R., Napolitano, L., Gillies, C. E., Ward, K. R., and Fan, X.: Rapid breath analysis for acute respiratory distress syndrome diagnostics using a portable two-dimensional gas chromatography device, Anal. Bioanal. Chem., 411, 6435–6447, https://doi.org/10.1007/s00216-019-02024-5, 2019.