the Creative Commons Attribution 4.0 License.
the Creative Commons Attribution 4.0 License.
 | 19 Feb 2026
Recognising wild animals on roads: multisensor systems for accident avoidance
Michael Schneider
Hubert Mantz
Thomas Walter
Mike Montoya-Capote
Jonas Berger
Andreas Reichel
Nils Hollmach
Wildlife-related traffic accidents represent a persistent hazard on rural roads in Germany and beyond. Current electronic wildlife warning systems typically monitor only very short distances and therefore cannot provide large-area coverage. This paper presents a novel multisensor approach that integrates radar and infrared (IR) technology into existing roadside delineators. Due to regulatory requirements, delineators are placed at intervals of 50 m on German country roads. Integrating sensors into these delineators thus provides a uniform infrastructure that can be utilised. The radial extension of the sensor range allows a monitoring zone to be formed along the road. We evaluate thermal infrared arrays and high-resolution 60 GHz radar sensors for range, resolution and robustness under varying environmental conditions. Field measurements in wildlife parks demonstrate that the system can reliably detect deer at distances of up to 30 m and evaluate their moving speed as well. Challenges such as ambient temperature effects, optical dispersion in IR detection and resolution limits are discussed. The results highlight the potential of multisensor systems to reduce wildlife accidents and improve road safety.
- Article
(5490 KB) - Full-text XML
- BibTeX
- EndNote


An analysis of wildlife accident statistics from the German Hunting Association demonstrates a steady trend of increasing wildlife accidents (Kauer/DJV, 2023). In order to assist drivers in avoiding accidents, car developers are turning to driver assistance systems (Rigling et al., 2022; Car, 2011). Several pilot projects demonstrate how drivers can be actively warned: an electronic wildlife warning system has been tested and developed by the Forestry Testing and Research Institute in Baden-Württemberg, Germany, since 2007. This system involves the installation of a fence alongside the road to guide wild animals to a crossing area. At this point, infrared sensors are programmed to detect the presence of an animal, leading to the triggering of a warning signal for the driver (FVA, 2008). All existing sensor systems have one key feature in common: they monitor only short sections of 5–7 m, leaving the rest of the road unmonitored. These systems therefore require additional protection for monitoring along the road. As described above, fences for instance are used for this purpose.
To overcome this limitation, we propose a sensor system that leverages both radar and infrared technologies. Installed on existing roadside delineators spaced 50 m apart, the sensors monitor a zone extending up to 50 m parallel to the road. Reliable detection requires the recognition and segmentation of wild animals, whether in radar range-Doppler maps or thermal infrared images. The implementation of a higher resolution than that employed for presence detection is essential for the successful integration of an infrared sensor into a detection and warning segmentation system. Consequently, low-cost IR arrays are a possible option to identify deer using imaging techniques. The combination of modalities enables more robust detection and provides essential data for driver warnings.
It seems appropriate to use sensors that cover the area between the delineators that look outwards and parallel to the road. Geometric considerations for covering a secure area show that sensors attached to a delineator must cover a 30 m or greater radius in the form of a half circle. Figure 1 illustrates this. The radial overlap of 10 m results in an intersection point between two adjacent detection radii. The distance between the road and the intersection point is 16.6 m, which can be considered sufficiently large.
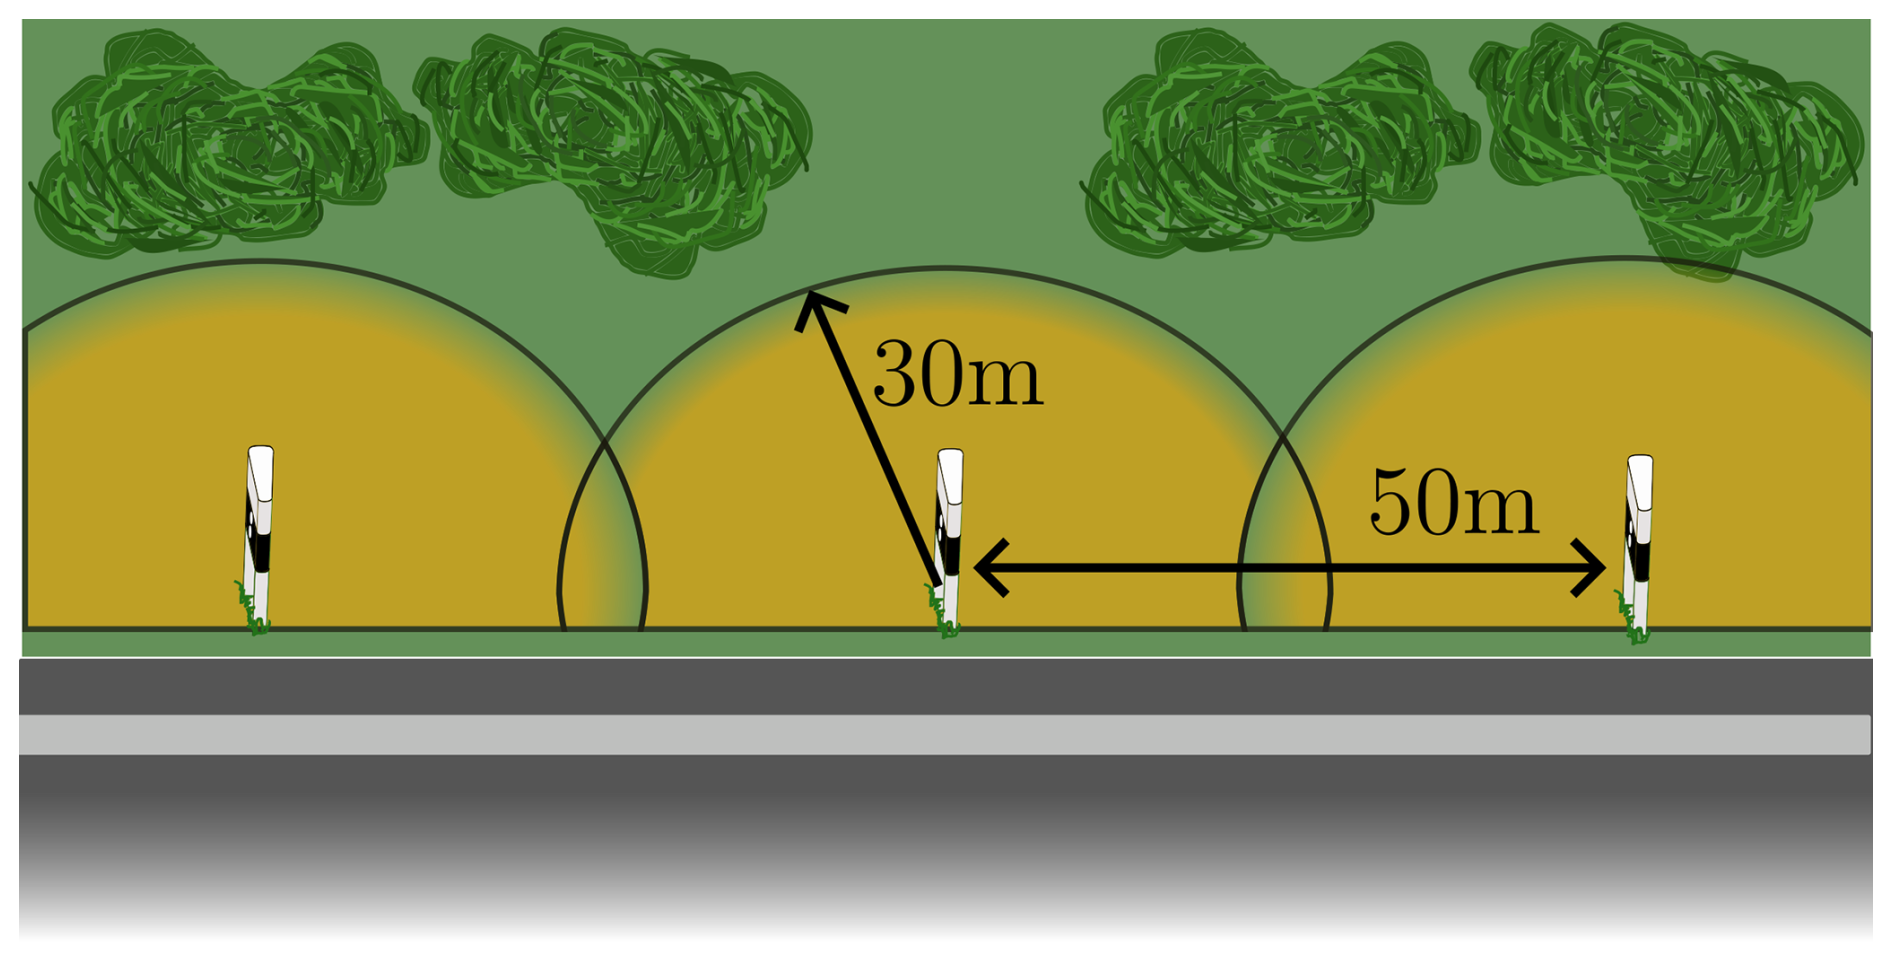
Figure 1The schematic represents a road with delineators. The distance between each delineator is 50 m, and the sensing radius of the sensors forms a 30 m half-circle radius around a delineator (Schneider et al., 2025) (https://creativecommons.org/licenses/by/4.0/, last access: 11 February 2026).
These requirements were used to select the sensors. These include infrared detectors, which were previously used in wildlife warning systems, as well as thermal sensors in general (FVA, 2008; Animoth, 2025). However, directional detection or imaging is required here to recognise the direction in which the animal is moving.
A new approach that has already been investigated in Lavrenko et al. (2021); Rippl et al. (2020) uses radar sensors to detect micro-Doppler signatures for different living persons and animals. Lavrenko et al. use a 77 GHz radar sensor with a bandwidth of 3 GHz to detect the signatures. The signature of each body part is totally different for each of these subjects. The high bandwidth should make it easy to detect the animal's direction of movement and to identify individual body parts. Based on the results of previous research, a 60 GHz radar sensor was identified that offers similar resolution but can evaluate larger distances. A mobile measuring system (Fig. 2a), that can be easily positioned, was developed for evaluating and testing the limits.
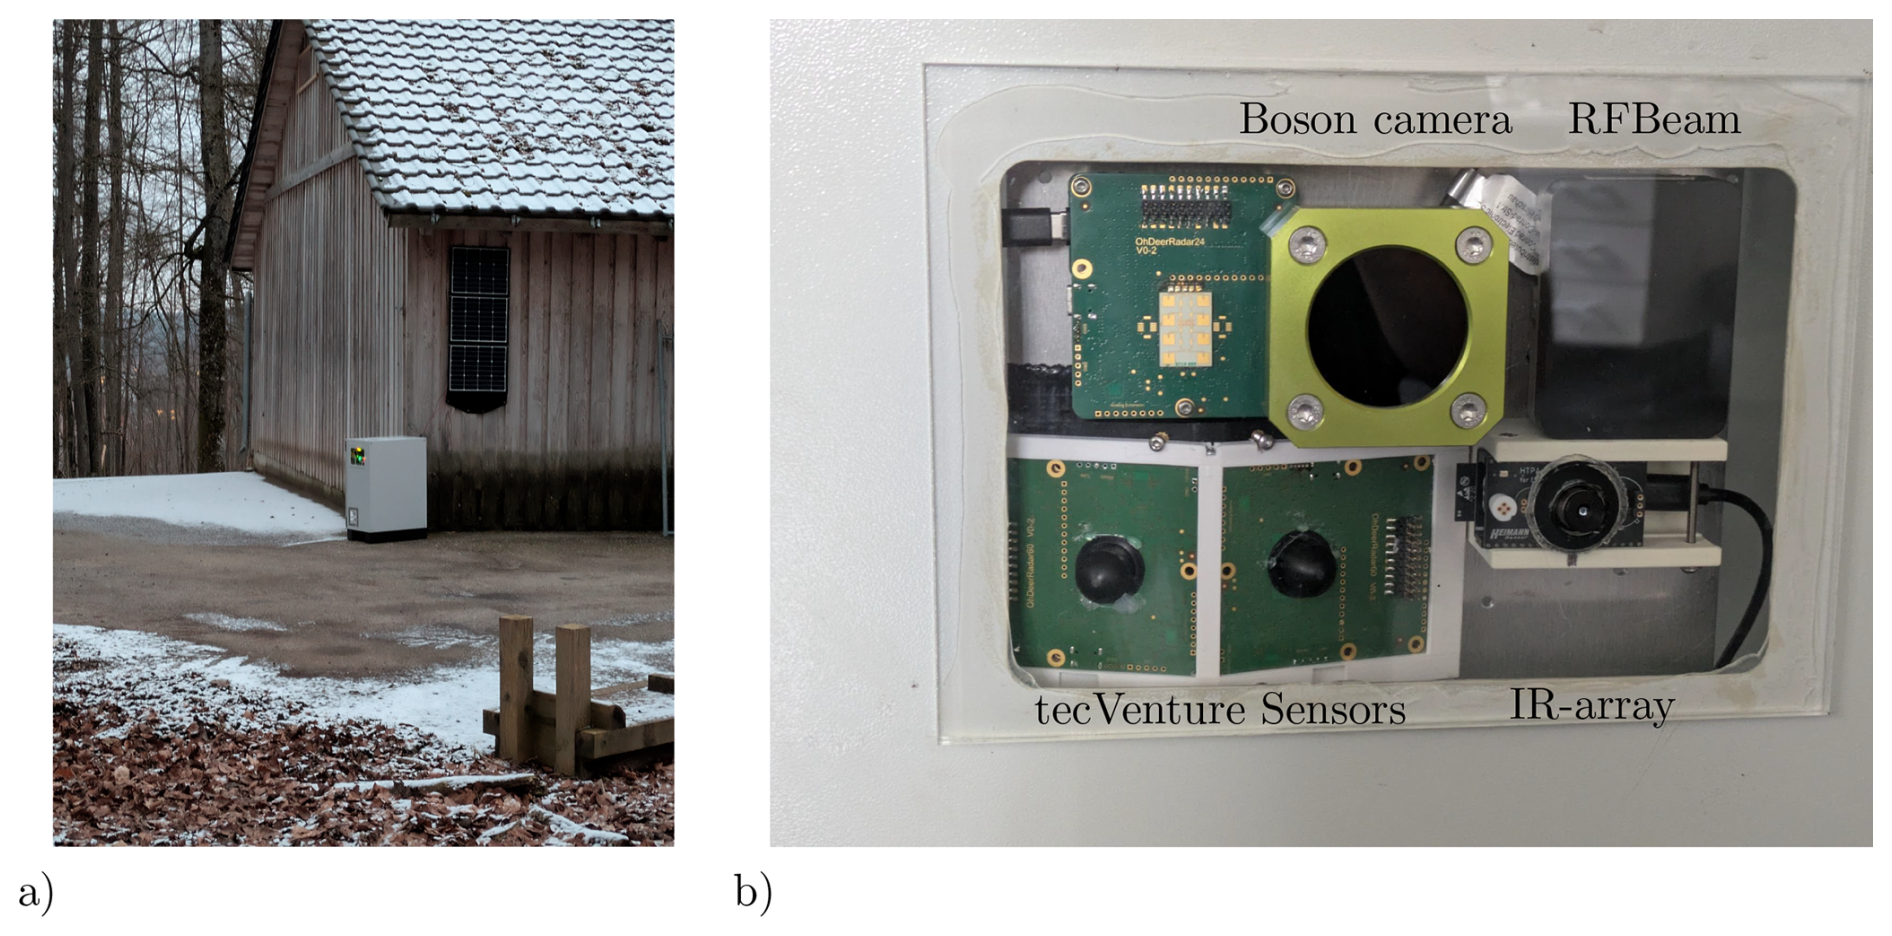
Figure 2Sensor system at a measuring location with animal-proof housing and solar modules in (a). (b) shows the sensors.
The sensors are shown in Fig. 2b. The RFBeam 60 GHz sensor is located at the top-right corner. To its left, behind special protective glass, is the Boson thermal camera. The evaluation board and its IR array are located at the bottom right.
On the left are two 60 GHz radar sensors from our project partner, tecVenture. These are aligned at a 20° angle to each other. Above these is a 24 GHz sensor, also developed by tecVenture, that was neither used nor evaluated.
2.1 Thermal sensors
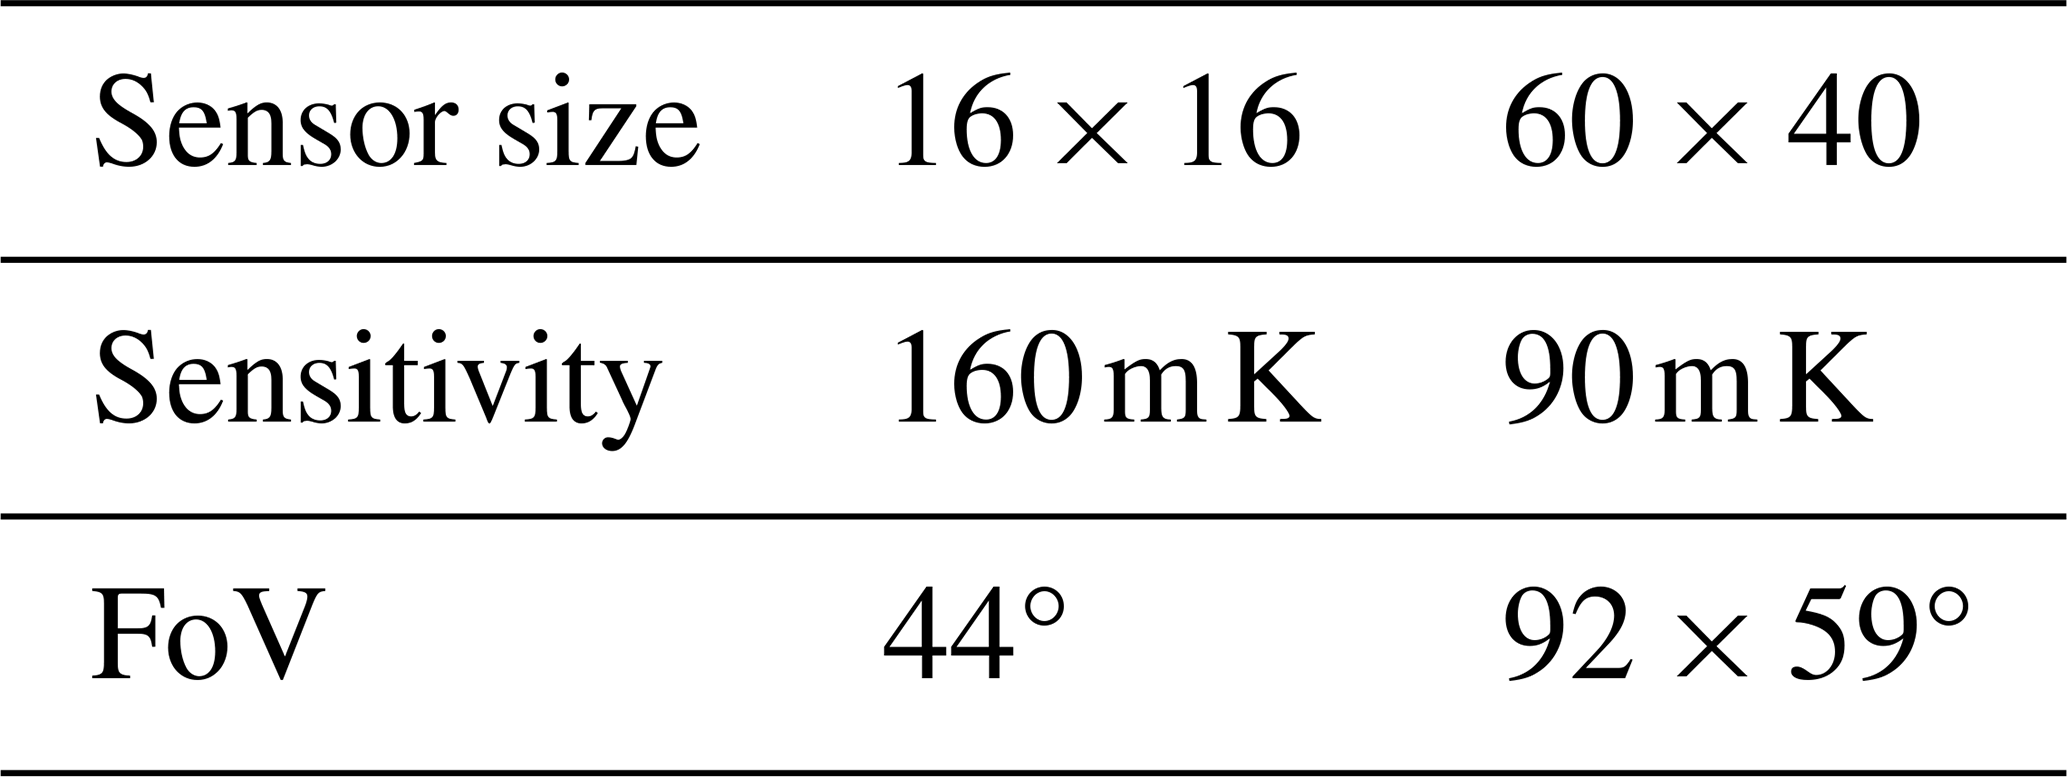
To evaluate thermal imaging, we used a high-resolution thermal camera from Boson (Flir, 2024), with a 50° field of view (FoV) lens as a reference for validation and verification. As we do not know any specific emission values for nature in relation to solar radiation, we perform an automatic adjustment using histogram optimisation before each measurement interval. This allows us to achieve optimal contrast between the background and the deer in every scenario. Because these cameras are expensive, we also used HTPA-IR arrays from a Heimann Sensor (Heimann, 2024). These are available in different resolutions, in our case 16 × 16 and 60 × 40 pixels. Since the detection of wild animals with thermal imaging cameras depends heavily on ambient light and temperature, the range was evaluated based on indoor tests, whereby range is understood to be the maximum distance at which a person can still be detected at a constant ambient temperature. The indoor comparison was considered appropriate because wildlife crossings mainly occur at twilight. These indoor tests therefore enable measurements to be taken without the influence of sunlight. Thermal solar radiation therefore has less influence. Standard Heimann sensors without adapted lenses were used for the tests. This means that the viewing ranges of the sensors differ (Table 1).
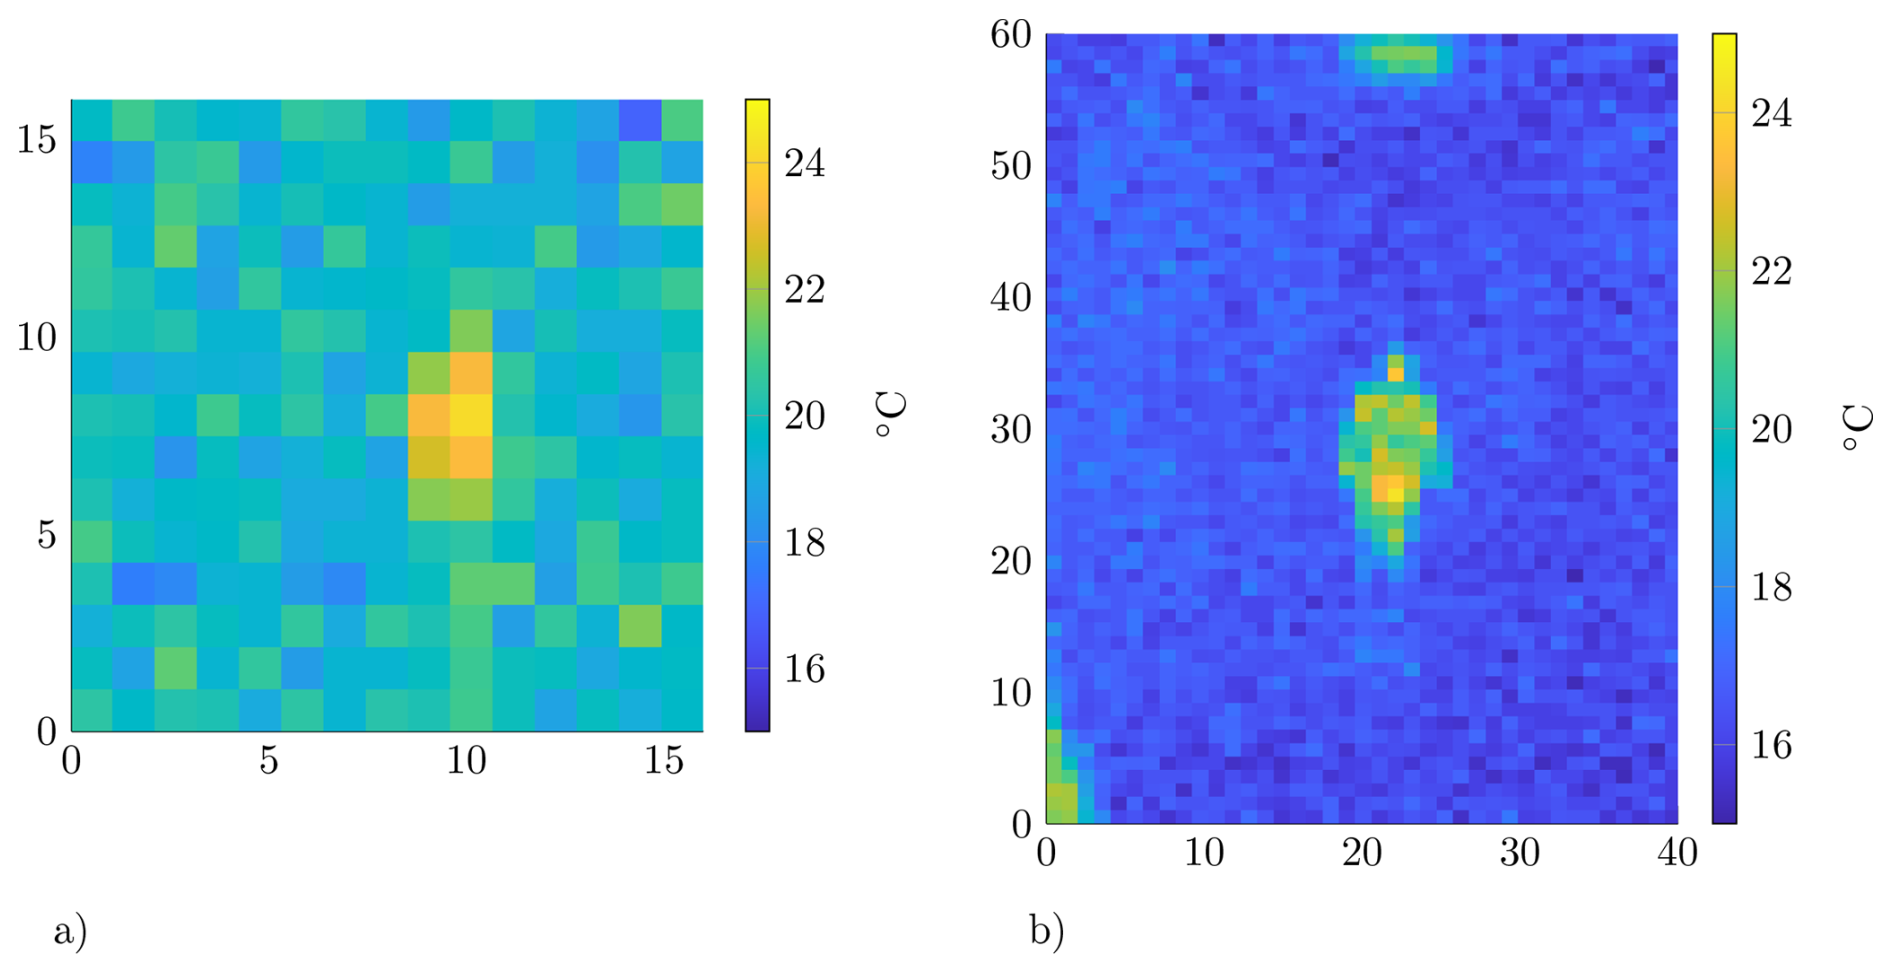
For a first evaluation of detecting, a person was positioned in front of the sensors at the same distance and at different ambient temperatures. For example, as Fig. 3 shows, the person is easily recognisable at a distance of 14.5 m in a resolution of 60 × 40 pixels at an ambient temperature of 18 °C. However, at a resolution of 16 × 16 pixels, the person can no longer be identified due to the lower resolution in the same ambient temperature. This can be described by the spot size ratio (Playà‐Montmany and Tattersall, 2021). If this is converted to the pixel area A, Eq. (1) is obtained. Here, d corresponds to the object distance andn corresponds to the number of pixels in the azimuth and elevation directions, respectively. However, using this equation to determine the maximum distance between objects in correlation to object size is incorrect. The reason for this is optical dispersion. This phenomenon describes how the thermal radiation, emitted from a small area, does not provide sufficient energy to the individual pixel. For a reliable measurement, the measuring point should therefore cover a resolution of at least 3 × 3 pixels (Wang et al., 2019). According to this theory, the target is already too far away for the sensor in Fig. 3a, because if the ambient temperature rises, only one pixel would show the person. Therefore, the further measurements are limited to the IR array with the 60 × 40 pixels. This sensor is therefore appropriate for the distance mentioned above, up to an ambient temperature of approximately 26 °C.
Practical measurements show that the presence of deer at a reference ambient temperature of 20 °C can be recognised both in the IR array and in the high-resolution Boson camera (Fig. 4). For our proof of concept, the standard configuration provided by Heimann, as shown in Table 1, is therefore sufficient. To extend the FoV to 90°, either a second sensor or a lens can be installed. However, as our evaluation shows, a larger FoV is linked to temperature resolution, which leads to lower distance resolution under the same environmental conditions. The single deer is 18 m away and, due to its body orientation, emits a large amount of heat, which the IR array maps over several pixels. By contrast, the deer on the left of the image is slightly farther away and aligned with the sensor system, resulting in a much lower heat signature.
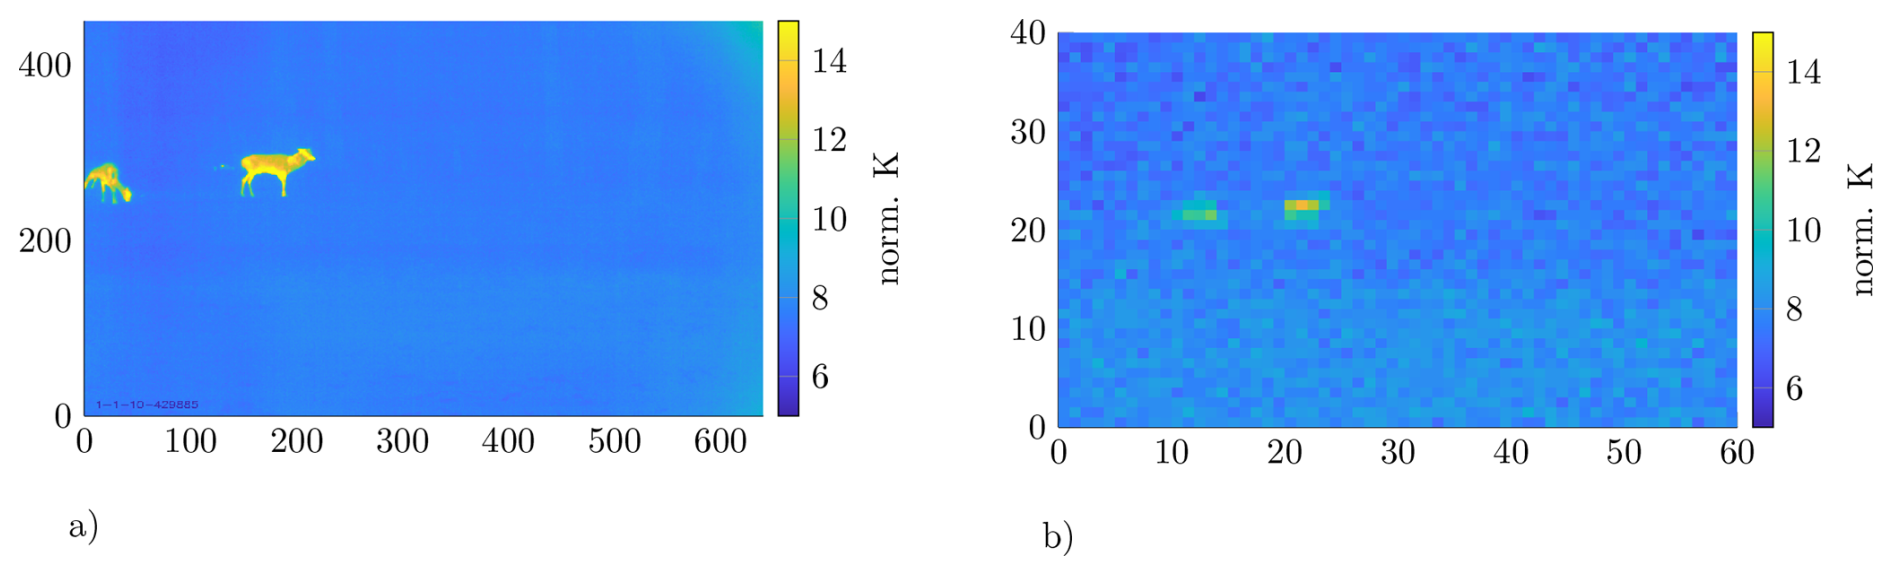
Figure 4Two deer are located approximately 18 m from the sensor system. (a) shows the high-resolution thermal image captured by the Boson camera, while (b) shows the image captured by the IR array.
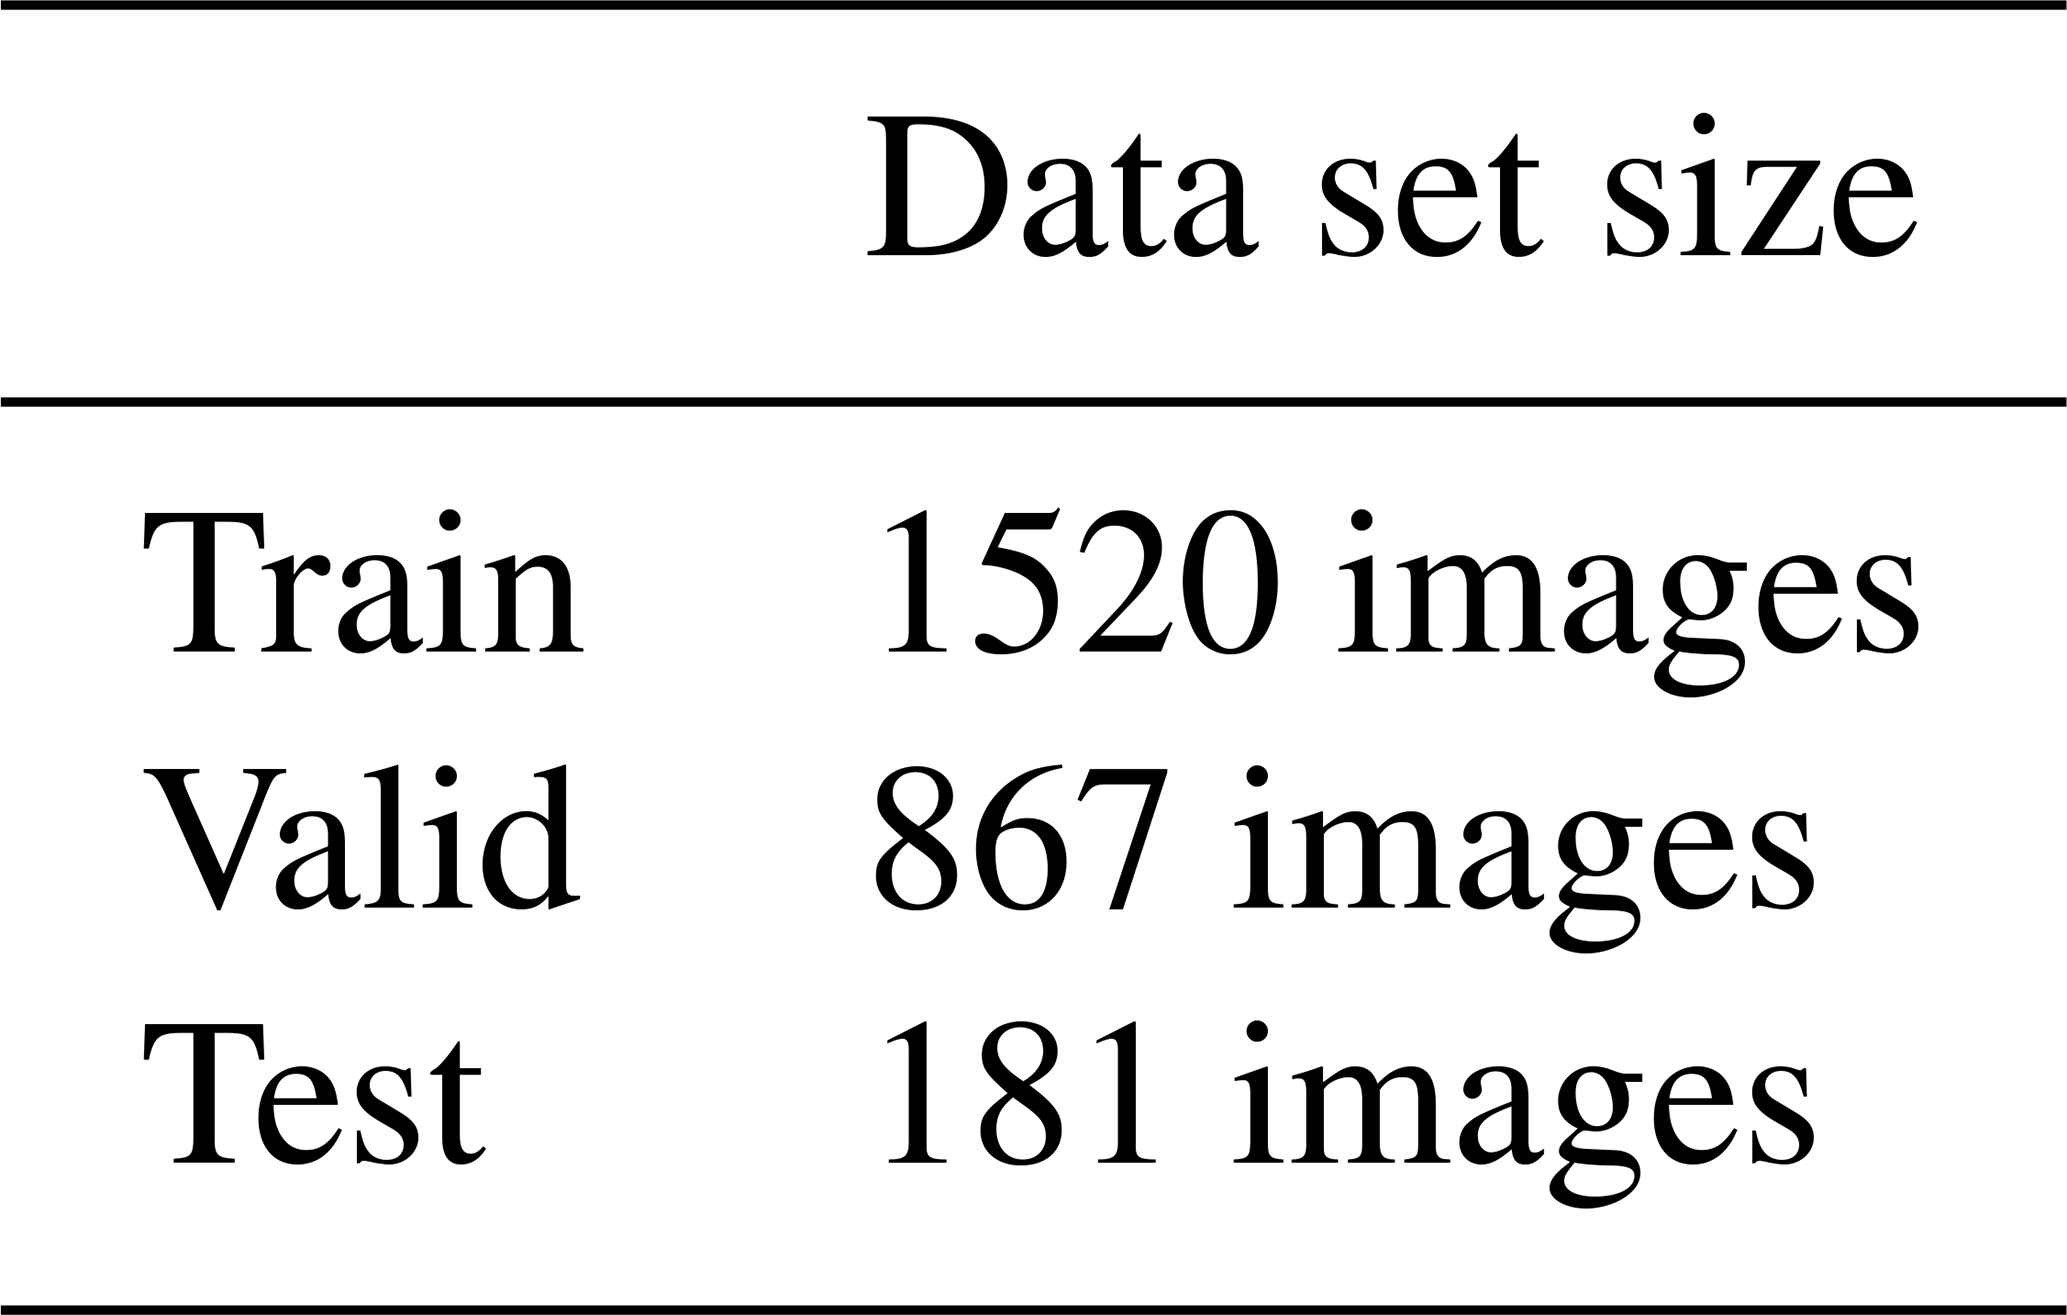
As part of an initial trial, a convolutional neural network (CNN) was evaluated for its capacity to automatically detect deer that pose a threat to traffic safety. Due to the inability to clearly identify detection in radar data, the co-registration approach is to be utilised. Prior to the execution of the aforementioned procedure, it is necessary to first evaluate the thermal images. Given the simplicity and rapid detection rate of the YOLO (You Only Look Once) model, it was selected as the primary approach for the segmentation process. As in Wang et al. (2024) and Turmaganbet et al. (2025), the YOLO (Ultralytics, 2023) CNN was used for automatic referencing. To achieve this, the 16-bit greyscale images from the Boson camera were cropped to 8 bits using mean-value nomination. This is necessary because thermal intensity is expressed as a relative number of 16 bits; thus, the measured relative temperature of each pixel is mapped to this value range. Additionally, YOLO is optimised for evaluating 8-bit RGB images. Due to the CNN's architecture, YOLO always requires three individual images (R, G, and B), which are superimposed to form the overall image. To analyse the impact of converting 16-bit thermal images to 8-bit false colours, YOLO was trained twice with the same images and data distribution (Table 2). For this evaluation, a random selection of images was chosen, which were manually marked and provided with bounding boxes indicating where and how many animals were present. The selected images were then divided into two classes: with deer and without deer. Three sets of different sizes were formed from these classes (Table 2). Due to the false-colour representation and the greyscale scaling, there are now six sets, three each for processing in the CNN.
After determining the range of the mean value and standard deviation, the single-channel greyscale image is used as a three-channel image in the first training case. This means the grey image is composed three times as RGB and transferred to YOLO (Fig. 5a). In the second training case, the greyscale image is coloured using a false-colour representation of the “jet” colour map and can be split into a three-channel RGB image (Fig. 5b) as a normal RGB image.
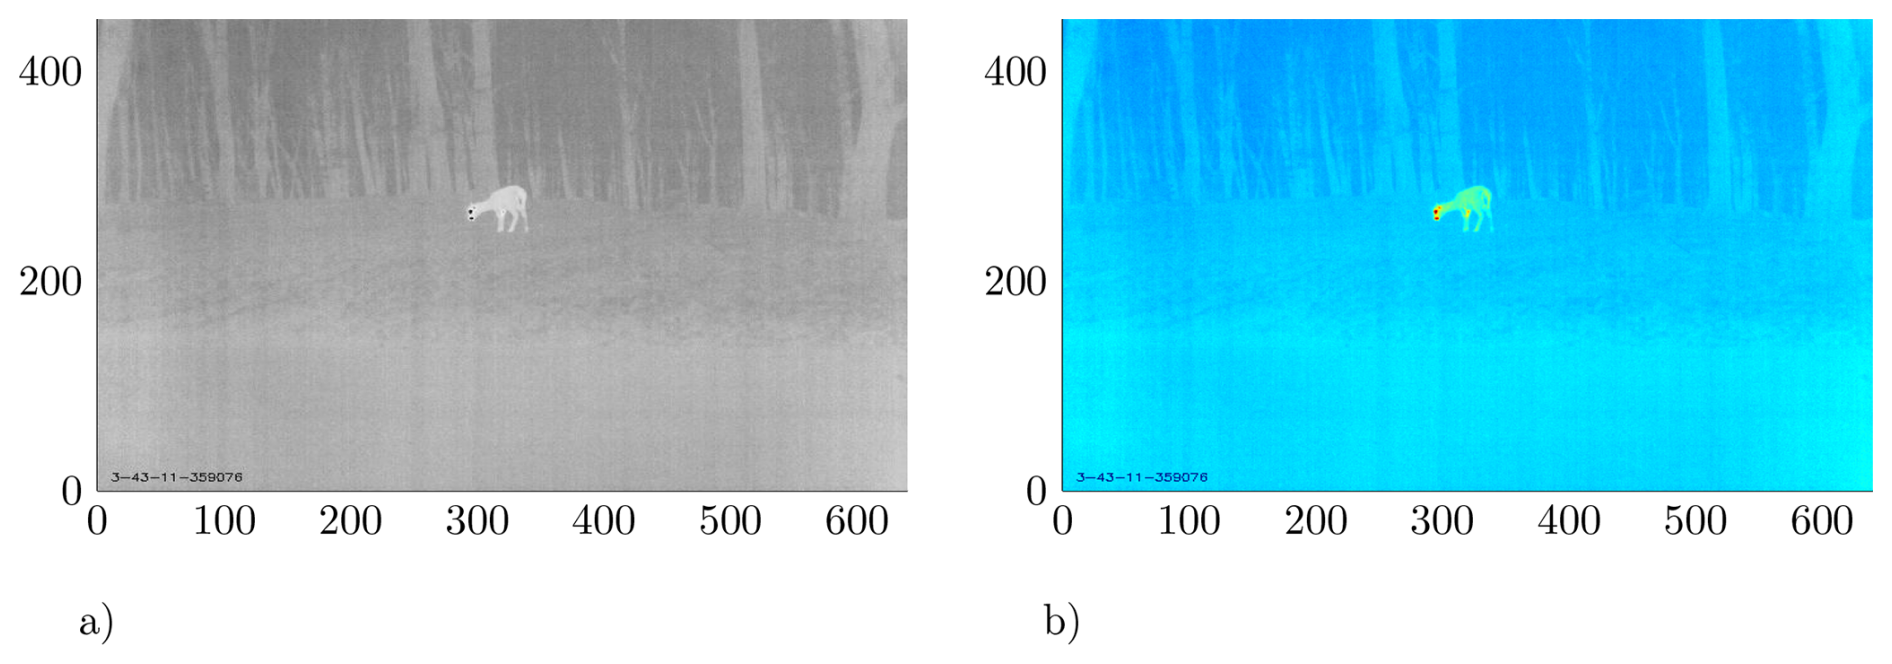
Figure 5Both images show a deer after mean-value normalisation: (a) in greyscale and (b) in a false-colour representation.
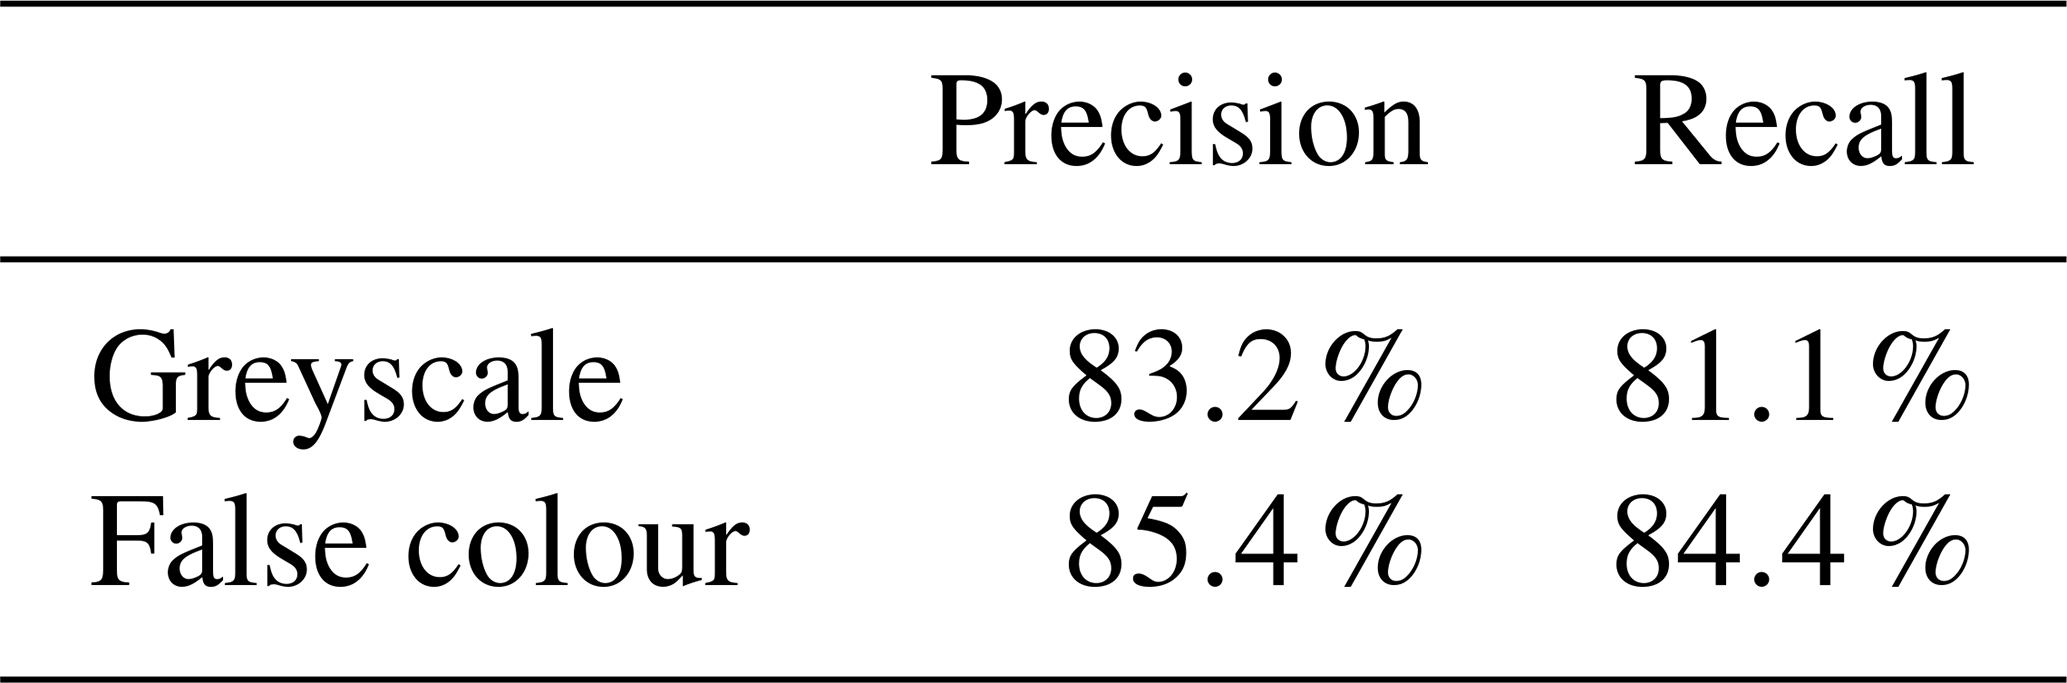
The recall is particularly noteworthy when assessing the training cases, as it demonstrates the number of deer that can be detected. The false-colour representation is 84.4 %, about 3 points higher than the grey image. The precision evaluation shows an even smaller difference, with the false-colour representation at 85.4 %, only 2 points higher. Deer are mainly not detected in the recall when they are at a great distance (20 m or more) from the measuring system or when a large part of the animal is obscured by vegetation.
This signifies that the acquisition of thermal data is especially advantageous in environments with substantial vegetation. In open terrain evaluating images in greyscale is sufficient to detect animals.
2.2 Radar sensors
Radar detection depends strongly on carrier frequency, as higher frequencies reduce range but improve resolution. Free-space path loss (Eq. 2) (Gil et al., 2021) and range resolution (Eq. 3) define sensor performance. For the FSPL, the maximum range r of interest is of primary importance, which depends directly on the carrier frequency fc, with c describing the speed of light as the propagation speed in air.
Due to the permitted bandwidths BW, a higher baseband frequency provides more accurate resolution ΔR (Lee et al., 2020).
The 60 GHz radar sensor from RFBeam with integrated signal processing enables a maximum range of r=30 m with a range resolution of ΔR=0.23 m and a velocity resolution of Δv=0.43 s (Fig. 6) and still has an FoV of azimuth °. This makes it suitable for installation in our sensor system. Using a moving target indication filter (Tohidi et al., 2015), static targets can be filtered without compromising the signal-to-noise ratio. This makes it possible to detect a deer at a distance of up to r=30 m.
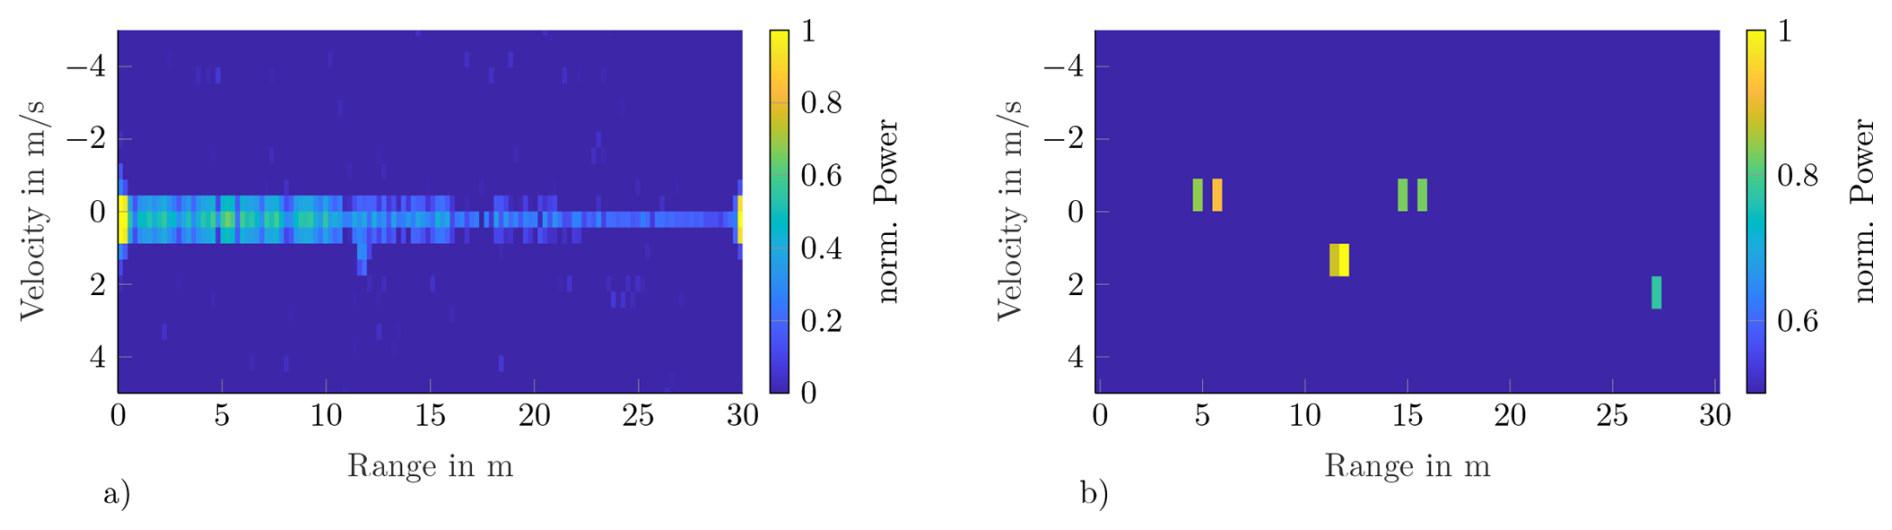
Figure 6Range Doppler maps of the RFBeam reference sensor, in panel (a) without MTI filter, in(b) with MTI filter. The deer is located at 11.5 m and is moving at approximately 1 s. The remaining targets in (b) are false detections or caused by noise.
In collaboration with tecVenture, we developed a custom 60 GHz radar sensor using the BGT60UTR11AIP chip (rfbeam, 2024). The system on chip (SoC) enables a simple system design. An STM32 serves as the micro-controller unit and configures the radar SoC. It also performs the initial FFT of the signal processing chain. The principle of a lens outlined from the IR arrays can be adapted here, and it has been implemented because the used chip has an FoV of 180° in azimuth and elevation. With the lens, the FoV can be limited to 70°. This results in a wider range of up to r=30 m. Due to the parameters used, a higher ΔR=0.075 m than with the RFBeam reference sensor can be achieved. In Fig. 7, three stationary deer were captured with the tecVenture sensor in a wildlife park. For this measurement, the MTI filter is deactivated, as the deer are located at static distances at feeding places.
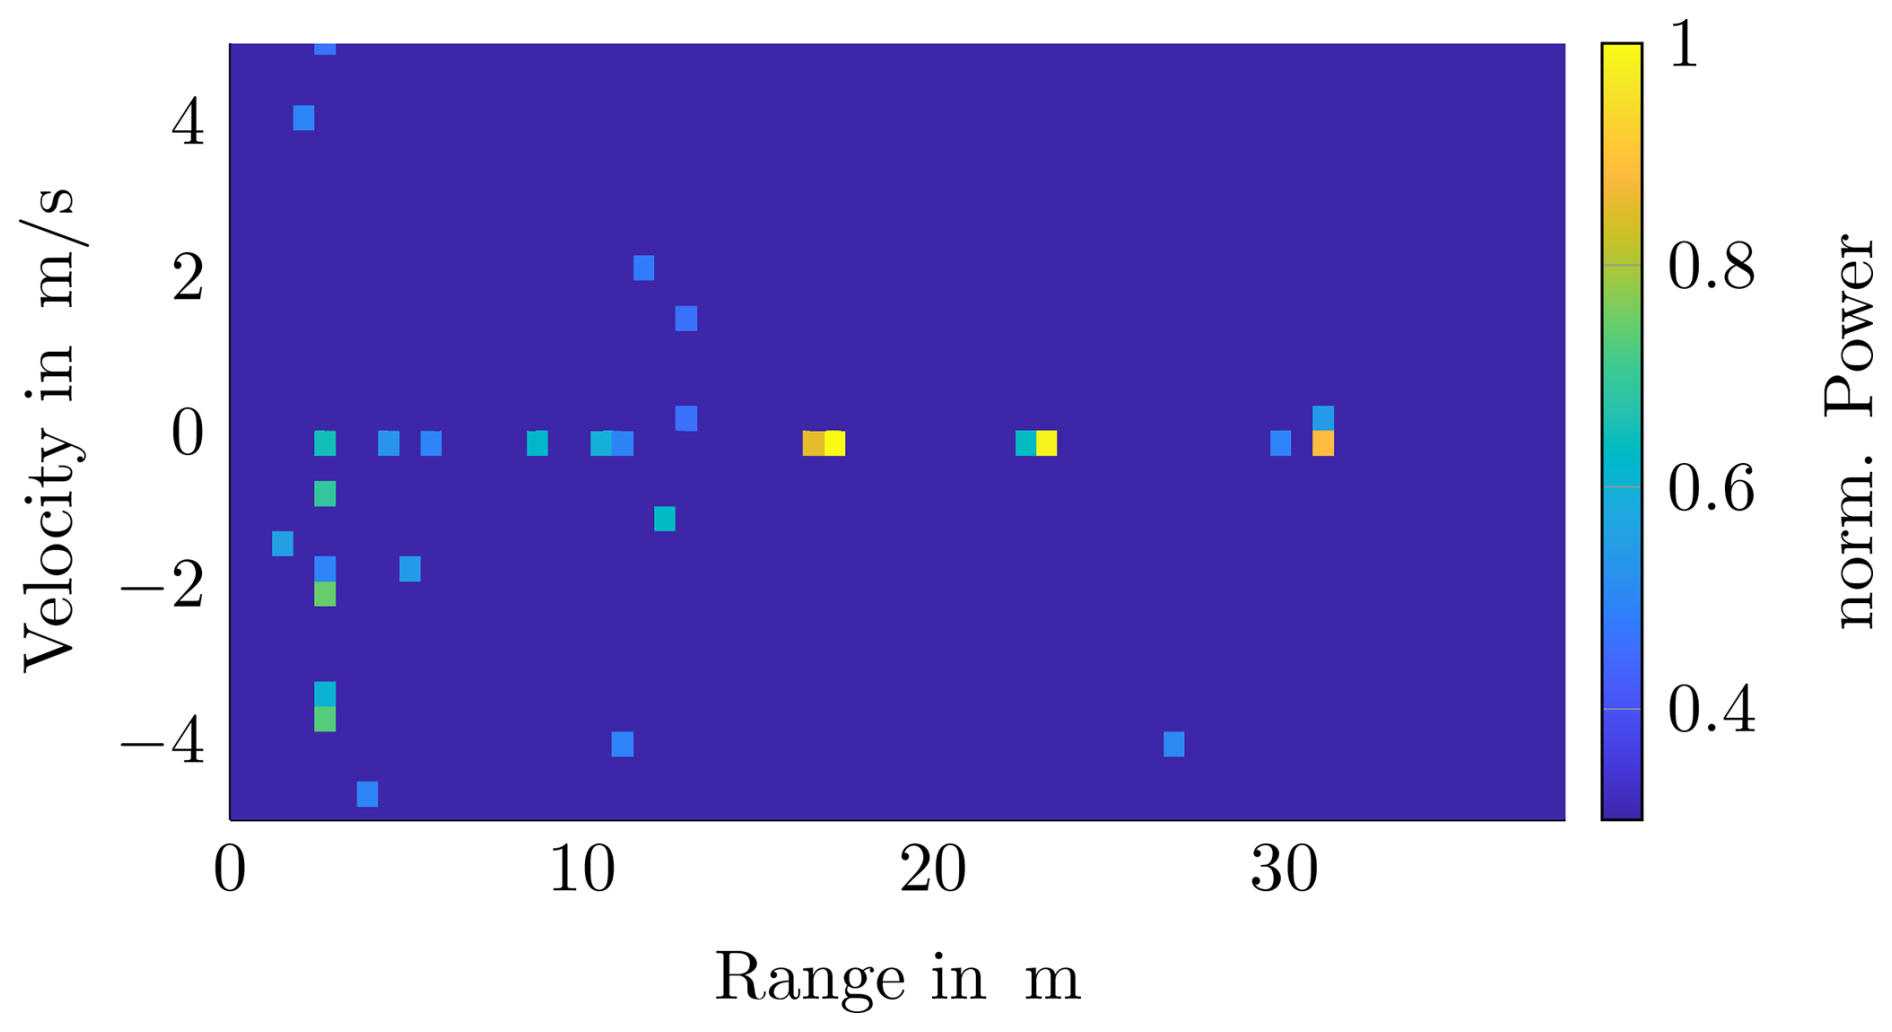
Figure 7Radar measurement of the tecVenture 60 GHz sensor. There are three upright deer at distances of 18, 25 and 31 m from the sensor system.
The presented multisensor system successfully combines IR arrays and 60 GHz radar sensors to detect wild animals near roads. Tests demonstrated the reliable recognition of deer at distances of up to 30 m, although performance is influenced by ambient temperature, animal orientation and pixel resolution. Lenses can extend detection range but at the cost of narrower FoV.
Radar sensors complement thermal imaging by providing robust motion detection and higher resolution for distinguishing animals. Although adult deer were reliably detected, further research is required for smaller animals. The detection of deer has already been tested in high-resolution thermal camera images, but adaptation to IR arrays is still pending. Detection using YOLO works well in both greyscale images and false-colour representations, and can be used for feature extraction. This is important for automatic labelling and verification of AI-based detection in radar images.
Ongoing work explores the AI-based classification of thermal images of the IR arrays and motion patterns in range Doppler maps, also using lightweight detection networks such as YOLO. This integrated approach shows strong potential for large-scale deployment, leveraging existing delineator infrastructure to enhance traffic safety and reduce wildlife-related accidents.
Code and data are available upon request.
The campaign was meticulously planned by HM, TW and MMC. TW and HM acquired the funding for the project and did the administration. The development of the radar systems was undertaken by JB, AR and NH. MS set up the measuring system and wrote the paper.
The authors Mike Montoya-Capote, Jonas Berger, Andreas Reichel and Nils Hollmach are employed by the company tecVenture. The peer-review process was guided by an independent editor, and the authors have no other competing interests to declare.
Publisher's note: Copernicus Publications remains neutral with regard to jurisdictional claims made in the text, published maps, institutional affiliations, or any other geographical representation in this paper. The authors bear the ultimate responsibility for providing appropriate place names. Views expressed in the text are those of the authors and do not necessarily reflect the views of the publisher.
This article is part of the special issue “Sensors and Measurement Science International SMSI 2025”. It is a result of the 2025 Sensor and Measurement Science International (SMSI) Conference, Nuremberg, Germany, 6–8 May 2025.
This work was supported by the German Federal Ministry of Transport (https://www.bmv.de/EN/Home/home.html, last access: 28 January 2026) as the mfund Project “OhDeer”.
This research has been supported by the Bundesministeriums für Verkehr, Bau und Stadtentwicklung (mFUND).
This paper was edited by Marco Jose da Silva and reviewed by two anonymous referees.
Animoth: https://animot.eu/ (last access: 8 December 2025), 2025. a
Car, V.: Volvo Car Corporation develops technology to avoid collisions with wild animals, Volvocars, https://www.volvocars.com/us/media/press-releases/57BD69B42F99B2A3/ (last access: 27 January 2026), 2011. a
Flir: Boson640, https://www.flir.de/products/boson/ (last access: 18 October 2024), 2024. a
FVA: Pilotprojekt Elektronische WildwarnanlageB292 bei Aglasterhausen, https://www.fva-bw.de/fileadmin/scripts/forschung/wg/081014wildwarn_ber.pdf (last access: 17 October 2024), 2008. a, b
Gil, G.-T., Lee, J. Y., and Cho, D.-H.: Estimation of Path Loss Parameters of a Sub-Terahertz Wireless Channel Using Monostatic Radar, IEEE Access, 9, 52654–52663, https://doi.org/10.1109/ACCESS.2021.3070378, 2021. a
Heimann: Heimann Sensor, https://www.heimannsensor.com/ (last access: 20 October 2024), 2024. a
Kauer/DJV: Wildunfallstatistik, https://www.jagdverband.de/zahlen-fakten/jagd-und-wildunfallstatistik/wildunfallstatistik (last access: 18 Ocotber 2024), 2023. a
Lavrenko, T., Gessler, T., Walter, T., Mantz, H., and Schlick, M.: Radar Based Detection and Classification of Vulnerable Road Users, in: The 8th International Symposium on Sensor Science, I3S 2021, MDPI, p. 67, https://doi.org/10.3390/i3s2021dresden-10098, 2021. a, b
Lee, W., Dinc, T., and Valdes-Garcia, A.: Multi-Mode 60-GHz Radar Transmitter SoC in 45-nm SOI CMOS, IEEE Journal of Solid-State Circuits, 55, 1187–1198, https://doi.org/10.1109/JSSC.2020.2964150, 2020. a
Playà‐Montmany, N. and Tattersall, G. J.: Spot size, distance and emissivity errors in field applications of infrared thermography, Methods in Ecology and Evolution, 12, 828–840, https://doi.org/10.1111/2041-210x.13563, 2021. a
rfbeam: Md3-radar-transceiver, https://rfbeam.ch/product/v-md3-radar-transceiver/ (last access: 17 October 2024), 2024. a
Rigling, A., Sandner, V., and Kolke, R.: ADAC testet Assistenzsysteme auf Wildtier-Erkennung, Das Fachmagazin für Verkehrsunfall und Fahrzeugtechnik, 432–437, https://www.vkuonline.de/adac-testet-assistenzsysteme-auf-wildtier-erkennung-3289235.html (last access: 11 February 2026), 2022. a
Rippl, P., Iberle, J., Mutschler, M. A., Scharf, P. A., Mantz, H., and Walter, T.: Analysis of pedestrian gait patterns using radar based Micro-Doppler Signatures for the protection of vulnerable road users, in: 2020 IEEE MTT-S International Conference on Microwaves for Intelligent Mobility (ICMIM), IEEE, 4 pp., https://doi.org/10.1109/icmim48759.2020.9299029, 2020. a
Schneider, M., Mantz, H., Walter, T., Montoya-Capote, M., Berger, J., Reichel, A., and Hollmach, N.: D7.1 – Recognising Wild Animals on Roads: Radar-based Sensor Systems for Accident Avoidance, in: Lectures, AMA Service GmbH, 228–229, https://doi.org/10.5162/smsi2025/d7.1, 2025. a
Tohidi, E., Radmard, M., Karbasi, S. M., Behroozi, H., and Nayebi, M. M.: Compressive sensing in MTI processing, in: 2015 3rd International Workshop on Compressed Sensing Theory and its Applications to Radar, Sonar and Remote Sensing (CoSeRa), IEEE, 1, 189–193, https://doi.org/10.1109/cosera.2015.7330290, 2015. a
Turmaganbet, U., Zhexebay, D., Turlykozhayeva, D., Skabylov, A., Akhtanov, S., Temesheva, S., Tao, M., and Masalim, P.: Thermal infrared object detection with YOLO models, Eurasian Physical Technical Journal, 22, 121–132, https://doi.org/10.31489/2025n2/121-132, 2025. a
Ultralytics: YOLOv8 Architecture, Ultralytics Docs, https://yolov8.org/yolov8-architecture/ (last access: 12 September 2025), 2023. a
Wang, T., Ren, S., and Zhang, H.: Nighttime wildlife object detection based on YOLOv8‐night, Electronics Letters, 60, https://doi.org/10.1049/ell2.13305, 2024. a
Wang, X., Yin, J., Zhang, K., and Yan, J.: Research on dispersion phenomenon of infrared imaging system based on black body, Optik, 185, 405–413, https://doi.org/10.1016/j.ijleo.2019.03.115, 2019. a