the Creative Commons Attribution 4.0 License.
the Creative Commons Attribution 4.0 License.
 | 04 Mar 2026
Inline gas-phase sampling methods for contaminant monitoring in polyolefin recycling
Wolfhard Reimringer
Helen Haug
Tilman Sauerwald
This article investigates methods for sampling volatiles on a compounding extruder to enable the development of a quasi-continuous automated sampling and measurement system for odorous contaminants. A first prototype of a bespoke extraction system was presented in earlier work, comprising four sequential cooling traps and one subsequent sorption trap. This setup allows us to obtain samples from the vacuum degassing port of a Coperion ZSK extruder. Preliminary results indicated that samples contain a plethora of odor-active compounds. This study assesses samples from the processing of post-consumer recycled polypropylene by means of gas chromatography–mass spectrometry/olfactory detection (GC–MS/O), focusing on comparing the composition of condensed and adsorbed samples. The results give an overview of the degassing atmosphere, listing more than 108 volatile compounds including odorants. Qualitative comparison of the sampling techniques indicates significant fractioning between condensates and adsorbates, which is illustrated on an orientation plot for water solubility versus volatility. Based on the results, guidelines for the design of sampling units for automated use in the aspired online monitoring application are proposed to transfer a broad spectrum of relevant contaminants to an attached measurement system.
- Article
(2624 KB) - Full-text XML
- BibTeX
- EndNote


Increasing the recycling quota of plastic packaging is an important sustainability goal that has been incorporated in national and European legislation (PPWR, 2024; VerpackG, 2019). A current funding initiative by the German Federal Ministry of Education and Research (BMBF) focuses on the polyolefins polypropylene (PP) and polyethylene (PE), which are high-quality plastics used for critical applications like pharmaceuticals, cosmetics, and food packaging. However, meeting the quality standards of said applications with post-consumer recycled (PCR) plastics remains a challenging task due to the varying degrees of contamination from their previous lifecycles and reprocessing (Cook et al., 2023; Nordahl and Scown, 2024). Among the various contaminants found in recycled plastics, volatile organic compounds (VOCs) are a diverse group that includes a variety of odor-active volatiles (Strangl et al., 2021). These contaminants, referred to as “non-intentionally added substances” (NIASs), are of concern as they are undesired and, in some cases, even harmful. Current spot survey methods are inadequate for sufficiently monitoring these contaminants. Consequently, there is an urgent demand for continuous in situ measurement methods to closely scrutinize the material during processing and to allow for selection and adaptive treatment of heterogeneous PCR plastics. A suitable process step to access the material is the compounding extruder, where the extraction from the liquid state is forced in the vacuum degassing zone. Attaching an analytical measurement system here is challenging due to the necessity of sample extraction, inducing phase changes in the sampled compounds.
In prior work, a prototype sampling apparatus was developed to extract samples from the degassing atmosphere in order to investigate its composition. This has been reported contemporaneously in two conference contributions for disjunct international (Reimringer et al., 2024b) and national (Reimringer et al., 2024a) audiences and included preliminary GC–MS/O results for condensate samples only.
In this article, the assessment of this feasibility study is completed with analyses for the adsorbates collected on sorbent tubes for thermal desorption (TD), allowing for a systematic conclusion of the measurement task and the deduction of a setup and operation method for a prospective automated online measurement system.
In the compounding extruder, material undergoes a continuous mechano-chemical process and is blended with additives. Reaction products and other volatile components are removed from the molten mass via degassing ports; reaction conditions and the attached vacuum facilitate the transfer to the gas phase. The implementation of online monitoring systems, equipped with advanced trace gas analytics, would facilitate the acquisition of crucial data concerning the composition of the degassing atmosphere and the potential presence of contaminants. The shifted vapor–liquid equilibrium in the degassing situation can be leveraged to measure components with low volatility.
The following sections offer a concise synopsis of the sampling apparatus and experiment from Reimringer et al. (2024a, b) as well as the subsequent steps for laboratory analysis that were used to investigate the general composition of the degassing atmosphere and relevant target gases.
2.1 Sampling apparatus
The process temperature in the compounding extruder of approx. 200 °C and the pressure on the vacuum degassing line of approx. 70 mbarabs do not permit direct attachment of an analytical measurement system. Instead, a transfer of the gas sample to standard atmospheric temperature and pressure (SATP) conditions (25 °C, 1013 mbar) is required. Consequently, certain compounds will condense; volatile compounds can be either condensed by additional cooling or adsorbed for later release.
The apparatus in Fig. 1 was developed to investigate this transfer process. It comprises four cooling traps, followed by a TD tube. Sampling options are inline and bypass, the latter using a 40 LN min−1 sampling pump specified with 500–1000 mLN min−1 at 70 mbarabs operation pressure. For the condensation traps, inert glass flasks are temperature controlled via aluminum blocks, connected with a thermal gap filler (TGF) material (Reimringer et al., 2024b).
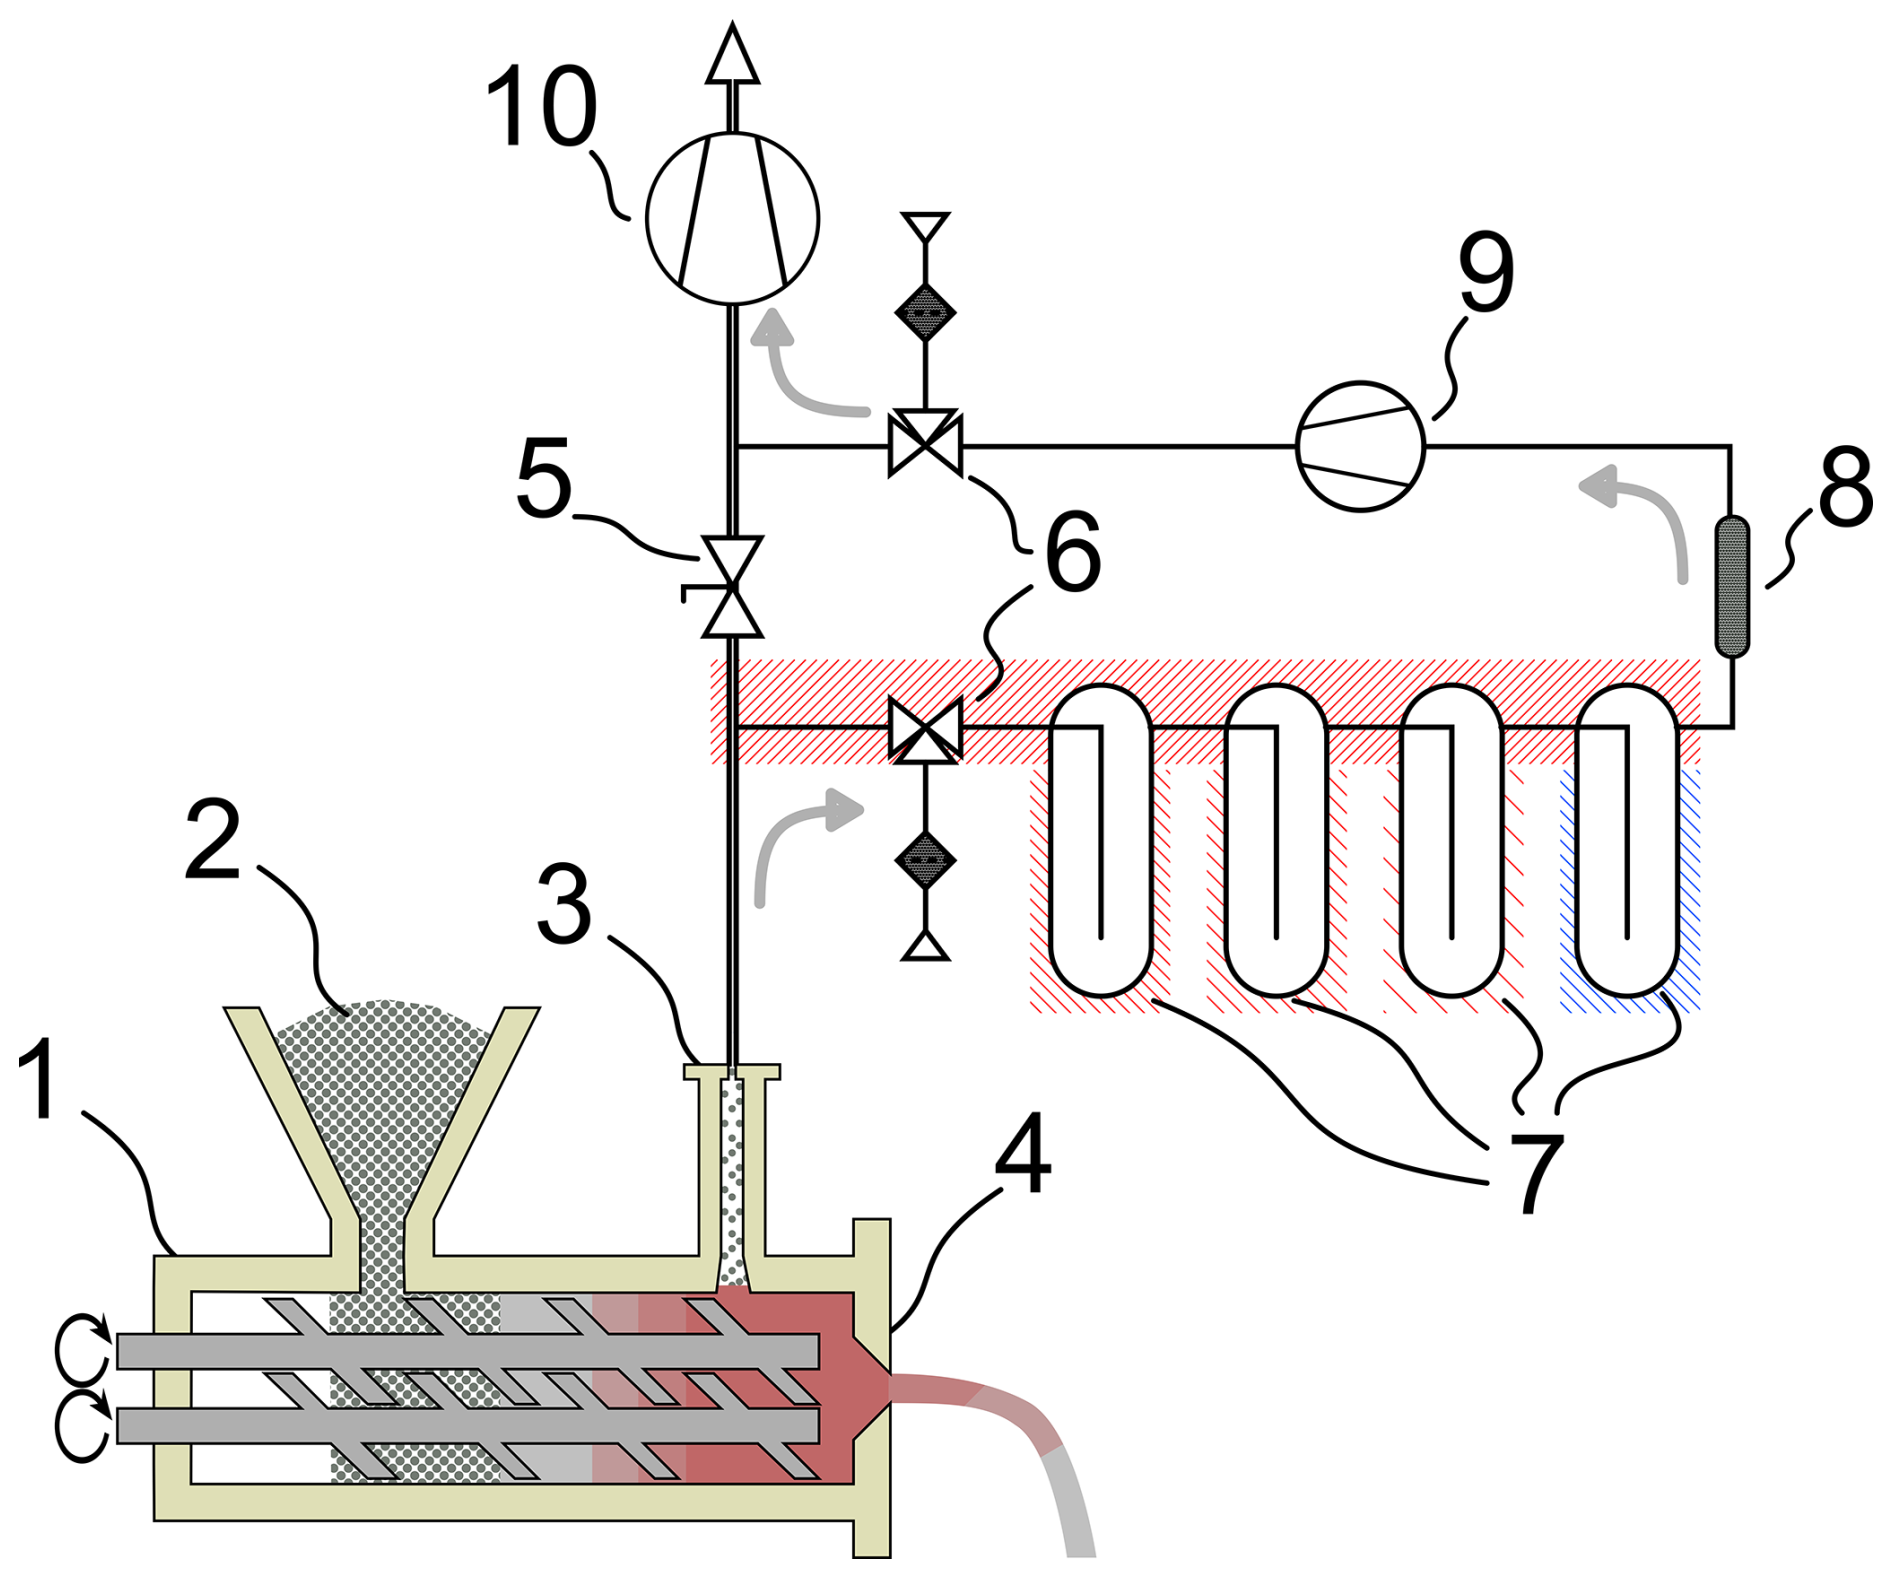
Figure 1Schematic of the sampling system from Reimringer et al. (2024b). The compounding extruder (1) processes recycled PP (2). The product is extruded from die (4). The process is degassed via the degassing dome (3) using a high-performance vacuum pump (10). The sampling apparatus is connected to the degassing line -way valves (6). For the bypass mode, gas is transported by the membrane pump (9) and by the main pump (10) for the inline mode with a closed butterfly valve (5). Cooling traps (7) collect condensates, and volatile compounds are adsorbed on the TD tube (8). The gray arrows indicate direction of degassing flow.
2.2 On-site experiment
The apparatus was set up at the compounding lab at IKV Aachen on a twin-screw extruder (ZSK 26 Mc, Coperion GmbH, Stuttgart, Germany). A series of experiments was conducted with recycled PP granulate (PP 0515 SPV, RE Plano GmbH, Lünen, Germany) at 200 rpm, 200 °C process temperature, and 5 kg h−1 throughput.
Table 1 gives the schedule for the experiments, respecting all basic configurations of the sampling system. Experiments no. 1 and no. 2 were conducted in bypass mode, employing the diaphragm pump once without further restriction and once with an inserted TD tube. Experiments no. 3 and no. 4 were conducted in inline mode, with three TD tubes inserted sequentially for each. In experiment no. 4, the PP granulate was pre-dried in a hot-air dryer for 4 h at 80 °C.
For each inline sampling run, the sampling path was connected prior to closing the butterfly valve at the beginning and vice versa at the end in order to ensure a continuous degassing flow, thereby simulating a prospective automated system.
Table 1Schedule for on-site sampling experiments with experiment and sample numbers, adapted from Reimringer et al. (2024b).

2.3 Analysis
Laboratory analysis was conducted using a series of preparation steps for the liquid condensate samples and extensive GC–MS/O analyses for all samples. Details on the method for condensate preparation and analysis have been reported in Reimringer et al. (2024b). The following section (Sect. 2.3.1) is reduced to the most important aspects.
2.3.1 Analysis of condensate samples
As reported in our previous work (Reimringer et al., 2024b), the condensate flasks were assessed by gravimetry to record the overall mass gain. For this, the prepared flasks (partly containing glass wool to hold back particles) were weighed with 10 mg precision before and after the experiment. The water content of the condensates was determined via Karl Fischer titration (Fischer, 1935). Volatile components were extracted from the condensate matrix with dichloromethane followed by solvent-assisted flavor evaporation (SAFE) and subsequent concentration. A blank was prepared in a similar way from demineralized water. For instrumental analysis of the condensate distillates, 2 µL of the samples was analyzed via GC–MS/O in splitless mode (7890B GC, 5977B GC/MSD, Agilent Technologies, Waldbronn, Germany; odor detection port (ODP), Gerstel MPS, Gerstel GmbH & Co KG, Mühlheim a. d. R., Germany; multi-purpose autosampler (MPS), Gerstel), whereby the MS and ODP were connected to the GC via a 1 : 1 split. Detailed parameters for the described analyses are given in Reimringer et al. (2024b).
2.3.2 GC–MS/O method for adsorbate samples
The TD tube samples were closed with brass caps and freeze-stored at −18 °C until analysis. The tubes were subsequently analyzed using a GC–MS/O system (7890B GC, 5977B GC/MSD Agilent Technologies, Waldbronn, Germany, and Gerstel ODP 4, Gerstel GmbH & Co KG, Mühlheim a. d. R., Germany) equipped with a multi-purpose autosampler (MPS) and thermal desorption unit (TD3.5+) with a cooled injection system (CIS4; all three from Gerstel GmbH & Co KG, Mühlheim a. d. R., Germany). Samples were transferred to the TD unit and thermally desorbed; for this purpose, the initial TD temperature was set to 40 °C (initial time 6 min) with a solvent vent of 5 min, after which the temperature was raised to 280 °C at 120 °C min−1 and held for 8 min. Analytes were transferred (at 300 °C) to the CIS and trapped at −100 °C by use of liquid nitrogen; the CIS temperature was then raised to 300 °C at 12 °C s−1 and held for 5 min for analyte desorption into the GC system. The initial screening run was done in splitless mode; subsequently, a split of 100 : 1 (split flow of 200 mL min−1) was set to avoid overloading the chromatogram. The initial oven temperature was 40 °C (2 min hold time), which was then raised to 230 °C at 8 °C min−1 (5 min hold time). Analytes were separated on a DB-FFAP column (30 m × 0.25 mm, 0.25 µm film thickness, J&W GC Columns Agilent Technologies, Santa Clara, CA, USA) using helium as a carrier gas at a constant flow of 2 mL min−1. As for the condensate samples, the effluent was split 1 : 1 towards the MS or the ODP (270 °C). With a delay of 3 min, mass spectra were generated in electron impact (EI) mode at 70 eV for an range of 35–300.
GC–MS/O analysis allows for the simultaneous detection of odorants via MS and human olfaction. GC–O and GC–MS/O are widely applied in the field of odor and aroma research for the detection and identification of odorous substances (Brattoli et al., 2013; Hayes et al., 2023; Mahmoud and Zhang, 2024; Strangl et al., 2020).
2.3.3 Compound matching from GC–MS measurements
For both condensates and adsorbates, a homologous series of n alkanes was analyzed under the same chromatographic conditions for the calculation of linear retention indices (RIs) (van Den Dool and Kratz, 1963). For selected samples, a trained expert (“panelist”) from the IVV sensory panel evaluated the odor qualities at the ODP, focusing on odorants up to RI 2600. No illness or olfactory dysfunction was known for the panelist at the time of the assessments. Panel training is conducted on a regular basis (weekly) to test the olfactory ability of the panelists. This includes the recognition and description of various odors (from a total of about 70 odorants) using odorant pens.
Chromatographic data were processed, including determination of RI values, using Automated Mass Spectral Deconvolution and Identification (AMDIS) version 2.73 software (NIST, Gaithersburg, USA) in combination with an in-house RI/MS database of mostly odor-active compounds for compound assignment. An unequivocal compound identification was not conducted. This would make a direct comparison to reference standards necessary, which was not within the scope of the present study. Results were compared to a blank measurement. The best RI/MS matches according to AMDIS, for each extracted peak with RI ± 30 and net match factor ≥70, were considered.
The goal of the analyses is to determine if the chosen sampling point and technique are viable, what components are involved in the sampling atmosphere, and if either condensing or adsorption are favorable for an automated setup.
First results for the condensate preparation and analysis have already been reported in Reimringer et al. (2024b), which is summarized in the following section. For a consistent examination of the extruder exhaust atmosphere, the recorded GC–MS data from the condensates were re-evaluated along with the results from the TD tube samples. In particular, the full substance lists were scrutinized, whereas the preliminary results only covered the most prominent species. This allows for a comparison and optimization of the sampling approach.
3.1 Gravimetry and water content determination
Gravimetry confirmed the visual observation that condensates only occurred in the last two cooling traps, with only the last one at 0 °C showing significant mass gain. In inline mode, a condensation rate of up to 85 mg kg−1 of processed material was determined. In bypass mode, however, no relevant mass transport took place due to the flow restriction by the TD tube.
Water content of inline samples no. 34 and no. 44 was determined as 75.6 % and 79.7 %, respectively, hinting at the stripping of volatiles along with the water during hot-air drying of the material in experiment no. 4, as reported in our previous work (Reimringer et al., 2024b).
3.2 GC–MS/O results for the condensates
In the GC–MS analysis reported in Reimringer et al. (2024b), the presence of various odor-active volatile contaminants in the distillates has been deduced. Software-based processing led to suggestions of numerous compounds of different compound classes, volatilities, and odor characteristics. This includes alcohols (butan-1-ol, pental-1-ol), organic acids (e.g., acetic acid, pentanoic acid, octanoic acid), and ketones (2,3-pentanedione, heptan-2-one). In the parallel GC–MS/O assessment, up to 52 odor-active regions were noted in the distillate from trap no. 34 (experiment no. 3) by the panelists. In addition to typical odorants (e.g., butanoic acid), a wide range of odor qualities was covered, from sweaty and cheesy-smelling to earthy, moldy, fruity, and coconut-like. These odor qualities were found to correspond to odors reported for plastics recycling in the literature (Prado et al., 2020; Strangl et al., 2018, 2020).
3.3 GC–MS/O results for the adsorbates
Analysis of the TD tubes led to the detection of numerous compounds. A screening run from sample no. 4c resulted in a TIC plot with high peak intensities and an overloaded chromatogram, indicating the high potential of the setup for volatiles' trapping and analysis. The following section focuses on the analysis of the remaining Tenax® tubes (no. 3a, no. 3c, and no. 4a). For those, the 100 : 1 split ratio was applied (see Sect. 2.3.2).
In each of the three samples, more than 70 compounds were detected by software-based processing in combination with an in-house volatile database. Figure 2 shows the chromatograms of samples no. 3a and no. 3c, which appear to be quite similar, with a tendency for higher peak intensities for sample no. 3c. As these samples have been taken from the extruder exhaust atmosphere of the same material batch but approximately 1 h apart, some variation must be expected. Actually, a perfect match of both samples would not be desirable, as in the target application, such variations will be evaluated to assess the inhomogeneous quality of the processed material stream.
Table 2 gives an overview of the detected substances in distillate no. 34 and adsorbates no. 3a and no. 3c using software-based database matching. Database matching was conducted using MS and RI data, and best matches were considered. Systematic comparison and evaluation are challenging due to a large number of overlapping peaks. Of the tentatively detected peaks in either of the two tube samples, more than half can be detected in both samples (57 out of 95). However, comparing the detected substances from sorbent tubes and condensates gives a different result: it turns out that only a small fraction of the substances (10 of a total of 108) can be found in all three samples as a first hit. Besides the intricate peak assignment for the complex chromatograms, it is very likely that the two sampling methods do not represent the same proportion of the total volatile compounds. This can be expected to some extent, as each sampling method always tends to be selective about certain compounds or compound groups. It should also be noted that certain substances or substance groups may be distinguished within the context of sample work-up and analytical processing, e.g., through the choice of solvent in the case of condensate samples or the use of a solvent vent for the sorbent tubes. In some applications, like the one presented, the different behavior of condensate and sorbent sampling can be used as an advantage as very low boiling substances, particulate matter, and humidity need to be stripped from the sample prior to analysis. The low number of matching detections and the fact that only one of the four condensate traps (see Fig. 1) yielded sufficient condensate for analytics complicate quantitative analysis of the results but demonstrate the need for adaptation of the sampling setup.
Table 2Compounds detected in experiment no. 3 by software-based database matching using RI and MS data, ordered by observed retention time. Given literature RIs for the FFAP column from Leibniz DB (Kreissl et al., 2022), except † taken from NIST WebBook 185 (NIST Chemistry WebBook, SRD 69, 2025). Matches with RI ± 30 and a net match factor of ≥70 (weak match ◊) and ≥80 (good match ⧫) in comparison to database entries were considered. Compounds are not identified unambiguously, and isomers may not be distinguishable from one another. ▪ Compounds found in all samples. □ Compounds found in both adsorbate samples.

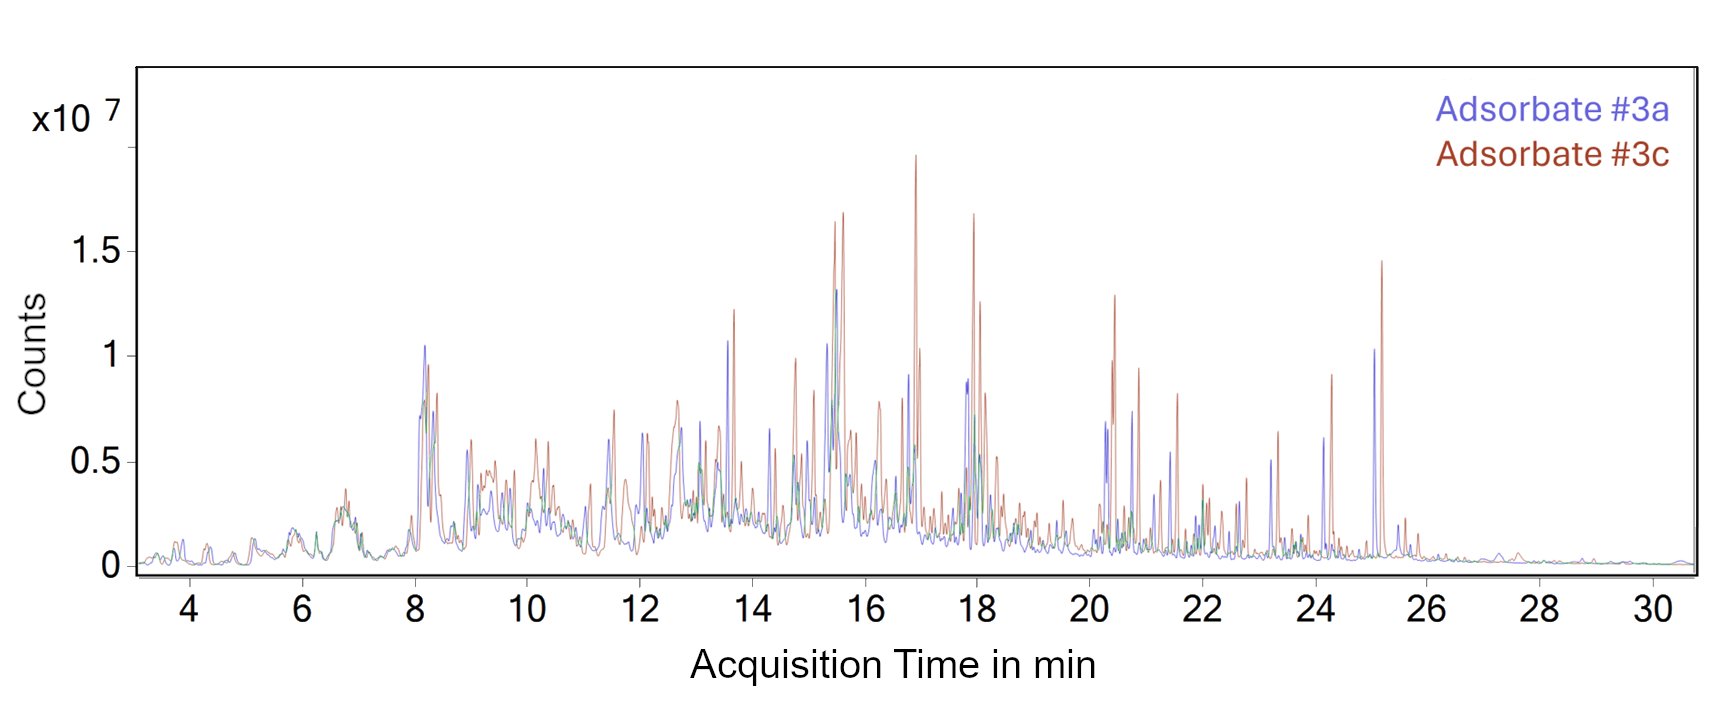
Figure 2Comparison of TIC scans for TD tube samples no. 3a and no. 3c, sampled from the processing of untreated recycled polypropylene in inline mode.
GC-coupled olfactory detection (GC–O) via GC–MS/O with an attached odor detection port (ODP) resulted in more than 45 odor-active regions for samples no. 3a and no. 4a. Odor detection was performed with a split ratio of 100 : 1 at the injector before the GC column and a 1 : 1 split for ODP and MS. Over the course of this, with a total of 63 odor-active regions, more odorous compounds were detected at the ODP in sample no. 3a (untreated PP) compared to 48 in no. 4a (pre-dried PP). It has to be noted that odor detection was only conducted for one tube per sample by one panelist; therefore these results can only be used to illustrate tendencies. Table 3 lists substances from the GC–O analysis of sample no. 3a with “OK” or even “good” matchings regarding their retention indices and database odor impression.
Table 3Odor qualities detected via GC–MS/O in sample no. 3a and suggested compounds matching with database RI and for which comparable odor impressions are reported in the literature (Kreissl et al., 2022). Database matches are based on RI and MS data using software-based evaluation and in-house database. Weak software matches (net match factor ≥70 and <80) are in italics.
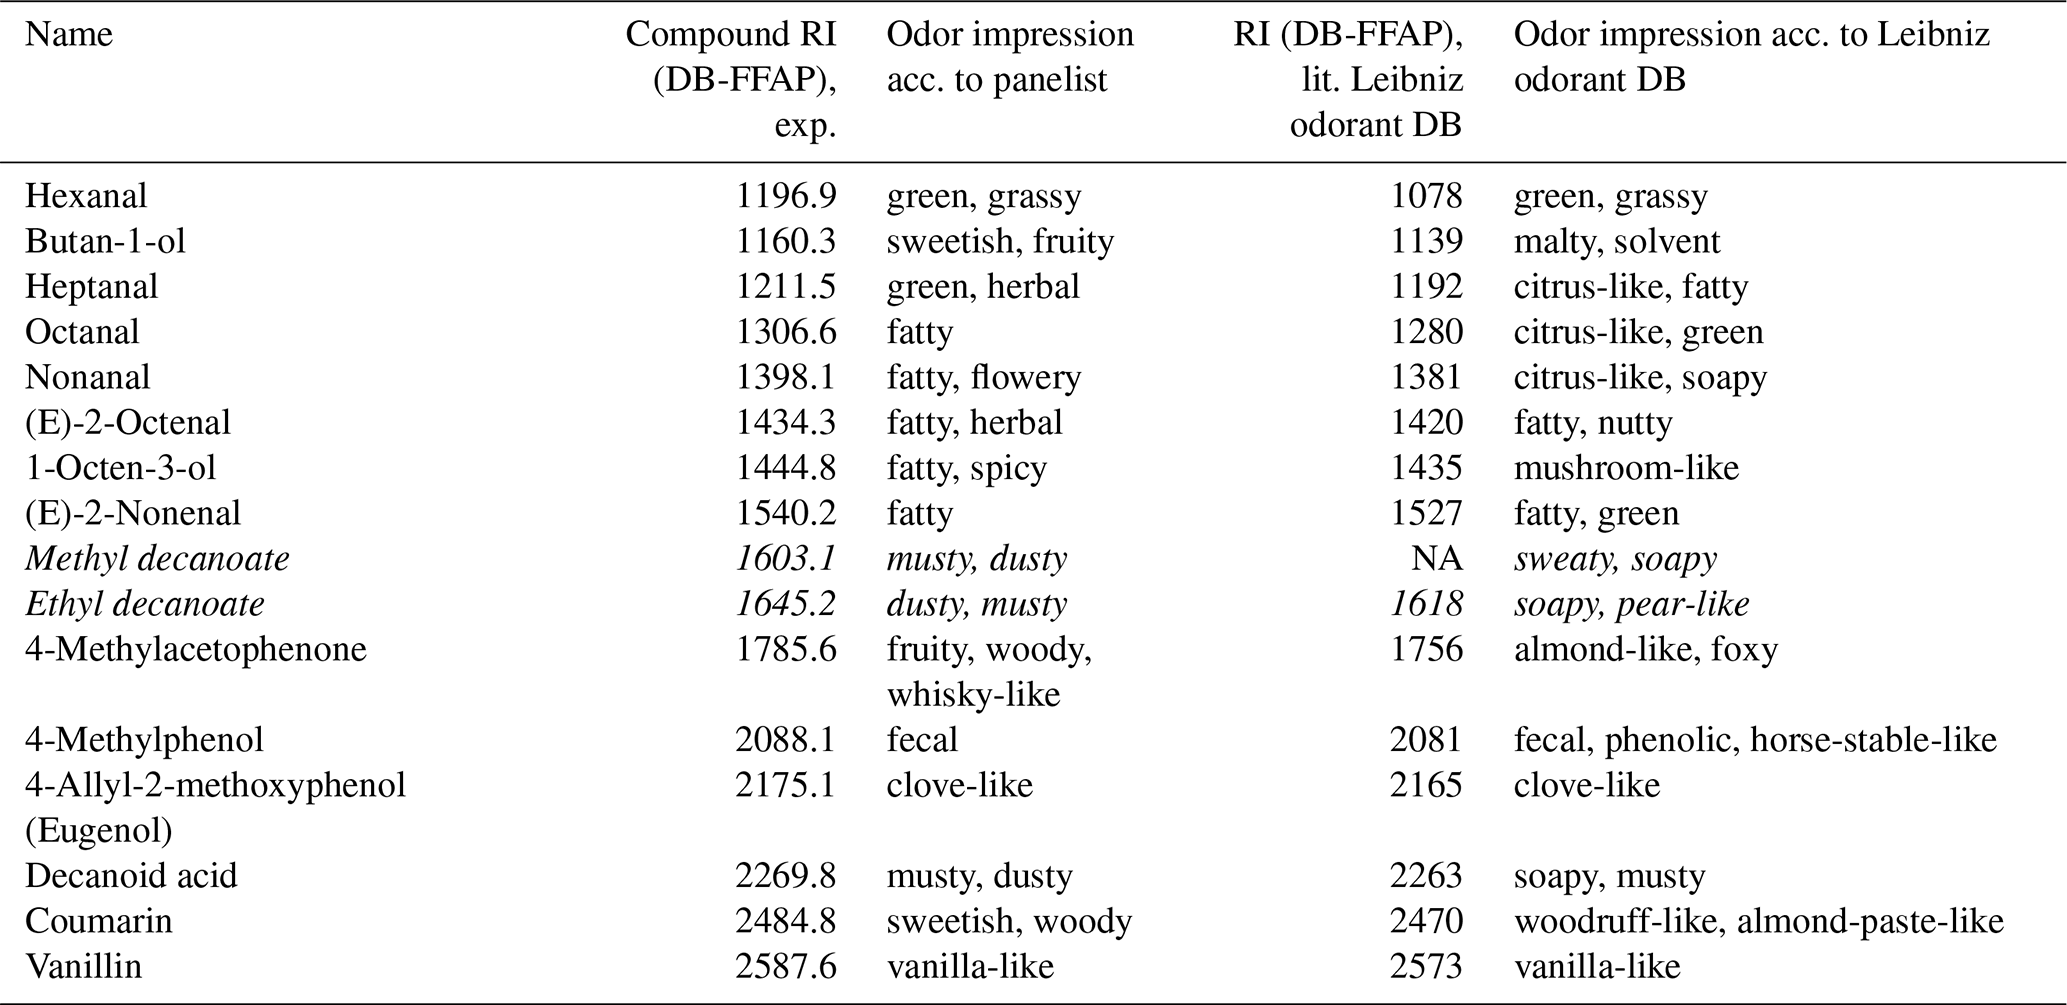
NA – not available.
The large numbers of compounds (108) and odors (63) detected in the processed condensates and TD samples, many of which are typical of recycled plastics, suggest that (a) an extraction of relevant samples from the vacuum degassing line is feasible, (b) the general technique of sampling condensates and adsorbates at the given temperatures is working, and (c) the TD tube adsorbs relevant compounds when placed behind a cooling trap.
The results do not clearly imply a specific sampling method, and the dense chromatograms do not allow for a quantitative analysis of the distribution of compounds between the two sampling methods. However, some qualitative findings can be derived: of the four cold traps used, only the one at the lowest temperature is required, as only this one contained a significant proportion of the emissions as sorbate (see Sect. 3.1). Sampling on Tenax® TA appears to be well suited, but the applied sampling time of 30 min is clearly too long, as even with a split ratio of 100 : 1 the measurement is still rather overloaded (see Fig. 2). Shorter sampling times are beneficial as the intended application requires rapid repeatability of measurements.
For a qualitative assessment of the sampling results, a systematization of the substances according to volatility and vapor pressure seems advisable: a comparison of the compound suggestions for the detected peaks shows that the nonpolar, highly volatile substances, e.g., saturated and unsaturated C6–C9 aldehydes, are very well represented in the Tenax® TA sampling, while they are hardly found in the condensate. It is important to retrieve these compounds as the unsaturated aldehydes in particular are very odor active, and some contribute significantly to the typical odor of PP recyclates (Strangl et al., 2021). Therefore, the usage of a sorbent sampling seems inevitable. However, in our study, short-chain carboxylic acids are poorly represented in the Tenax® TA approach followed by TD–GC–MS according to the software-based processing, although they are clearly represented in the condensate and are also typical of plastics (Cabanes et al., 2020). Both findings are not surprising, since Tenax® TA is a nonpolar sorbent that has a low breakthrough volume for carboxylic acids (Tenax® TA breakthrough volume data, 2025), which might lead to underrepresentation of these compounds during sampling. On the other hand, the relatively volatile aldehydes should not be well retained in the cooling trap, especially since the condensate contains plenty of water and is therefore a rather polar matrix.
Although an optimized sampling procedure must henceforth be the subject of further investigations, we can still derive a much better view of the suitable setup. From the laboratory analyses, it can be noted that sample preparation from the condensates is a complex and labor-intensive process, whereas TD tube analysis is strongly affected by adsorbent capacity and sampling volume. The 100 : 1 split ratio necessary to obtain manageable GC–MS results from the 30 min sampling time used in the first series of experiments clearly shows that much lower gas volume and therefore much shorter sampling periods seem possible – and upon further reflection, even inevitable.
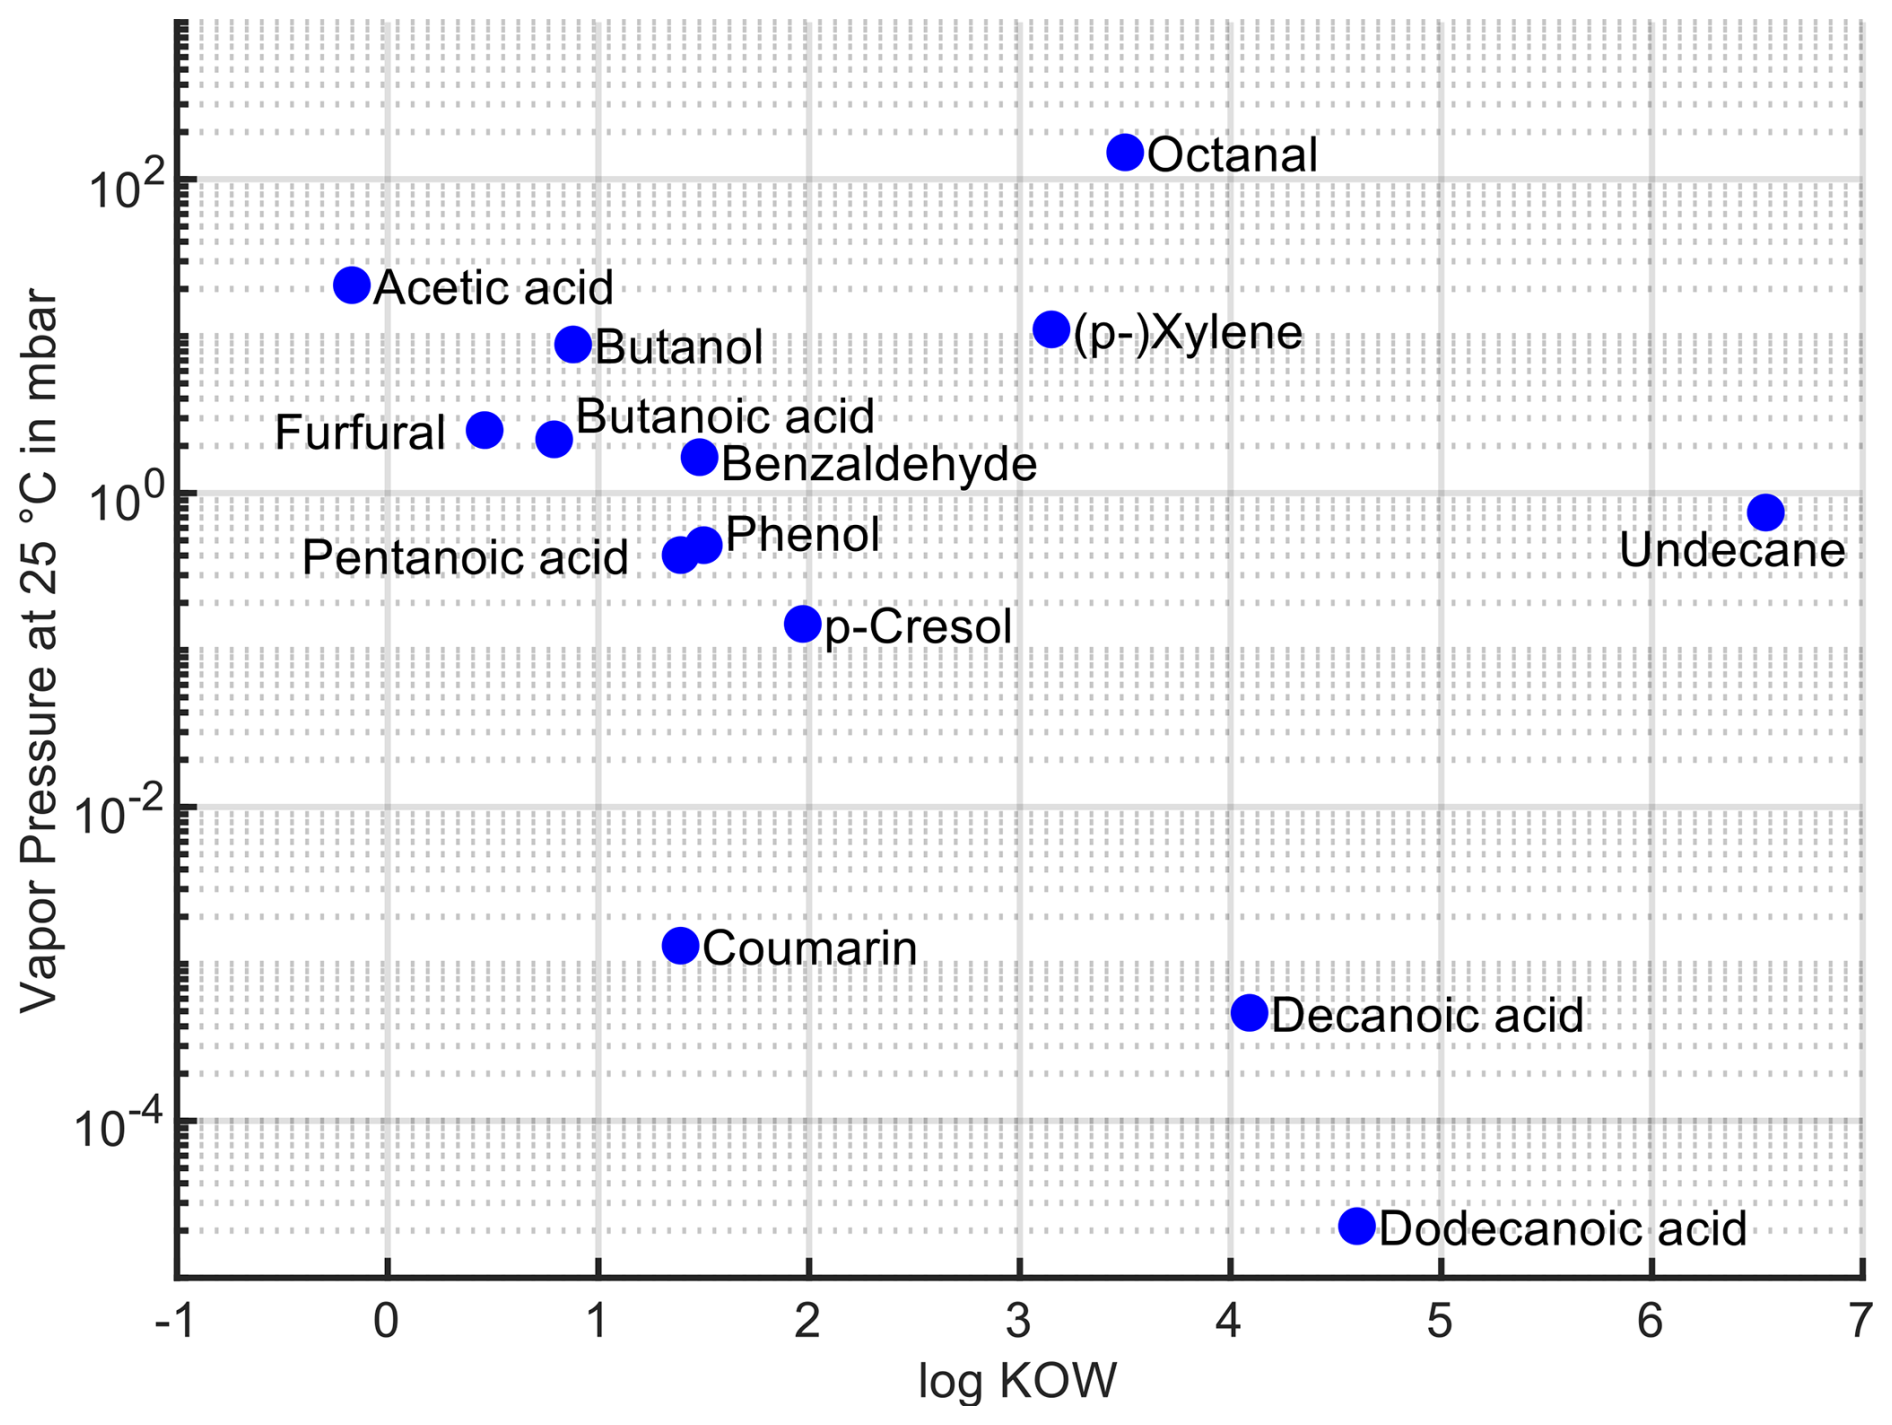
In order to get a better understanding of the requirements of the sampling method, Fig. 3 illustrates prominent compounds from the analysis of experiment no. 3, arranged regarding their respective water solubility and vapor pressure; the underlying compound data have been collected from various sources (Agency for Toxic Substances and Disease Registry (ATSDR), 2007; Ambrose et al., 1975; Baccanari et al., 1968; Daubert, 1996; Espinosa Díaz et al., 1999; ECHA, 2024; NIST, 2025; Lide, 1996; Perry et al., 1984; Yaws and Satyro, 2015). This representation illustrates the broad spectrum covered by the relevant substances. For substances with high water solubility and volatility in particular, any water separation strategy will be challenging as these substances will not be as effectively sampled as others or be lost in purging steps. The proposed solution is to use a nonpolar adsorbent (Tenax® TA) and to sample well below the breakthrough volume so that very little water will be available in the desorbed specimen and thus will not interfere with the water-sensitive GC–MS setup.
For the implementation of the sampling technique proposed above, the sampling setup from Fig. 1 has to be adapted. One condensation trap would seem beneficial to assist in holding back water and can also be equipped with particle-retaining material. Access to the TD sampling tube has to be controlled by technical means to ensure accurate timing, as the high sample loads found in the results call for a significantly reduced sampling time in order to fulfill the above requirement of sampling below the breakthrough volume as well as the need for high time resolution in the process monitoring application. As a rough estimate, the sampling time used in the above experiments divided by the split factor in the laboratory analyses gives a target sampling time of approx. 18 s. Thus, even timing variations in sample line switching of the order of 100 ms would result in significant error.
For an extension towards a fully automated sampling setup suitable for prolonged periodic operation, strategies for purging the trapped condensates are crucial in order to not provide a secondary sample-and-release system through interaction of the trapped watery condensates with the sampling atmosphere. This especially concerns low-KOW substances. On the sample acquisition side, either the TD tube must be changed between sampling periods or an in situ thermal desorption technique has to be applied to further transfer the collected substances to an attached measurement device. Regarding the multitude of substances involved and the goal of close real-time monitoring of contaminants, this is a favorable solution provided that the measurement device has sufficient sensitivity and temporal resolution to align measurements and sampling periods.
It has been successfully demonstrated that volatile contaminants can be sampled from a PP recycling process at the vacuum degassing of a compounding extruder. Laboratory analysis with GC–MS/O has confirmed that relevant odorous compounds can be transferred with the tested sampling setup. This worked well for the inline sampling mode; however, at typical application temperature and pressure, the alternative bypass sampling strategy turned out to be applicable for condensation traps only, not for packed adsorption tubes. Condensate and adsorbate samples have both been analyzed, with specific GC methods developed for each. Based on this, a systematic consideration of the relevant compounds and their respective properties shows that in the wide spectrum of volatility and polarity, short sampling periods are essential for any quantitative approach to the measurement problem; the results obtained in this work hint at sampling periods of less than 30 s. This way, highly volatile polar compounds and less volatile nonpolar compounds can be balanced in adsorption sampling to feed a customized measurement system. The sampling setup can be adapted and extended towards an integrated system for online operation applying the considerations laid out above.
Future work is necessary to characterize an integrated sampling and analysis system. Subsequent research will cover further development of the setup and operation methods in the context of the real-world target application.
Research data are available upon request to the authors.
WR designed and built the sampling setup, carried out the on-site sampling, created the map for compound interpretation, and developed a system concept for automated sampling and measurement. HH devised, ran, and evaluated the laboratory analyses of the samples. TS advised on setup, experimental design, laboratory analysis, and interpretation. WR wrote most of this article; HH contributed to the analytics sections; and WR, HH, and TS revised the paper.
The contact author has declared that none of the authors has any competing interests.
Publisher's note: Copernicus Publications remains neutral with regard to jurisdictional claims made in the text, published maps, institutional affiliations, or any other geographical representation in this paper. The authors bear the ultimate responsibility for providing appropriate place names. Views expressed in the text are those of the authors and do not necessarily reflect the views of the publisher.
We would like to thank Lukas Seifert and his team at the IKV compounding lab at RWTH Aachen for their support with the on-site sampling experiments. Furthermore, we are grateful to Hannah Busch and Michael Czerny for their support in the laboratory and with the GC–MS/O analyses.
This research was funded by the German Federal Ministry of Research, Technology and Space (BMFTR) under grant number 033KI116.
This paper was edited by Bernhard Jakoby and reviewed by two anonymous referees.
Agency for Toxic Substances and Disease Registry (ATSDR): Toxicological Profile for Xylene, Agency for Toxic Substances and Disease Registry (US), Atlanta (GA), PMID: 38412207, 2007.
Ambrose, D., Connett, J. E., Green, J. H. S., Hales, J. L., Head, A. J., and Martin, J. F.: Thermodynamic properties of organic oxygen compounds 42. Physical and thermodynamic properties of benzaldehyde, The Journal of Chemical Thermodynamics, 7, 1143–1157, https://doi.org/10.1016/0021-9614(75)90035-X, 1975.
Baccanari, D. P., Novinski, J. A., Pan, Y.-C., Yevitz, M. M., and Swain, H. A.: Heats of sublimation and vaporization at 25° of long-chain fatty acids and methyl esters, Trans. Faraday Soc., 64, 1201–1205, https://doi.org/10.1039/TF9686401201, 1968.
Brattoli, M., Cisternino, E., Dambruoso, P. R., De Gennaro, G., Giungato, P., Mazzone, A., Palmisani, J., and Tutino, M.: Gas Chromatography Analysis with Olfactometric Detection (GC-O) as a Useful Methodology for Chemical Characterization of Odorous Compounds, Sensors, 13, 16759–16800, https://doi.org/10.3390/s131216759, 2013.
Cabanes, A., Strangl, M., Ortner, E., Fullana, A., and Buettner, A.: Odorant composition of post-consumer LDPE bags originating from different collection systems, Waste Management, 104, 228–238, https://doi.org/10.1016/j.wasman.2020.01.021, 2020.
Cook, E., Derks, M., and Velis, C. A.: Plastic waste reprocessing for circular economy: A systematic scoping review of risks to occupational and public health from legacy substances and extrusion, Science of The Total Environment, 859, 160385, https://doi.org/10.1016/j.scitotenv.2022.160385, 2023.
Daubert, T. E.: Physical and Thermodynamic Properties of Pure Chemicals, 6th edn., Taylor & Francis, 292 pp., ISBN 978-1-56032-491-1, 1996.
ECHA: Information on Chemicals, https://echa.europa.eu/information-on-chemicals, last access: 13 December 2024.
Espinosa Díaz, M. A., Guetachew, T., Landy, P., Jose, J., and Voilley, A.: Experimental and estimated saturated vapour pressures of aroma compounds, Fluid Phase Equilibria, 157, 257–270, https://doi.org/10.1016/S0378-3812(99)00016-3, 1999.
Fischer, K.: Neues Verfahren zur maßanalytischen Bestimmung des Wassergehaltes von Flüssigkeiten und festen Körpern, Angewandte Chemie, 48, 394–396, https://doi.org/10.1002/ange.19350482605, 1935.
Hayes, J. E., Barczak, R. J., “Mel” Suffet, I., and Stuetz, R. M.: The use of gas chromatography combined with chemical and sensory analysis to evaluate nuisance odours in the air and water environment, Environment International, 180, 108214, https://doi.org/10.1016/j.envint.2023.108214, 2023.
Kreissl, J., Mall, V., Steinhaus, P., and Steinhaus, M.: Leibniz-LSB@TUM Odorant Database, Version 1.2. Leibniz Institute for Food Systems Biology at the Technical University of Munich, Freising, Germany, https://www.leibniz-lsb.de/en/databases/leibniz-lsbtum-odorant-database (last access: 23 February 2026), 2022.
Lide, D. R.: CRC Handbook of Chemistry and Physics, 76th edn., CRC Press, Boca Raton (FL), ISBN 978-0-8493-0476-7, 1996.
Mahmoud, M. A. A. and Zhang, Y.: Enhancing Odor Analysis with Gas Chromatography–Olfactometry (GC-O): Recent Breakthroughs and Challenges, J. Agric. Food Chem., 72, 9523–9554, https://doi.org/10.1021/acs.jafc.3c08129, 2024.
NIST: NIST Chemistry WebBook, SRD 69, https://webbook.nist.gov/chemistry/, last access: 18 November 2025.
Nordahl, S. L. and Scown, C. D.: Recommendations for life-cycle assessment of recyclable plastics in a circular economy, Chem. Sci., 15, 9397–9407, https://doi.org/10.1039/D4SC01340A, 2024.
Perry, R. H., Green, D. W., and Maloney, J. O.: Perry's Chemical Engineers' Handbook, 6th edn., McGraw-Hill, New York, ISBN 978-0-07-049479-4, 1984.
PPWR: Regulation (EU) 2025/40 of the European Parliament and of the Council of 19 December 2024 on packaging and packaging waste, amending Regulation (EU) 2019/1020 and Directive (EU) 2019/904, and repealing Directive 94/62/EC (Text with EEA relevance), https://eur-lex.europa.eu/eli/reg/2025/40/oj (last access: 23 February 2026), 2024.
Prado, K. S., Strangl, M., Pereira, S. R., Tiboni, A. R., Ortner, E., Spinacé, M. A. S., and Buettner, A.: Odor characterization of post-consumer and recycled automotive polypropylene by different sensory evaluation methods and instrumental analysis, Waste Management, 115, 36–46, https://doi.org/10.1016/j.wasman.2020.07.021, 2020.
Reimringer, W., Haug, H., Seifert, L., and Sauerwald, T.: A4.4 – Probennahmevorrichtung zur Kontaminantenüberwachung im Polyolefinrecycling, 22. GMA/ITG Fachtagung Sensoren und Messsysteme 2024, Nürnberg, 108–111, https://doi.org/10.5162/sensoren2024/A4.4, 2024a.
Reimringer, W., Haug, H., Seifert, L., and Sauerwald, T.: Sampling Apparatus for the Process Monitoring of Contaminants in Polyolefin Recycling, in: 2024 IEEE International Instrumentation and Measurement Technology Conference (I2MTC), 2024 IEEE International Instrumentation and Measurement Technology Conference (I2MTC), 1–6, https://doi.org/10.1109/I2MTC60896.2024.10560580, 2024b.
Strangl, M., Schlummer, M., Maeurer, A., and Buettner, A.: Comparison of the odorant composition of post-consumer high-density polyethylene waste with corresponding recycled and virgin pellets by combined instrumental and sensory analysis, Journal of Cleaner Production, 181, 599–607, https://doi.org/10.1016/j.jclepro.2018.01.137, 2018.
Strangl, M., Ortner, E., Fell, T., Ginzinger, T., and Buettner, A.: Odor characterization along the recycling process of post-consumer plastic film fractions, Journal of Cleaner Production, 260, 121104, https://doi.org/10.1016/j.jclepro.2020.121104, 2020.
Strangl, M., Lok, B., Breunig, P., Ortner, E., and Buettner, A.: The challenge of deodorizing post-consumer polypropylene packaging: Screening of the effect of washing, color-sorting and heat exposure, Resources, Conservation and Recycling, 164, 105143, https://doi.org/10.1016/j.resconrec.2020.105143, 2021.
Tenax® TA Breakthrough Volume Data: https://www.sisweb.com/index/referenc/tenaxta.htm#acetates, last access: 11 June 2025.
van Den Dool, H. and Kratz, P. D.: A generalization of the retention index system including linear temperature programmed gas–liquid partition chromatography, Journal of Chromatography A, 11, 463–471, https://doi.org/10.1016/S0021-9673(01)80947-X, 1963.
VerpackG: Gesetz über das Inverkehrbringen, die Rücknahme und die hochwertige Verwertung von Verpackungen, first published: BGBl. I S. 2234, 2017; last change: BGBl. I, Nr. 294, 2023; effective 1 January 2019.
Yaws, C. L. and Satyro, M. A.: Chapter 1 – Vapor Pressure – Organic Compounds, in: The Yaws Handbook of Vapor Pressure, 2nd edn., edited by: Yaws, C. L., Gulf Professional Publishing, 1–314, https://doi.org/10.1016/B978-0-12-802999-2.00001-5, 2015.