| 21 Jul 2021
The size-of-source effect in thermography
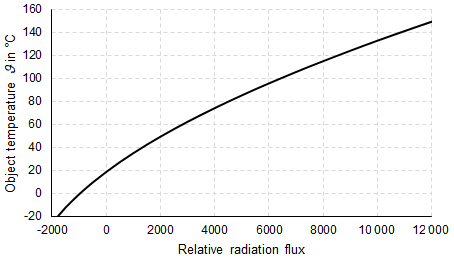
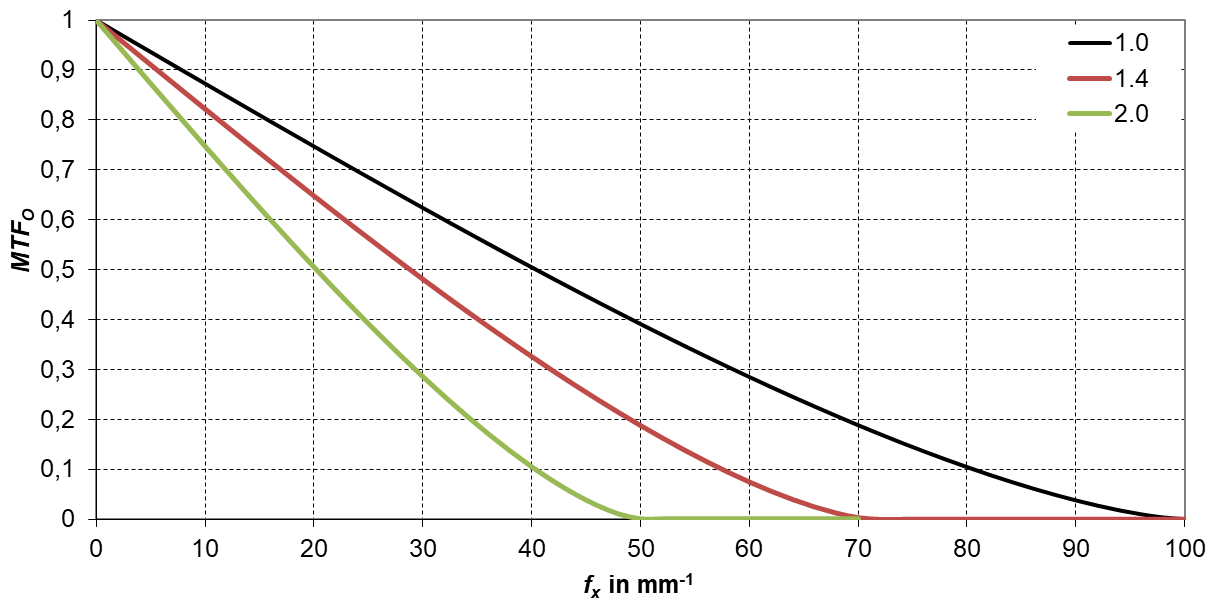
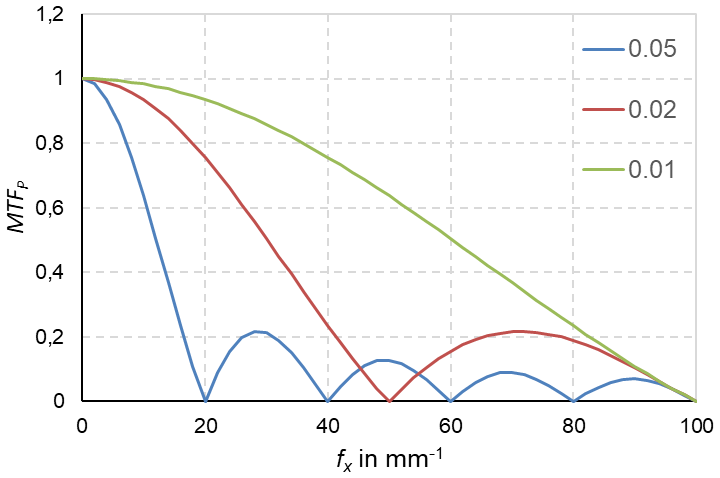
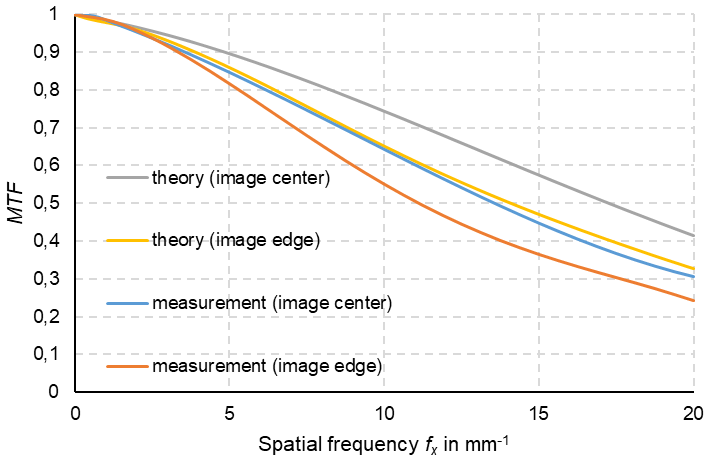
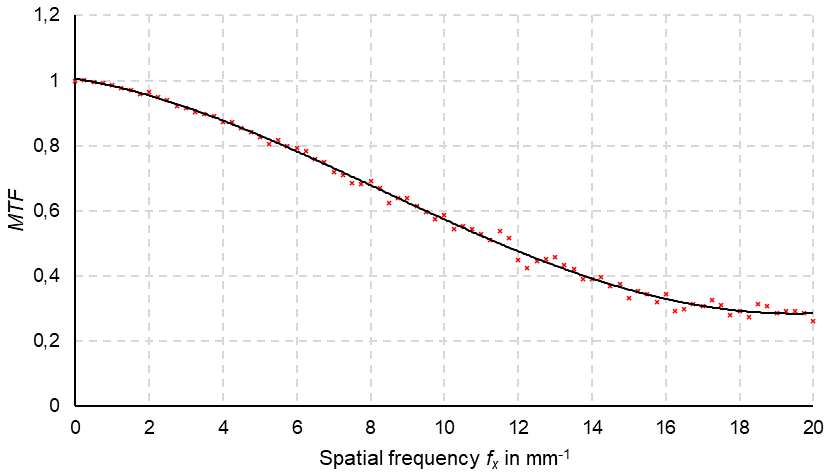
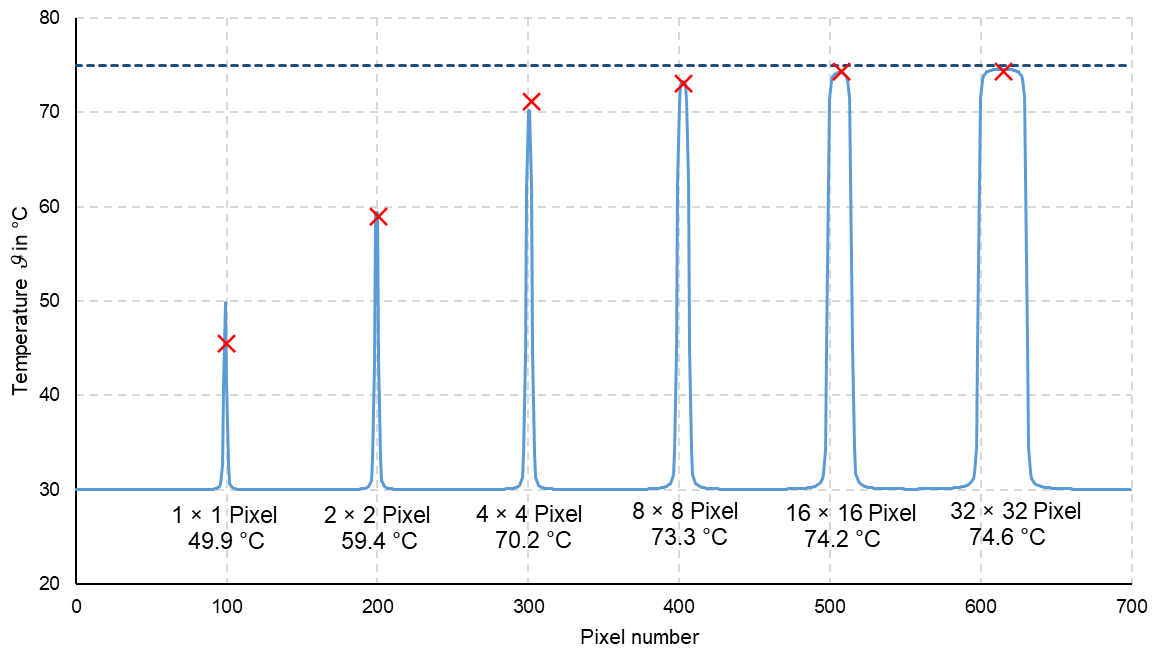
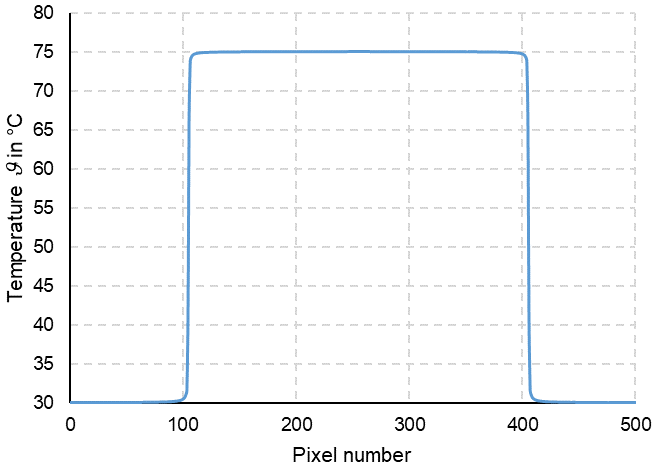
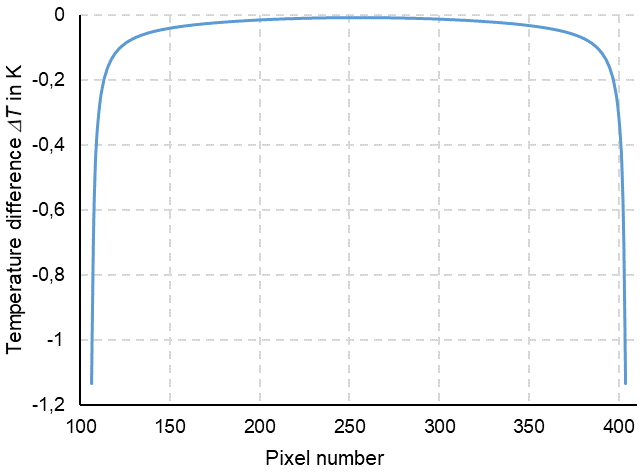
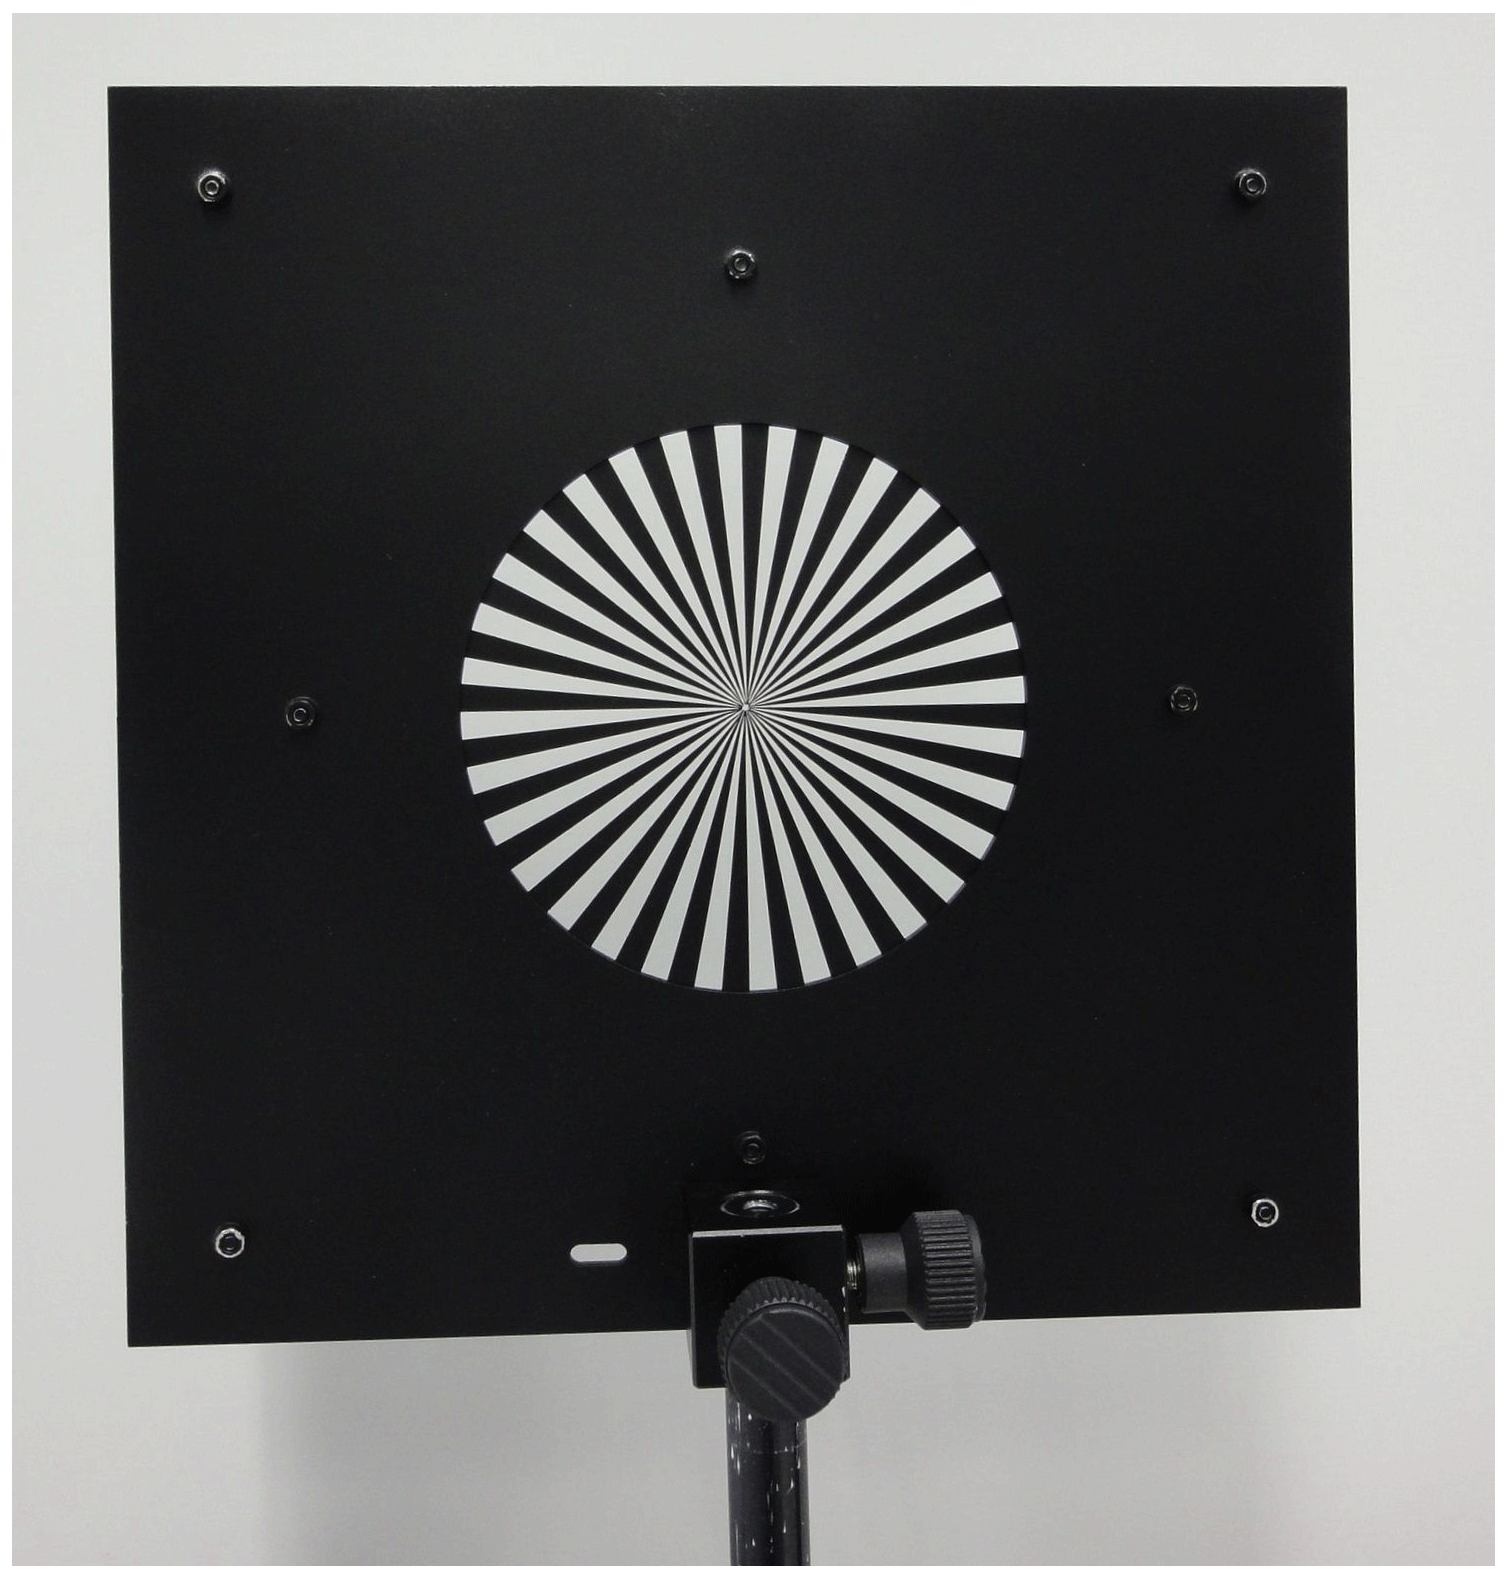
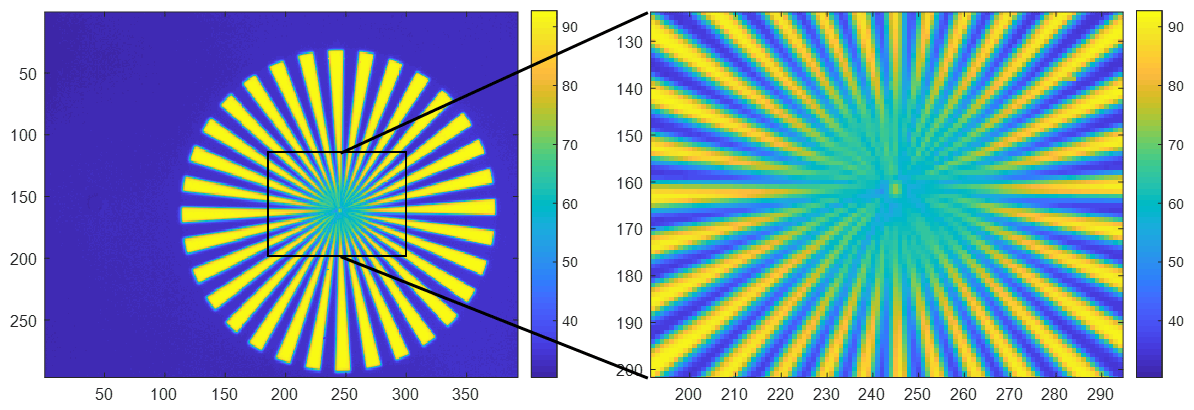
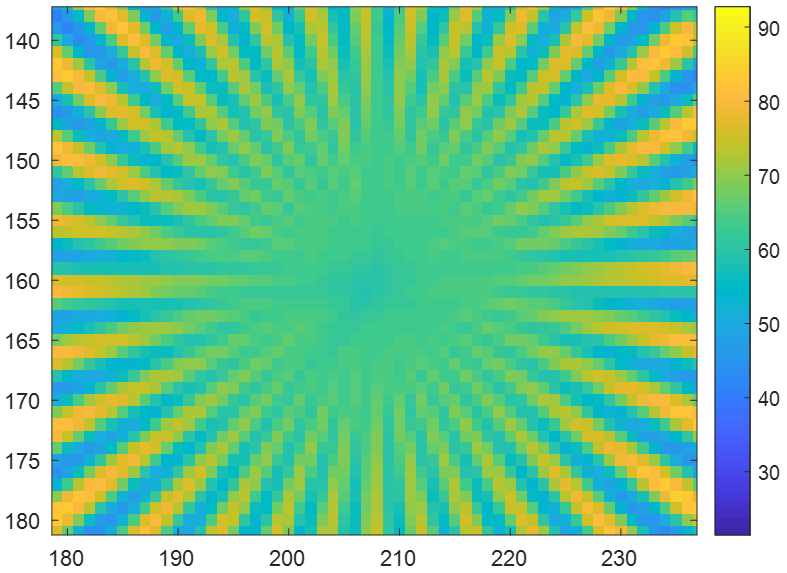
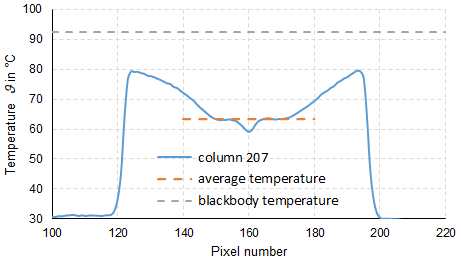
In thermometry, the displayed temperature value of an object depends on the size of the object. This behaviour, also known as the size-of-source effect (SSE), might be a major cause of measurement uncertainty in a thermoscene. The SSE is caused by diffraction, scattering, reflection, aberration and digitization in the optoelectronic propagation path. The influence of diffraction and digitization (sampling and pixelization) can be described advantageously with the modulation transfer function MTF. The system MTF of an uncooled camera is determined by the diffraction in the lens (optical MTF) and the averaging of the radiation over the pixel area (pixel MTF). If the system MTF is known, the contrast reduction and, thus, the SSE can be calculated. Especially with very small objects, e.g. hotspots creating an image covering less than 4 pixel × 4 pixel on the focal plane, the displayed temperatures are much too low. When imaging large objects, such as area blackbodies, not only the edge areas are affected, but also the entire image. Finally, the contrast reduction by the MTF is explained by means of a complex scene (Siemens star).