the Creative Commons Attribution 4.0 License.
the Creative Commons Attribution 4.0 License.
 | 13 Aug 2021
Methods and procedure of referenced in situ control of lateral contour displacements in additive manufacturing
Jakob Hornung
Yu Zou
Tino Hausotte
Additive manufacturing technologies are further developing from prototype to serial production. This trend requires rising challenges to the process-accompanying quality assurance. Optical in situ quality control approaches show great potential to generate accurate measurement data, which are essential for feedback control. If a reliable referencing concept for the layer-by-layer measured data is guaranteed, contour information can be used during the manufacturing to correct occurring geometrical deviations. Within this scientific study, two methods of optical, referenced in situ control of lateral displacements of additive manufactured contours are presented. In the first approach the 2-D contour of the melting pool is analysed in relation to a position-stable reference system implemented in the powder bed. The second approach uses the translucent contour of deeper layers covered with powder as a reference. Within the image evaluation several pre-processing steps like calibration, undistortion, rectification, illumination correction and low-pass filtering are essential for reliable and correct geometric measurements. The following adapted contour detection and position determination of the referenced melting pool contours are based on an extended edge detection algorithm according to Canny (1986). With the evaluation of further manufacturing layers of already lowered powder bed levels, it is possible to specify the influence of powder application on geometrical displacements separately. This is done by a comparison of the position of the detected powder-covered melting pool contours with the previously applied melted region. Consequently a better understanding of lateral contour displacements within the additive manufacturing process is the goal, which is important for a process-accompanying correction of geometrical deviations.
- Article
(5421 KB) - Full-text XML
- BibTeX
- EndNote


Additive manufacturing (AM) processes are being progressively established as new production technologies in industry (Gebhard et al., 2019). They are characterised by an incremental addition of material and differ in their binding mechanisms, manufacturing materials and corresponding processing methods (DIN EN ISO/ASTM-52900, 2015). One of the most distributed industrial AM process is selective laser sintering (SLS). It is also referred to as laser beam melting of polymers (LBM-P) and is examined as a representative of other laser-based process categories of powder bed fusion (PBF) (DIN EN ISO17296-2, 2015). Within the regarded manufacturing process a laser beam with a wavelength of 10.6 µm locally melts the standard polymer polyamide 12 (PA 12) powder layer by layer, until the sliced AM components are built up in the powder bed (Deckard, 1989).

Figure 1Positioning of monitoring systems: (a) off-axis, inside, (b) off-axis, outside, and (c) on-axis, outside the process chamber (Lerchen et al., 2021).
In recent years, due to the successive standardisation and further reduction of manufacturing costs, AM is becoming adopted in industrial production to generate near-net-shape components with high complexities. Comprehensive quality monitoring and control are necessary to make the manufacturing more resource-efficient, timesaving and accurate (Imkamp et al., 2012). A quality monitoring of the entire manufacturing process from pre-, in-, to post-process is recommended (VDI3405, 2014).
Schmitt and Damm (2008) have shown that especially optical in-process and in situ monitoring during the auxiliary process has the potential to generate measurement data with great information content for geometrical quality control. The aim of the scientific study is to present a procedure for contour evaluation and referenced optical in situ control of process-accompanying contour displacements.
For quality control in laser- and powder-based AM processes, a comprehensive referenced monitoring is necessary to realise reliable geometrical measurements. The workpiece contour of each layer has to be extracted by process-accompanying, preferably optical measurement methods in order to ensure appropriate evaluations for process control (DIN EN ISO14406, 2010). In optical evaluation, various approaches based on contour recognition algorithms are conceivable. They differ concerning their fields of applications and specific advantages for reliable edge detection of melting pool contours in the region of interest (ROI) within the powder bed. The following chapters will introduce the state of the art of well-known optical measuring methodologies and contour detection techniques.
2.1 Process-accompanying quality control by optical measurement techniques
Laser-based process monitoring is mainly based on a data acquisition of the emitted and reflected radiation during AM processes (Lott et al., 2011). As already mentioned, especially in-process monitoring and in situ monitoring show great potential for optical quality control to detect the interactions of the laser beam with the powder. Different types of sensors are used, which are mainly categorised in diode- and camera-based, as well as pyrometric and spectrometric systems (Purtonen et al., 2014).
A further classification is usual according to Fig. 1 showing different positioning options of the measuring systems in the manufacturing plant. Galovskyi et al. (2014) and Foster et al. (2015) have presented an approach according to Fig. 1a, which is based on an integration of the optical monitoring system directly into the LBM process chamber. A disadvantage of this arrangement is the direct thermal influence of the process control, which interferes with the recorded measurement data (Galovskyi et al., 2015).
In order to reduce the influencing factors and simplify the setup, most on- and off-axis measurement systems are placed outside the manufacturing chamber. The off-axial monitoring approach allows a direct monitoring of the observation field through a viewing window as shown in Fig. 1b. Nevertheless, the monitoring is limited by the optical properties of the system, the measuring distances, the stability of the external orientation as well as the observation angle (Caltanissetta et al., 2018). Popular off-axis sensors are single charged coupled devices (CCDs), complementary metal oxide semiconductors (CMOS) and photodiodes (Purtonen et al., 2014). These sensors are used in different configurations. In Foster et al. (2015) the monitoring system is directly aligned on the powder bed for an evaluation of the powder application quality. Further applications with an additional projection unit are used as fringe projection systems to obtain geometrical information of the melting pool (Land et al., 2015; Zhang et al., 2016). In contrast to the direct observation of visible effects, photodiodes, spectrometers and pyrometers are used to transfer the incoming light or heat radiation into an electrical signal for further analysis of intensities and wavelength spectra (Purtonen et al., 2014).
There are also photodiodes and high-speed camera configurations, which are integrated coaxially in the beam path of the laser as illustrated in Fig. 1c (Kruth and Mercelis, 2009). This configuration allows a detection of the melting spot and a tracking of the melting path during the process (Lott et al., 2011; Craeghs et al., 2011). Another application field of on-axis image processing is optical coherence tomography (OCT). This optical on-axis imaging technique is based on low-coherence interferometry and allows an evaluation of the melting pool surface, as well as its depth and heat distribution (Gardner et al., 2018).
To obtain correct geometrical measurement, all above-mentioned optical measuring systems have to be calibrated, aligned and focused on the melting pool. After 2-D image acquisition, the correction of lens and perspective distortions are crucial steps for the subsequent image processing. Besides, illumination adaption and filter concepts are also essential for a high image quality (Zur Jacobsmühlen et al., 2016). These influences of image pre-processing are basic for the following extraction of the relevant image information by contour detection.
2.2 Conventional approaches of contour detection
Several approaches of image processing are available for contour evaluation. In addition to common optical 3-D methods, which are for example based on photogrammetry (Andresen, 1991; Li and Gruen, 1997; Luhmann, 2018), 2-D procedures are still employed in certain applications for contour analysis. Thus, 2-D contour evaluation of the layer-by-layer recorded installation space level in AM is also used in the following investigations in order to be able to provide fast and simple information about the melting pool for subsequent control loop control by means of in-process measurements.
However, only a few image processing approaches are suitable for a reliable contour analysis in AM, due to difficult process-accompanying environmental conditions. Challenges for contour detection and a subsequent evaluation are especially inhomogeneous optical conditions due to irregular illuminations in the processing chamber as can be seen in Fig. 2 (Heinl et al., 2018a).
A clear assignment of the melt pool edges in the powder bed is thus difficult especially for white polymer powders because of weak contrasts, which complicate an unique gradient determination. A further problem for optical evaluation is diffuse light scattering and refraction by the powder. The process-related phase transformations of the powder into the molten state cause additional changes of the surface roughness and an altered reflective behaviour (Heinl et al., 2018b).
In order to address these challenges, some conventional image processing approaches for contour detection are introduced. Jähne (2005) categorises different image segmentation methods into four principles, which are based on pixel, region, edge, and model segmentation. In the following these image segmentation methods are introduced.

Figure 2Inhomogeneous optical conditions in the ROI (e.g. shadows, low contrast) (Heinl et al., 2018a).
Pixel-oriented methods such as thresholding analyse grey values of every single pixel to segment the images into binary regions. Thresholding is widely used to generate binary images from greyscale images in various image processing applications such as automatic target recognition using target region outline descriptors (Anagnostopoulos, 2009) or medical imaging (Doelken et al., 2008). This method is generally classified into parametric and nonparametric types. Parametric approaches assume that the grey-level distribution of images is based on a Gaussian distribution. Nonparametric methods classify each image pixel into two categories based on discriminating criteria (Zhang and Wu, 2011). Basic thresholding is a simple method for contour detection but is not always sufficient in the field of AM because it is not easy to choose optimal discriminating criteria.
In contrast, to the pixel-based method focusing on each image point, region-oriented segmentations analyse grey values in contiguous homogeneous regions. For example, the pyramid linking method is used by (Burt, 1984) to allocate and to segment an image into different regions. However, this region-based method is susceptible to ambiguous segmentations that are found at the same time.
Edge-oriented methods search for discontinuities in the image. These methods are based on the fact that the position of an edge is characterised by the maximum value of the first-order derivative or a zero crossing of the second-order derivative. One of the most commonly used edge detection algorithms is the Canny edge detection. Canny (1986) states that his algorithm has not only the aim to detect and localise edges, but also to register exactly one response per single edge. An optimal filter has to be adapted to corresponding noisy signals. This filter is approximated in a further step by the first derivative of a Gaussian function. For images that are regarded as two-dimensional signals, the filter is adapted accordingly. To get only one response for a real edge, a non-maximum suppression is applied. Local maxima of the absolute values of the gradients are defined as edges. By comparing them with the values of neighbouring pixels, the edges are adjusted to a thickness of one pixel. Additionally, two adaptive threshold values T1 and T2 are defined. All edges with a gradient smaller than T1 are deleted, whereas the pixels with gradients between T1 and T2 are only deleted if they are not connected to an edge pixel with a gradient greater than T2 (Canny, 1986).
The three mentioned segmentation methodologies have the focus on local image information in common, while model-based techniques are based on a contour detection of the target object in the whole image. Due to the limitation on the connectivity and closeness of the detected edges by the Canny algorithm, also model-based methodologies such as the Hough transform are possible to extract a complete geometric contour with a given mathematical model. The Hough transform was initially invented and patented by Hough and Arbor (1962). This method converts a feature recognition problem in the image space to a mathematical problem in the parameter space. Originally used as a line detector based on maps, the Hough transform can exemplarily be adopted to detect straight structures as roads in the images (Inigo et al., 1984). The scope of application can also be extended to other mathematical models such as circular and other geometrical shapes, which are used for example in medical imaging, geophysical applications, motion detection up to remote sensing (Kimme et al., 1975; Cooper, 2006; Mukhopadhyay and Chaudhuri, 2015). However, the model-based segmentation is not universally applicable with AM, especially when the desired additive contours are complex and cannot be described by a mathematical freeform model.
In total, the requirements, efforts and the required quality of the measurement data have to be specified precisely and adapted to the respective application in order to achieve the desired aim of AM process monitoring. As examined by Heinl et al. (2018a) Canny edge detection is suited to meet the requirements of in-process evaluation in the AM process, due to its adaptable implementation and reliable results.
An essential component of the experimental setup is an off-axis in situ monitoring system implemented in an EOS P380 experimental LBM-P research plant. It is used for data acquisition layer by layer. In addition, four reference pipes are integrated into the powder bed, which serve as a reference system and obtain it to shorten the measuring circuit. The modular referencing setup is necessary for process-accompanying referenced in situ control of lateral contour displacements in AM.
3.1 Reference system integrated in powder bed
For a comprehensive evaluation of manufacturing and measuring deviations, a uniform reference system is needed. It is necessary to correlate geometric contour displacements of individual layers in relation to each other and to obtain a reliable geometrical measurement technology.
Based on a new developed referencing approach of Lerchen et al. (2021) with four reference quartz glass pipes integrated in the powder bed, the measuring circuit of the in situ detection is shortened. As a consequence, the measuring results are less susceptible to thermal and mechanical length changes of individual components along the measuring circuit and the resulting changes of the external orientation of the monitoring system. The new referencing approach ensures improved measurement accuracy compared to conventional referencing approaches, which are mainly based on referencing the frame of the building chamber or additional manufactured AM reference markers in the powder bed (Cooke and Moylan, 2011; Zur Jacobsmühlen et al., 2014). The reference pipes delimit the edge area of the ROI and serve as a stable reference system over all layers of the LBM-P process. To ensure reproducible detection of the reference positions, the contrast of the pipes to the surrounding powder bed is additionally improved by an internal LED illumination. The simultaneous imagewise acquisition of the reference positions and melting pool contours layer by layer is an essential basis for the developed methods of reliable in situ analysis of individual lateral contour displacements in Sect. 4 (Lerchen et al., 2021).
3.2 Optical monitoring system for in situ detection
The optical monitoring system consists of a monochrome, 26-megapixel CCD camera of the type Genie™ NanoXL-M5100. It is positioned off-axis according to Fig. 1b outside the LBM plant. The measuring area between the reference pipes is observed through a viewing window. The alignment of the camera is done by a viewing angle of 18∘ to the normal z axis of the powder bed. The object distance to the camera is consequently not constant across the image. Tilt shift adapters are recommended to compensate for optical focusing effects (Scheimpflug, 1904). The adapters are installed between the camera and the lens to adjust the depth of field of the image by a specific inclination of the camera sensor to the observation plane. To reduce further process-related influences, such as brightness fluctuations caused by the controlled IR heating radiation, three additional external white light sources are aligned around the measuring field. The additional illumination concept allows an improved consistent contrast of the ROI, as well as a better signal-to-noise ratio, which simplifies subsequent contour evaluation (Heinl et al., 2018a).
The optical detection of the melting pools within the reference system allows a specification of individual 2-D measurement and manufacturing deviations. The following sections focus on two essential methods for layer-by-layer in situ analysis of lateral contour displacements.
4.1 Referenced contour determination of melting pool
The first approach for referenced contour determination of the melting pool is illustrated in Fig. 3a. A direct in situ monitoring of the ROI with the reference pipes and the sintered melting pool is performed layer by layer in the process auxiliary times after the energy input of the laser. Individual manufacturing layers are compared to each other in relation to the reference system. The determined centres of gravity coordinates of the four reference pipes are therefore combined into a common reference origin in the centre of the powder bed. All recorded contours i in the layers n have to be pre-edited and analysed using subsequent edge detection as described in Sect. 5. To analyse the displacement, the distances of individual contours to the reference origin can be determined layer by layer in x and y directions ( and respectively). In a next step, the vectorial distances of the individual melting pool contours (Coni, n) to the reference system (Reftotal, n) are also determined by calculating the Euclidean distance d in Eq. (1). Therefore, the origin of the common reference system (Reftotal, n) in Fig. 4 has to be determined, as well as the centroids of the sintered contours with diameters from 10 to 30 mm by the contour analysis of Sect. 5.3.
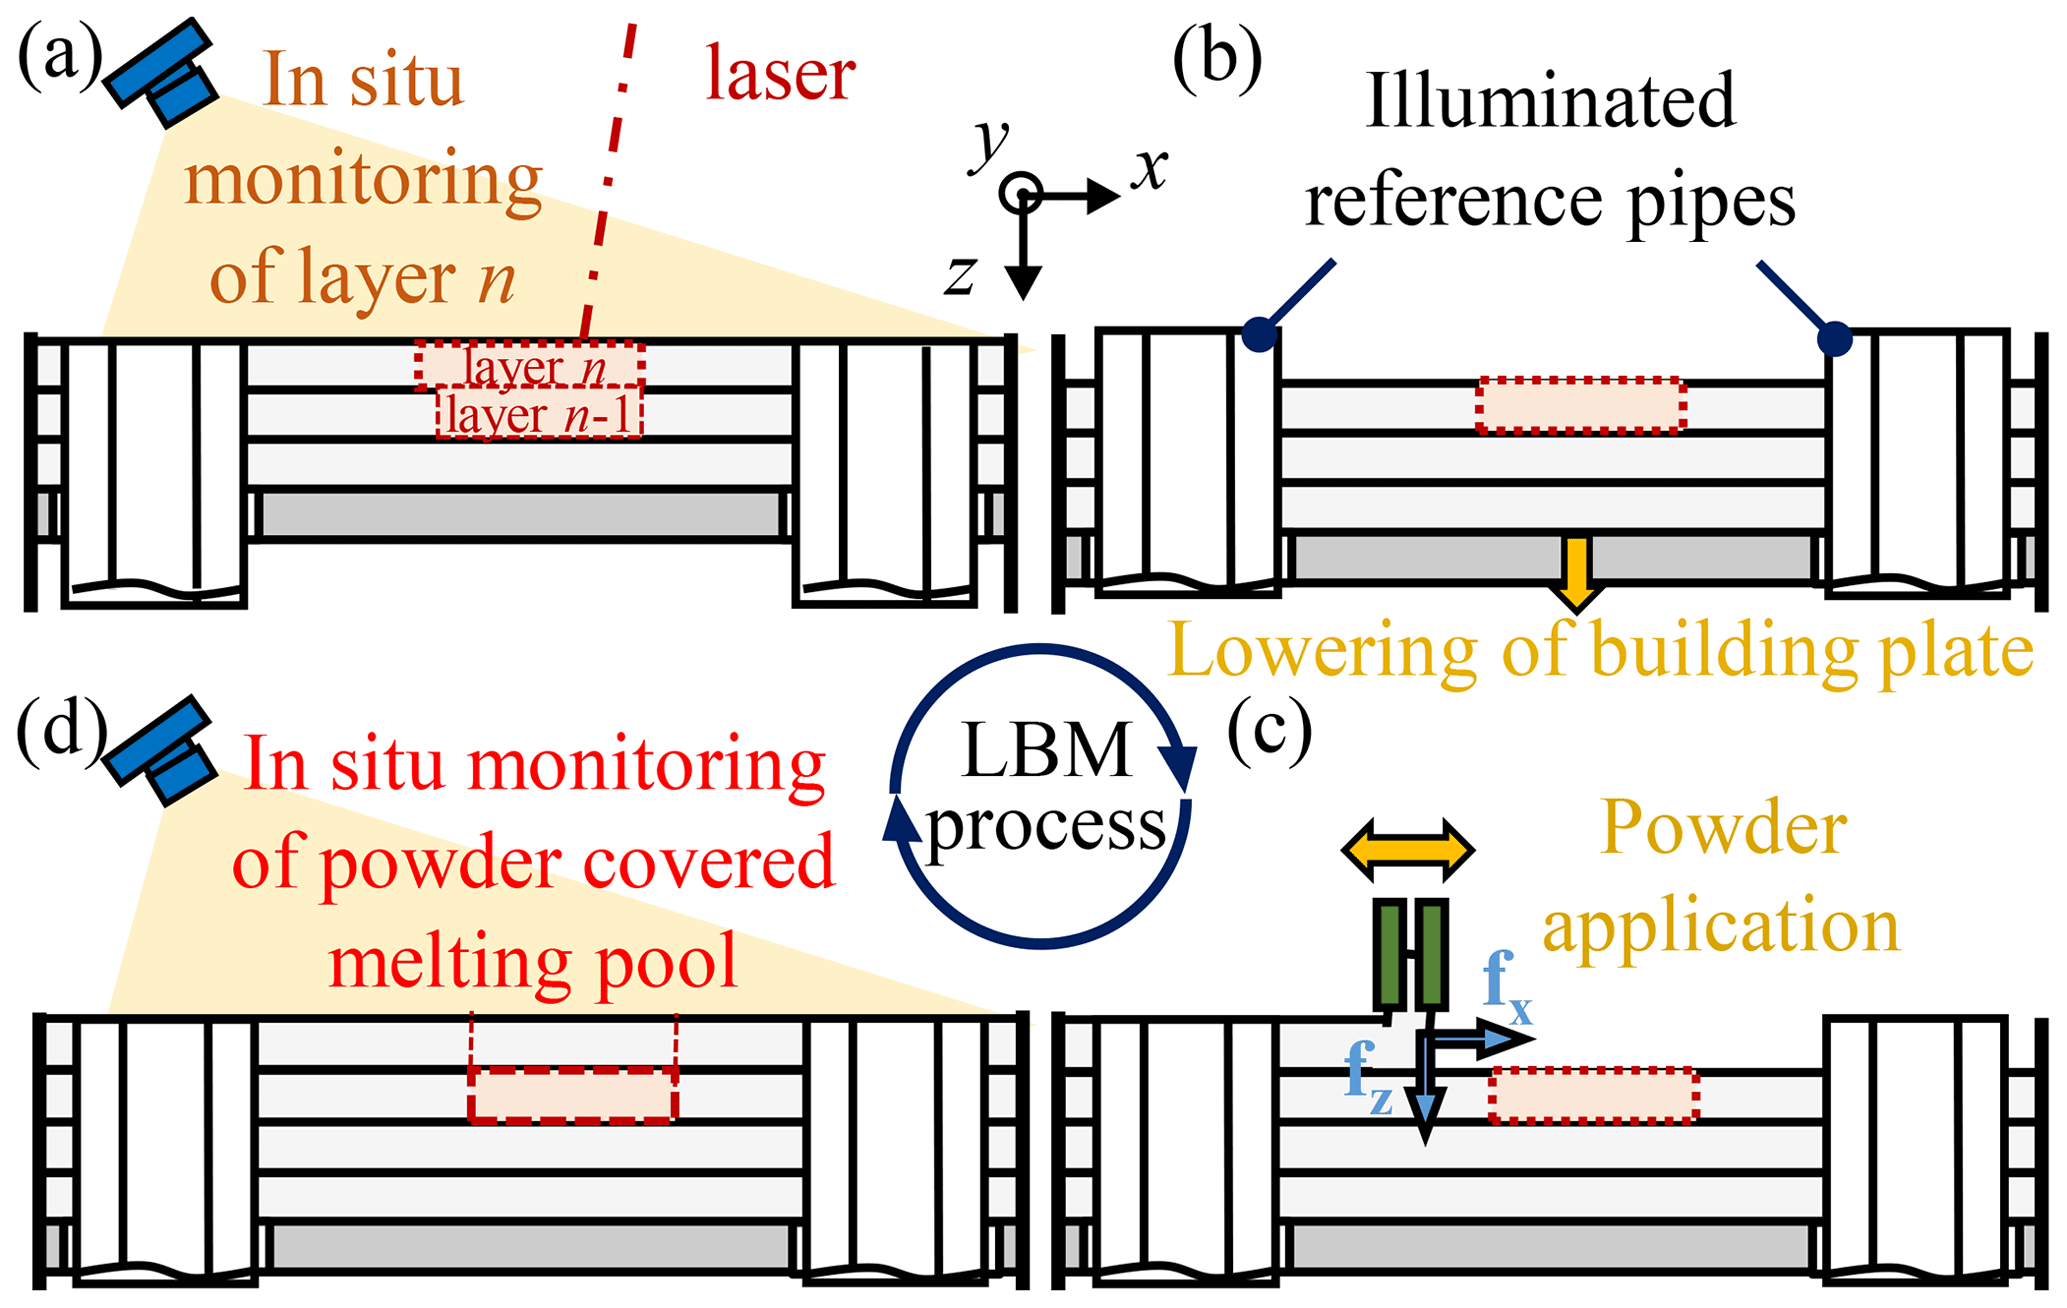
Figure 3Process flow of LBM: (a) energy input of the laser and subsequent in situ monitoring of referenced melting pool, (b) lowering of the building plate, (c) powder application, and (d) in situ monitoring of the powder-covered melting pool.
Within the distance determination the advantages of the referencing concept in the powder bed become obvious regarding the measurement accuracy. Due to the shortened measuring circuit, only small distances with lower measurement uncertainties between the referencing pipes have to be determined. As a consequence a reliable position or distance measurement can be achieved (Lerchen et al., 2021). The layer-specific position of each referenced melting contour can thus be compared more accurately with the ideal position of the imported raw data of the corresponding cross section. This method further allows checking whether the scanner is able to manufacture reproducibly the desired melting contour at the intended position in the powder bed.
4.2 Assessment of contour displacements by comparing referenced melting pool position before and after powder application
In comparison to the referenced monitoring and evaluation of the melting pool contours, an additional detection of the ROI after powder application provides further valuable measurement data. The data acquisition of the powder bed is performed according to Fig. 3d, after the lowering of the building plate and subsequent powder application in Fig. 3b and c. The inserted melted contours are detectable through the thin, transmissive powder layer. This effect depends on the used powder material, the adjusted layer thickness, as well as the energy input and intermediate time of the AM process. The powder-covered, lowered melting contours are recorded and evaluated according to Sect. 4.1 relative to the reference system layer by layer. In a further step the referenced positions of the associated melting pool contours before and after powder application are compared. Consequently it is possible to determine the influence of the powder application system on lateral displacements of the referenced melting pools and the entire powder bed.
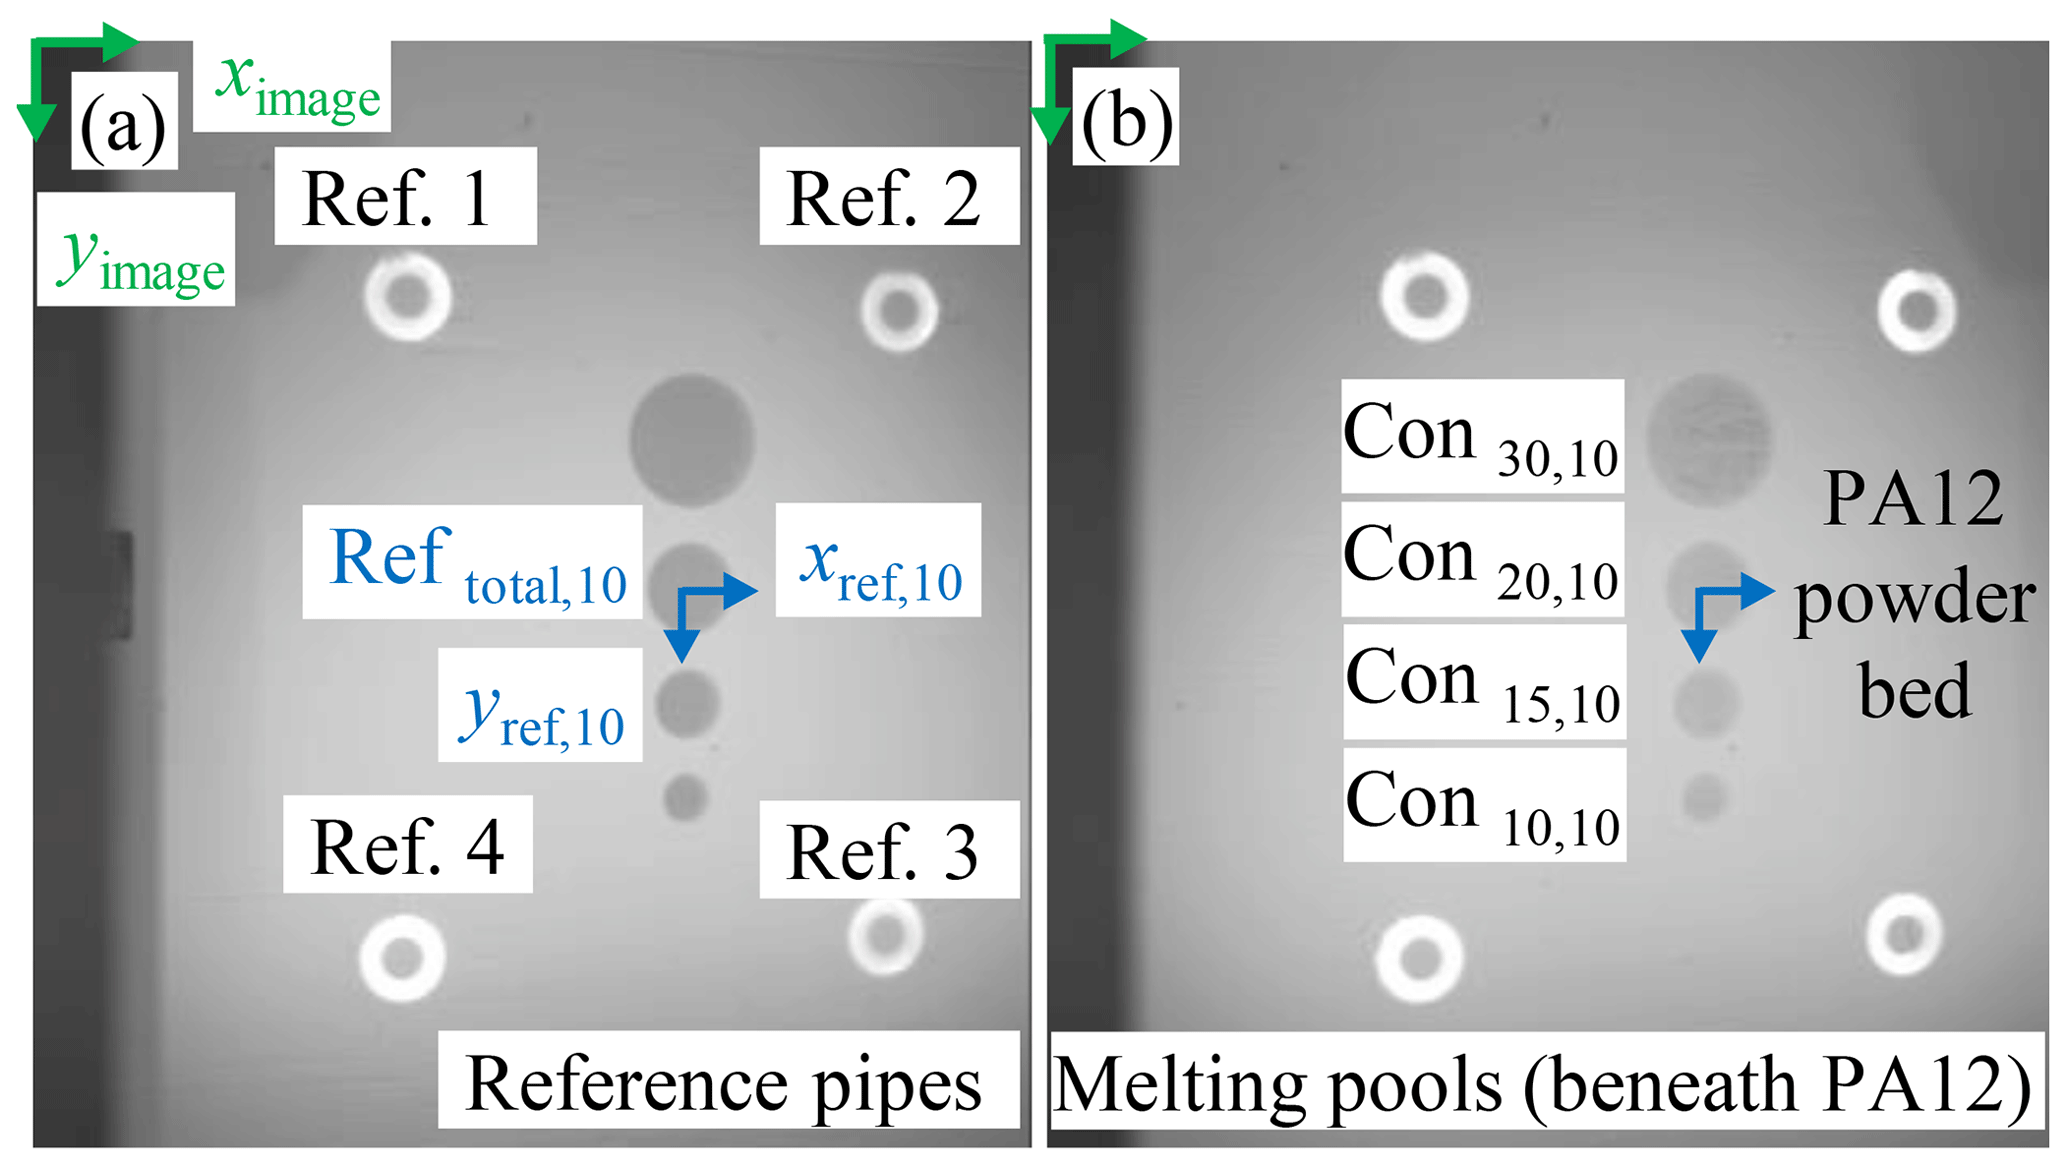
Figure 4Original in situ images I (of the n = 10th analysed layer) with illuminated reference pipes (a) after energy input of the laser and (b) after powder application.
Image processing is used to implement the methodically developed approaches of referenced contour detection and evaluation layer by layer. The recorded data of the ROI before and after powder application form the basis for a subsequent control system to detect and correct geometrical deviations within the additive manufacturing process. Accurate geometric evaluation of the contour displacements requires image pre-processing steps, which are essential for a correct geometrical measurement. A reliable adapted edge detection algorithm is needed for the following image segmentation and evaluation of the referenced contour displacements.
5.1 Data acquisition of referenced melting pool before and after powder application
Data acquisition of the ROI is carried out according to the methodical procedure described in Sect. 4. As exemplarily illustrated in the PA 12 powder bed plane (n = 10) in Fig. 4a, the manufacturing layers with identical cross sections of the melting pool contours are observed after the energy input of the laser. Four reference pipes (Ref. 1–Ref. 4) as well as four cylindrical melted contours (Con30, n–Con10, n) with different nominal diameters from 30–10 mm are recorded layer by layer. Corresponding images are taken after powder application, as described in Sect. 4.2. In the present case of the in situ monitored LBM-P process, the detected melting pool contours of Fig. 4b are located under a 100 µm thick powder layer of PA 12. A direct comparison of the figures already shows that there is a weak contrast between the measuring objects and the surrounding powder bed. The low grey value difference is superimposed on the image noise, which is amplified due to the thin covering PA 12 powder layer according to Fig. 4b. As a result the caused low signal-to-noise ratio complicates subsequent contour detection.
5.2 Image pre-processing
The original recorded images I contain distorted regions due to the viewing angle of the camera system. Based on an orientation step, a correction of the distortion within the images is necessary, using intrinsic and extrinsic camera calibration parameters to achieve a realistic interpretation of the geometric distances. Further challenges for image processing are the inhomogeneous illumination of the ROI during the AM process and the weak contrast between the melting pools and the surrounding powder bed. To get a better image quality a flat-field correction is used to compensate for the irregular lightning conditions that occurred despite the additional external illumination. Subsequent digital filtering is further essential to suppress the influence of noise as a last important pre-processing step for reliable image segmentation in Sect. 5.3.
5.2.1 Calibration of the camera system
For image rectification and undistortion, the extrinsic and intrinsic parameters of the camera system have to be determined. A checkerboard calibration is performed based on recommendations of Heikkilä and Silvén (1997) and Zhang (2000). The evaluation of the calibration images is done by the Camera Calibrator App from the MATLAB Computer Vision Toolbox. The camera system can be described by the following pinhole model (Eq. 2) without considering lens distortion (MathWorks, 2019a).
The system of linear Eq. (2) specifies the representation of each image coordinate (x,y) as world point . Here the parameter w is a scaling factor, whereas the camera matrix M contains all intrinsic and extrinsic parameters. The extrinsic parameters describe the position of the camera in the world coordinate system defined by the pattern. They are composed of the rotation matrix R and the translation vector t. The intrinsic matrix K includes the optical centre (x0, y0), the focal length (fx, fy) and the skew coefficient s0 (MathWorks, 2019a).
The pinhole model is extended by partial aspects of lens distortion. Radial distortion causes a radial shift of the actual points in the image plane and is modelled by the following polynomials in Eqs. (3) and (4):
Here, (x,y) are the image coordinates without any distortion and the corresponding real image coordinates. The distortion-free mean centred image coordinates are given as . The coefficients of radial distortion k1 and k2 have to be determined in addition to the intrinsic and extrinsic parameters. In the context of the used simplified 2-D - evaluation, other types of distortion are considered insignificant (Zhang, 2000).
Prior to the manufacturing process, the control points of the checkerboard are detected for p=30 different positions on the building plane, as shown in Fig. 5a.
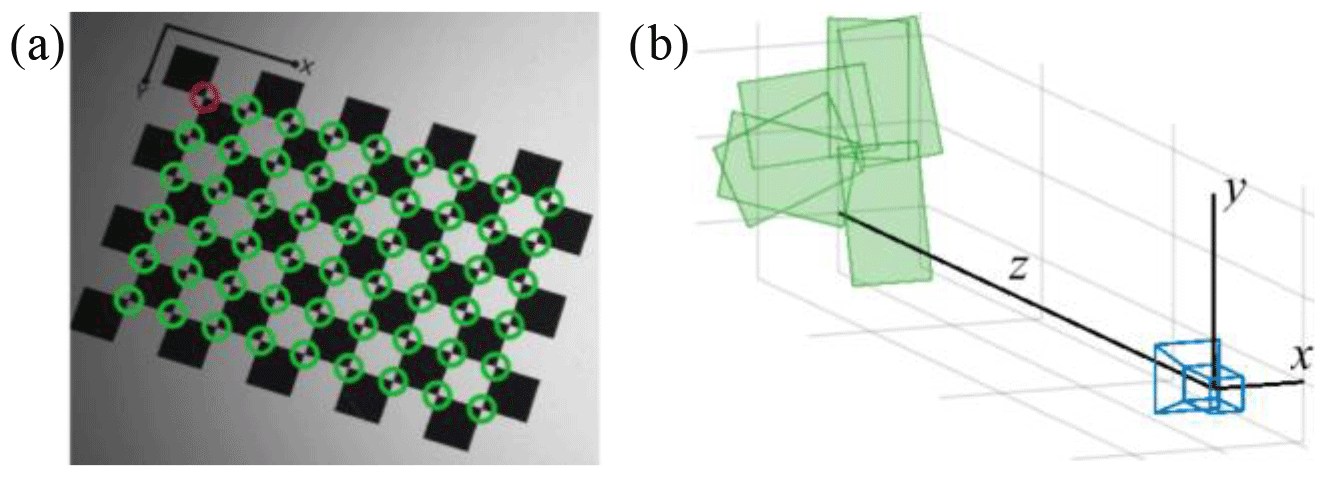
Figure 5Camera calibration with (a) detected control points of the calibration pattern and (b) visualisation of the extrinsic parameters of some orientations of the pattern.
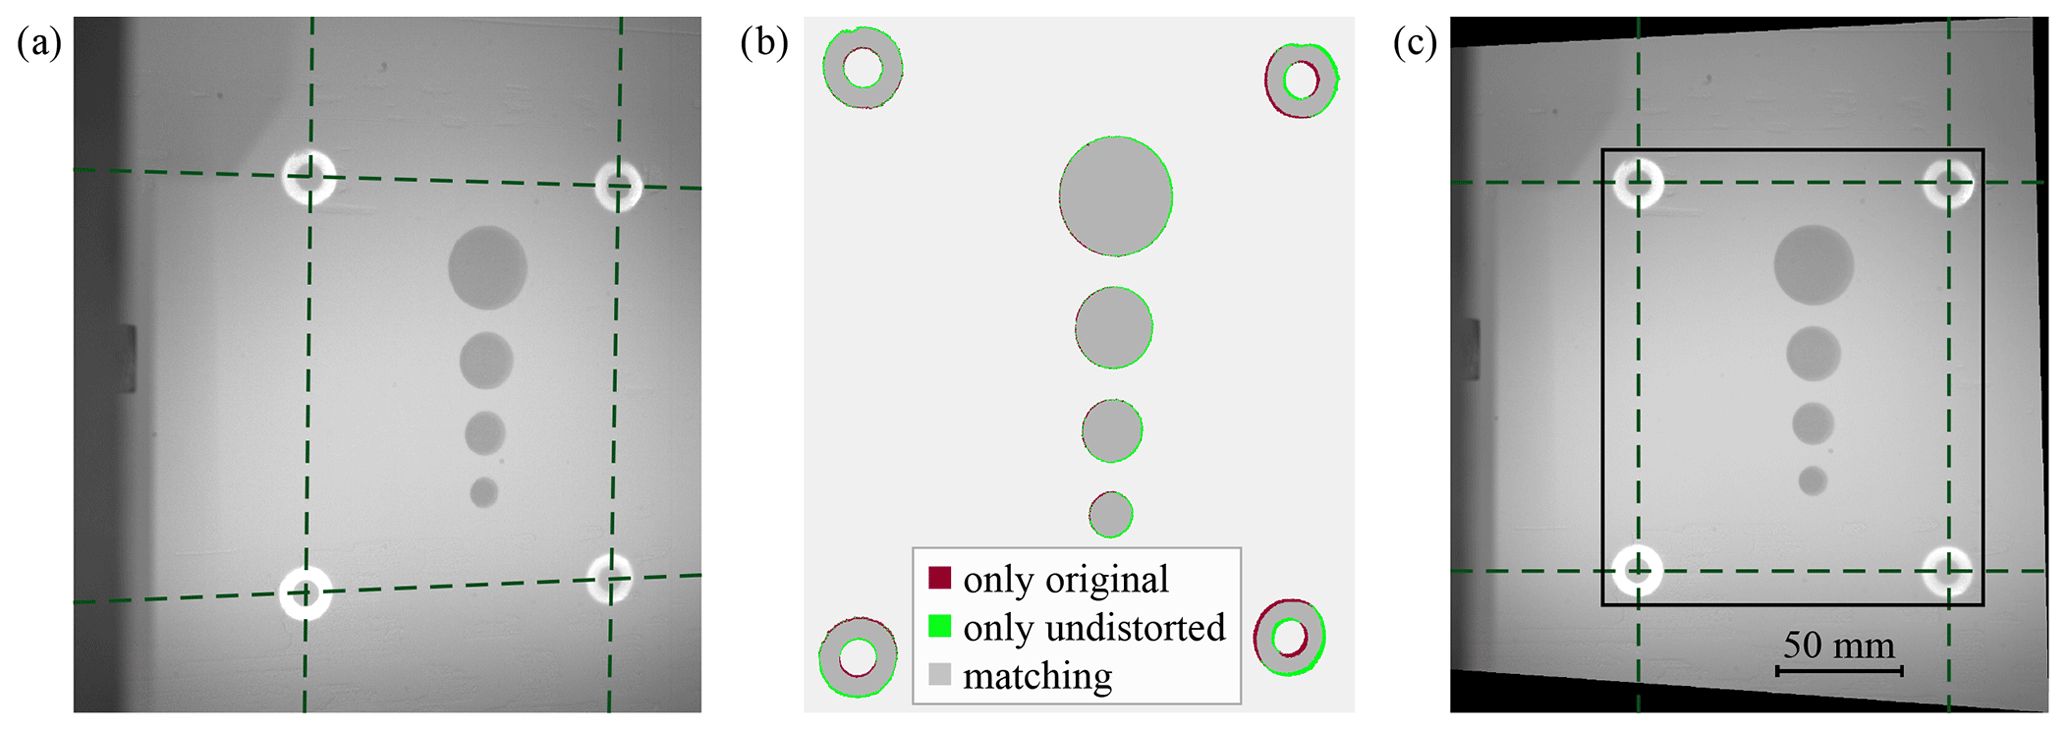
Figure 6Correction of image distortion: (a) original image I, (b) differences of original and undistorted image, and (c) corrected (undistorted and rectified) image I' with subsequent area restriction of the ROI.
The observed calibration pattern has a square dimension of 10 mm. One image is taken with the pattern aligned horizontally and parallel to the boundaries of the build space. This is used as reference orientation of the world coordinate system for the rectification in Sect. 5.2.2. Due to the different number of rows and columns, the assignment of the m=54 control points is unambiguous.
All intrinsic parameters K, the extrinsic parameters for each image Ri and ti, and the distortion coefficients k := (k1, k2) are estimated simultaneously by solving the minimisation problem (Eq. 5) (Zhang, 2000; MathWorks, 2019a):
The residuals are the deviations from the coordinates of the detected control points to the coordinates . These are derived with Eqs. (2)–(4) from the known control point coordinates in the world coordinate system. Due to the flatness of the calibration plate, Zj is fixed at zero. The minimisation is done in a least-squares sense, using the Levenberg–Marquardt method (Ranganathan, 2004). As initial values for the nonlinear minimisation, the distortion coefficients are set to zero, while the intrinsic and extrinsic parameters are estimated by a non-iterative minimisation of the algebraic distances. Figure 5b visualises the determined extrinsic parameters for some calibration pattern orientations (Heikkilä and Silvén, 1997; Zhang, 2000; MathWorks, 2019a).
5.2.2 Undistortion and rectification
In order to compare the contours of the melting pool with the sliced CAD data, the images are transformed to an undistorted top view. The auxiliary lines on the original image I in Fig. 6a illustrate the camera perspective. The reference pipes arranged on the corners of a rectangle are detected in a distorted arrangement. Radial lens distortion is corrected by inverse functions of Eqs. (3) and (4). Figure 6b visualises the differences of the segmented reference pipes and melting pools between the original image and the undistorted image. To get top view images with uniform scale, all image points are transformed into the reference world coordinate system. The system of Eq. (2) is resolved to X and Y using the reference extrinsic parameters Rref and tref. This relation is generally not bijective. Each pixel can correspond to an infinite number of world points. However, bijectivity is achieved under the assumption that all relevant world points are located at Z=0 in the reference world coordinate system. This allows a projective transformation to be performed. In addition, a scaling factor of is specified, which indicates how many pixels correspond to a millimetre. As a result, the original image I is transferred to an undistorted and rectified image I' as shown in Fig. 6c.
For the images of the powder-covered layers, a systematic error occurs in the described transformation due to the lowering of the building plate. The reason is the lowered plane of the powder-covered melting pools, which is one layer below the origin of the defined world coordinate system. An additional calibration or a mathematical correction of the lateral offset ( µm µm) of the powder-covered, lowered layer is recommended to compensate for this transformation error. Furthermore, refraction effects may occur within the semi-transparent powder layer. Since the powder layer thickness is only 100 µm and this effect of the detected melt pool contour is largely compensated for by the centre of gravity determination, negligible deviations due to optical refraction can be expected.
In a further step of image pre-processing an area restriction to a smaller ROI is made as framed in Fig. 6c. The measuring region is thus reduced to essential contents, and less RAM is required for the process-accompanying evaluation.
5.2.3 Illumination correction
Despite the external lighting, a completely homogeneous illumination is not guaranteed in the whole powder bed. To ensure uniform brightness in the ROI, a locally different brightness adjustment is performed using a flat-field correction. A background image B of the powder bed is taken before the AM process, which is used as a reference. To avoid an influence of noise and powder particles in the background image, the undistorted and rectified background image B' is low-pass filtered by Gaussian, shown in Fig. 7a. The intensity value of each pixel of the transformed image I' of Fig. 7b is divided according to Eq. (6) by the value of the corresponding pixel of the filtered background image . Then a multiplication with the arithmetic mean of the grey values of the background image is performed. This results in a wide distribution of the grey values in the range of the 8 bit brightness resolution.
In addition to homogenise the illumination, Eq. (6) also eliminates sensor irregularities and vignetting. As a result the transformed image I′ is processed into the illumination-corrected image I′′. The grey value distribution below the corresponding image of Fig. 7c of the green illustrated illumination-corrected image is more homogeneous in comparison to the red greyscale analysis of Fig. 7b.
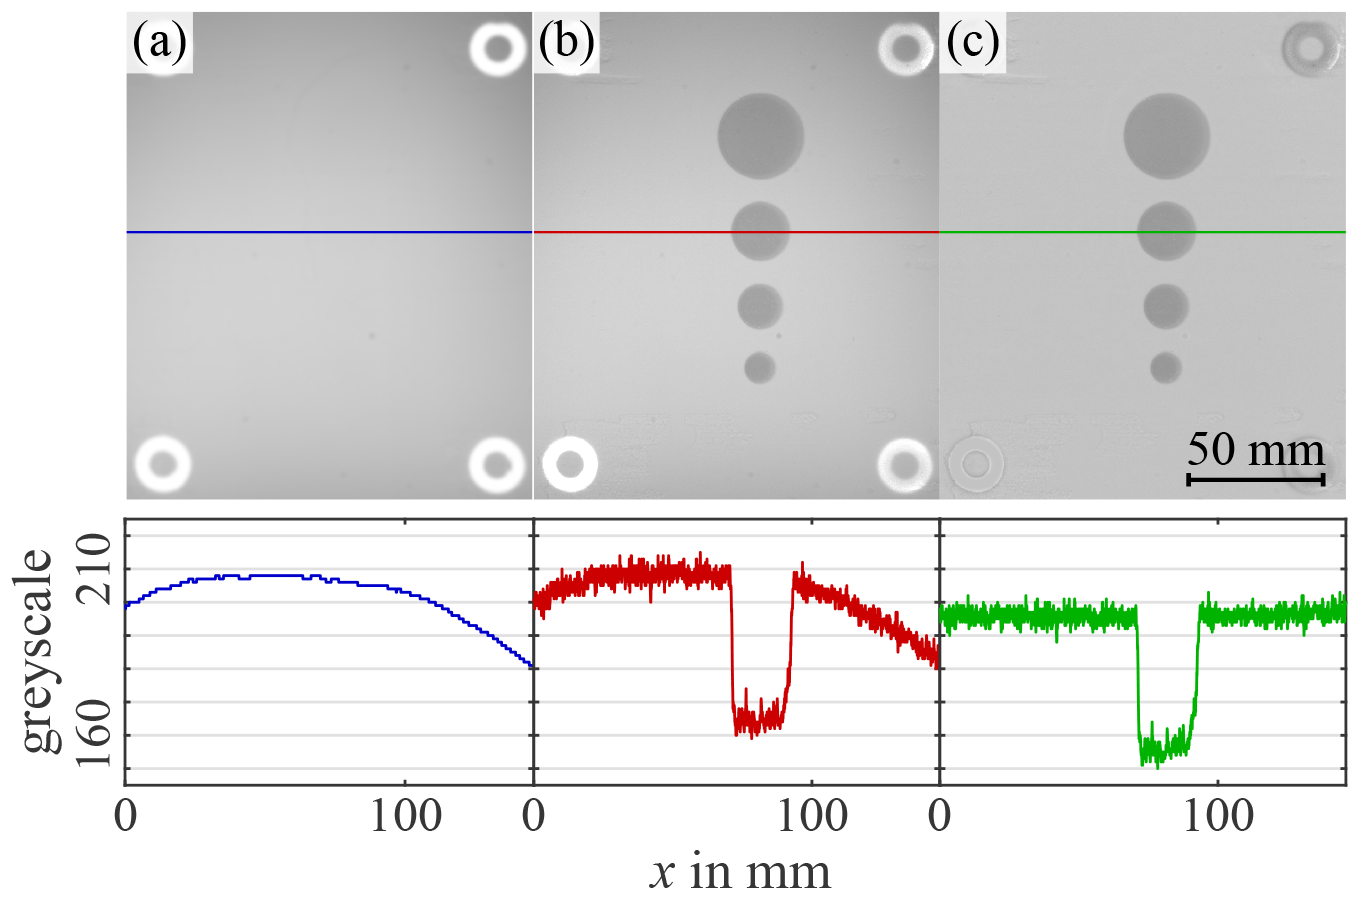
Figure 7Illumination correction and grey value curve: (a) filtered background image , (b) in situ image I', and (c) illumination-corrected image I”.
5.2.4 Low-pass filtering
To determine the gradient of the image in one direction within the Canny operator discussed in Sect. 2.2, Canny (1986) describes a convolution of the image with the derivative of a two-dimensional (2-D) Gaussian operator. In contrast, the Canny edge detection implemented by MATLAB performs a one-dimensional (1-D) Gaussian filtering first in one direction and a subsequent convolution with the derivative of a Gaussian in the other direction (MathWorks, 2019b). In this section it is investigated which of the two variants allows a more robust segmentation in this context. Due to the associativity of the convolution, the 1-D or 2-D Gaussian filtering can be performed in both cases before the derivatives are formed. It is also analysed whether alternative filters as regression or spline filtering improve the results of edge detection.
As illustrated in Fig. 8b without any filtering, the edge detection of the original section of the melting pool in Fig. 8a requires low-pass filtering to get a clear response for a true edge.
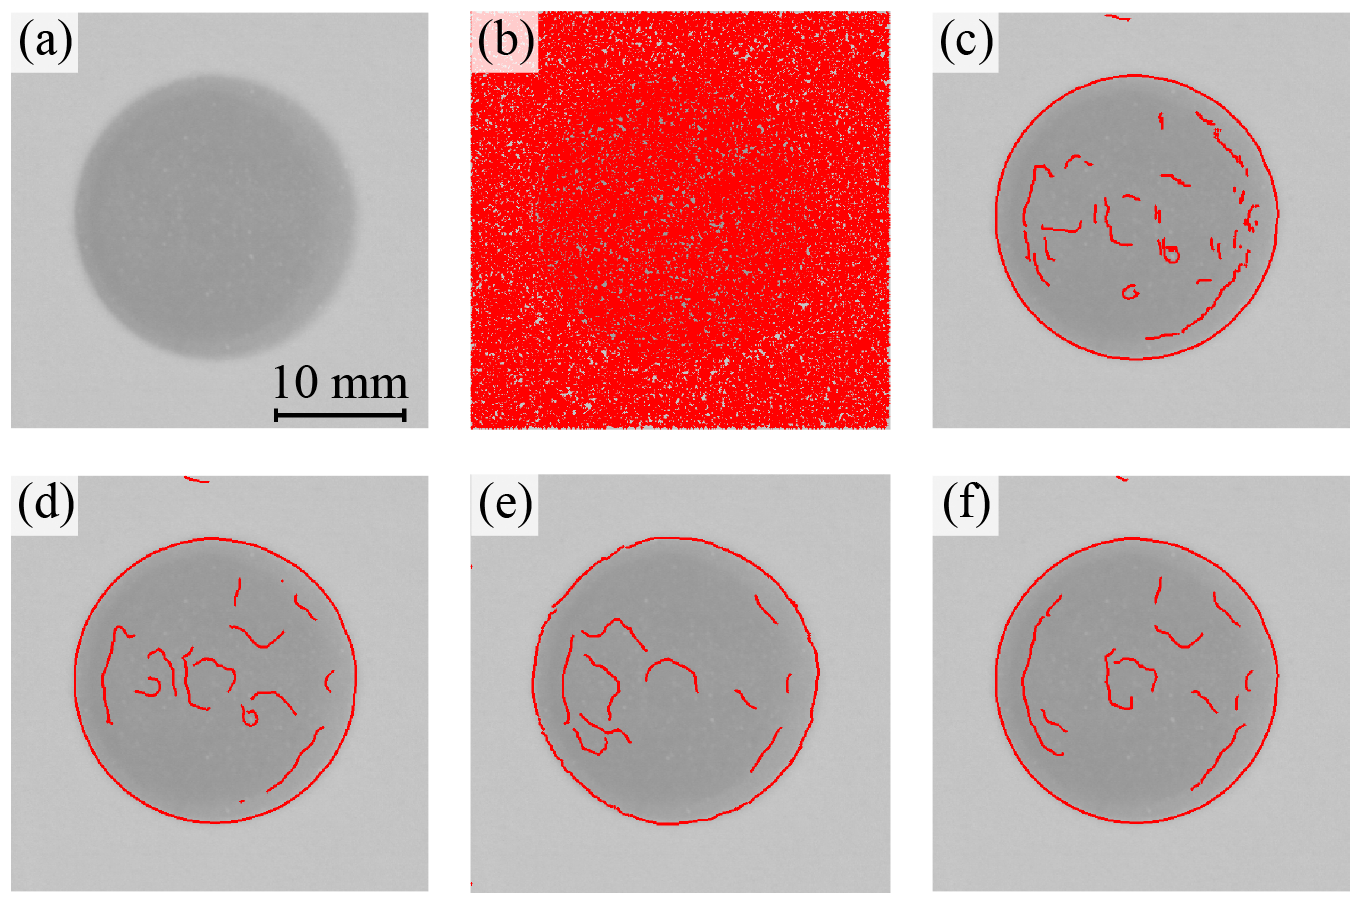
Figure 8Analysis of influence of different filters on contour detection: (a) original section of melting pool to be segmented, (b) without low-pass filtering, (c) 2-D Gaussian filtering, (d) 1-D Gaussian filtering, (e) 1-D Gaussian regression filtering, and (f) 1-D spline filtering.
The evaluation criteria for the filters are the continuity and localisation of the edges. Isolated, redundantly detected edges are not considered to be disruptive since they are automatically deleted in a further step, as described in Sect. 5.3.
In Fig. 8c the edges are shown with two-dimensional and in Fig. 8d with successive one-dimensional Gaussian filtering in both directions. The version implemented by MATLAB provides more robust segmentation since the edges tend not to be closed with the filter described by Canny (1986). A standard deviation of σ=7 px is used for all Gaussian filters in Fig. 8. In addition to the presented evaluation of the filter influence on the edge detection, the actual contour evaluation of the various melting pools is carried out in Sect. 5.3.
The implementations of further filtering concepts are based on DIN EN ISO 16610 standard series. Greyscale images are treated as surfaces. The standard series describes, for instance, regression filters. These are based on linear filters but are extended by a nonlinear component. The filtered values are changed iteratively until a truncation criterion is fulfilled (DIN EN ISO16610-30, 2015). For the analysed 1-D Gaussian filter, DIN EN ISO16610-31 (2016) describes the corresponding regression filter, which is designed for the evaluation of surface profiles with impulse-like disturbances. It is based on the Gaussian function and uses Tukey's biweight function as M-estimator. As can be seen in Fig. 8e, contour detection with the regression filter integrated in the Canny algorithm shows slightly misaligned edges. Furthermore, a significantly higher computing effort is required, which is unfavourable for in situ image processing. Since the 2-D Gaussian regression filter described in DIN EN ISO16610-71 (2014) requires even higher computational resources, it is not suitable in this context.
In addition, DIN EN ISO16610-22 (2015) describes a linear 1-D spline filter. It is composed of several polynomials with a smooth transition. The transfer function of the spline filter is steeper than the Gaussian transfer function, resulting in a better separation between the wavelength ranges (Krystek, 2009). The contour edges in Fig. 8f are detected reliably. As cut-off wavelength λc the same value is used as for the Gaussian filter. Filtering a sinusoidal profile with wavelength λc dampens the amplitude to 50 %. In one-dimensional case λc corresponds to (DIN EN ISO16610-21, 2011; MathWorks, 2019b). The results obtained with the 1-D spline filter are considered equivalent to those obtained with the 1-D Gaussian. However, in the implemented studies spline filtering requires more evaluation time, which is disadvantageous for the in-process contour analysis.
Consequently, in the following evaluations the standard 1-D Gaussian filtering of Canny edge detection by MATLAB is used for contour analysis. The state-of-the-art noise removal filter is based on a standardised algorithm, which has proven to be robust and in numerous applications (Aminzadeh, 2016; Heinl et al., 2018a) and allows a reliable contour evaluation of the circular melting pool contours for the present case.
5.3 Image segmentation by adapted Canny contour detection
For the considered monitoring of the LBM-P process, an adapted contour detection algorithm with a corresponding image segmentation is necessary for several reasons. As shown in Fig. 9a and b insufficient powder adhesion and irregularities in powder application, as well as low contrast between melting pool and the surrounding powder of Fig. 9c, complicate the subsequent image segmentation.
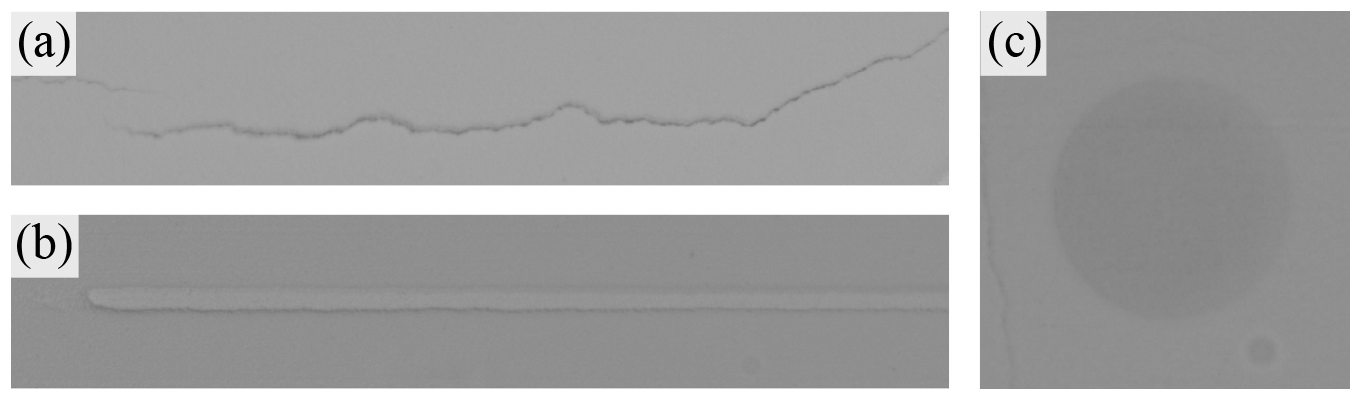
Figure 9Difficulties for edge detection: (a) insufficient powder adhesion, (b) scoring caused by powder application system, and (c) low contrast between melting pool and powder bed (especially after powder application).
Neither the Hough transform nor the thresholding of Sect. 2.2 provides satisfactory results in this context. In Heinl et al. (2018a) it has been shown that among the considered edge detectors, the Canny algorithm is suitable for this image segmentation task of the LBM-P process monitoring. The algorithm differs from other edge detection operators in a better performance with noisy images (Sharifi et al., 2002; Nadernejad et al., 2008; Shrivakshan and Chandrasekar, 2012).
In order to achieve acceptable results with the Canny operator, additional image processing steps are necessary. Before edge detection, each individual melting pool is cropped, as shown exemplarily on contour Con20,10 in Fig. 10a.

Figure 10Steps of adapted contour detection: (a) original section of melting pool (Con20,10), (b) detected edges by Canny algorithm, (c) mask based on the nominal shape, (d) remaining edges after area delimitation, (e) longest, final edge projected on the original image, and (f) segmented melting pool area including the calculated centroid.
This can be done automatically based on the known position of the contours within the CAD data or a region-based filtering. Delimiting the area to the ROIs reduces the probability of potentially incorrectly detected edges due to irregularities in the powder bed, as shown in Fig. 9a and b. Choosing the standard deviation σ of the integrated Gaussian filter, the effectiveness of noise reduction and the ability to detect fine structures correctly have to be balanced. Generally, σ is set as small as possible to reproduce delicate contours. As a consequence, many edges are detected due to the low cut-off wavelength. The two threshold values T1 and T2 are also set to detect redundant edges. In that way it is more likely to detect superfluous wrong edges than to discard actual correct contour information. The first step of contour detection by Canny in Fig. 10b with σ=7 px initially delivers many irrelevant edges and requires further image processing. Incorrectly detected edges have to be cleared. For this purpose a mask is created, which contains the area with expected edges. As Fig. 10c illustrates, the mask is created by dilating the nominal contour derived from the CAD data. In the case of the circular contour, it is recommended to select the mask in a range of approximate 90 %–110 % of the expected output diameter. The structural element has to be sufficiently large to analyse also real deviations of the nominal contour. This first elimination results in the remaining edges shown in Fig. 10d. Within the contour analysis the detected boundary of the melting pool may show partially small gaps. Nearby edge end points are connected automatically in a further step. The maximum permissible distance of neighbouring pixels is defined in advance to only a few pixels to avoid significant distortion from the real contour. In a second step of the elimination only the longest continuous edge is retained, as shown in Fig. 10e. Various data can be determined from the segmented image areas. For instance, the centroid of a melt pool can be calculated with subpixel resolution from the arithmetic mean of the pixel coordinates, as depicted in Fig. 10f. The coordinates in the cropped image are finally transformed into the world coordinate system of the overall image.
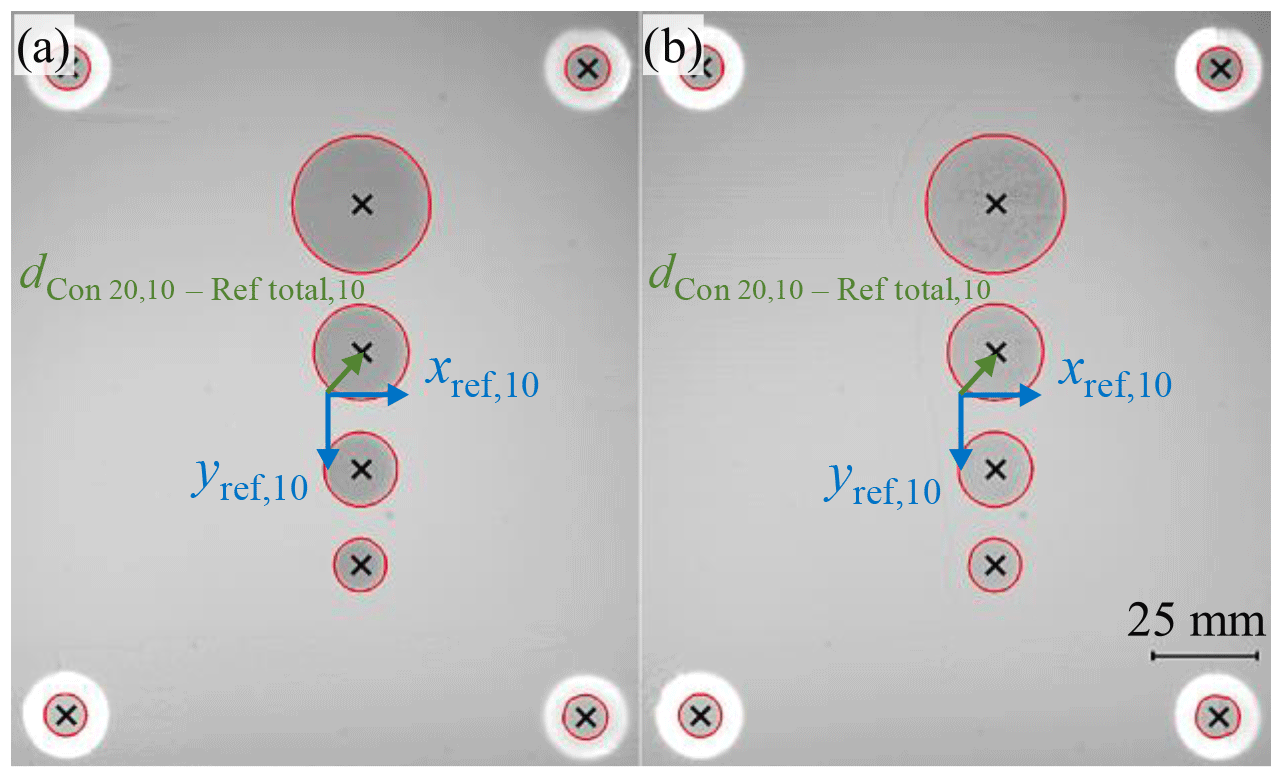
Figure 11In situ edge detection of reference pipes and melting pool contours (a) after energy input of the laser and (b) after powder application for determination of centroids and referenced distance evaluation.
The inner circles of the reference pipes are segmented in a fundamentally similar way to the melting pools. Here, the illumination correction is omitted since the reference pipes have an intern LED illumination and thus are already delimitable from the background. The segmentation is consequently simplified due to a significantly better signal-to-noise ratio. Figure 11 shows the segmented melting pools and reference pipes. The centres of the detected positions of the four reference pipes serve as a common reference system (xref; yref) for the calculated centroids of the melting pools according to Sect. 4.1. The corresponding referenced centroid coordinates are determined in Fig. 11 according to Eq. (1) after the energy input of the laser and powder application.
By comparing the calculated lengths of corresponding images, it is possible to determine a lateral displacement of the individual contours caused by the powder application (see also Sect. 6.2).
Based on the acquired and processed images, the results of the methods are presented in the following, which are used to verify lateral melting pool displacements in AM. The focus of the contour evaluation according to the methods of referenced in situ analysis in Sect. 4 is based on the interpretation of referenced distances of the melting pool, as well as contour displacements layer by layer caused by the powder application system.
6.1 Referenced lateral distance determination layer by layer
As illustrated in Fig. 12 the referenced lateral positions of the melting pool are plotted as a result of the in situ evaluation of 12 manufactured layers in LBM-P process.
While there is only a slight difference in the positions between the layers in y direction orthogonal to the direction of the powder application system, the exemplarily evaluated vectorial distances d (Reftotal,10; Con20,10) are significantly influenced by the position deviations in x direction. A standard deviation sx of the referenced x positions of 62.1 µm is recorded between the layers after the energy input of the laser. The evaluation of the other referenced melting pool contours i shows similar trends. As the repeatability of the scanner has already been proven in preliminary, not published examinations, by an additional measuring system integrated coaxially in the beam path of the laser according to Fig. 1c, the cause of the observed lateral displacements of the referenced melting pool relative to the camera system has to be analysed in more detail.
According to Lerchen et al. (2021), the distance determination between the referencing pipes in relation to the camera system is also influenced by temperature and powder application. Nevertheless, the common reference system origin is a stable and reliable reference point in relation to the camera system, with a standard deviation of sref<8 µm at processing conditions of 168 ∘C. The influence of powder application leads to standard deviations of the reference origin coordinates on the order of 30 µm. The main contribution of the observed lateral displacement with a standard deviation sx of 62.1 µm in Fig. 12 is therefore probably attributed to the displacement of the melting pool contours relative to the camera system. At this point it is not possible to identify the actual cause of this lateral contour displacement. In addition to the expected influence of the powder application system on the entire powder bed, which is specifically investigated in the following chapter, numerous other factors such as mechanical vibrations, thermal length changes along the measuring circuit and optical effects within the laser–powder interaction are conceivable.

Figure 12Evaluation of referenced melting pool position (Con20) after the energy input of the laser.
6.2 Verification of lateral contour displacements by powder application
The measured data of the melting pool contours after the energy input of the laser and after powder application are used within the presented method in Sect. 4.2. Due to the lowering of the powder bed (100 µm) and oblique observation (18∘ in x direction), the curve for powder-covered contour is shifted by approx. + 32.5 µm in x direction. The analysis of the data allows an interpretation of the direct influence of the powder application system on the lateral contour displacements more in detail. As illustrated in Fig. 13 the referenced position of the evaluated contour Con20,10 of the powder application differs in x direction slightly before and after powder application.

Figure 13Evaluation of lateral displacement in x by comparison of melting pool and powder-covered contour positions (Con20).

Figure 14Evaluation of lateral displacement in y by comparison of melting pool and powder-covered contour positions (Con20).
According to the compared centroid coordinates, a lateral displacement up to 100 µm has been identified. This orange illustrated displacement in x direction with a standard deviation of 26.7 µm between the observed melting pool and the powder-covered contour can directly be attributed to the influence of the powder application system.
The expected corresponding trend in y direction, orthogonal to the powder application direction, is lower as shown in Fig. 14. There are only minimal fluctuations in the detected positions, which are congruent (except of an outlier in layer 8) and therefore do not indicate any significant influence in y direction. The lateral displacement of the referenced melting pool contours is thus decisively influenced by the force effect of the powder application system in the application direction.
In the present work, two methods of optical in situ verification of lateral contour displacements in the AM have been presented. The in situ evaluation of the melting pools and its contours after powder application is based on a referenced distance determination concept. The melting pools in the ROI are extracted layer by layer between an illuminated reference system, consisting of four illuminated quartz glass pipes, which are integrated in the powder bed. As a result of the data acquisition, several steps of image pre-processing have to be carried out in order to guarantee a meaningful evaluation of geometric process deviations. In a first step of the recommended procedure of image processing, the camera system should be calibrated. The calibration data are essential for the subsequent undistortion and rectification of the images. These pre-processing corrections are mandatory for realistic length measurements and referenced distance determinations. A further illumination homogenisation by flat-field correction simplifies the subsequent contour evaluation. An adapted Canny contour detection with standardised Gaussian low-pass filtering is suggested for image segmentation of the referenced melting pool contours in the exemplarily analysed LBM-P process.
The contours of the corrected and segmented section of each reference pipe and the melting pools are clearly assigned in the powder bed. A mask around the respective contour helps to evaluate only the relevant contour information in the image sections. After superfluous edge segments have been filtered and only the longest edges in the predefined image areas have been assigned to the actual contours, the calculations of the respective contour centroids are performed.
Based on the evaluated location of the referenced melt pool contours after the energy input of the laser, it is thus possible to compare the position stability layer by layer of the components in the referenced manufacturing field relative to the camera system. Here, a lateral drift of up to ± 150 µm with a standard deviation sx of 62.1 µm has been observed in x direction according to Fig. 12. Since the cause of the powder application cannot be clearly assessed with this evaluation, the powder application-related influence has been analysed separately. This evaluation has been based on the second measurement method, in which the referenced positions of the evaluated melting contours are compared with the centroid coordinates of the translucent melting pool contours after powder application. Thus, the influence of the powder application system force on the entire powder bed is analysed separately. Within the investigations on the monitored LBM-P manufacturing AM plant, a lateral displacement between the production layers up to 100 µm has been detected according to Fig. 13.
These methods of in situ contour analysis and the generated information about local referenced contour displacements and the melting pool geometry may serve as an essential data basis for subsequent process controlling during the additive manufacturing process. The recommended procedures of referenced data acquisition and systematic evaluation of the recorded contour information are therefore first key points for a standardised proceeding of in-process quality monitoring and feedback controlling of geometrical lateral contour displacements in AM.
The software code used can be made available upon request from the authors.
The raw data used can be made available upon request from the authors.
ML led the editing and review process and contributed data curation, formal analysis, investigation, methodology, software, supervision, validation, visualisation and writing of the original draft. JH supported individual chapters of image processing and contour detection, software, formal analysis, visualisation and validation. YZ contributed software implementation content and literature research in Sect. 2.2. TH was responsible for the project administration and for the conceptualisation, methodology, funding acquisition, editing and ideas for the referencing concept, system and data analysis. Additionally TH supported the review process.
The authors declare that they have no conflict of interest.
Publisher’s note: Copernicus Publications remains neutral with regard to jurisdictional claims in published maps and institutional affiliations.
The authors want to thank the German Research Foundation (DFG) for funding the Collaborative Research Centre 814 (CRC 814) – “Additive Manufacturing”.
This research has been supported by the Deutsche Forschungsgemeinschaft (Project-ID 61375930 – subproject C4).
This paper was edited by Rainer Tutsch and reviewed by two anonymous referees.
Aminzadeh, M.: A machine vision system for in-situ quality inspection in metal powder-bed additive manufacturing, Ph.D. thesis, Georgia Institute of Technology, Georgia, USA, 2016. a
Anagnostopoulos, G. C.: SVM-based target recognition from synthetic aperture radar images using target region outline descriptors, Nonlinear Anal.-Theor., 71–12, e2934–e2939, https://doi.org/10.1016/j.na.2009.07.030, 2009. a
Andresen, K.: Ermittlung von Raumelementen aus Kanten im Bild, Zeitschrift für Photogrammetrie und Fernerkundung, 59, 212–220, 1991. a
Burt, P.: The pyramid as a structure for efficient computation, in: Multiresolution image processing and analysis, Springer Berlin-Heidelberg, 6–35, https://doi.org/10.1007/978-3-642-51590-3, 1984. a
Caltanissetta, F., Grasso, M., Petrò, S., and Colosimo, B. M.: Characterization of in-situ measurements based on layerwise imaging in laser powder bed fusion, Additive Manufacturing, 24, 183–199, https://doi.org/10.1016/j.addma.2018.09.017, 2018. a
Canny, J.: A computational approach to edge detection, IEEE T. Pattern Anal., PAMI-8–6, 679–698, https://doi.org/10.1109/TPAMI.1986.4767851, 1986. a, b, c, d, e
Cooke, A. L. and Moylan, S. P.: Process intermittent measurement for powder-bed based additive manufacturing, in: An Additive Manufacturing Conference, Proceedings of the 22nd International SFF Symposium, 8–10, Austin, Texas, 6–8 August, 2011. a
Cooper, G.: Geophysical Applications of the Hough transform, S. Afr. J. Geol., 109, 555–560, https://doi.org/10.2113/gssajg.109.4.555, 2006. a
Craeghs, T., Clijsters, S., Yasa, E., and Kruth, J.-P.: Online quality control of selective laser melting, in: Proceedings of the 22nd International Solid Freeform Fabrication Symposium (SFF) – An Additive Manufacturing Conference (NIST), 212–226, Austin, Texas, 6–8 August, 2011. a
Deckard, C. R.: Method and apparatus for producing parts by selective sintering. U.S. Patent 4,863,538, University of Texas, Austin, 1989. a
DIN EN ISO14406: 2011–04, Geometrical product specifications (GPS) – Extraction. ICS 17.040.30. Standard (ISO 14406, 2010), Beuth, Berlin, 2010. a
DIN EN ISO16610-21: 2013–06, Geometrical product specifications (GPS) – Filtration – Part 21: Linear profile filters: Gaussian filters. ICS 17.040.30. Standard (ISO 16610-21, 2011), Beuth, Berlin, 2011. a
DIN EN ISO16610-22: 2016–04, Geometrical product specifications (GPS) – Filtration – Part 22: Linear profile filters: Spline filters. ICS 17.040.30. Standard (ISO 16610-22, 2015), Beuth, Berlin, 2015. a
DIN EN ISO16610-30: 2017–04, Geometrical product specifications (GPS) – Filtration – Part 30: Robust profile filters: Basic concepts. ICS 17.040.40. Standard (ISO 16610-30, 2015), Beuth, Berlin, 2015. a
DIN EN ISO16610-31: 2017–03, Geometrical product specifications (GPS) – Filtration – Part 31: Robust profile filters: Gaussian regression filters. ICS 17.040.40. Standard (ISO 16610-31, 2016), Beuth, Berlin, 2016. a
DIN EN ISO16610-71: 2014–12, Geometrical product specifications (GPS) – Filtration – Part 71: Robust areal filters: Gaussian regression filters. ICS 17.040.30. Standard (ISO 16610-71, 2014), Beuth, Berlin, 2014. a
DIN EN ISO17296-2: 2016–12, Additive manufacturing – General principles – Part 2: Overview of process categories and feedstock. ICS 25.030. Standard (ISO 17286-2, 2015), Beuth, Berlin, 2015. a
DIN EN ISO/ASTM-52900: 2017–06, Additive manufacturing – General principles – terminology. ICS 01.040.25; 25.030. Standard (ISO 52900, 2015), Beuth, Berlin, 2015. a
Doelken, M., Stefan, H., Pauli, E., Stadlbauer, A., Struffert, T., Engelhorn, T., Richter, G., Ganslandt, O., Doerfler, A., and Hammen, T.: 1H-MRS profile in MRI positive-versus MRI negative patients with temporal lobe epilepsy, Seizure, 17–6, 490–497, https://doi.org/10.1016/j.seizure.2008.01.008, 2008. a
Foster, B. K., Reutzel, E. W., Nassar, A. R., Hall, B. T., Brown, S. W., and Dickman, C. J.: Optical, layerwise monitoring of powder bed fusion, in: 26th international Solid Freeform Fabrication Symposium (SFF), 295–307, Austin, Texas, 10–12 August, 2015. a, b
Galovskyi, B., Hausotte, T., Loderer, A., and Hartmann, W.: Optische In Line Prüftechnik zur Qualitätssicherung beim selektiven Strahlschmelzen von Kunststoffen, in: 3. Industriekolloquium des Sonderforschungsbereichs 814 – Additive Fertigung, Nuremberg, ISBN 978-3-931864-61-3, 109–124, 2014. a
Galovskyi, B., Hausotte, T., Drummer, D., and Harder, R.: In-line layer wise measurements for selective laser sintering process, in: XXI IMEKO World Congress of Measurement in Research and Industry, Prague, 1410–1414, ISSN 978-80-01-05793-3, 2015. a
Gardner, M. R., Lewis, A., Park, J., McElroy, A. B., Estrada, A. D., Fish, S., Beaman, J. J., and Milner, T. E.: In situ process monitoring in selective laser sintering using optical coherence tomography, Opt. Eng., 57–4, 041407, https://doi.org/10.1117/1.OE.57.4.041407, 2018. a
Gebhard, A., Kessler, J., and Thurn, L.: 3D printing – Understanding additive manufacturing, vol. 2, Hanser Publisher, Munich, ISBN 978-1-56990-702-3, 2019. a
Heikkilä, J. and Silvén, O.: A four-step camera calibration procedure with implicit image correction, in: Proceedings of IEEE Computer Society Conference on Computer Vision and Pattern Recognition, Monterey, California, 27 April–1 May, 1106–1112, https://doi.org/10.1109/CVPR.1997.609468, 1997. a, b
Heinl, M., Schmitt, F. K., and Hausotte, T.: In-situ contour detection for additive manufactured workpieces, in: Procedia CIRP – 10th Conference on Photonic Technologies (LANE), 74, 664–668, Munich, Germany, september 03th-06th, https://doi.org/10.1016/j.procir.2018.08.051, 2018a. a, b, c, d, e, f
Heinl, M., Laumer, T., Bayer, F., and Hausotte, T.: Temperature-dependent optical material properties of polymer powders regarding in-situ measurement techniques in additive manufacturing, Polym. Test., 71, 378–383, https://doi.org/10.1016/j.polymertesting.2018.09.016, 2018b. a
Hough, P. and Arbor, A.: Method and means for recognizing complex patterns. U.S. Patent 3,069,654, US Patent and Trademark Office, Alexandria, Virginia, 1962. a
Imkamp, D., Schmitt, R., and Berthold, J.: The outlook of manufacturing metrology – VDI/VDE-GMA roadmap manufacturing metrology, Tech. Mess., 79–10, 433–439, https://doi.org/10.1524/teme.2012.0251, 2012. a
Inigo, R. M., McVey, E. S., Berger, B., and Wirtz, M.: Machine vision applied to vehicle guidance, IEEE T. Pattern Anal., PAMI-6–6, 820–826, https://doi.org/10.1109/TPAMI.1984.4767606, 1984. a
Jähne, B.: Digitale Bildverarbeitung, vol. 6, Springer Berlin-Heidelberg, ISBN 978-3-540-24999-3, 2005. a
Kimme, C., Ballard, D., and Sklansky, J.: Finding circles by an array of accumulators, Commun. ACM, 18–2, 120–122, https://doi.org/10.1145/360666.360677, 1975. a
Kruth, J.-P. and Mercelis, P.: Procedure and apparatus for in-situ monitoring and feedback control of selective laser powder processing, patent US20090206065A1, US Patent and Trademark Office, Alexandria, Virginia, 2009. a
Krystek, M.: ISO-Filters for precision engineering, Tech. Mess., 76, 133–159, https://doi.org/10.1524/teme.2009.0927, 2009. a
Land, W. S., Zhang, B., Ziegert, J., and Davies, A.: In-situ metrology system for laser powder bed fusion additive process, in: Procedia Manufacturing – 43rd Proceedings of the North American Manufacturing Research, 1, 393–403, https://doi.org/10.1016/j.promfg.2015.09.047, Charlotte, North Carolina, 8–12 June, 2015. a
Lerchen, M., Schinn, J., and Hausotte, T.: Referencing of powder bed for in situ detection of lateral layer displacements in additive manufacturing, J. Sens. Sens. Syst., in review, 2021. a, b, c, d, e
Li, H. and Gruen, A.: LSB-Snakes for industrial measurement applications, Optical 3D Measurement Techniques IV, Wichmann, Berlin-Heidelberg, 169–178, 1997. a
Lott, P., Schleifenbaum, H., Meiners, W., Wissenbach, K., Hinke, C., and Bültmann, J.: Design of an optical system for the in situ process monitoring of selective laser melting (SLM), Physcs. Proc., 12, 683–690, https://doi.org/10.1016/j.phpro.2011.03.085, 2011. a, b
Luhmann, T.: Nahbereichsphotogrammetrie: Grundlagen-Methoden-Beispiele, vol. 4, Wichmann, Karlsruhe, 2018. a
MathWorks: Computer Vision Toolbox, available at: https://de.mathworks.com/help/vision/ (last access: 14 June 2021), 2019a. a, b, c, d
MathWorks: Image Processing Toolbox, available at: https://de.mathworks.com/help/images/ (last access: 14 June 2021), 2019b. a, b
Mukhopadhyay, P. and Chaudhuri, B. B.: A survey of Hough Transform, Pattern Recognition, 48, 993–1010, https://doi.org/10.1016/j.patcog.2014.08.027, 2015. a
Nadernejad, E., Sharifzadeh, S., and Hassanpour, H.: Edge detection techniques: Evaluations and comparisons, in: Applied Mathematical Sciences, 2–31, 1507–1520, Hikari Ltd, Tuscia, Italy, 2008. a
Purtonen, T., Kalliosaari, A., and Salminen, A.: Monitoring and adaptive control of laser processes, Physcs. Proc., 56, 1218–1231, https://doi.org/10.1016/j.phpro.2014.08.038, 2014. a, b, c
Ranganathan, A.: The levenberg-marquardt algorithm, Tutoral on LM algorithm, 11, 101–105, 2004. a
Scheimpflug, T.: Improved method and apparatus for the systematic alteration or distortion of plane pictures and images by means of lenses and mirrors for photography and for other purposes, GB Patent N0 1196, Intellectual Property Office, Newport, South Wales, 1904. a
Schmitt, R. and Damm, B. E.: Prüfen und Messen im Takt – Wie Sie mit inline-Messtechnik ihre Wertschöpfung maximieren (Testing and measuring in strict time – How to maximize your added value with inline measurement technology), in: Qualität und Zuverlässigkeit (QZ), 53–9, 57–59, Hanser, Munich, 2008. a
Sharifi, M., Fathy, M., and Mahmoudi, M. T.: A classified and comparative study of edge detection algorithms, in: Proceedings. International conference on information technology: Coding and computing (ITCC), 117–120, https://doi.org/10.1109/ITCC.2002.1000371, Las Vegas, Nevada, 8–10 April, 2002. a
Shrivakshan, G. and Chandrasekar, C.: A comparison of various edge detection techniques used in image processing, International Journal of Computer Science Issues (IJCSI), 9–5, 269–276, 2012. a
VDI3405: 2014–12, Additive manufacturing processes, rapid manufacturing – Basics, definitions, processes. ICS 25.020. Standard (VDI 3405, 2014), Beuth, Berlin, 2014. a
Zhang, B., Ziegert, J., Farahi, F., and Davies, A.: In situ surface topography of laser powder bed fusion using fringe projection, Additive Manufacturing, 12, 100–107, https://doi.org/10.1016/j.addma.2016.08.001, 2016. a
Zhang, Y. and Wu, L.: Optimal multi-level thresholding based on maximum Tsallis entropy via an artificial bee colony approach, Entropy, 13–4, 841–859, https://doi.org/10.3390/e13040841, issn 1099-4300, 2011. a
Zhang, Z.: A flexible new technique for camera calibration, in: IEEE T. Pattern. Anal., 22, 1–21, https://doi.org/10.1109/34.888718, 2000. a, b, c, d
Zur Jacobsmühlen, J., Kleszczynski, S., Witt, G., and Merhof, D.: Robustness analysis of imaging system for inspection of laser beam melting systems, in: Proceedings to the 19th IEEE Conference on Emerging Technology and Factory Automation (ETFA), 1–4, https://doi.org/10.1109/ETFA.2014.7005262, Barcelona, Spain, 16–19 September, 2014. a
Zur Jacobsmühlen, J., Achterhold, J., Kleszczynski, S., Witt, G., and Merhof, D.: Robust calibration marker detection in powder bed images from laser beam melting processes, in: IEEE International Conference on Industrial Technology (ICIT), 910–915, ISSN 978–1–4673–8075–1, https://doi.org/10.1109/ICIT.2016.7474873, Taipei, Taiwan, 14–17 March, 2016. a