the Creative Commons Attribution 4.0 License.
the Creative Commons Attribution 4.0 License.
 | 22 Feb 2021
Comparison of laser-based photoacoustic and optical detection of methane
Thomas Strahl
Johannes Herbst
Eric Maier
Sven Rademacher
Christian Weber
Hans-Fridtjof Pernau
Armin Lambrecht
Jürgen Wöllenstein
The measurement of low methane (CH4) concentrations is a key objective for safety of industrial and public infrastructures and in environmental research. Laser spectroscopy is best suited for this purpose because it offers high sensitivity, selectivity, dynamic range, and a fast measurement rate. The physical basis of this technique is infrared absorption of molecular gases. Two detection schemes – direct absorption spectroscopy (DAS) and photoacoustic spectroscopy (PAS) – are compared at three wavelength regions in the near-infrared (NIR), mid-wavelength (MWIR), and long-wavelength (LWIR) infrared ranges. For each spectral range a suitable semiconductor laser is selected and used for both detection techniques: a diode laser (DL), an interband cascade laser (ICL), and a quantum cascade laser (QCL) for NIR, MWIR and LWIR, respectively. For DAS short absorption path lengths comparable to the cell dimensions of the photoacoustic cell for PAS are employed. We show that for DAS the lowest detection limit can be achieved in the MWIR range with noise-equivalent concentrations (NECs) below 10 ppb. Using PAS, lower detection limits and higher system stabilities can be reached compared to DAS, especially for long integration times. The lowest detection limit for PAS is obtained in the LWIR with a NEC of 7 ppb. The different DAS and PAS configurations are discussed with respect to potential applications.
- Article
(4209 KB) - Full-text XML
- BibTeX
- EndNote


Natural gas is one of the most important energy sources and is needed for many products. The main constituent of natural gas is methane (CH4). Furthermore, methane is explosive as well as a greenhouse gas with significant global warming potential (EPA and OA, 2016). Due to these facts, sensor concepts to determine the concentration of methane are highly required and demanded (Frost and Sullivan, 2015).
Methane detection can be realized in a large variety of different concepts. In this paper, the focus is on two laser-based detection concepts applied in an extractive configuration. A laser-based solution should principally aim at a selective, sensitive and fast detection, otherwise the relative costly laser is probably not a well-suited choice. In the following, an optical and a non-optical laser-based detection scheme are investigated with respect to a potentially suited methane detection application. The two different detection schemes are based on tuneable diode laser absorption spectroscopy (TDLAS) with a photodetector (optical) and laser-based photoacoustic spectroscopy (PAS) with a microphone as a detector (non-optical). The concepts are realized in a comparable simple manner, in particular from an optical point of view. TDLAS is traditionally applied in a wavelength modulation spectroscopy (WMS) setup using a lock-in technique to demodulate the signal at the second harmonic – known as the WMS-2f concept (Reid and Labrie, 1981). Another TDLAS concept is the direct absorption spectroscopy – known as DAS – where the laser light intensity of the corresponding wavelength scan is directly detected and analysed after passing the gas sample. The significant technical progress over the last decade, regarding analogue-to-digital converters (ADCs), field programmable analogue arrays (FPGAs) and microcontrollers, enables a powerful DAS application with a great potential for signal processing due to its fundamental approach (Lins et al., 2010). In this paper, TDLAS is applied in the DAS manner. Of course, the idea to compare TDLAS (in particular WMS-2f) with PAS is not unique and was done before (Schaefer et al., 1998). The aim of this paper is an investigation of the best-suited configuration with respect to laser and methane absorption line selection and detection scheme. Methane has several absorption bands in the near-infrared (NIR) and mid-infrared (MIR) spectral ranges. The strongest absorption lines are in the MIR, which can be further subdivided into the mid-wave infrared range (MWIR, 3–5 µm) and the long-wave infrared range (LWIR, 7–12 µm). Strong methane absorption lines are located in these MWIR and LWIR regions around a wavelength of 3.3 and 7.8 µm, respectively. The latter ones have a slightly weaker absorption compared to the ones in the MWIR, whereas the NIR absorption lines around 1.6 µm are approximately 2 orders of magnitude weaker (Fig. 1). Nevertheless, diode lasers (DLs) operating in the NIR are frequently used and are the preferred workhorse for cost reasons. Meanwhile, two other types of compact semiconductor lasers are also available for the other two spectral regions of interest, namely the interband cascade lasers (ICLs) in the MWIR and the quantum cascade lasers (QCLs) in the LWIR ranges.

Figure 1Methane IR absorption bands in the long-wave infrared (LWIR), mid-wave infrared (MWIR) and near-infrared (NIR) spectral regions versus wavenumber (i.e. inverse wavelength in cm−1). Line data are obtained from the HITRAN database (Rothman and Gordon, 2013). The applied types of semiconductor lasers (DL for NIR, ICL for MWIR, and QCL for LWIR) are also indicated.
The DAS and PAS concepts are investigated with the above-mentioned three different laser types operating at three different wavelength regions (NIR, MWIR and LWIR). The aim of this paper is to compare the different configurations and to recommend an optimum configuration for a certain application such as methane leak detection.
The fundamental relation of gas absorption spectroscopy is given by the Beer–Lambert law:
where Iν is the frequency-dependent transmitted intensity after passing a homogenous gas sample with an optical path length l. The frequency-dependent gas-specific cross section is σν, which is given by the product of the temperature-dependent line strength and the line shape function (e.g. Voigt profile). More details can be found in the standard literature (Hanson et al., 2016). The number density (nX) of a specific gas is related to gas concentration (c, volume mixing ratio).
Small gas molecules such as CO, CO2 and CH4 show characteristic absorption spectra in the MIR region, which are composed of many isolated rovibrational molecular transition lines. Many of these small molecules are well documented in spectral databases, e.g. HITRAN (Rothman and Gordon, 2013). These HITRAN parameters can be used straightforwardly in combination with the DAS concept for the calibration-free analysis of the gas concentration.
In short, the laser-based photoacoustic spectroscopy works in the following way: the gas absorbs energy from the laser radiation. This energy is transferred into local heating and generates a thermal expansion. The thermal expansion can be related to a pressure change by means of the ideal gas law. In a resonant configuration, the laser light is periodically modulated, which can form a standing pressure or sound wave. Much more fundamental details can be found in the literature (Kreuzer, 1977; Miklós et al., 2001). The resulting photoacoustic (PA) signal can be written in the following equation (Bozoki et al., 2011):
where S is the microphone signal at the light modulation frequency ω, M is the microphone sensitivity, Pν describes the optical power for the excitation, the photoacoustic cell constant is given by Cω, and the conversion efficiency of the absorbed light energy into heat is described by η. The frequency-dependent gas-specific absorption coefficient according to Beer and Lambert is described by αν and c is the gas concentration. Furthermore, Ab describes the background (also called the “zero-gas” background, which is the background for dry nitrogen gas) signal that should be ideally zero or at least close to zero.
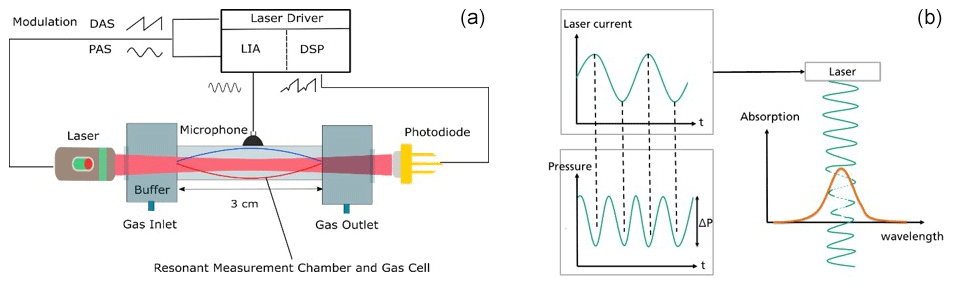
Figure 2(a) Schematic setup of the combined DAS/PAS experiment. The photoacoustic signal is analysed with a lock-in amplifier (LIA), whereas the DAS signal of the photodiode is directly recorded and analysed by a digital signal processing (DSP) (b) modulation concept of PAS.
Table 1Selected absorption lines of CH4 (ambient air contains 1.8 ppm CH4) and corresponding laser data. Line data are obtained from the HITRAN database (Rothman and Gordon, 2013).
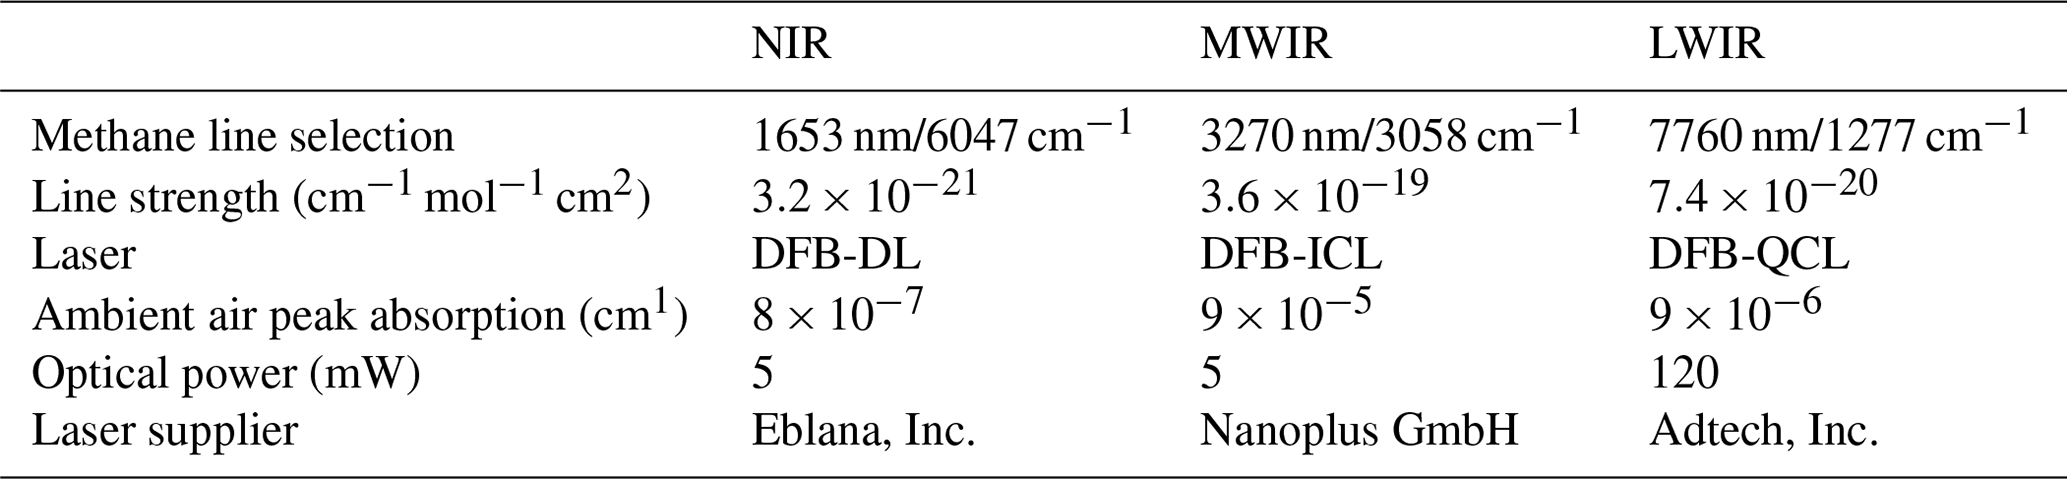
The selected methane absorption lines in the NIR, MWIR and LWIR in terms of wavelength and line strength as well as the corresponding lasers are documented in Table 1. The lasers are single-mode frequency lasers (e.g. distributed feedback (DFB) semiconductor lasers) and are operated in continuous-wave mode (cw). They are electrically pumped by applying an injection current and are individually characterized by their slope efficiency, temperature-tuning and current-tuning behaviour. The slope efficiency (in units of W A−1) describes how a higher injection current leads to a higher optical output power. Furthermore, the emission wavelength of the laser can be changed by changing the substrate temperature or the injection current. In this paper, the lasers are modulated by the injection current, which causes an internal temperature modulation. This changes the resonator length (as well as bandgap and refractive index) of the laser. Consequently, the emission intensity and wavelength are modulated simultaneously.
To compare the performance of the two laser-based CH4 gas detection schemes (DAS and PAS), the same lasers are used, and comparable short and simple optical absorption paths are employed for both techniques. According to the Beer–Lambert law, a larger optical path length can increase the absorption signal and consequently the sensitivity. However, larger optical path lengths require a more advanced optical design, and one intention of this paper is to keep the setup as simple as possible for a basic comparison. The setup is schematically shown in Fig. 2a.
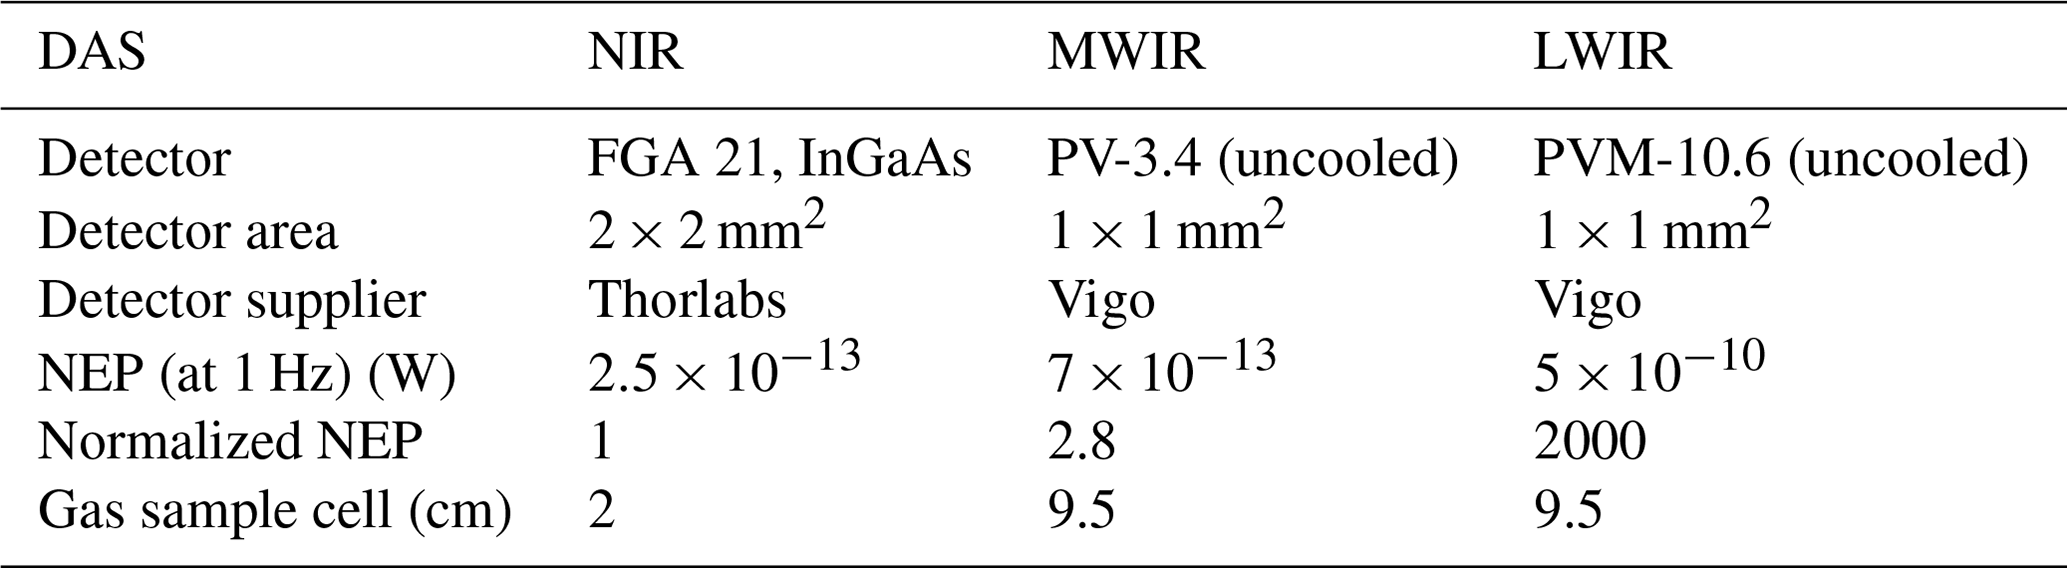
Table 2Detector and gas cell properties for the DAS experiments.
3.1 Setup for direct absorption spectroscopy
Regarding the DAS setup, three different photodetectors were used, which are optimized for the corresponding wavelength range (NIR, MWIR, LWIR). Characteristic data are listed in Table 2. Instead of the photoacoustic cell shown in Fig. 2a, short gas cells with uncoated CaF2 windows were inserted between laser and detector. Typically, for NIR a 2 cm cell and for MWIR and LWIR 9.5 cm cells were used. Different gas mixtures of CH4 in dry N2 were supplied with a continuous flow rate of 500 mL min−1 to the corresponding gas cell. The gas was kept at ambient lab temperature and pressure values. With DAS the laser emission was swept across a selected CH4 absorption line using a 100 Hz sawtooth current modulation. The detector signals were acquired by a 18-bit ADC. Sixty-four spectra were averaged, followed by a 3-fold moving average. As frequently used with DAS, gas concentrations were obtained by fitting the measured spectra with available line parameters from the HITRAN spectral database (Rothman and Gordon, 2013). The relation between samples (i.e. current steps) and wavenumber steps (cf. the current-tuning curve) could be determined by an etalon. This technique enables calibration-free determination of gas concentrations.
3.2 Setup for photoacoustic spectroscopy
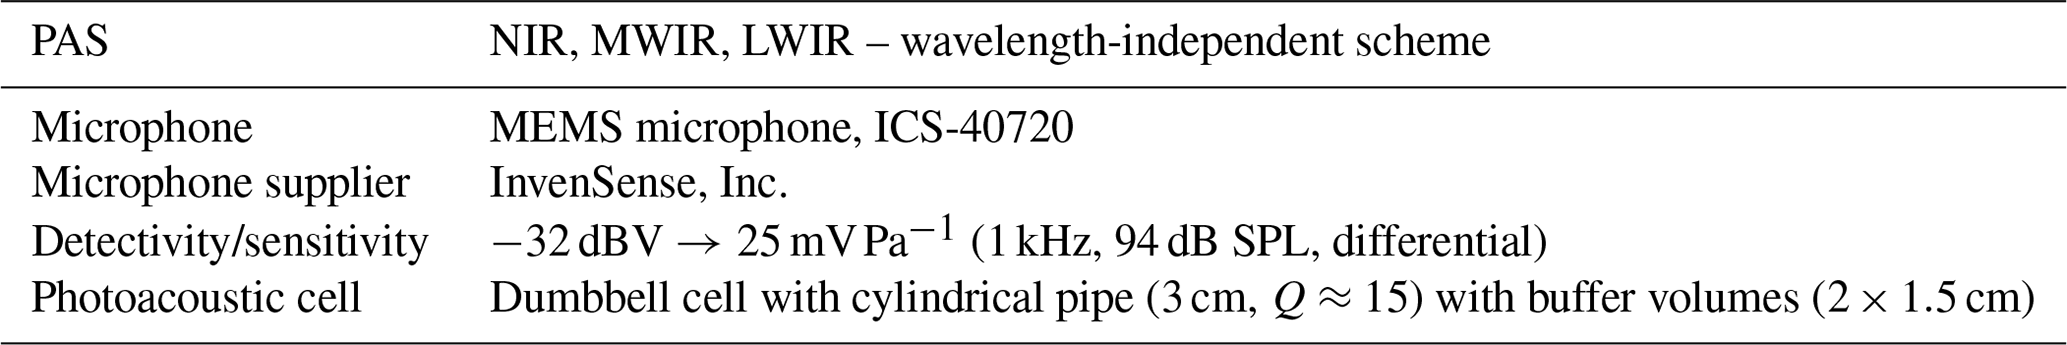
For the PAS experiments, a dumbbell cell schematically shown in Fig. 2a was employed. It has a 3 cm long cylindrical pipe and a buffer volume of 1.5 cm length at each side, resulting in a total optical absorption path length of 6 cm. At resonance, a quality factor Q around 15 was obtained. Different gas mixtures of CH4 in dry N2 were supplied with a continuous flow rate of 300 mL min−1 to the corresponding PA cell. For the modulation and detection scheme, respectively, a periodic wavelength modulation (laser) is applied in order to generate a periodic pressure variation (photoacoustic signal). Therefore, the laser is modulated by a laser current with a frequency half of the resonance (dumbbell cell), and the variation of the pressure signal is detected at the resonance frequency by a lock-in amplifier. In other words, the photoacoustic signal is detected at the second harmonic of the laser modulation frequency as illustrated in Fig. 2b. The amplitude of the pressure variation is measured by a differential pressure sensor, i.e. using a MEMS microphone (Table 3). The pressure amplitude is proportional to the gas concentration. Consequently, the signal of the microphone can be analysed with a lock-in amplifier in order to obtain the gas concentration. In contrast to the DAS technique, the CH4 absorption line is not completely resolved (spectrum) since the PA effect is energy dependent. In order to maximize the optical energy in the gas (i.e. the signal) and the measurement rate, the laser current (i.e. emission wavelength) was adjusted to the absorption maximum at the line centre. At this set point the laser was modulated by a sinusoidal current at the resonance frequency of the dumbbell cell around 2.6 kHz. The current amplitude of the sine wave was chosen in such a way that the simultaneous wavelength modulation (WM) induces the highest possible PA signal. The resulting frequency modulation across the absorption line is typically of the order of the full width at half maximum (FWHM, less than 0.1cm−1). This WM leads to a modulation of the absorbed energy by the gas. The photoacoustic effect generates a modulated standing acoustic wave in the resonator, which is detected by the microphone. For data acquisition a SR830 DSP lock-in amplifier was used with a short integration time of 30 ms in order to have a relatively fast response time.
Table 3Microphone and cell properties for the PAS experiments.
Obviously, the spectral resolution of PAS is limited by this technique. An additional low-frequency bias current sweep to obtain an absorption spectrum would either slow down the total measurement rate or lower the sensitivity (signal) significantly.
In this section the measurement results of the DAS and PAS are shown and briefly explained. A more detailed interpretation and discussion will follow in the next section.
4.1 Results for direct absorption spectroscopy
A typical sequential signal processing for the DAS method is illustrated in Fig. 3. The raw data show the photodetector signal (intensity according to Beer–Lambert) in digital units. In the first step, the dark current is subtracted by means of the initial gap, where the laser is off. After that, a baseline correction takes place and the (negative) natural logarithm is applied in order to obtain the absorption spectrum. The concentration is calculated from the absorption peak area using the corresponding HITRAN parameters. The area is determined either by a numerical integration or a Voigt line fit, depending on the signal-to-background ratio (SBR). Typically, for a SBR above 10, a line fit is applied. In Fig. 3, the nitrogen spectrum (which we call the “zero-gas” spectrum in the following) shows some absorbance modulation which is caused by a residual optical interference in the setup. Such features will affect the signal analysis and reduce the SBR. Interferences typically show a sinusoidal structure, and thus the background is estimated by their amplitude. Generally, the fringe amplitude is independent of the cell length. The concentration analyses of the NIR, MWIR and LWIR results are made in a similar way.
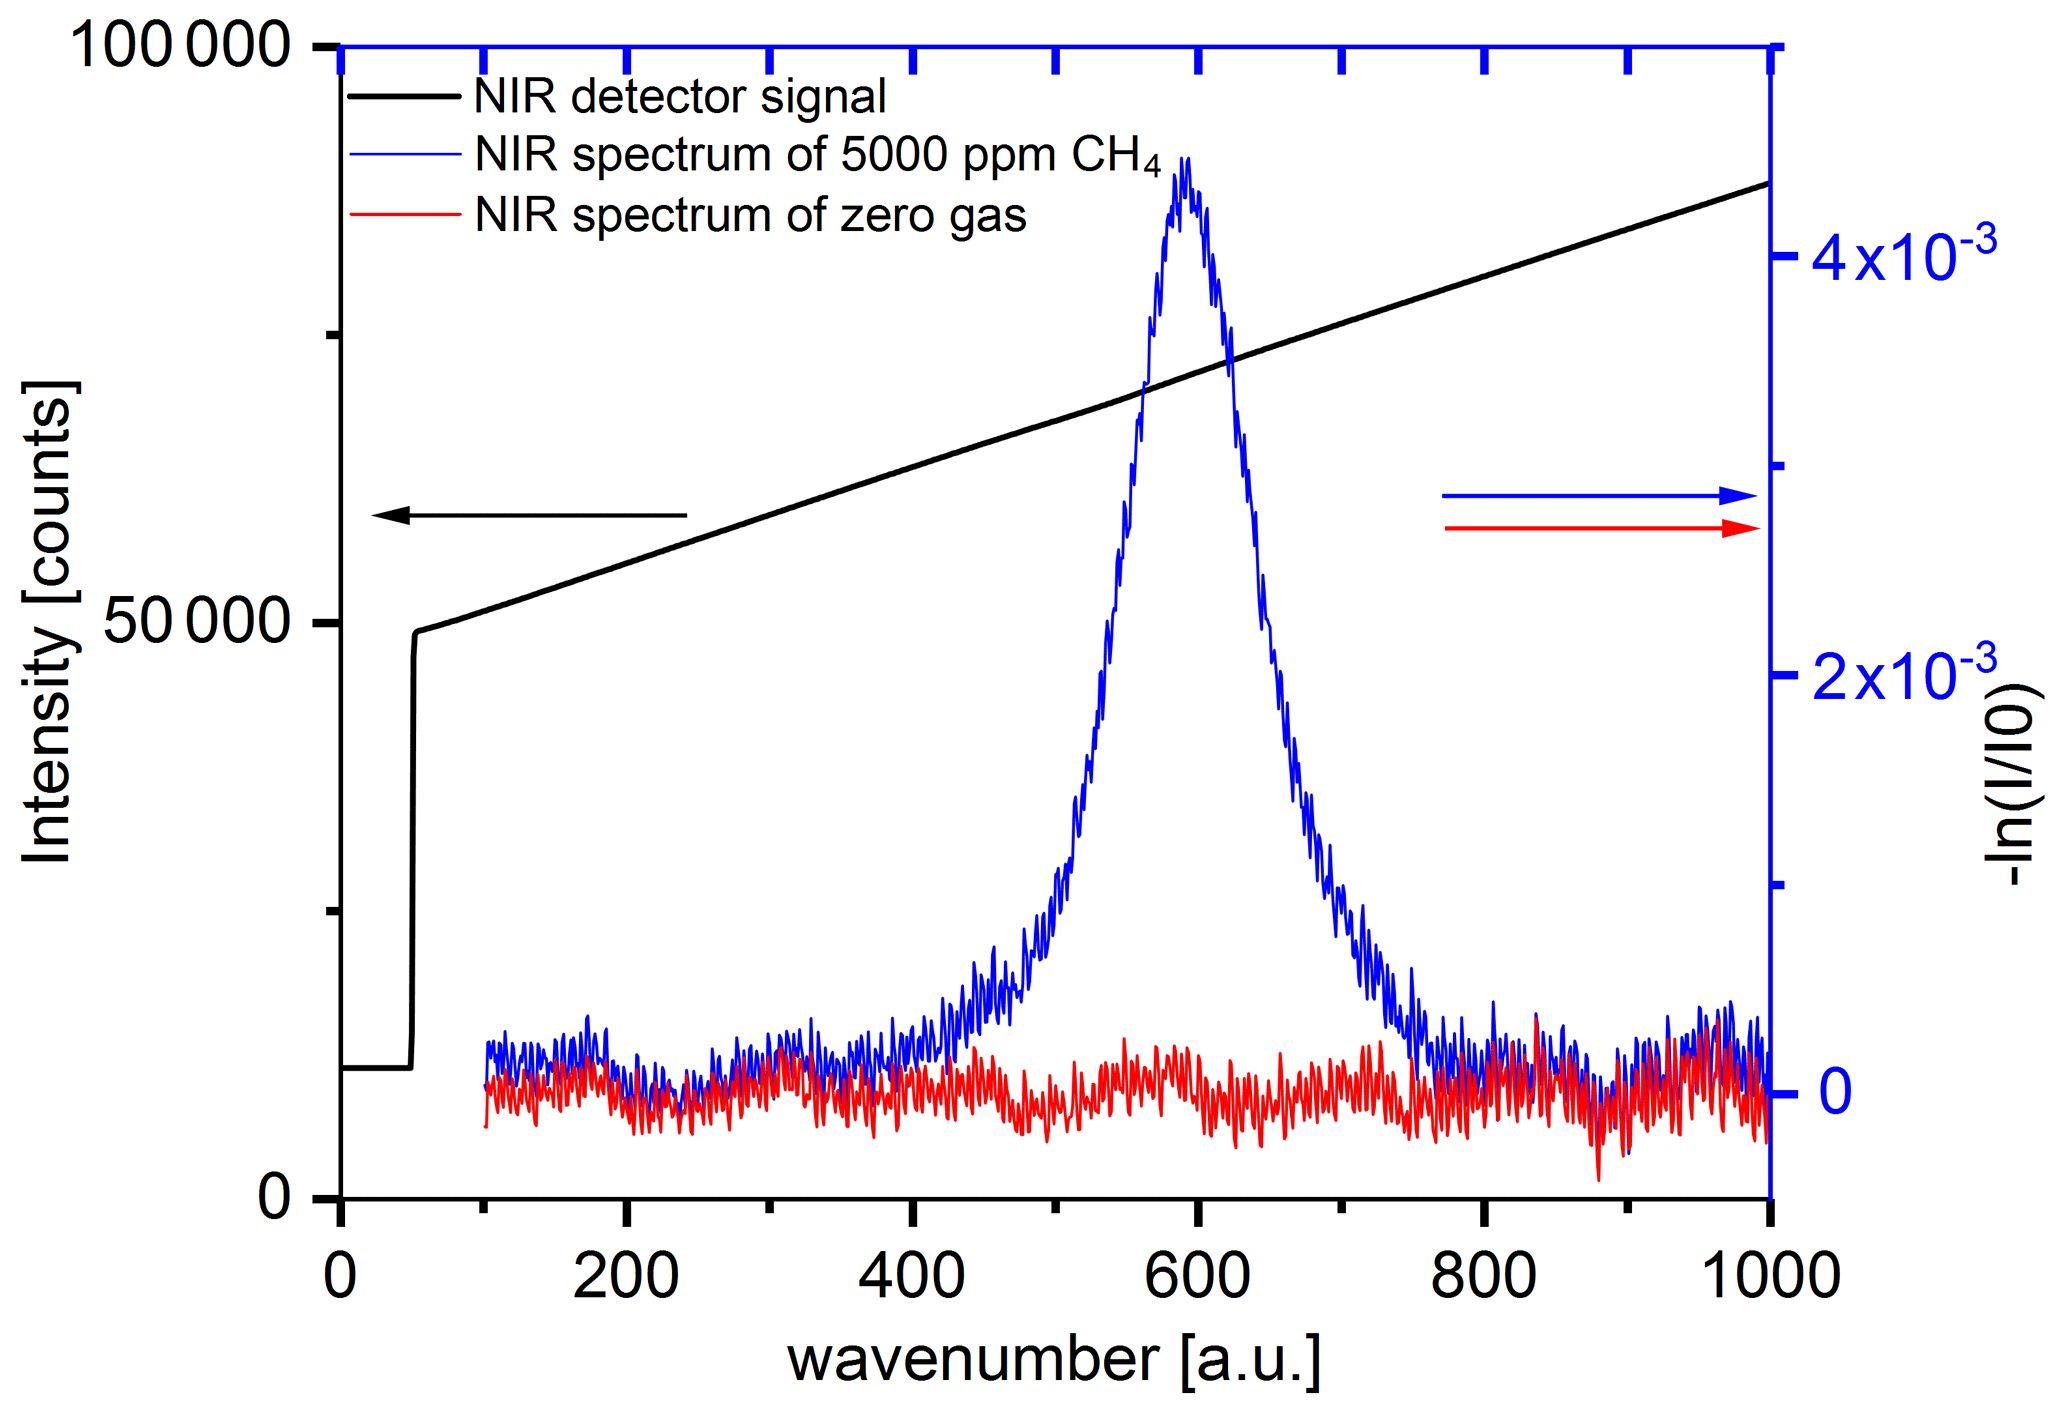
Figure 3NIR raw and baseline-corrected absorbance data. Left scale: detected laser intensity as a function of the laser current ramp. The intensity dip due to the CH4 absorption is not visible in this scale. Right scale: calculated absorbance spectrum after baseline correction for 5000 ppm CH4 and zero gas (dry N2).
Figure 4 demonstrates that a large concentration range is linearly covered by the three spectral ranges. The results of the different DAS spectrometers, which usually achieve an individual dynamic range of around 3 orders of magnitude, can be merged into a common linear response curve with a dynamic range from 1 to 106 ppm. The concentration analysis in this case was performed by a line-fitting procedure based on HITRAN line parameters. By the knowledge of the laser-tuning characteristics and the absorption lengths, a calibration-free measurement is achieved.

Figure 4Results of the DAS measurements in the NIR, MWIR and LWIR spectral ranges of a series of gas mixtures of CH4 in N2.
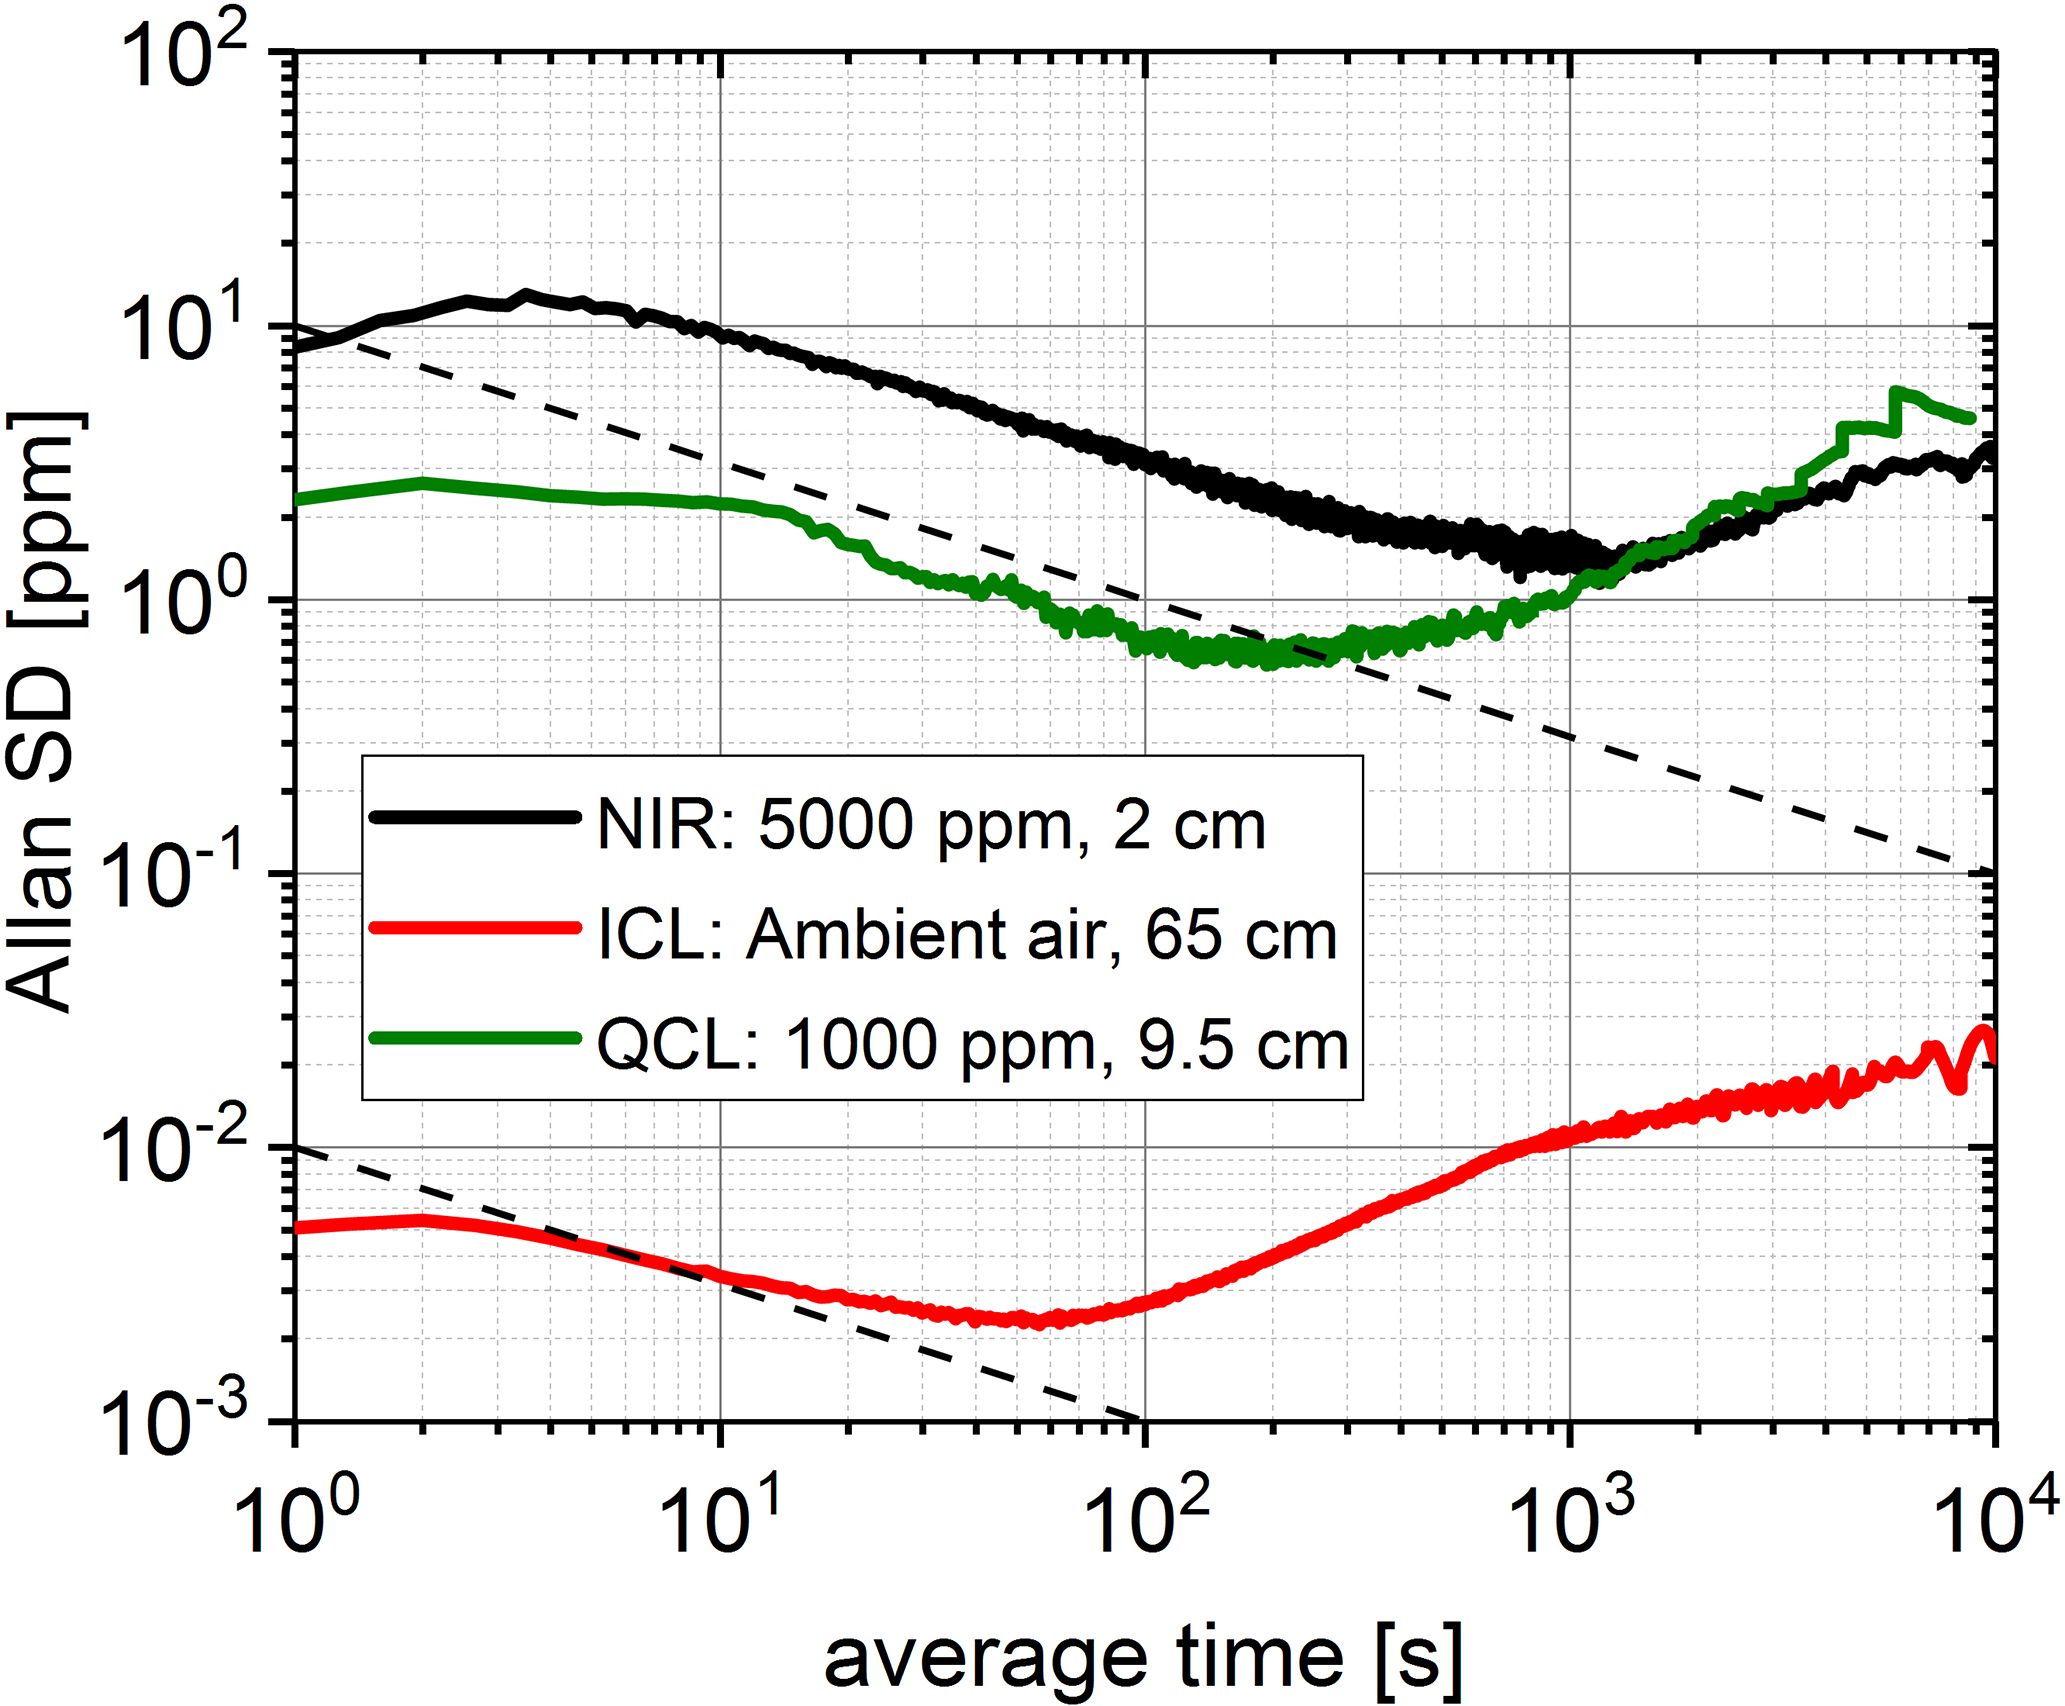
Figure 5Allan plots for the NIR, ICL and QCL measurements. The Allan deviations are measured for different cell lengths and concentrations. The reduction of the Allan data for integration times<5 s is caused by the moving average of the DAS data acquisition procedure. Dashed black lines indicating a typical dependence for white noise are shown as guides for the eye.
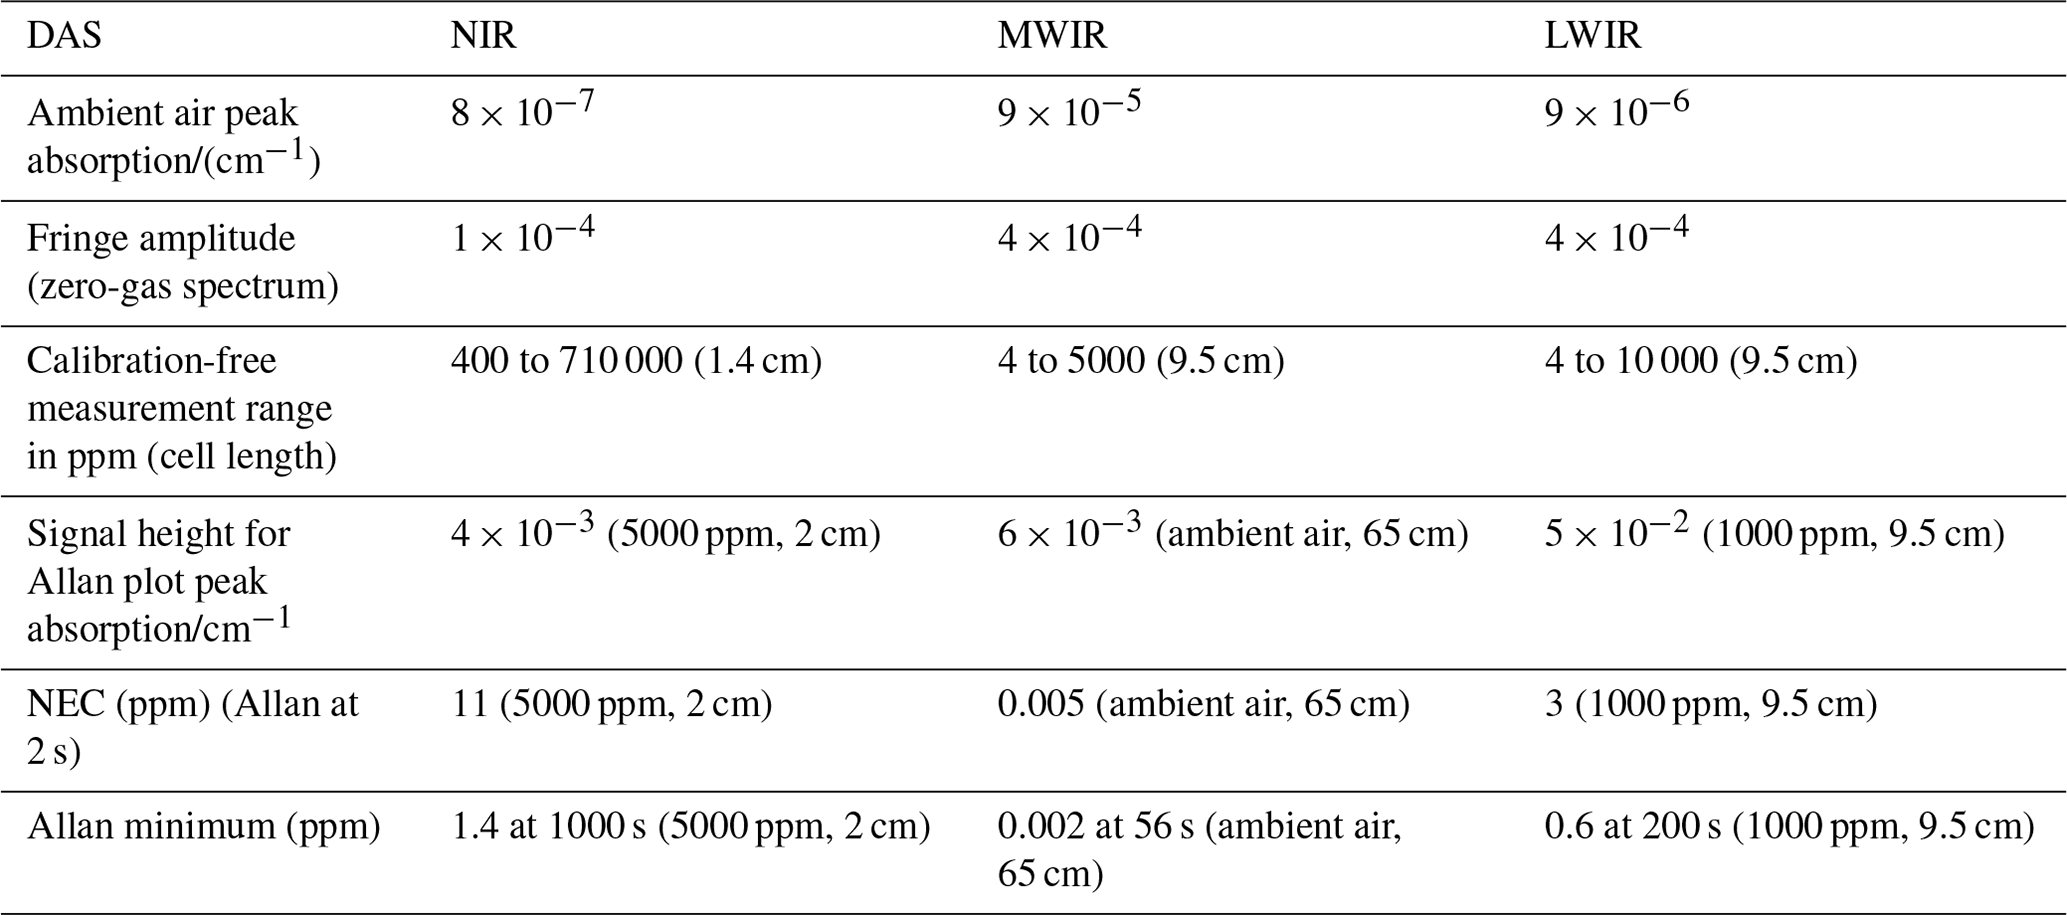
The measurement of lower concentrations is principally feasible but practically limited by the SBR, which can be illustrated by the values of the fringe amplitude and the peak absorption of ambient air calculated by HITRAN parameters (Table 4). According to these circumstances, an accuracy problem would take place and the linear relationship between measured concentration and set point concentration would be lost.
The noise features allow us to determine much lower concentration values as shown by the Allan standard deviation in the Allan–Werle plot1 (Werle, 2011) in Fig. 5. The measurements were performed with a sufficiently high SBR in order to estimate the precision and drift of a real signal. The dotted line in the Allan plot indicates white noise characteristics (a slope of −0.5 in the log–log scale corresponds to the inverse square root of the average time). A significant reduction of the standard deviation can only be achieved in the NIR, where an averaging time of 1000 s was possible. The MWIR and LWIR setups show significant drift behaviours that match the observation of higher fringe levels. A significant white noise averaging effect is not seen. However, the ICL used in the MWIR setup shows the best results overall regarding the optical detection scheme. Key results of DAS are summarized in Table 4 and further discussed later in comparison with the PAS detection scheme.
4.2 Results for photoacoustic spectroscopy
In Fig. 6, the acoustic resonance profile of the dumbbell cell (Fig. 2a) is measured by variation of the QCL modulation frequency. The spectra show a resonance peak around 2.67 kHz. The influence of the laser power is clearly demonstrated by inserting neutral density (ND) filters into the QCL beam. A linear decrease in the microphone signal can be related to the reduced laser intensity. If the QCL intensity is reduced by a factor of 100, the signal of 10 ppm CH4 is similar to the resonance signal of the zero-gas background of N2 obtained with full QCL power. This residual resonance peak mainly corresponds to ambient noise.
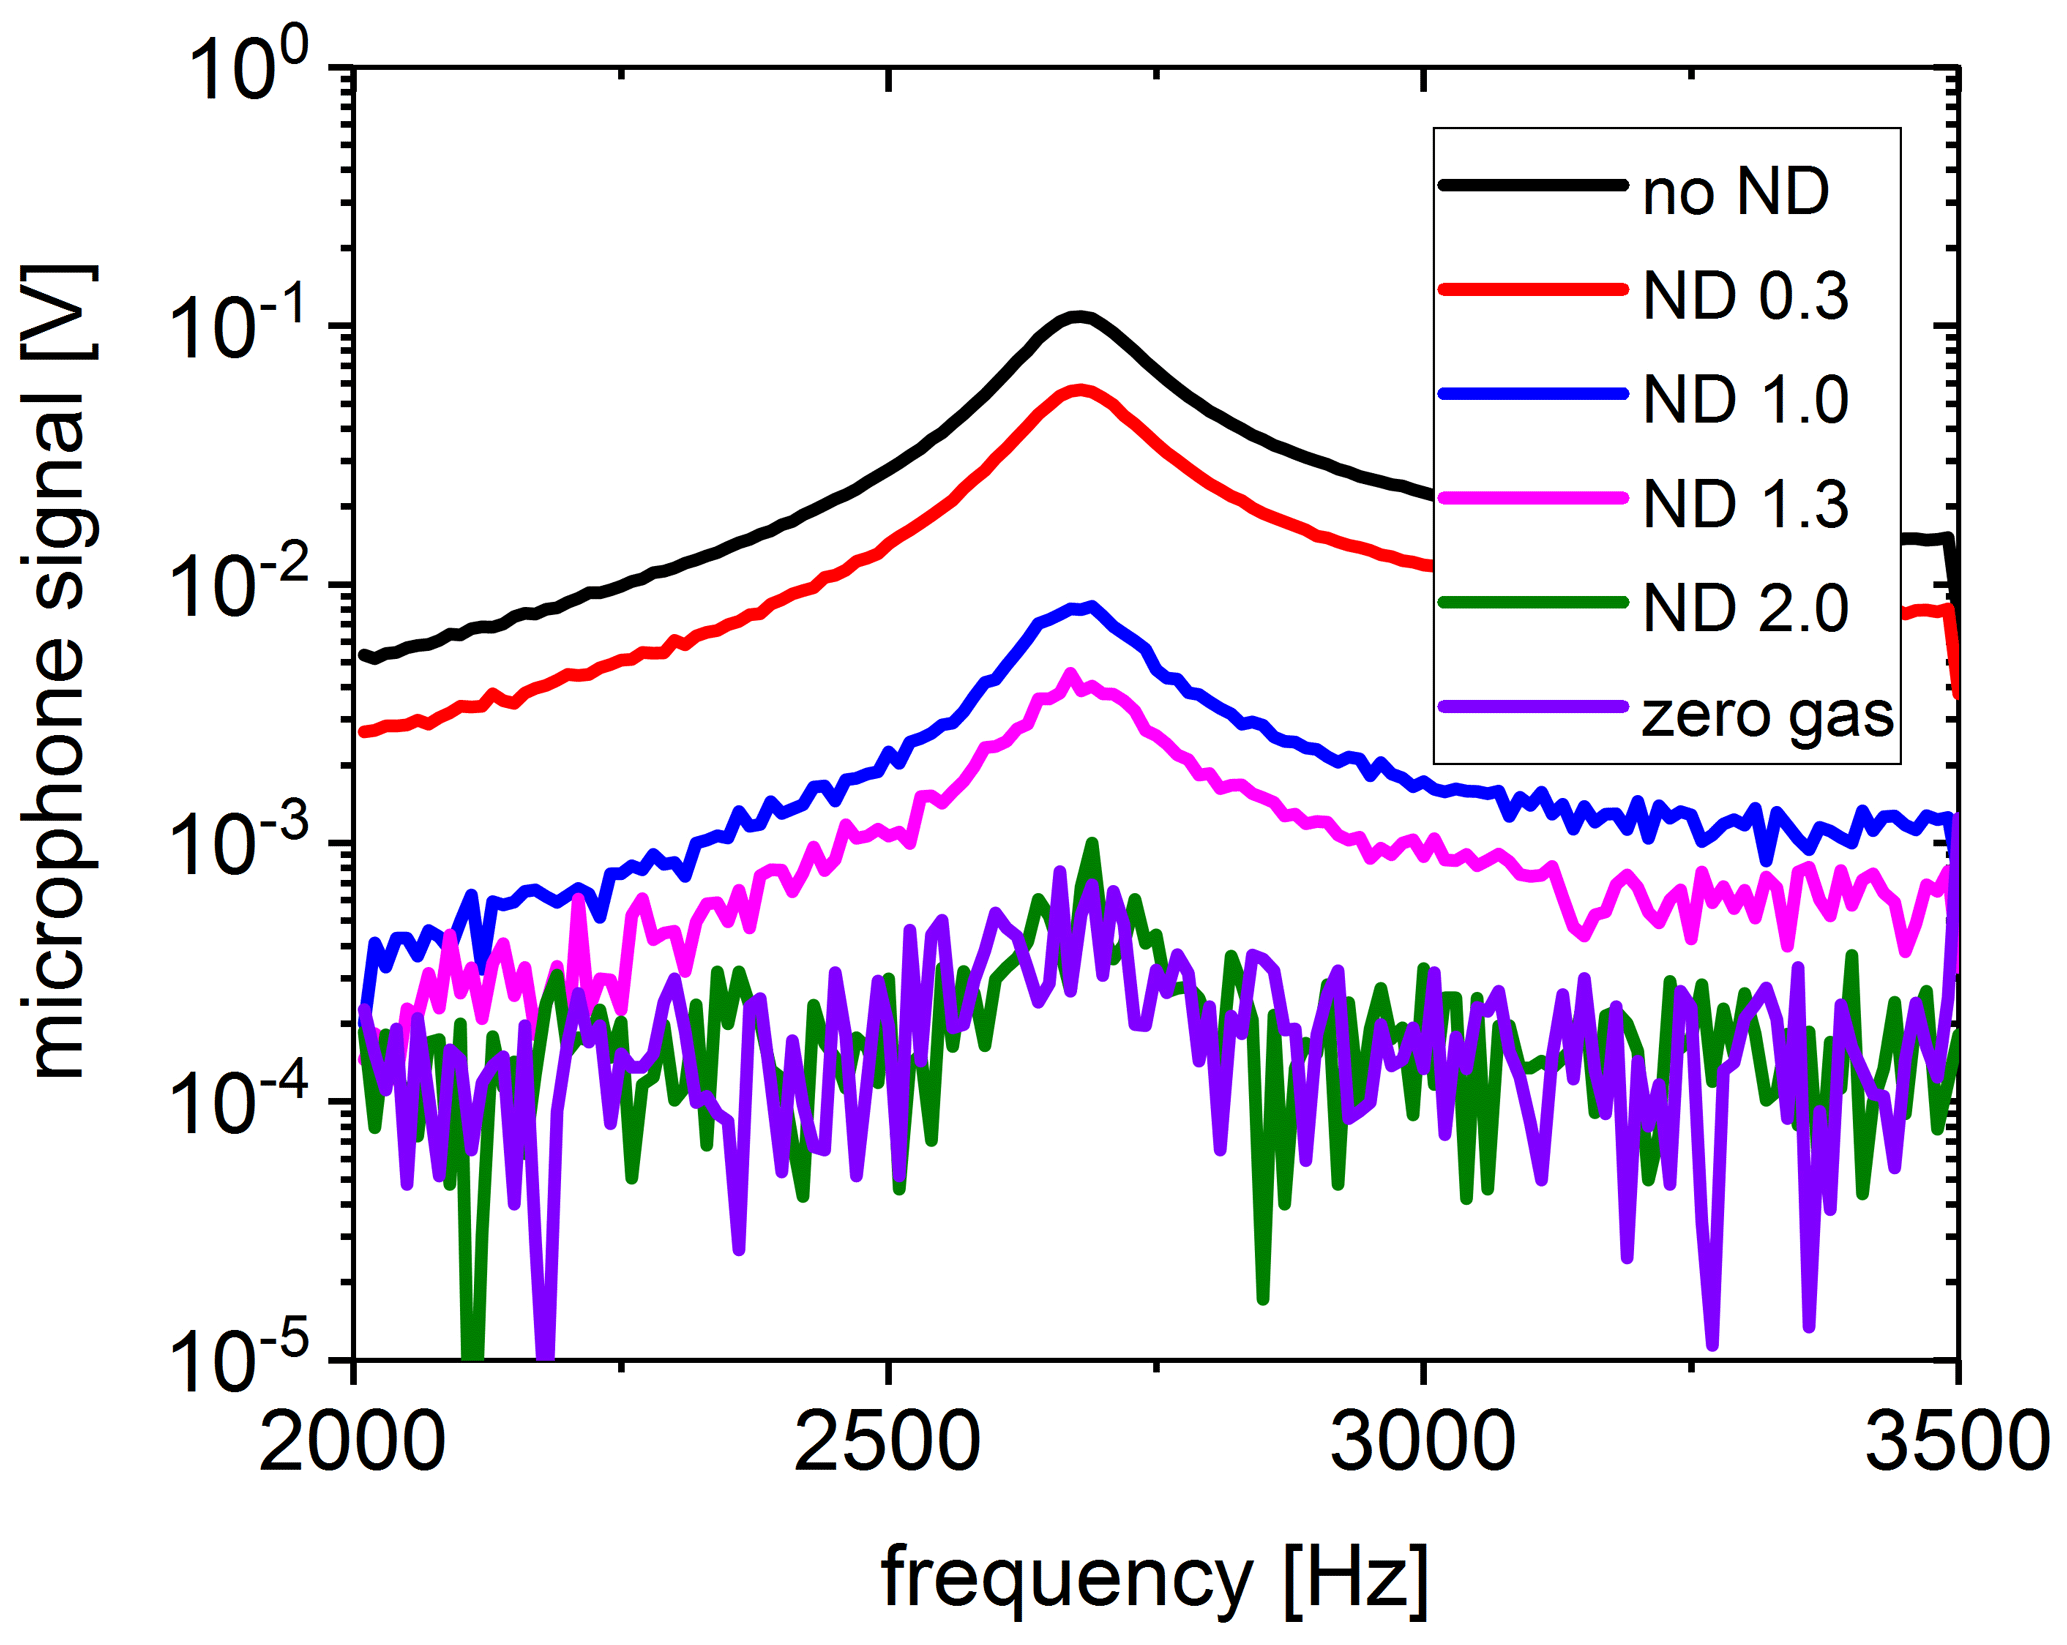
Figure 6Acoustic resonance spectra for 10 ppm CH4 in the PAS cell. The QCL intensity was changed using neutral density (ND) filters. The zero-gas spectrum was obtained with no ND.
The PAS microphone signals for various concentrations are shown in Fig. 7a. Due to the different laser powers and absorption line strengths, the signal amplitudes vary over orders of magnitude for a given gas concentration between the three setups. A linear PAS calibration can be applied for all lasers and wavelength regimes. Close to the zero-gas levels, the linearity does not hold anymore since noise effects begin to dominate. However, the QCL measurements indicate a linearity in the 100 ppb regime. In contrast to the fringes observed with DAS, the background of the PAS method is relatively simple to classify: it is a constant offset with white noise characteristics mainly resulting from ambient noise (or flow noise if the system operates under gas flow conditions). Increasing the integration time of the lock-in detection lowers the background level in terms of absolute value and noise. According to this fact, the SBR can be easily determined with PAS. Based on the SBR, a related detection limit (LODSBR) can be determined using the calibration slope.
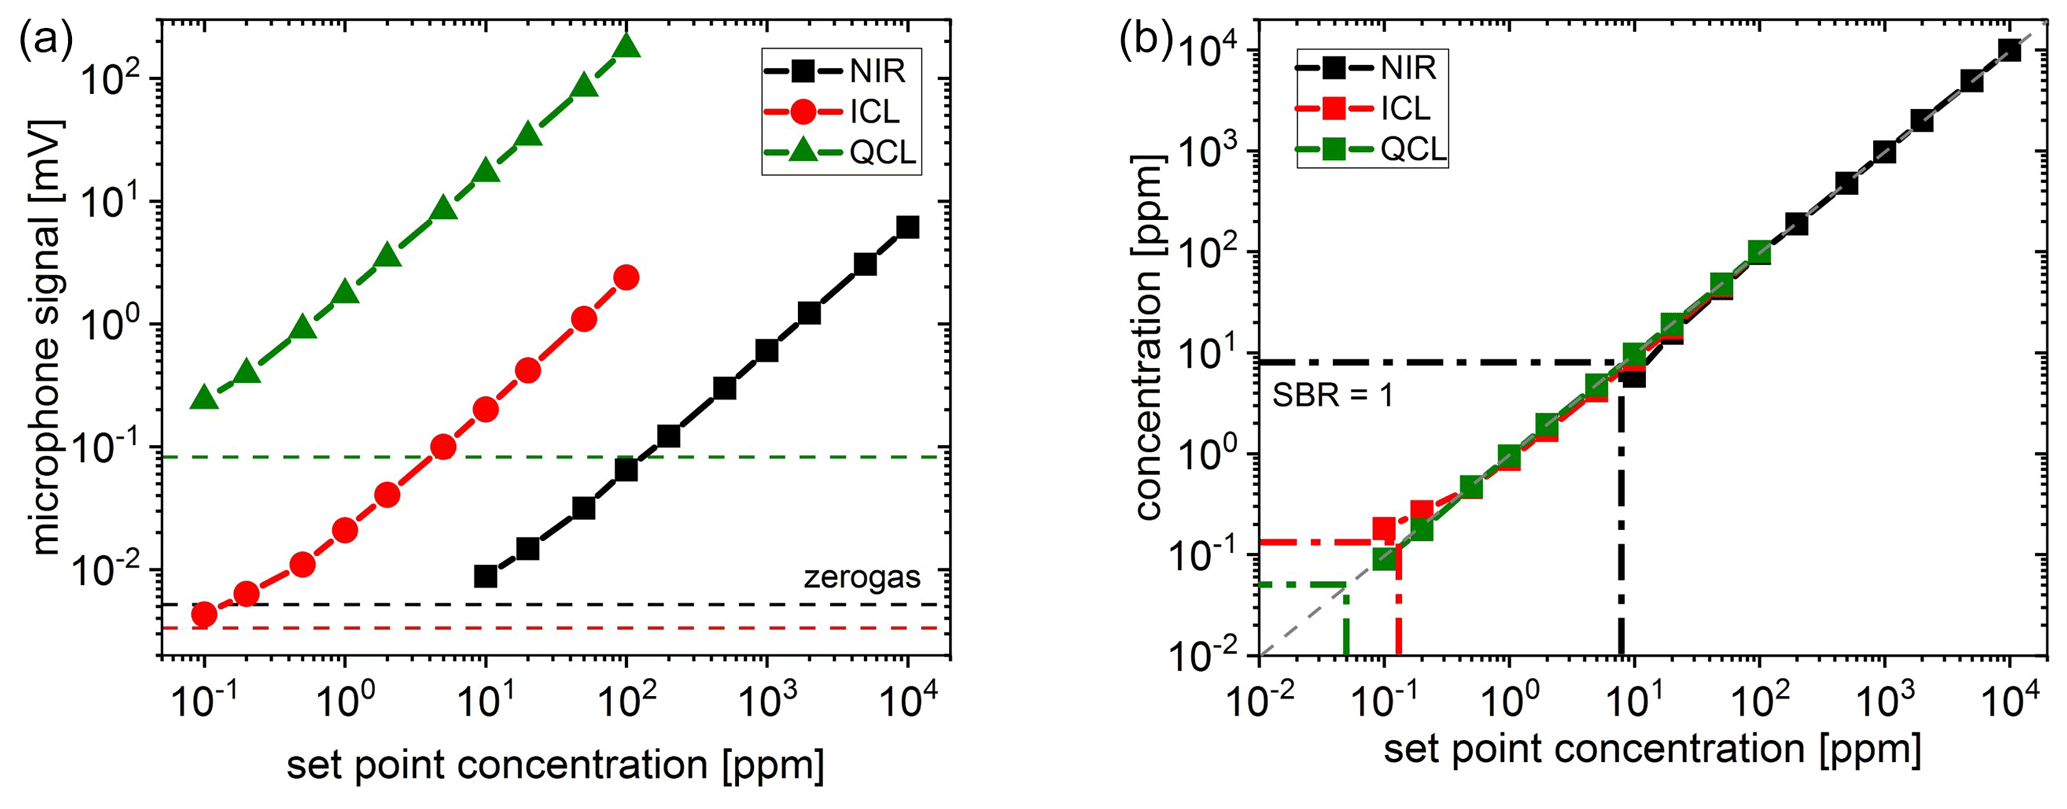
Figure 7(a) Gas calibration curves of the PAS measurements. The signal levels for zero gas (dry N2) are indicated for the three different lasers NIR, ICL and QCL. (b) Merged calibration curves similar to Fig. 4. LODs corresponding to SBR=1 are indicated for the three lasers.
For a further investigation of the sensitivity and stability, the Allan standard deviations of the three setups are calculated and shown in Fig. 8. From these data noise-equivalent concentrations (NECs) can be obtained. All three setups show a remarkable white noise characteristic in contrast to the DAS setup. In all the cases, large integration times up to several hundreds of seconds are possible in order to reduce the noise. The drift behaviour can only be observable after very large average times. The drift effect after a 10 000 s average time approximately corresponds to the initial noise level.

Figure 8Allan standard deviation σA versus integration time τ for the PAS measurements using the calibrations of Fig. 6a. Dashed lines indicating a typical dependence for white noise (black) and for a typical drift behaviour (red) are shown as guides for the eye.
Figure 8 shows that the QCL experiment yields the lowest Allan standard deviations. The minimum at an integration time of 200 s indicates a fair stability of the setup. The minimum is narrower than for the other two lasers, indicating one dominating drift mechanism. As the PAS signal is proportional to the laser intensity (see Eq. 2), the high power of the QCL in comparison with the other laser sources is the main reason for this result. The Allan deviation curve of the ICL is almost 1 order of magnitude higher than the QCL curve despite the stronger MWIR absorption. The main reason is the lower ICL emission intensity. The Allan minimum of the ICL is almost flat between 200 and 2000 s and then approaches the curve for the QCL. Finally, the Allan deviation curve of the DL is almost 2 orders of magnitude higher than for the ICL, resembling the much lower NIR line strength (see Table 1). The minimum is already reached at 100 s, but a pronounced increase in the Allan deviation is seen around 500 s. After a second minimum at 1000 s the Allan deviation is increasingly similar to the QCL curve. The maximum at 500 s could be an indication of a temperature fluctuation in the setup, which was not present for the other two lasers. The data for the PAS measurements are collected in Table 5 and will be further discussed in the following section.

In this section, we first give a brief comparison between the DAS and PAS techniques with respect to linearity and dynamics. Then, based on the sensitivity and drift results from the Allan analysis, we consider the wavelength selection in more detail. Finally, a comment on the detection limit (LOD) is given.
5.1 Linearity and dynamics
The linearity and dynamics of the selected laser applied for a chosen detection scheme can be analysed under consideration of the concentration curves (Figs. 4 and 7). The well-established DAS technique runs in a calibration-free manner based on the Beer–Lambert law and the HITRAN database. The only experimental parameter is the current-tuning coefficient of the laser that needs to be known. Under these conditions, DAS is able to achieve high accuracy and a dynamic range up to 4 orders of magnitude. For low concentrations, fringes are the limiting factor in order to ensure accuracy. For high concentrations, complete absorption of the incoming laser light may occur, and consequently no light can be detected anymore. Different path lengths and additional line selections, respectively, may extend this scope.
Considering PAS, having a linear dependence between concentration and measured microphone signal according to Eq. (2), the calibration relation also covers 4 orders of magnitude (4 orders). The upper limit of this range can probably be extended by some more orders of magnitude, e.g. by increasing the laser power. In this case, signal acquisition electronics with very high dynamics is needed to digitalize microphone voltages ranging from microvolts to volts (6 orders of magnitude). Regarding linearity and dynamics, PAS outperforms DAS if the PAS calibration is stable, depending on the application.
5.2 Sensitivity and drift
For both techniques, the sensitivity and drift are discussed under consideration of the noise characteristics of the Allan–Werle plots in Figs. 5 and 8. For DAS, fringes (optical interferences) are a common key challenge. Their origin is the interaction of coherent laser light and optics. Most frequently, etalon effects, which are often referred to as “optical noise”, are the limiting factor of an optical detection system. This “noise” does not have the characteristics of white noise. Due to its periodic fringe structure (see Fig. 3) and the fact that generally the phase is not temporally stable, such etalon effects are often the reason for drift effects. Consequently, the term SNR (signal-to-noise ratio), which is commonly associated with white (Gaussian) noise, is not appropriate for “optical noise”. On the other hand, the term SBR is also not suitable, since the time-/frequency-dependent fringes cannot be described by a single value. In general, a superposition of several fringes is observed, and their amplitudes, periods and phase positions need to be taken into consideration. However, the fringe amplitude of a zero-gas spectrum can easily be estimated and may serve as a practical but limited indicator. Nevertheless, interaction between interferences and concentration analysis (signal processing) remains a challenge. Principally every detail matters in order to obtain fringe levels with a magnitude of 10−4 and below. The analysed signal should be well enough above the level where fringe effects dominate, otherwise the gas signal is poorly evaluated (if at all possible). Consequently, in this work a relatively high signal level was chosen by the selection of CH4 concentrations and/or path lengths in order to generate a meaningful Allan plot. In contrast to the fringes in the DAS scheme, the PAS background is a constant offset and can be reduced by a long lock-in integration time.
The above-mentioned effects can be seen in the Allan–Werle plots (Figs. 5 and 8), at least indirectly. The Allan standard deviation σA for PAS decreases by more than 1 order of magnitude with a nice Gaussian noise behaviour. The drift-based increase in the Allan standard deviation reaches the initial level of σA after an average time of around 10 000 s. This fact documents that the detection scheme in combination with the modulation concept of the lasers is remarkably stable for the three wavelength regimes. On the other hand, the DAS scheme shows a rather poor Gaussian noise characteristic, and drift behaviour quickly takes over. The DAS diode laser setup seems to be an exception. The drift behaviour is significantly better compared to the MIR setups, which is in line with the lower fringe level in the NIR.
In order to compare the sensitivity (in terms of precision not of absolute accuracy) of the systems, different measures (metrics) are documented in Table 6. The metrics basically involves the NEC of the Allan plot and the normalized and noise-equivalent absorption, respectively (NNEA and NEA). The NEC is given by σA for a specific averaging time (here 1 and 2 s), whereas the NEA is derived from the NEC with the help of HITRAN. Furthermore, the NEA can be normalized by the laser power and bandwidth (average time), which gives the NNEA. Regarding DAS, NNEA is not that meaningful since this detection scheme should be generally independent of the optical power. On the other hand, the NNEA can also be interpreted as a normalized NEA with respect to the square root of the bandwidth (i.e. the inverse average time).
Table 6Sensitivity comparison of DAS and PAS based on the data of the Allan–Werle plots. Characteristic metrics are given by the noise (NEC, NEA, NNEA), and the lowest sensitivities of each method are highlighted (bold values).
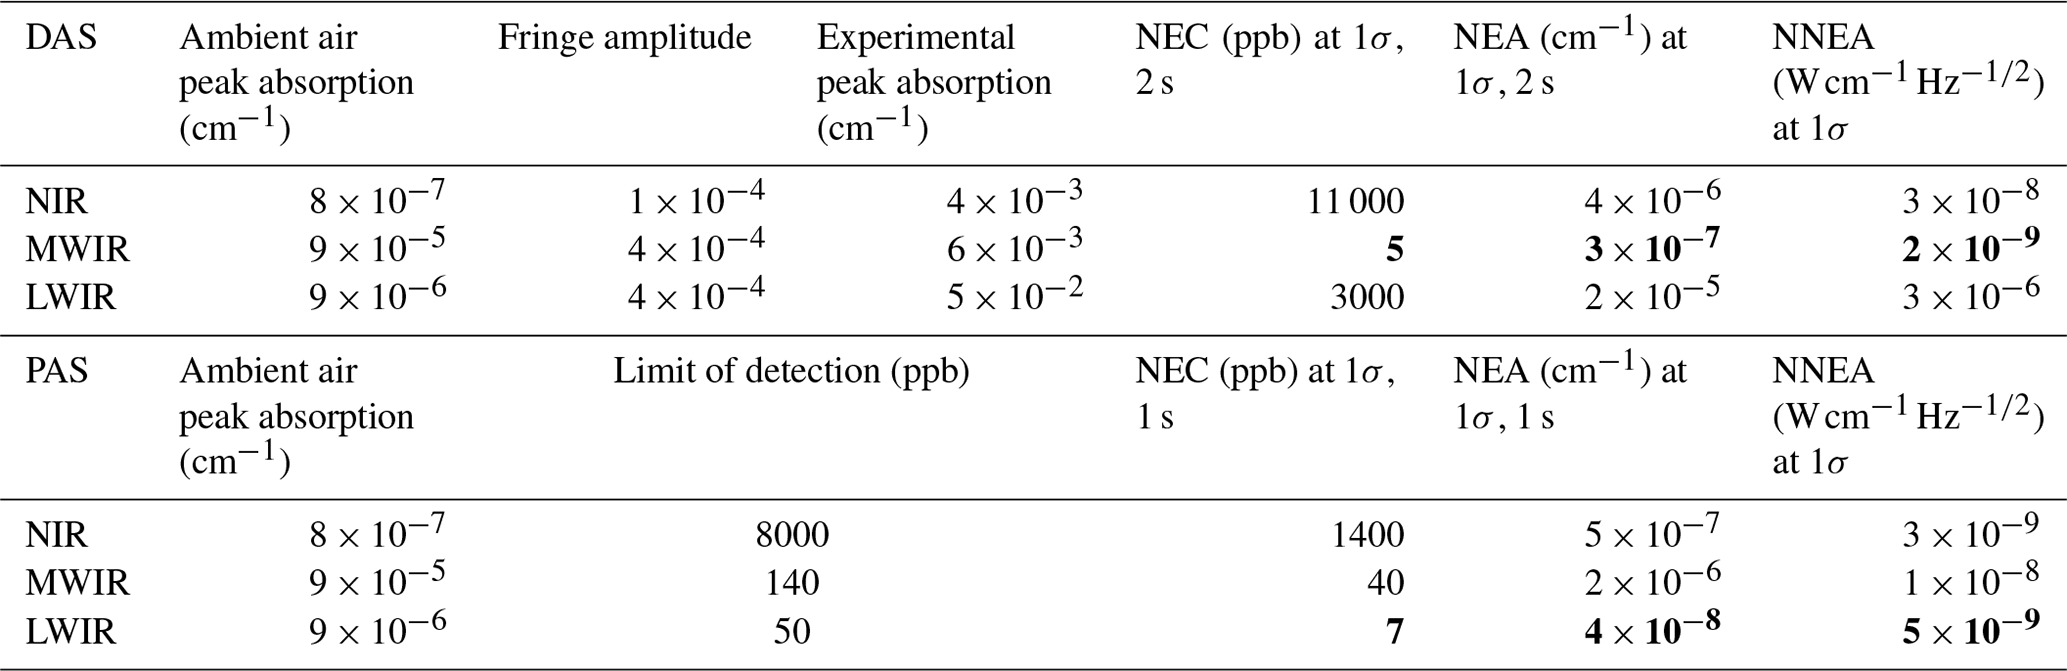
Regarding Table 6 in more detail, the most obvious result is that the PAS configuration of the QCL operating in the LWIR is absolutely superior to all the other DAS or PAS configurations in terms of the sensitivity (i.e. NEC).
The other metrics (NEA and NNEA) indicate that the line strength and optical power of the QCL can be well transferred into sensitivity in this PAS configuration. The other way around, the DAS configuration of the QCL in the LWIR indicates that the combination of fringe level and relative high noise of the (uncooled) optical detector eliminates the advantage of the higher absorption line strength (LWIR) compared to the NIR. The optical detection setup in the NIR shows a good performance. For instance, the NEA value in this case can be associated with a resolution of 18-bit digitalization. Nevertheless, the absorption line strength is too weak in order to resolve methane in ambient air with a short optical path length. The ICL performance in the DAS configuration shows an even better NEA and the corresponding absorption of methane in ambient air is significantly stronger, such that methane in ambient air can be resolved in a short optical path length. This is possible even with a higher fringe level compared to the NIR. The PAS setups of the NIR and MWIR show basically results which are approximately in line with the absorption line strength since the optical power is nearly identical.
A main result of the DAS measurements is the observation that despite the much higher line strengths in the LWIR compared to the NIR, the sensitivity is almost the same. At longer integration times the NIR behaves even better than the LWIR setup. The reason is the high NEP of the LWIR detector. The best sensitivity is obtained using an ICL and the photovoltaic detector in the MWIR. The NEP of the this detector is at least of the same order of magnitude as the NEP of the NIR photodiode (see Table 2). According to the Allan plots the best system stability seems to be possible in the NIR.
The main result of PAS measurements is that the highest sensitivity is obtained in the LWIR range due to the high power of the QC laser. Using high-power QCL NECs below 10 ppb is feasible. The NECs approximately inversely scale with the product of the relative absorption line strengths and laser powers (see Table 1).
Comparing DAS and PAS, the most remarkable fact is that with PAS lower NECs can be achieved than with DAS (in all spectral ranges) if similar short optical path lengths are used.
5.3 Limit of detection
The limit of detection (LOD) will be estimated based on the measurement results and previous analysis. This estimation is considerably more simple for the PAS setups, since the background and noise levels are of the same order of magnitude, in contrast to the DAS concept. Regarding the PAS setups, a LOD by means of the SBR can be estimated in the following way:
where the zero-gas (background) level and the calibration slope are considered. The LOD that corresponds to a SBR of 1 is given by the ratio of zero gas and slope. An alternative way is to consider the signal-to-noise ratio that can be associated with the NEC. A conservative estimation of the LOD would be given by a multiple of these SBR or NEC values. However, the values in Table 6 and the shown concentration measurements indicate that concentration identifications of around 10 ppm in the NIR, less than 500 ppb in the MWIR and less than 100 ppb in the LWIR, are definitely possible within an average time (integration) significantly below 1 s. A significant reduction of the LOD can be achieved by increasing the integration time of the lock-in amplifier as indicated in the Allan plot at the expense of response time.
Regarding the DAS configurations, the estimation of the LOD is not straightforward. This is due to the fact that the NEC or rather the NEA is approximately 2 orders of magnitude below the fringe level (“background”). In other words, the DAS configuration shows a relatively good precision (i.e. NEA) but a rather bad accuracy (e.g. due to systematic errors and the fringe level). In particular, for a calibration-free DAS setup the fringe level strongly limits the LOD.
Of course, concentration changes significantly below the fringe level can be determined with an area-under-the-curve analysis. A more sophisticated mathematical method might improve this issue a lot. However, in the calibration-free context for gas cells around 10 cm a LOD around the ambient air concentration of 1.8 ppm can be estimated in the case of the MIR. Here the MWIR (1 ppm) will perform better than the LWIR (10 ppm) configuration. The NIR will typically show a LOD below 100 ppm under the mentioned conditions. Nevertheless, concentration changes can be detected at a much lower level, and if the LOD is defined in this context, the LOD could be estimated by 3 to 5σ. Consequently, the performance for the MWIR will potentially identify concentration below 1 ppm and concentration changes of around 100 ppb.
DAS and PAS detection schemes were investigated with three different laser types (DL, ICL and QCL) in the NIR, MWIR and LWIR spectral regions. With PAS and a powerful QCL the ambient air concentration of methane of 1.8 ppm can be resolved with a sensitivity of less than 10 ppb (1σ, 1 s). Using DAS with an ICL and a 65 cm gas cell, an even lower sensitivity was obtained due to the stronger MWIR absorption of CH4. In the NIR, PAS is more sensitive than DAS for short cells. The sensitivity was below 2 ppm (1σ, 1 s). In this experimentation PAS showed a lower LOD compared to DAS for all three wavelength regimes.
Leak detection is the most important application of methane laser spectroscopy. The main issue is detection of CH4 concentrations in air above 4.4 %, which is the lower explosion limit (LEL) (International Electrotechnical Commission, 2017). For a safety device, detection has to be highly reliable and fast – with negligible false alarms. Concentrations above 1000 ppm can be rapidly detected using a compact NIR DAS setup. With the capability of calibration-free measurements, absolute gas concentrations can be determined.
For the quantitative detection of smaller leaks MWIR DAS seems to be the most favourable technique. It offers a calibration-free sub-ppm LOD for 1 m absorption length. Reduction of the LOD by increasing the optical absorption length is a key advantage of DAS (and WMS) systems. A multitude of multireflection cell designs (Herriott and Schulte, 1965; Tuzson et al., 2013; White, 1942) are established.
If just small changes in the methane concentration have to be measured, then PAS is probably the better choice. PAS offers the lowest LOD values at an attractive system cost level. This is important in the MWIR and LWIR, where for DAS and WMS detector costs remarkably increase the component cost of a system.
Ultimate sensitivity in the single-digit ppb range can be achieved with LWIR-PAS. Such systems may be applied to investigate key scientific issues, e.g. to study anthropogenic CH4 emissions from landfills or breath analysis for medical diagnostics and/or metabolism studies (Jahjah et al., 2014; Szabó et al., 2015; Jungkunst et al., 2006).
If calibration stability is more important, one interesting solution is to combine DAS and PAS in one instrument using the same laser for both techniques. A similar idea, i.e. the combination of calibration-free WMS-DAS with highly sensitive cavity ring-down spectroscopy, was recently reported (Wang et al., 2020). In our case, at higher CH4 concentrations absolute values can be obtained from the calibration-free DAS to calibrate the PAS microphone response. This concept is most attractive in the NIR, where photodetectors are inexpensive. Due to the excellent linearity of PAS, this calibration could be extended down to the trace gas level, which is only achievable by PAS.
The underlying measurement data may be requested from the authors if required.
JW, JH, AL, and TS planned the investigation. HFP and CW designed the resonant PAS cell. SR and CW developed the electronic hardware. SR and EM developed software. JH, EM, and TS performed experiments. JH, EM, AL, and TS analysed the data. JW, JH, AL, and TS discussed the results. AL and TS wrote the paper. All the authors approved the final paper.
The authors declare that they have no conflict of interest.
The photoacoustic cell was developed in a research project which was funded by the European Commission/German Federal Ministry of Education and Research under grant number E! 9727-MASUM.
This work has received funding from the European Union's Horizon 2020 research and innovation programme under grant agreement no. 780240.
This paper was edited by Nobutito Imanaka and reviewed by two anonymous referees.
Bozoki, Z., Pogany, A., and Szabo, G.: Photoacoustic Instruments for Practical Applications: Present, Potentials, and Future Challenges, Appl. Spectrosc. Rev., 46, 1–37, https://doi.org/10.1080/05704928.2010.520178, 2011.
EPA, US and OA: Understanding Global Warming Potentials – USEPA, available at: https://www.epa.gov/ghgemissions/understanding-global-warming-potentials, last access: 10 October 2018.
Frost and Sullivan: Analysis of the Global Gas Sensors, Detectors, and Analyzers Market, NF 77-32, available at: https://store.frost.com/analysis-of-the-global-gas-sensors-detectors-and-analyzers-market.html (last access: 18 February 2021), 2015.
Hanson, R. K., Spearrin, R. M., and Goldenstein, C. S.: Spectroscopy and Optical Diagnostics for Gases, Softcover reprint of the original 1st edition 2016, Springer International Publishing, Springer, Cham, XXV, 279 pp. in 1 part, 2016.
Herriott, D. R. and Schulte, H. J.: Folded Optical Delay Lines, Appl. Optics, 4, 883–889, https://doi.org/10.1364/ao.4.000883, 1965.
International Electrotechnical Commission: ISO/IEC 80079-20-1:2017: Explosive atmospheres – Part 20-1: Material characteristics for gas and vapour classification – Test methods and data, available at: https://webstore.iec.ch/publication/26577#additionalinfo (last access: 18 March 2020), 2017.
Jahjah, M., Jiang, W. Z., Sanchez, N. P., Ren, W., Patimisco, P., Spagnolo, V., Herndon, S. C., Griffin, R. J., and Tittel, F. K.: Atmospheric CH4 and N2O measurements near Greater Houston area landfills using a QCL-based QEPAS sensor system during DISCOVER-AQ 2013, Opt. Lett., 39, 957–960, https://doi.org/10.1364/ol.39.000957, 2014.
Jungkunst, H. F., Sauter, R., Link, A., Fiedler, S., Stahr, K., and Haas, U.: Verifying three types of methane fluxes from soils by testing the performance of a novel mobile photoacoustic method versus a well-established gas chromatographic one, Environ. Sci. Technol., 40, 6425–6431, https://doi.org/10.1021/es060843b, 2006.
Kreuzer, L. B.: The Physics of Signal Generation and Detection, in: Optoacoustic spectroscopy and detection, edited by: Pao, Y.-H., Academic Press, New York, 1977.
Lins, B., Zinn, P., Engelbrecht, R., and Schmauss, B.: Simulation-based comparison of noise effects in wavelength modulation spectroscopy and direct absorption TDLAS, Appl. Phys. B, 100, 367–376, https://doi.org/10.1007/s00340-009-3881-5, 2010.
Miklós, A., Hess, P., and Bozóki, Z.: Application of acoustic resonators in photoacoustic trace gas analysis and metrology, Atmos. Environ., 72, 1937–1955, https://doi.org/10.1063/1.1353198, 2001.
Reid, J. and Labrie, D.: 2nd-harmonic detection with tubable diode-lasers – comparison of experiment and theory, Appl. Phys. B, 26, 203–210, https://doi.org/10.1007/bf00692448, 1981.
Rothman, L. S. and Gordon, I. E.: The HITRAN Molecular Database, AIP Conf. Proc., 1545, 223–231, https://doi.org/10.1063/1.4815858, 2013.
Schaefer, S., Mashni, M., Sneider, J., Miklos, A., Hess, P., Pitz, H., Pleban, K. U., and Ebert, V.: Sensitive detection of methane with a 1.65 µm diode laser by photoacoustic and absorption spectroscopy, Appl. Phys. B, 66, 511–516, https://doi.org/10.1007/s003400050426, 1998.
Szabó, A., Ruzsanyi, V., Unterkofler, K., Mohácsi, Á., Tuboly, E., Boros, M., Szabó, G., Hinterhuber, H., and Amann, A.: Exhaled methane concentration profiles during exercise on an ergometer, J. Breath Res., 9, 16009, https://doi.org/10.1088/1752-7155/9/1/016009, 2015.
Tuzson, B., Mangold, M., Looser, H., Manninen, A., and Emmenegger, L.: Compact multipass optical cell for laser spectroscopy, Opt. Lett., 38, 257–259, 2013.
Wang, Z., Du, Y., Ding, Y., and Peng, Z.: A Wide-Range and Calibration-Free Spectrometer Which Combines Wavelength Modulation and Direct Absorption Spectroscopy with Cavity Ringdown Spectroscopy, Sensors, 20, 585, https://doi.org/10.3390/s20030585, 2020.
Werle, P.: Accuracy and precision of laser spectrometers for trace gas sensing in the presence of optical fringes and atmospheric turbulence, Appl. Phys. B, 102, 313–329, https://doi.org/10.1007/s00340-010-4165-9, 2011.
White, J. U.: Long Optical Paths of Large Aperture, J. Opt. Soc. Am., 32, 285–288, https://doi.org/10.1364/josa.32.000285, 1942.
The Allan–Werle plot illustrates how long sensor signals can be averaged in order to increase the detection sensitivity before noise sources such as temperature, mechanical or optical (fringes) drifts begin to dominate.