the Creative Commons Attribution 4.0 License.
the Creative Commons Attribution 4.0 License.
 | 27 Jan 2021
Inline quality monitoring of diesel exhaust fluid (AdBlue) by using the 3ω method
Ralf E. Bernhardsgrütter
Christoph J. Hepp
Martin Jägle
Hans-Fridtjof Pernau
Katrin Schmitt
Jürgen Wöllenstein
Because diesel combustion processes produce harmful detrimental nitrous oxides, the selective catalytic reduction, an after-treatment method using diesel exhaust fluid (AdBlue) to reduce these emissions, is an important part in the cycle of the combustion process. Therefore, it is crucial to continuously monitor the quality of the diesel exhaust fluid to secure the ideal selective catalytic reduction. This article presents a platinum thin-film sensor using the 3ω method which is able to characterize the diesel exhaust fluid. By means of the 3ω method, information about the concentration of urea in water can be extracted. In this investigation, a digital lock-in amplification technique is used to execute the measurements. The results show that this sensor can determine the urea content within 1 % by weight. Moreover, besides the analysis of the 3ω signal, the 1ω signal is analyzed in depth to receive additional information about the temperature. Because the same structure can measure multiple parameters, such as concentration, temperature, and flow, the sensor might be a good alternative to the state-of-the-art diesel exhaust fluid sensor.
- Article
(5965 KB) - Full-text XML
- BibTeX
- EndNote


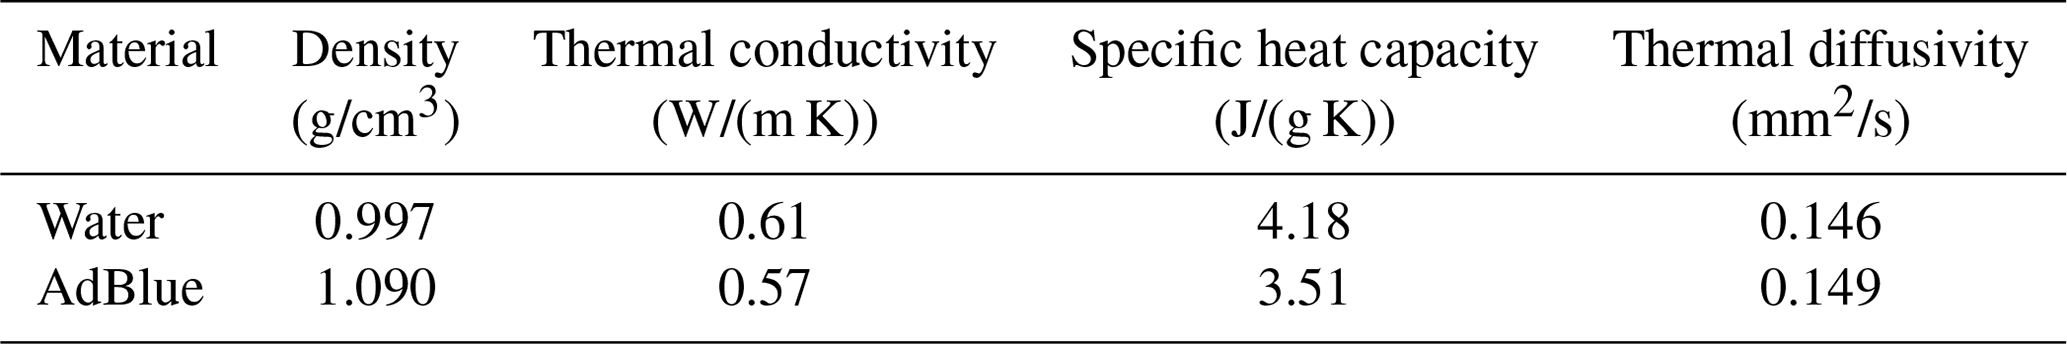
The reduction and the control of pollutants produced by burning fossil fuels are a focus of governments and health organizations (de Beeck et al., 2013; Weingarten et al., 2019; Olabi et al., 2020). The selective catalytic reduction (SCR) is an after-treatment method in diesel combustion processes to convert harmful detrimental nitrous oxides (NOX) into nitrogen and water. Diesel exhaust fluid (DEF), also known by the registered trademark “AdBlue”, is needed for the SCR process and consists ideally of 32.5 % by weight of urea and 67.5 % by weight of deionized water (BASF – The Chemical Company, 2006). The correct concentration of the urea is crucial for an optimal SCR. Inappropriate DEF brakes the SCR or breaks it down and the emission reduction fails. Reported DEF quality sensors are based on optical principles (Kumawat et al., 2014) and electrical (Fendri et al., 2015), ultrasonic (Gurusamy et al., 2017), and pulsed heating measurements (Schmitt et al., 2014). These sensors can often solely measure the concentration and sometimes the filling level in the tank. In this article, a platinum thin-film sensor in combination with the 3ω method is used for the first time to determine the concentration of urea in DEF. The 3ω method is a well-known thermal method to measure thermal conductivity and heat capacity (Cahill, 1990; Lu et al., 2001). Some basic physical parameters of water and AdBlue are shown in Table 1. The thermal parameters differ and a possibility exists to distinguish between water and AdBlue using the 3ω method. The advantages and the benefits of this sensing concept are the simple and cost-efficient sensor structure, no moving parts, and the possibility of combining concentration, temperature, and flow measurement.
This article starts with a short introduction to the basic principle of the 3ω method. Then, the used sensor, the setup, and the measurement protocol are discussed. The final part shows and discusses the results regarding the sensitivity of the urea concentration in water, but also general deeper investigations related to the 3ω method.
Table 1Thermal characteristics of water and AdBlue at 25 ∘C (Care, 2009; BASF – The Chemical Company, 2006).
The principle of the 3ω method is based on a metallic resistor, which is driven by an AC current I(t) with angular frequency ω, I(t)=I0cos (ωt), where I0 is the current amplitude and t is the time. The resistor heats up due to Joule heating and the temperature increases in response to this excitation. The temperature rise ΔT can be expressed by
ΔTDC is the steady-state temperature increase at the resistor's location with respect to ambient temperature Tamb. ΔTAC is the temperature oscillation, and the quantity ϕ indicates the phase shift between the excitation signal and the temperature oscillation. The phase shift occurs because of a possible lag between heat flux and temperature, and it is normally non-zero with respect to the input signal (Moon et al., 1996). The temperature oscillation with amplitude ΔTAC is described by the heat diffusion equation and can be seen as a thermal wave (Cahill, 1990). Thermal properties such as thermal conductivity and heat capacity of the resistor's surroundings influence the propagation of this thermal wave. A crucial concept is the concept of the penetration depth δ to understand the propagation of the thermal wave,
where k is the thermal conductivity, ρ is the density, cp is the specific heat capacity, and α is the diffusivity. The penetration depth indicates the ability of the thermal wave to penetrate the surroundings. Equation (2) points out that the penetration depth is inversely proportional to the drive frequency. The smaller the drive frequency, the larger the penetration depth.
The connection between thermal and electrical information is in this case given by the temperature-to-resistance coefficient of the resistor's material, β, and the following relation between resistance R and temperature T holds:
where the subscript defines the point of reference; this point of reference is often taken at 0 ∘C.
The relation between resistance R(t) and temperature at steady state can be expressed by
where R0 is the resistance at 0 ∘C. The term ) describes the relation between resistance and the constant term of the temperature. The voltage drop across the resistor can then be expressed by Ohm's law:
The quantities V1ω, ϕ1ω, V3ω, and ϕ are the direct measurement quantities. At the second last equality in Eq. (5), the approximation βΔTAC≪1 is used, which is normally the case because K−1 (Giancoli, 1995). This approximation allows a direct decoupling of the temperature ΔTDC and ΔTAC. The aim of the 3ω method is to measure the voltage signal at the frequency 3ω because it is directly proportional to the temperature oscillation ΔTAC, which gives information about the thermal characteristics of the surroundings, being urea–water mixtures in this investigation.
The sensor used in our study is shown in Fig. 1. The sensitive element contains two resistive structures, namely a low-resistance structure and a high-resistance structure. For the measurements presented here, only the low-resistance structure is used in combination with the 3ω method, which is called the 3ω resistor in Fig. 1a. However, the entire design is similar to an anemometric flow sensor where the low-resistance structure also acts as a heater and the high-resistance structure acts as a temperature sensor. Ideas for further investigations with diesel exhaust fluid in combination with its flow are the reason for choosing this design.
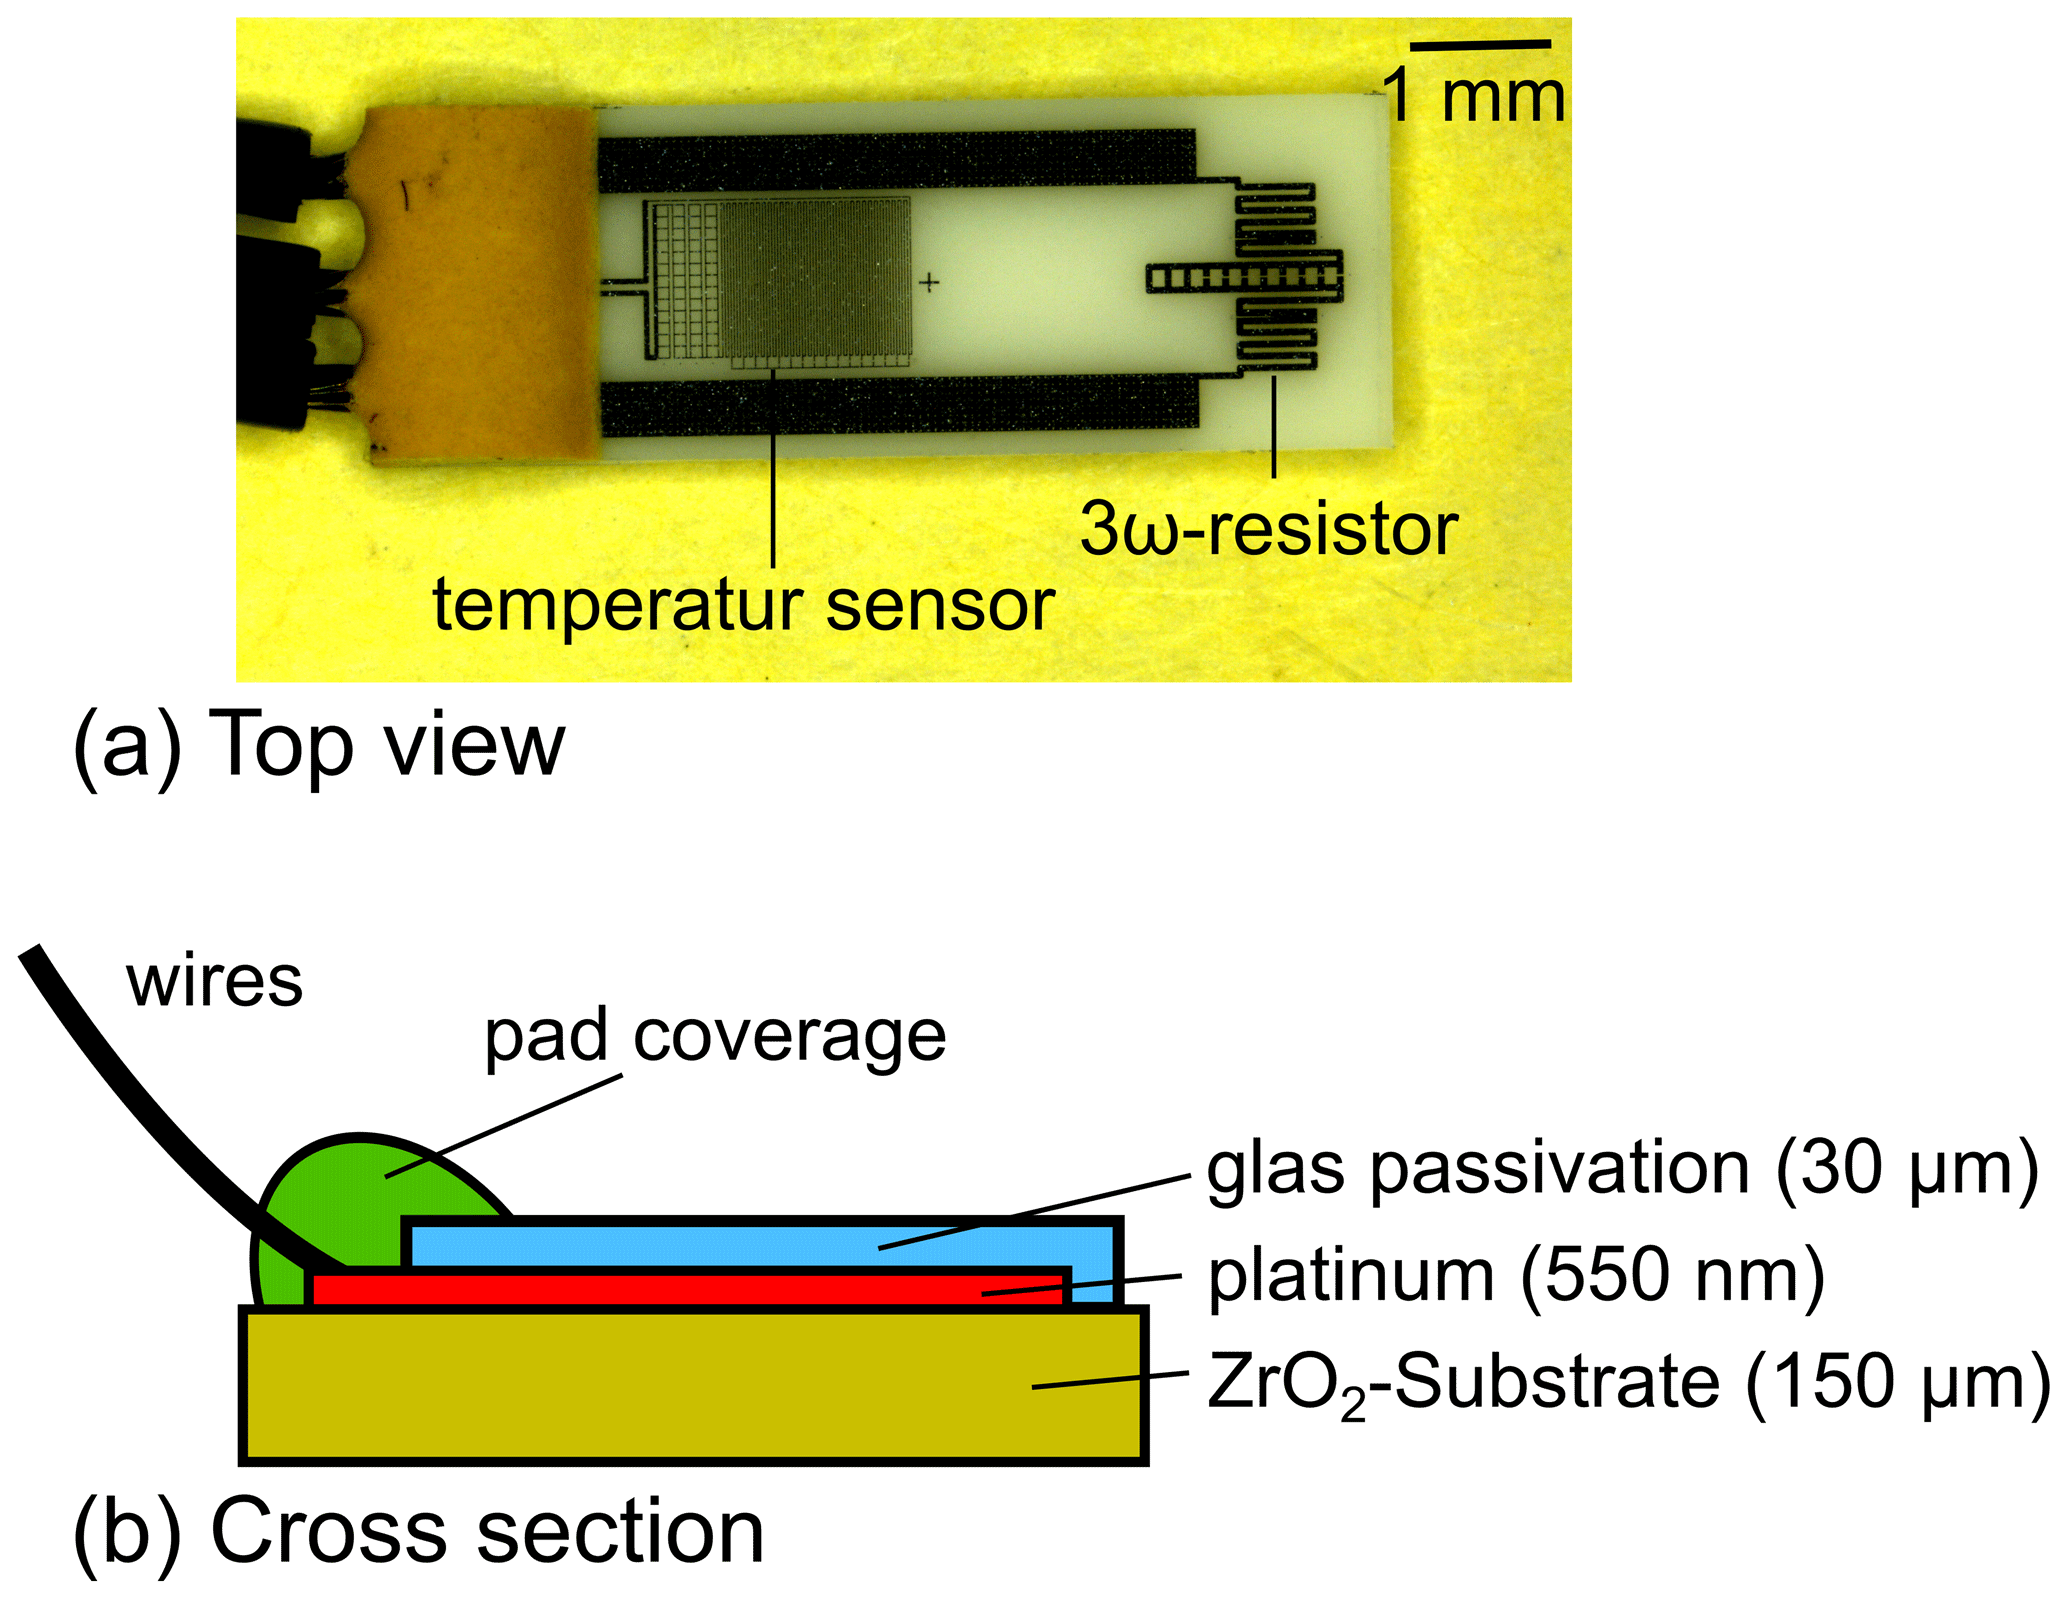
Figure 1(a) Top view of the sensor; two platinum thin-film structures are on the investigated chip. First, a low-resistance structure which is called a 3ω resistor in this investigation acting as the heater and as the sensor if the 3ω method is applied. Second, a high-resistance structure is on the chip which can be used as an additional temperature sensor. (b) Cross section of the sensor consists of a platinum thin-film layer with a thickness of 550 nm which is applied on a 150 µm zirconium oxide substrate. A 30 µm thick glass passivation is on top of the platinum layer to protect the platinum structure.
The cross section of the sensor element is shown in Fig. 1b. The sensor is based on platinum thin-film technology and is manufactured by standard thin-film processes. Platinum is chosen because of its reproducible temperature-to-resistance coefficient. The platinum thin film is located on top of a 150 µm thick zirconium oxide substrate. Zirconium oxide is chosen because of its favorable mechanical properties, which allows straightforward processing even for a 150 µm thick substrate. The platinum thin film is covered by a 30 µm thick-film glass passivation layer to protect the platinum structures.
The element is characterized between 0 and 100 ∘C as visible in Fig. 2. The low-resistance structure has a resistance of at 0 ∘C with a temperature-to-resistance coefficient of β45=3893(6) ppm/K. The high-resistance structure has a resistance of at 0 ∘C with a temperature-to-resistance coefficient of β1200=3896(6) ppm/K. Therefore, both platinum structures have a similar temperature-to-resistance coefficient, as expected because the two structures are on the same chip.
Table 2Material characteristics at 25 ∘C: thermal diffusivity (Care, 2009), layer thickness, and penetration depth for frequencies 0.1, 1, 10, 100, and 1000 Hz.
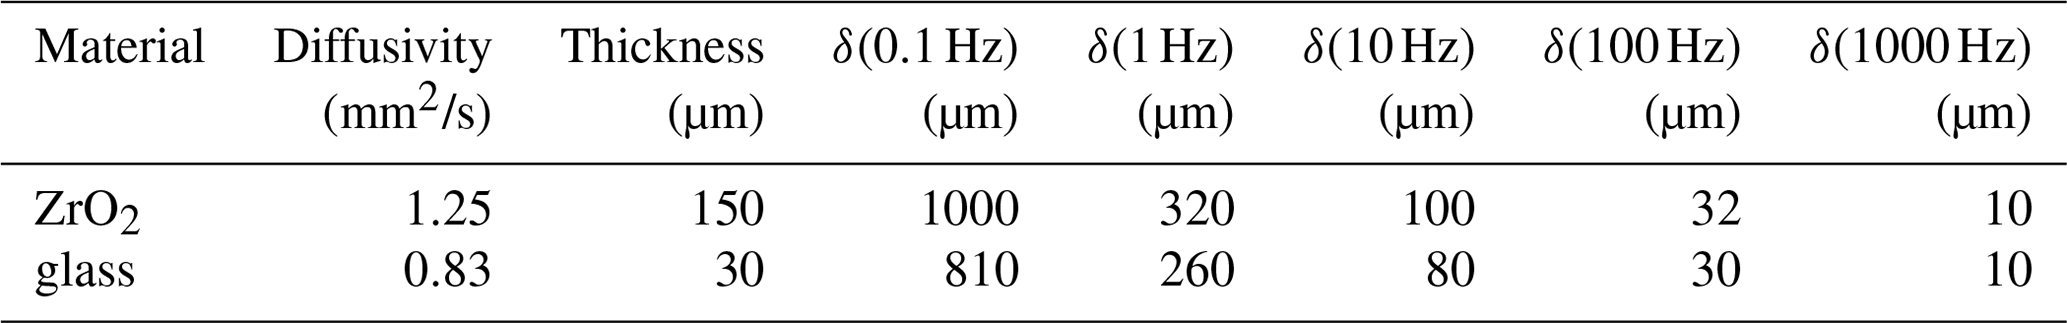
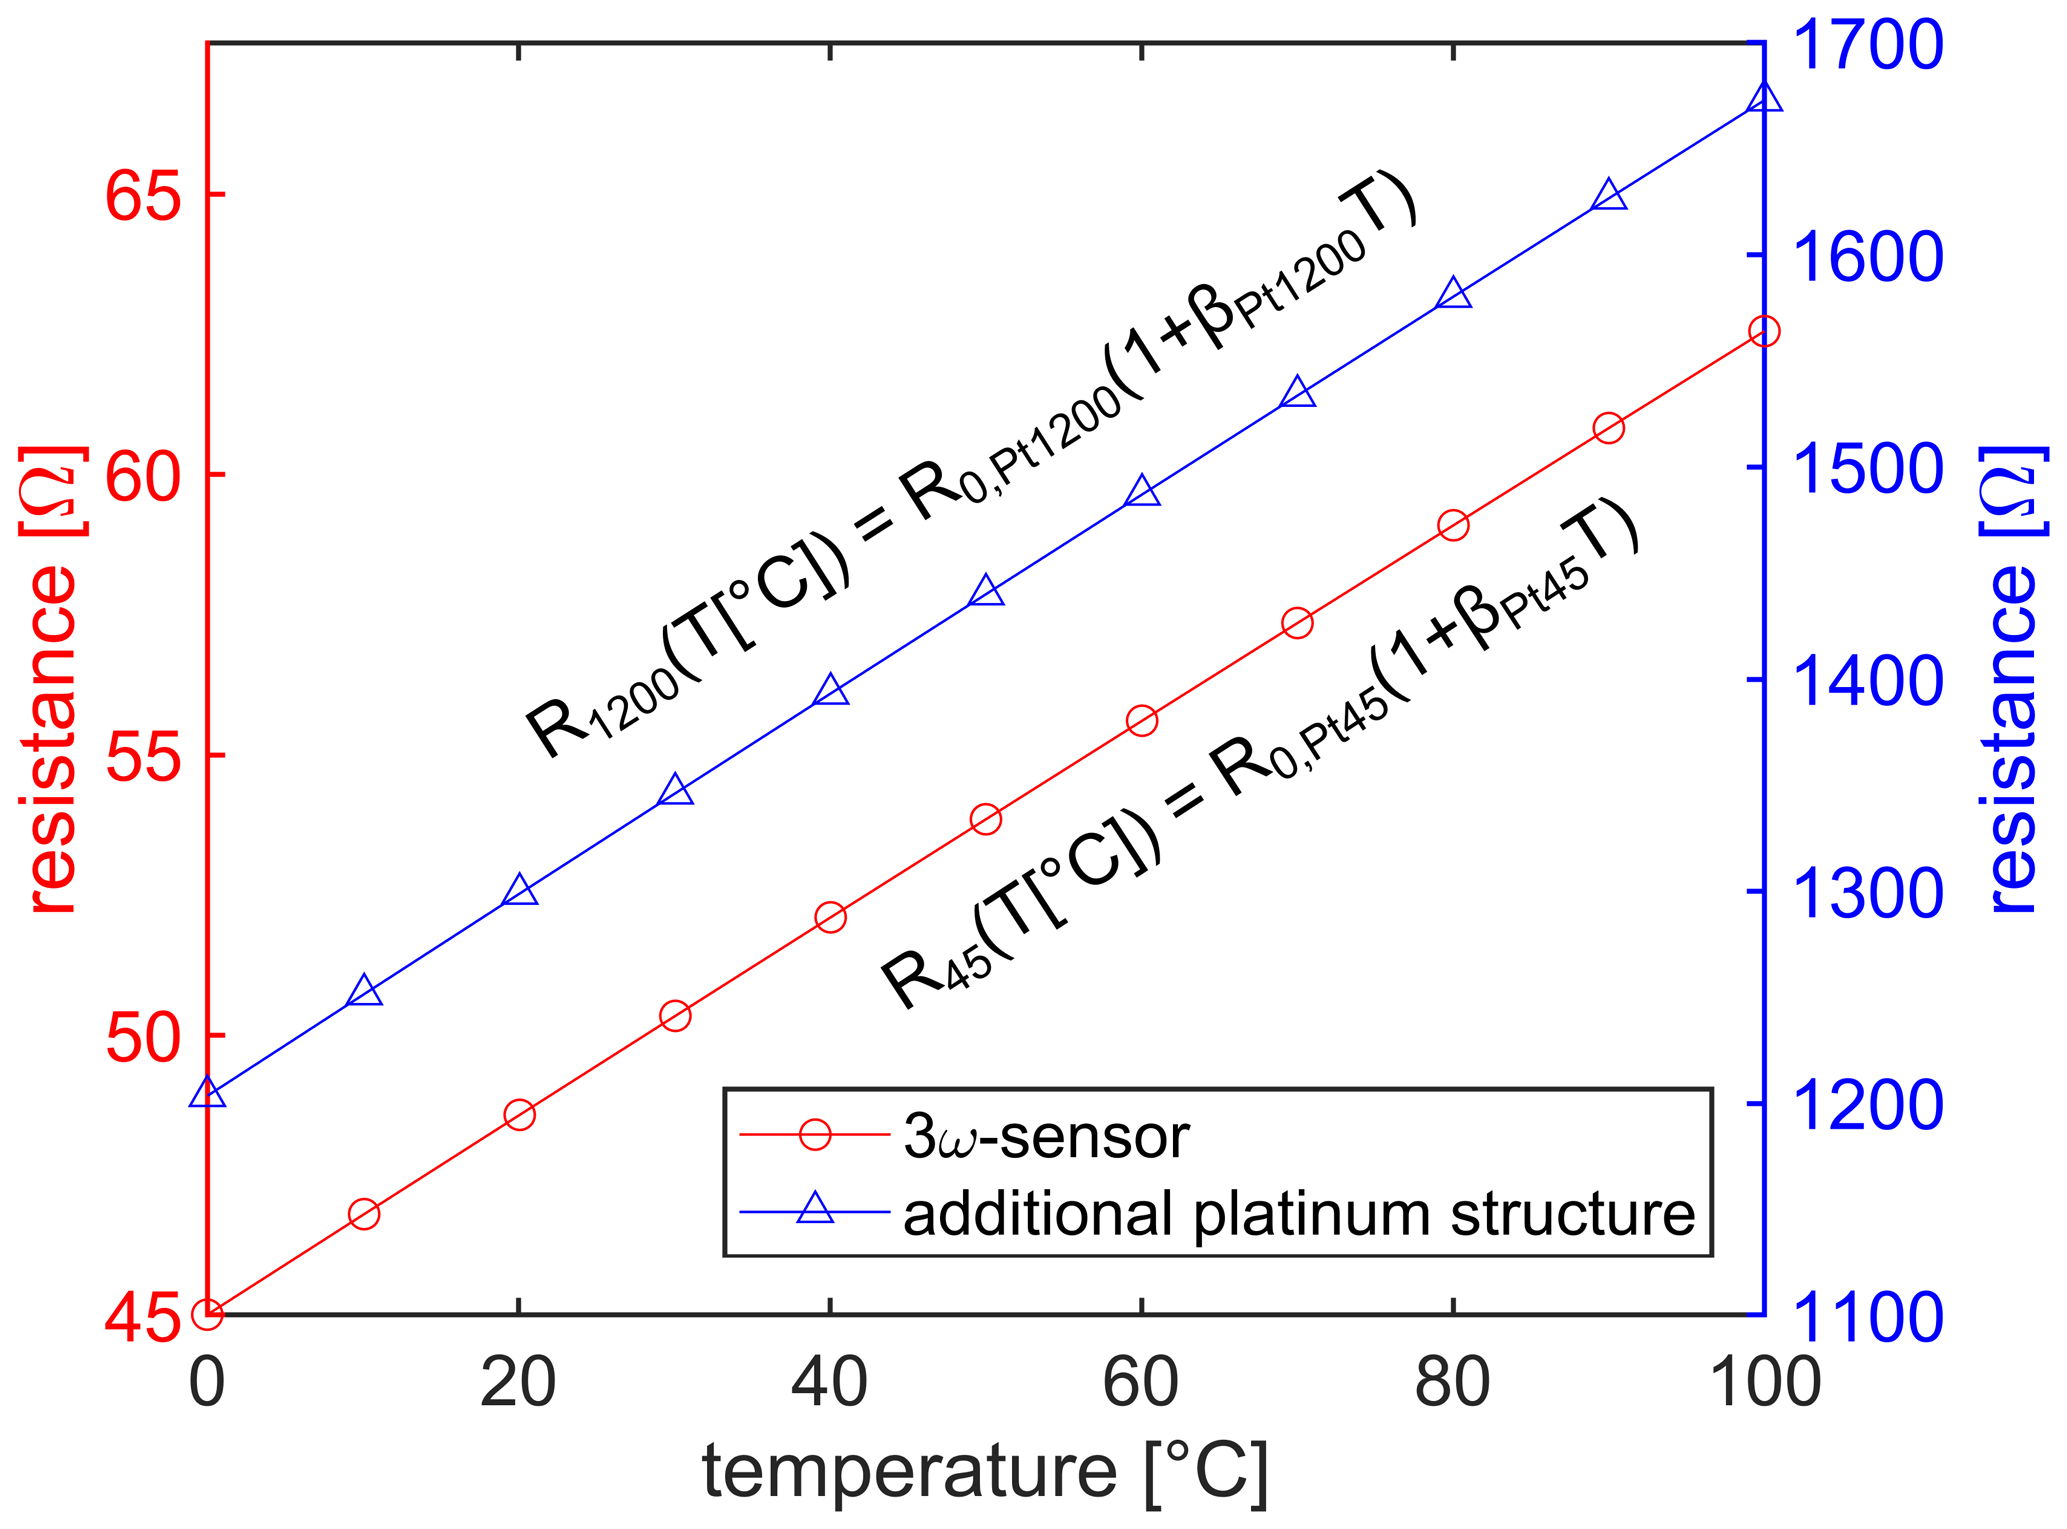
Figure 2Resistance-to-temperature characteristics for the platinum structures. The low-resistance structure has a resistance with a temperature-to-resistance coefficient of . The high-resistance structure has a resistance with a temperature-to-resistance coefficient of .
Measuring the voltage V3ω and the ΔTAC can be a challenge because this is usually 3 orders of magnitude smaller than the 1ω signal. The reason is the resistance-to-temperature coefficient being in the range of 10−3 K−1. However, the lock-in amplification technique is well suited for measuring this small signal. Moreover, the lock-in amplification technique also allows phase-sensitive measurements which are required to resolve the phases ϕ. The setup in this investigation is designed as a digital lock-in amplifier. The advantage of a digital lock-in amplifier is that no physical reference signal is needed. The hardware (see Fig. 3a) consists of a data acquisition card (DAQ) from National Instruments (NI USB 6225) and a voltage-to-current converter based on two operational amplifiers. The DAQ is the core part of this digital lock-in amplifier because it generates the driving signal and measures synchronously the voltage across the resistor. The DAQ is controlled by a computer via a LabView program.
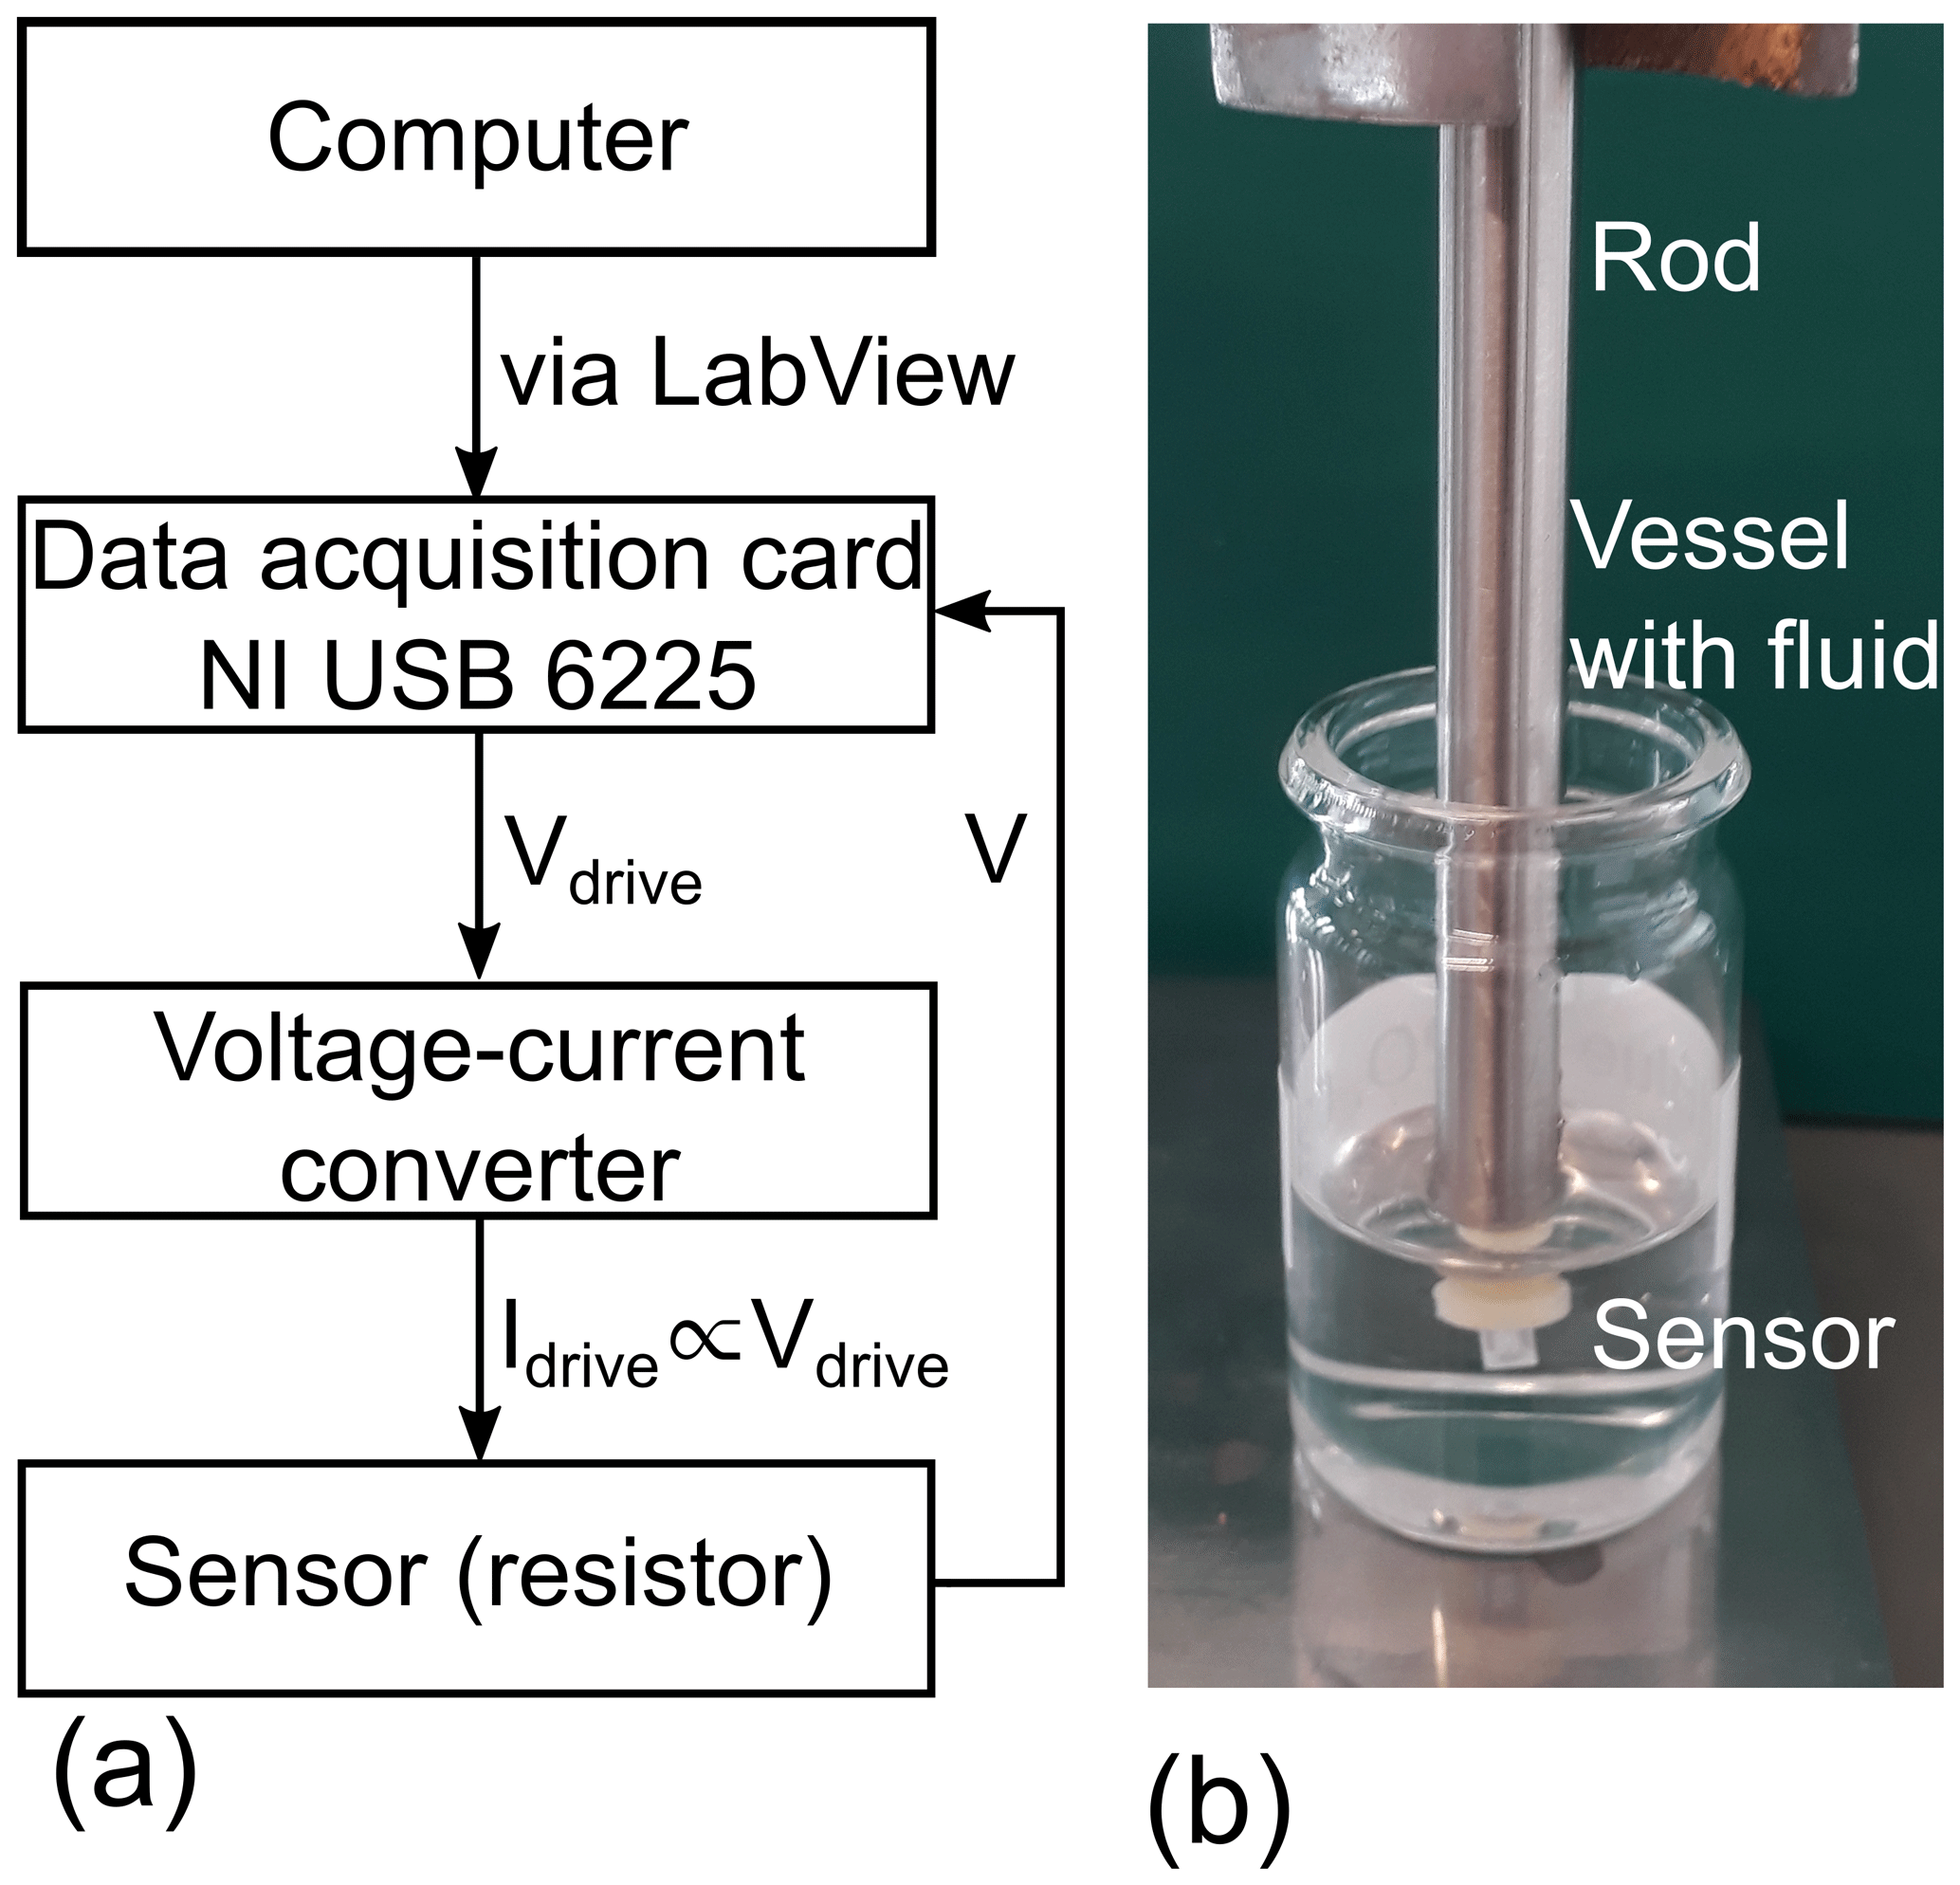
Figure 3(a) Electrical diagram of the measurement hardware. The core part is a data acquisition card from National Instruments (NI USB 6225) which generates the drive signal and measures the voltage across the resistor. The entire setup is controlled by a computer via LabView. (b) The platinum thin-film sensor is mounted on a stainless steel rod to form a suitable probe.
To have a handy probe, the sensor element was installed on a stainless steel rod (see Fig. 3b). This probe was used to investigate the fluids of interest, which were mixtures of different urea–water solutions in combination with the 3ω method. Because the solvability of urea in water is 1000 g/L at 20 ∘C (Sigma-Aldrich, 2019), the urea concentration was varied between 0 % and 50 % by weight to cover most of the possible range. The measurements were done at room temperature (25.0(3) ∘C) and at no-flow conditions. The measurement sequence with respect to the urea concentration was randomly taken such that external variables, e.g., the ambient temperature, do not distort the measurement result in a systematic way.
When choosing the frequency range, the penetration depth (; see Eq. 2) must be larger than the distance between platinum thin film and fluid of interest, otherwise the sensor does not sense the fluid and no fluid dependence occurs. The penetration depths for glass and zirconium oxide are given in Table 2 for different frequencies. For this reason, the drive frequency was then varied between 0.1 and 1000 Hz for the measurement.
To set the current amplitude, a trade-off between height of the signal and self-heating has to be managed. In previous investigations using a similar structure (Clausen et al., 2017; Innovative Sensor Technology IST AG, 2014), the self-heating of 30 mA was smaller than 1 % of the absolute temperature at a frequency of 1 Hz. Based on these findings, the current amplitude of 30 mA was also chosen for this investigation.
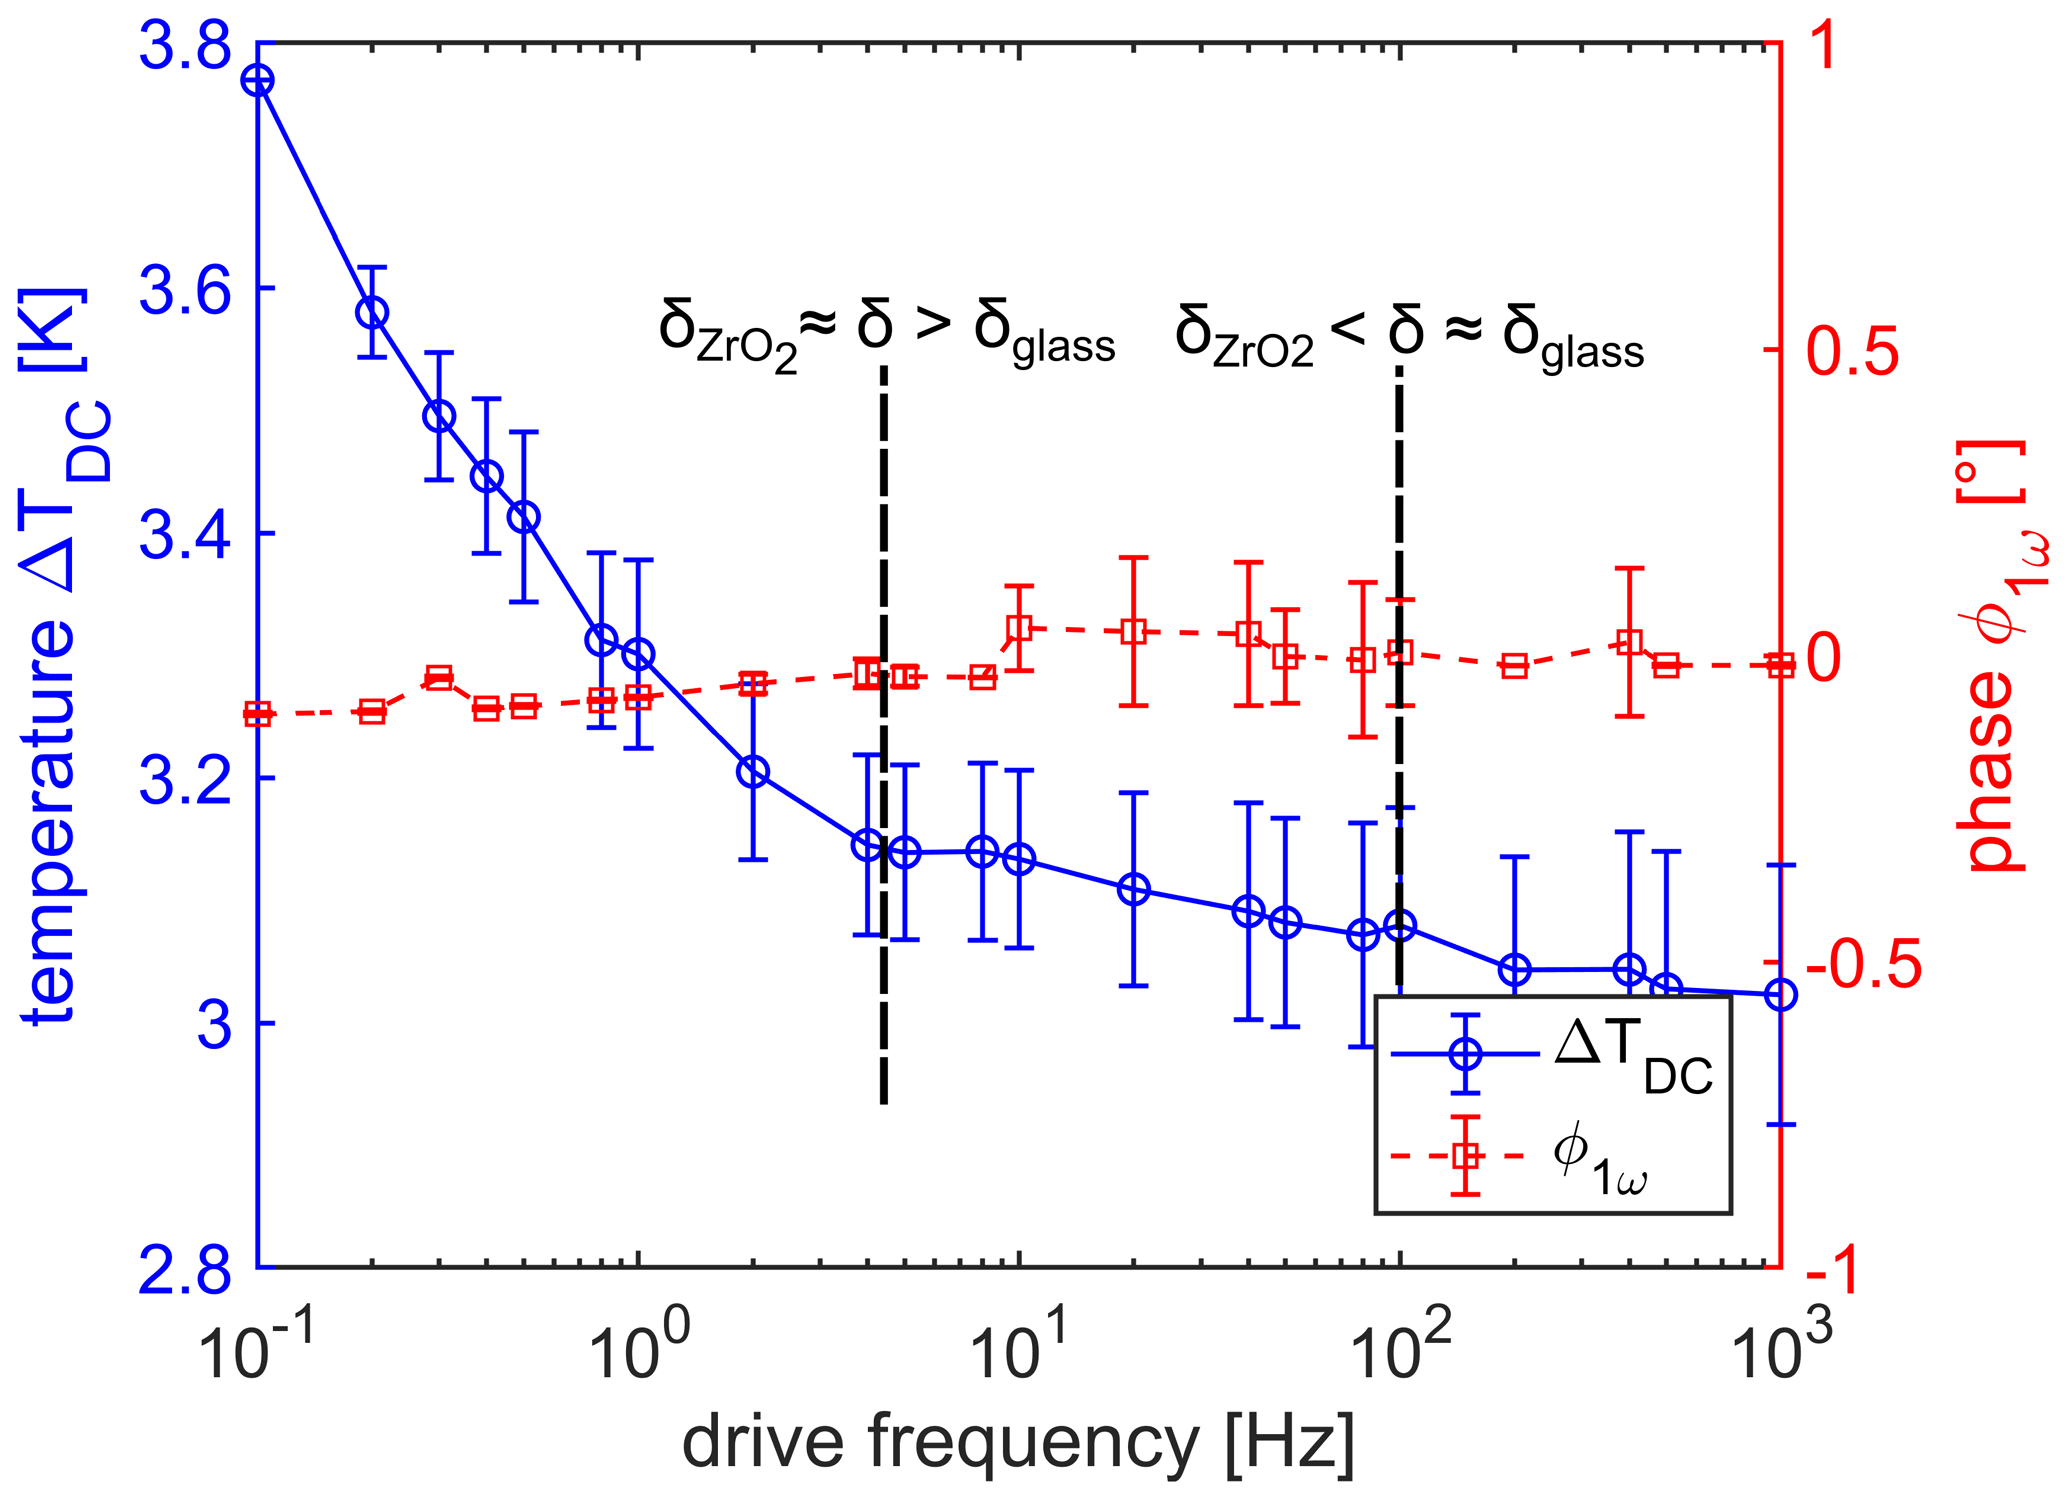
Figure 4Temperature ΔTDC as a function of drive frequency (blue dots). A decrease of 0.8 ∘C is visible which is most pronounced if the drive frequency is smaller than 5 Hz and the thermal wave can penetrate the zirconium oxide substrate, indicated by . If the drive frequency is bigger than 100 Hz, the penetration depth is smaller than the thickness of glass passivation δglass and the increase in temperature is saturated. The phase ϕ1ω of the 1ω signal as a function of drive frequency is shown by red squares. This phase is constantly 0 ∘ as expected.
As described in the previous sections, both ΔTDC and ΔTAC can be determined by using the digital lock-in technique and Eq. (5). The results of both quantities are shown and discussed in the following section.
The aim of analyzing the 1ω signal is to receive information about the ambient temperature, an additional parameter which might be determined with the same measurement method. The measurement result with respect to ΔTDC is shown first and presented in Fig. 4 as a function of drive frequency. Three observations can be made from these measurements. First, the phase is 0.0(1)∘ for all drive frequencies, as expected because it is a DC signal and the phase is zero or not defined, respectively. For drive frequencies larger than 10 Hz, the measurement uncertainty of the phase becomes larger: a reason could be the increasing uncertainty of the 3ω signal due to the decrease in the sensitivity (see also next section). Second, although ΔTDC contains the thermal information about the different urea concentrations, the measurement results can not resolve the different concentrations, and the information about the concentration gets lost in the measurement noise. Due to this finding, it is enough to plot the average ΔTDC as a function of drive frequency and lead to the third observation. The temperature increase ΔTDC is on the order of 3 ∘C with respect to the ambient temperature Tamb. Moreover, ΔTDC shows a frequency dependence, and it decreases by 0.8(1) ∘C between 0.1 and 1000 Hz. The reason might be found in the interaction of the DC temperature field and the AC temperature field. The theory of the 3ω method explains the amplitude of the thermal wave becoming larger for lower frequencies, and the higher temporary heating may also shift the thermal equilibrium to higher steady-state temperatures. Further investigations have to be done to analyze this behavior in more detail. Nevertheless, the shown result of TDC or Tamb+ΔTDC can give a good indication of the ambient temperature, which could be a useful feature for applications without having an additional temperature sensor; a single one-point calibration would be enough to determine TDC.
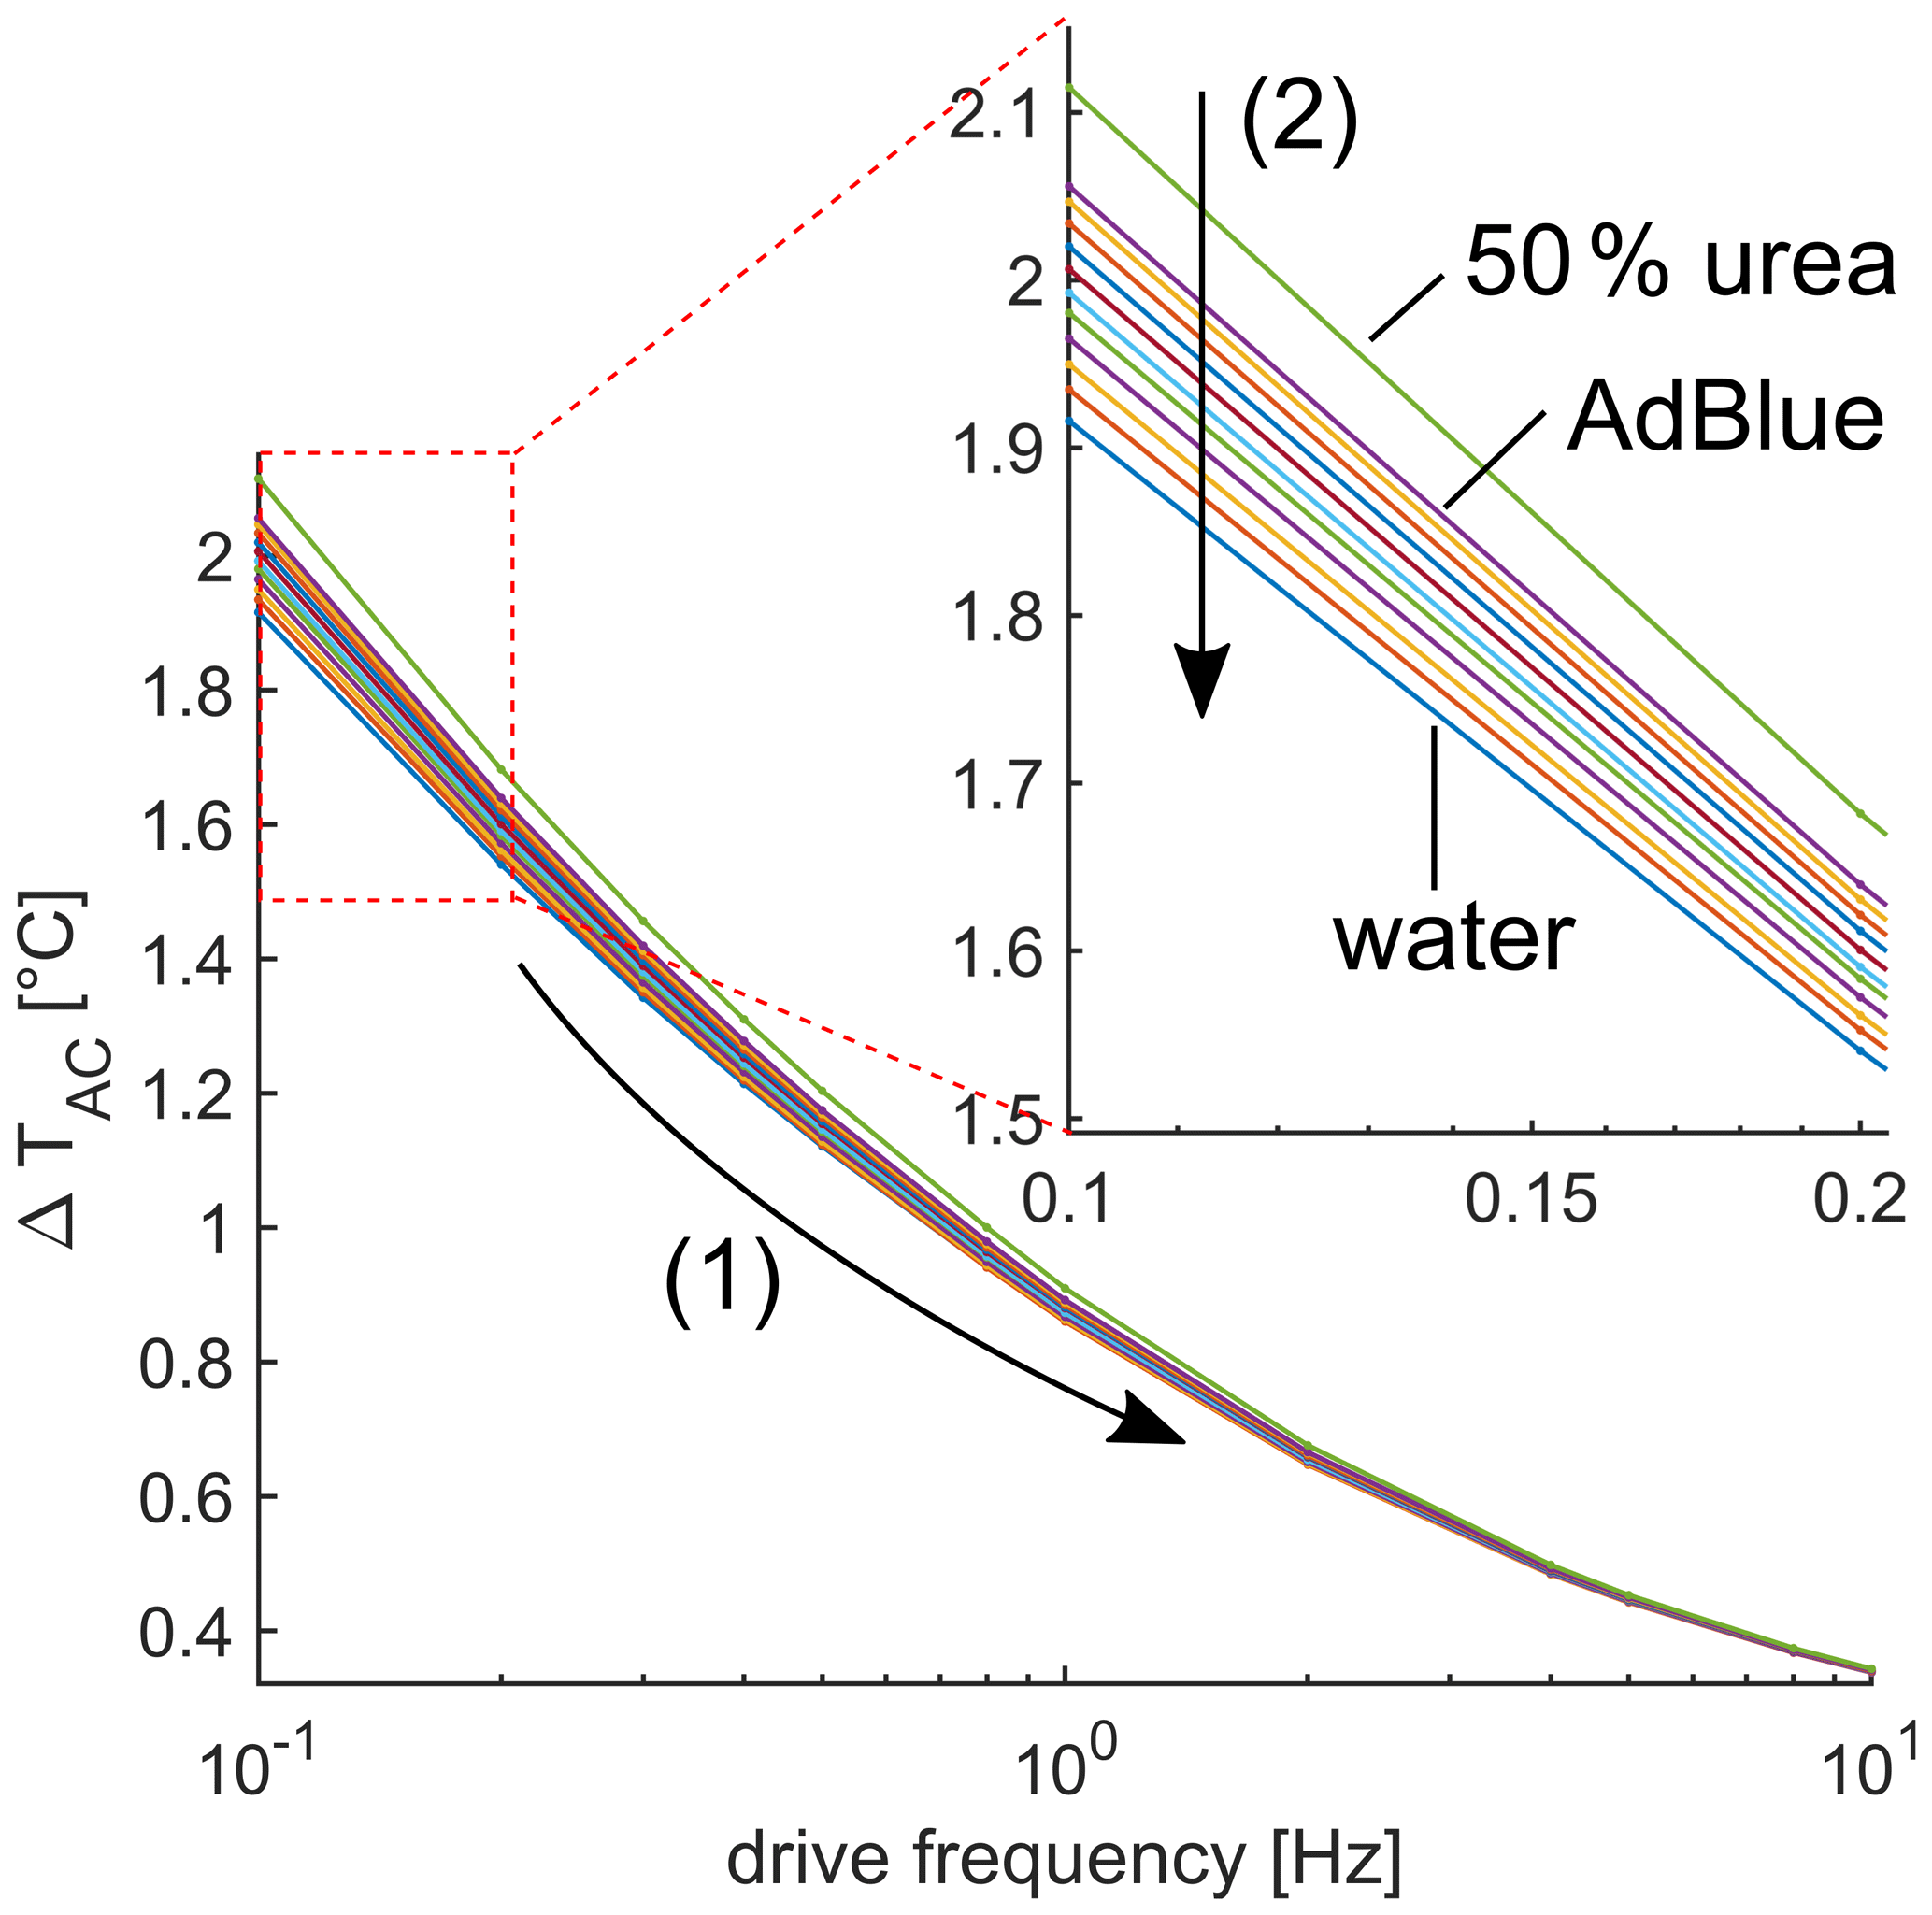
Figure 5Voltage amplitude V3ω as a function of drive frequency. (1) Voltage V3ω monotonically decreases for increasing drive frequency. Zoomed cutout: (2) the signal decreases if the urea concentration decreases.
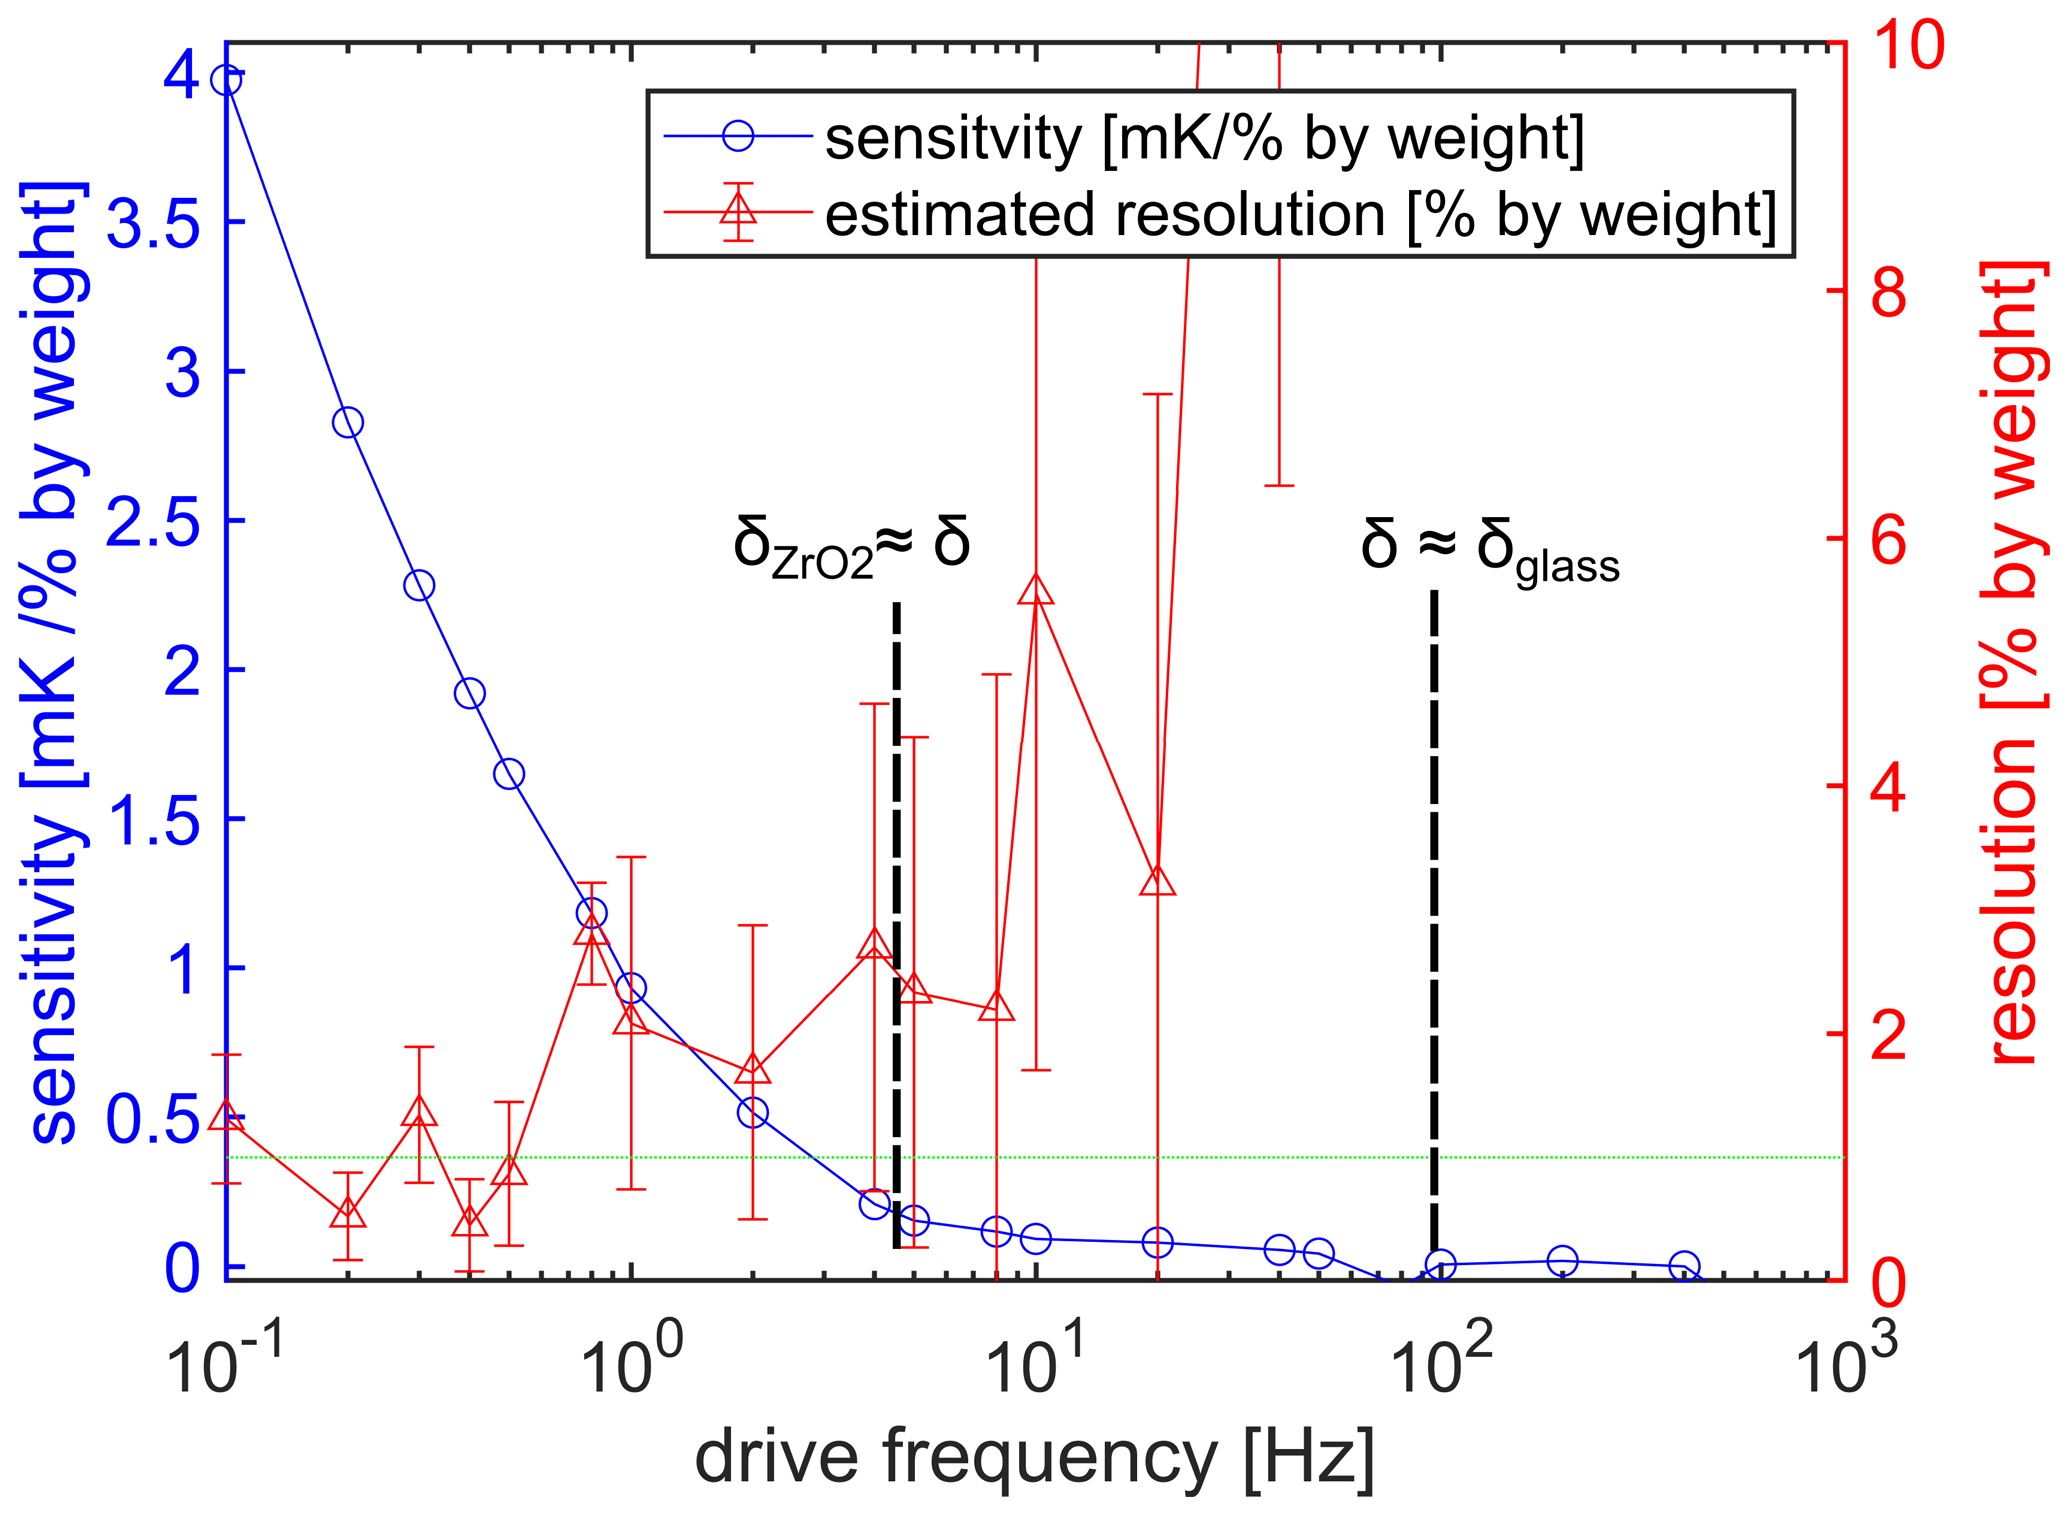
Figure 6Sensitivity as a function of drive frequency (blue dots). The sensitivity decreases for increasing drive frequency. The steepest decrease takes place if the frequency is smaller than 5 Hz. For higher frequencies, the thermal wave does not penetrate the zirconium oxide and a low sensitivity is expected. Estimated resolution (, where δ(ΔTAC) is the measurement uncertainty for a given frequency) as a function of drive frequency (red triangle). The resolution is 1 % by weight if the frequency is lower than 0.5 Hz.
The main scope of this article is the investigation of the 3ω signal regarding different urea–water mixtures. Figure 5 shows the measured amplitude ΔTAC for different mixtures between 0 % and 50 % by weight urea as a function of the drive frequency between 0.1 and 10 Hz. Because the thermal response and the penetration depth decreases for increasing frequency, the amplitude ΔTAC decreases as well, as indicated by (1) in Fig. 5. For the presented frequency range, the amplitude varies between around 2 K at 0.1 Hz and 0.4 K at 10 Hz. Furthermore, the different urea concentrations show a resolvable signal difference (see zoomed cutout in Fig. 5), and the amplitude ΔTAC decreases for decreasing urea concentration. Moreover, the sensitivity defined as the approximately constant slope regarding amplitude and urea concentration also decreases for increasing drive frequency, which is shown in Fig. 6 as the blue dots. A steep decrease in sensitivity occurs in the frequency range between 0.1 and 5 Hz. For higher frequencies, the sensitivity is lower than 0.3 mK/% by weight, and the further decline is moderate. The decline of the sensitivity has two main reasons. First, the thermal response generally decreases if the frequency increases, as already seen in Fig. 5. Moreover, because the heater structure is not in direct contact with the urea–water mixture, the amount of the thermal wave reaching the urea–water mixture is frequency dependent and in direct relation to the penetration depth. If the frequency is smaller than 4.4 Hz, the penetration depth (use Eq. 2) is larger than the zirconium oxide substrate and the glass passivation, respectively, and the thermal wave reaches the fluid of interest at the bottom and the top of the sensor. If the frequency is between 4.4 Hz and 100 Hz, the penetration depth is smaller than the zirconium oxide substrate but still larger than the passivation and the thermal wave can only reach the fluid of interest from one side, and the sensitivity is strongly reduced. No fluid sensitivity is assumed for frequencies above 100 Hz. The resolution of the urea concentration can be estimated by using the sensitivity and the measurement uncertainty. The measurement uncertainty was experimentally determined by taking multiple measurements. The estimated resolution is plotted as the red triangles in Fig. 6. The resolution of 1 % by weight can be achieved for the frequency range between 0.1 Hz and 0.4 Hz. For higher frequencies, the estimated resolution decreases. The error bar increases for increasing frequency: the reason is the decrease in the sensitivity. A significant distinction between water and 50 % by weight urea–water mixture is possible up to a drive frequency of 20 Hz.
Figure 7Phase ϕ as a function of drive frequency. (a) Phase ϕ3ω does not monotonically behave. However, the measured phase has a local minimum at 2 Hz. (b) A correlation between phase and urea concentration can be found as indicated by the arrow. The phase increase for increasing urea concentration.
Due to the digital lock-in amplifier, the corresponding phase ϕ of the 3ω signal can be determined, which is presented in Fig. 7. The phase as the function of the drive frequency is not monotonic, as indicated by (A) in Fig. 7, and a local minimum exists. The layered structure (see Fig. 1) might be the reason for this non-monotony due to the heat flux continuity at its interface of the two layers. Such signal behavior of layered structures can be predicted by, e.g., the matrix formalism of Feldman (Feldman, 1999; Kim et al., 1999). A direct correlation between the measured phase and the urea concentration is observable in the frequency range between 0.3 Hz and 20 Hz, where the phase increases for decreasing urea concentration, as indicated by (B) in Fig. 7. The measurement results for frequencies of 0.1 and 0.2 Hz do not give a clear correlation between measured phase and urea concentration. A reason could be the layered structure as well. The sensitivity (with respect to phase and urea concentration) is also not monotonic in Fig. 7. The largest sensitivity occurs at 2 Hz, where the local minimum is located. Theoretical investigations predict such a behavior of the phase if a layered structure is present (Feldman, 1999). Because the phase is independent of quantities like current and resistance, the phase might be a more interesting measurement quantity for application than the amplitude because it could simplify tolerance and calibration procedures.
Figure 8The oscillation amplitude ΔTAC as a function of urea concentration (blue solid line) and phase ϕ as a function of urea concentration (red dashed line). In both cases, a clear correlation between urea concentration and the signal is shown with an estimated resolution of 1 % by weight.
Figure 8 shows the ΔTAC (blue solid line) and the phase ϕ (red dashed line) as the function of urea concentration at the frequency of 0.3 Hz. On the one hand, the temperature amplitude increases monotonically for increasing urea concentration. Pure deionized water has the smallest amplitude, whereas the amplitude at 50 % by weight urea has the highest amplitude. The reason is the decrease in thermal diffusivity if the urea concentration increases (see Table 1). The concentration resolution is estimated to be 1 % by weight as calculated above (see also Fig. 6). However, a tradeoff exists between resolution and measurement time for a given setup. If the resolution should be high, the drive frequency must be low and the measurement time high. On the other hand, the measured phase decreases for increasing urea concentration. The resolution is 1 % by weight as well, using similar arguments as for the amplitude. Figure 8 shows the fact that both amplitude and phase can be used to distinguish the urea concentration in water with similar resolution. Both measurement quantities have advantages and disadvantages. On the one hand, the advantage of the phase is the independence of the measurement parameters as drive current and basic resistance. The phase depends ideally only on the thermal characteristics of the sensor's surroundings. This fact could be a big advantage with regard to the application; e.g., wider production tolerance or less calibration are conceivable. The disadvantage is the need for a phase-sensitive measurement principle as a lock-in amplifier; the hardware and software are often more complex. On the other hand, the advantage of measuring the amplitude is that such a phase-sensitive measurement technique is not needed. Generally, a Fourier transform of the measured voltage is sufficient (Clausen et al., 2017). The handling of timing issues is often simpler to realize, and the hardware and software are not as complex as a phase-sensitive measurement technique. However, the amplitude is strongly dependent on the measurement parameters such as current and basic resistance (see Eq. 5). To realize a sensor concept on the basis of the shown results to measure the urea concentration in an application, the suitable choice of sensor, hardware, and software depends strongly on the application's need.
In conclusion, this article presents a method using a platinum thin-film sensor in combination with the 3ω method to resolve the urea concentration in water with a resolution of 1 % by weight. A detailed analysis of the 3ω signal showed that both the amplitude of the temperature oscillation and its phase are suitable for determining the urea concentration in water. Both quantities have their advantages and disadvantages. On the one hand, the amplitude allows a more straightforward approach to measuring and interpreting the signal; however, the sensor must be well characterized; e.g., drive current, basic resistance, and temperature-to-resistance coefficient must be known. On the other hand, the phase is mostly independent of these quantities; however, the ability to measure the phase needs a phase-sensitive setup, e.g., a lock-in amplifier.
Besides the analysis of the 3ω signal, the 1ω signal is analyzed as well: the results showed that the 1ω, being approximately proportional to the steady-state temperature, is frequency dependent. The reason might be found in the interaction between steady-state temperature and thermal wave leading to a frequency-dependent thermal equilibrium. Nevertheless, a simple one-point calibration might be enough to use this information for an indication of the temperature.
These findings may be used for future AdBlue analyzing tools in diesel combustion monitoring. Moreover, the presented sensor structure is also suitable for flow measurement, which leads to the next step, investigating the 3ω signal for different urea concentrations under varying flow conditions. These steps are very specific for this diesel combustion monitoring and, more generally, the ability and the advantages of a digital lock-in amplifier have not yet been fully investigated regarding the 3ω method, especially the powerful fact that no physical reference signal is needed. Further investigations regarding the abilities of digital lock-in amplifiers will be carried out.
The data can be accessed by direct request to the corresponding author.
RB, CH and MJ developed the concept. RB carried out the formal analysis and performed the experimental investigations. RB, CH, MJ and KS were involved in the writing of the manuscript. CH, MJ, HP, KS and JW acted as supervisors.
The authors declare that they have no conflict of interest.
This article is part of the special issue “Sensors and Measurement Science International SMSI 2020”. It is a result of the Sensor and Measurement Science International, Nuremberg, Germany, 22–-25 June 2020.
This paper was edited by Peter A. Lieberzeit and reviewed by two anonymous referees.
BASF – The Chemical Company: AdBlue® Technical Leaflet, 1–6, available at: https://www.gabriels.be/sites/gabriels/files/pdf/technische_fiche_adblue-_engels.pdf (last access: 20 September 2020), 2006. a, b
Cahill, D. G.: Thermal conductivity measurement from 30 to 750 K: The 3ω method, Rev. Sci. Instrum., 61, 802–808, https://doi.org/10.1063/1.1141498, 1990. a, b
Care, E.: CRC Handbook of Chemistry and Physics, 2009–2010, 90th ed., edited by: Lide, D. R. and Haynes, W. M., CRC Press, Boca Raton, Florida, USA, vol. 131, https://doi.org/10.1021/ja906434c, 2009. a, b
Clausen, C., Pedersen, T., and Bentien, A.: The 3-omega method for the measurement of fouling thickness, the liquid flow rate, and surface contact, Sensors, 17, 552, https://doi.org/10.3390/s17030552, 2017. a, b
de Beeck, J. O., Thompson, J., and Booth, N.: Upcoming Emission Regulations for Passenger Cars: Impact on SCR System Requirements and Developments, SAE 2013 World Congress & Exhibition, SAE International, Detroit, USA, 16–18 April 2013, https://doi.org/10.4271/2013-01-1072, 2013. a
Feldman, A.: Algorithm for solutions of the thermal diffusion equation in stratified, High Temp.-High Press., 31, 293–298, https://doi.org/10.1177/0192513X12437708, 1999. a, b
Fendri, A., Büschel, P., Abelkafi, A., Kanoun, O., and Buchholz, A.: AdBlue Quality Control using Impedance Spectroscopy, in: AMA Conference – Sensors 2015 and IRS2 2015, 830–832, Nürnberg, Germany, https://doi.org/10.5162/sensor2015/P7.3, 2015. a
Giancoli, D. C.: Physics : principles with applications, Prentice-Hall International, Englewood Cliffs, New Jersey, US, 4th edn., i edn., 1995. a
Gurusamy, P., Gandhi, U., Mangalanathan, U., and Lr, K. M.: Measurement of diesel exhaust fluid concentration in urea-SCR after-treatment system, Int. J. Precis. Eng. Man., 18, 1085–1092, https://doi.org/10.1007/s12541-017-0127-z, 2017. a
Innovative Sensor Technology IST AG: Application Note RTP Platinum Sensor, available at: https://www.ist-ag.com/sites/default/files/atp_e.pdf (last access: 20 September 2020), Innovative Sensor Technology IST AG, Ebnat-Kappel, Switzerland, 2014. a
Kim, J. H., Feldman, A., and Novotny, D.: Application of the three omega thermal conductivity measurement method to a film on a substrate of finite thickness, J. Appl. Phys., 86, 3959–3963, https://doi.org/10.1063/1.371314, 1999. a
Kumawat, N., Pal, P., and Varma, M.: Quality monitoring of diesel exhaust fluid in vehicles using diffractive interference sensors, in: SENSORS, 2014 IEEE, 2–5 November 2014, Valencia, Spain, 1676–1678, https://doi.org/10.1109/ICSENS.2014.6985343, 2014. a
Lu, L., Yi, W., and Zhang, D. L.: 3ω Method for Specific Heat and Thermal Conductivity Measurements, Rev. Sci. Instr., 72, 2996–3003, https://doi.org/10.1063/1.1378340, 2001. a
Moon, I. K., Jeong, Y. H., and Kwun, S. I.: The 3ω technique for measuring dynamic specific heat and thermal conductivity of a liquid or solid, Rev. Sci. Instr., 67, 29–35, https://doi.org/10.1063/1.1146545, 1996. a
Olabi, A. G., Maizak, D., and Wilberforce, T.: Review of the regulations and techniques to eliminate toxic emissions from diesel engine cars, Sci. Total Environ., 748, 141249, https://doi.org/10.1016/j.scitotenv.2020.141249, 2020. a
Schmitt, B., Kiefer, C., and Schütze, A.: Microthermal sensors for determining fluid composition and flow rate in fluidic systems, Microsyst. Technol., 20, 641–652, https://doi.org/10.1007/s00542-013-2001-y, 2014. a
Sigma-Aldrich: Safety Data Sheet – Urea, 1907, Sigma-Aldrich Chemie GmbH, Taufkirchen, Germany, 2019. a
Weingarten, E., Bayer, T., Chaineux, M., Lüders, H., and Bareiss, S.: Bosch AdBlue Dosing Technology for EU6-RDE and Beyond, in: 11. Tagung Einspritzung und Kraftstoffe 2018, edited by: Tschöke, H. and Marohn, R., 443–461, Springer Fachmedien Wiesbaden, Wiesbaden, 2019. a