the Creative Commons Attribution 4.0 License.
the Creative Commons Attribution 4.0 License.
 | 04 Jan 2022
Smart in-cylinder pressure sensor for closed-loop combustion control
Dennis Vollberg
Peter Gibson
Günter Schultes
Hans-Werner Groh
Thomas Heinze
Our approach of a closed-loop combustion control is built on an intensively evaluated robust cylinder pressure sensor with integrated smart electronics and an openly programmed engine control unit. The presented pressure sensor consists of a steel membrane and a highly strain-sensitive thin film with laser-welded electrical contacts. All components are optimized for reliable operation at high temperatures. The sensor setup safely converts the in-cylinder pressure of a combustion engine at temperatures of up to 200 ∘C into the desired electrical values. Furthermore, the embedded smart electronics provides a fast analogue to digital conversion and subsequently computes significant combustion parameters in real time, based on implemented thermodynamic equations, namely the 50 % mass fraction burned, the indicated mean effective pressure, the maximum pressure and a digital value, which represents the intensity of knocking. Only these aggregated parameters – not the running pressure values – are sent to the engine control unit. The data communication between the smart sensor and the engine control unit is based on the controller area network bus system, which is widely spread in the automotive industry and allows a robust data transfer minimizing electrical interferences. The established closed-loop combustion control is able to control the ignition angle in accordance with the 50 % mass fraction burned at a certain crankshaft angle. With this loop, the combustion engine is controlled and run efficiently even if the ignition angle is intentionally incorrectly adjusted. The controlled and automatic correction of simulated ageing effects is demonstrated as well as the self-adjustment of an efficient operation when different fuels are used. In addition, our approach saves the computing capacity of the engine control unit by outsourcing the data processing to the sensor system.
- Article
(6680 KB) - Full-text XML
- BibTeX
- EndNote


Global emission limits for atmospheric pollutants are becoming increasingly strict due to the necessary change towards more climate and nature protection. Consequently, modern cars and large marine and stationary combustion engines require a further reduction of nitric oxides, carbon dioxide, and particulate emission levels. Therefore, it is important to measure and control the process of combustion directly in the cylinder. In a previous paper (Vollberg et al., 2019), we analysed the international scientific status of cylinder pressure measurement and developed and compared different sensor approaches of our own. The work actually presented is based on the most advantageous pressure sensor concept, which is now extended by a sensor-related electronics which calculates some aggregated and meaningful combustion parameters from each pressure signal and forwards only these values to the engine control unit. The engineered sensor housing has to meet the requirements of the spatial conditions of a combustion engine and must shelter all necessary components to realize the measurements and the calculation of the parameters. Hence, the electronics form factor is drastically reduced while simultaneously the computing power is comparable to a precise and costly desktop measurement system. In this way, a control system is realized and evaluated, which proves that combustion can be optimized over various interfering and time-varying influencing factors and, at the same time, saves computing resources of the engine control unit. Keeping in mind that scientific reports are not widely accessible due to the competitive automotive sector in the field of increasing efficiency, we describe and test a complete sensor system whose scientific originality lies in a robust sensor–electronics–software system suitable for the optimization of combustion processes.
One strategy to contribute to this ambitious goal is the continuous closed-loop combustion control of engines (Guido et al., 2013; Carlucci et al., 2014; Lehrheuer et al., 2015). An important controllable variable is the so-called 50 % mass fraction burned (MFB50), calculated from the continuously measured values of an in-cylinder pressure sensor. The MFB50 indicates the crankshaft angle at which 50 % of the fuel has been burned in the current combustion cycle. Most combustion engines reach their best efficiency if the MFB50 is around 8∘ crankshaft angle after the top dead centre. As an actuating variable, the ignition timing is used to balance the MFB50 at a crankshaft angle of 8∘. Such a closed-loop combustion control results in increased engine performance as well as fuel savings and the associated reduction in carbon dioxide.
As a fundamental source of information for calculating the MFB50, the cylinder pressure for each combustion cycle has to be measured accurately by a reliable and robust pressure sensor. Furthermore, other combustion parameters originating from the cylinder pressure curves can be extracted, i.e. the indicated mean effective pressure (IMEP), the maximum cylinder pressure, and the knock detection. In particular, the performance of knock detection would benefit from the direct pressure measurement because no additional sensor is required and the signal is not influenced by any disturbing acoustic source. The application effort for separate knock sensors, which also requires sophisticated placement and signal filtering, would be completely eliminated. However, the concept of reliable pressure transducers designed for the harsh environment in modern combustion engines mainly depends on cost effectiveness, production capability, long-term stability, and packaging requirements. Different concepts for the transformation of pressure into the respective electrical value range from non-intrusive (Sellnau et al., 2000) to intrusive direct-pressure measurement types (Hellemans et al., 2011) using a large variety of physical effects like piezoelectricity, piezoresistivity, and optical fibre-based detection of light reflection of a membrane (Wlodarczyk, 2012), also mentioned in Vollberg et al. (2019). For example, the Kistler company offers spark-plug-based pressure sensors working as piezoelectric, intrusive types. Such sensors are mainly utilized in test bench applications and serve as references because of their high accuracy, but these sensors and charge amplifiers are too expensive for a wide application on custom passenger cars. Although each concept has its own advantages and disadvantages, the intrusive type is already used in some combustion engine applications due to the direct measurement of the physical pressure and the possibility of calibrating the pressure transducer during the manufacturing process. Advantageously, the sensor signal properties are unaffected by any mechanical disturbance during combustion engine installation and operation. However, the sensor requirements, especially for the sensing element, are very challenging. The temperature level can exceed 200 ∘C, depending on the construction, the used materials, and the thermal coupling to surrounding engine parts. In addition, thermal shocks can affect the sensor signal during each combustion cycle to such an extent that a large measurement error occurs. To minimize this source of error, a flame or heat shield can be placed in front of the sensing element, resulting in a more complex sensor design and higher production costs (Borgers et al., 2013). Further requirements must be met, such as a measuring range of up to 300 bar to provide high overload protection and to ensure accurate measurements of dynamic peak pressures of up to 100 bar (Eicheldinger et al., 2019). Additionally, the sensors should exhibit a maximum pressure output error of ±2 % full scale (FS), a high bandwidth of up to 15 kHz for an appropriate dynamic resolution of the pressure signal, and a life expectancy of more than 12 000 h (Sensata, 2015). Today's cylinder pressure sensors provide analogue electrical signals with rudimentary pre-processing of the pressure signal, which makes the signal transmission susceptible to the electrical disturbances prevailing in the combustion engine. In this paper, we present the evolution to a smart sensor. The pressure signal is processed on-site and condensed to meaningful combustion parameters that are forwarded to the engine control unit.
The main components of the smart cylinder pressure sensor are the sensing element, the sensor housing, and the internal electronics. In a previous work (Vollberg et al., 2019) we presented and investigated different sensor designs with respect to the geometrical dimensions of existing combustion engine test benches. These are both non-intrusive pressure-sensing elements, which are equipped with highly sensitive foil strain gauges, and intrusive membrane-based sensors, which are coated with thin piezoresistive and temperature-stable thin films. The best results were achieved with a steel membrane. In that case, the temperature level is relatively low, at about 200 ∘C during engine operation, due to a good thermal conductivity of steel (16 W (m K)−1) and suitable thermal coupling to surrounding engine parts. The signal was not affected by any mechanical influences and provides a direct pressure measurement. Additionally, the sensor housing accommodates the required lead wires, supports the electronics, and protects all inner parts from the harsh environment of the combustion engine.
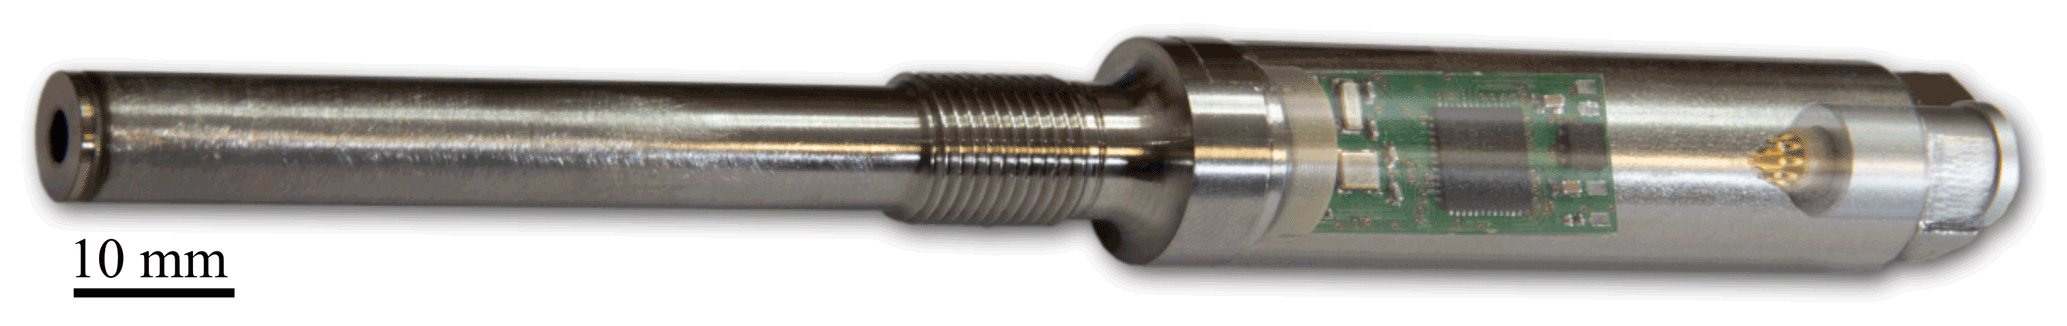
As another part of our development, the steel membrane sensor design was complemented by engineering a reliable and smart electronic circuit embedded in the sensor housing. For cost effectiveness, the smart electronics consists of standard mixed-signal circuits (ICs) with an extended temperature range of up to 125 ∘C, which requires no expensive and complicated development of an application-specific integrated circuit (ASIC). Not only the analogue electrical pressure signal of the sensing element is internally converted to a digital value, ensuring a higher stability against electromagnetic interferences. Furthermore, different combustion parameters like the MFB50 and knock detection based on the pressure signal were calculated by thermodynamic equations, generating pre-processed data to reduce the computing effort of the engine control unit (ECU). The data communication is realized by a robust and stable CAN bus protocol commonly used in automotive engineering. The latest version of the smart pressure sensor is illustrated in Fig. 1.
Finally, an open-access ECU was used to establish a closed-loop combustion control on different engine test benches. The function development including application and testing of the control algorithms was carried out mainly on two PC platforms, namely EHOOKS and the integrated calibration and application tool (INCA) from ETAS.
2.1 Sensing element and housing
The sensing element of the intrusive cylinder pressure sensor is based on a membrane-type structure as shown in Fig. 2a, b, and it is made of stainless steel 17-4 PH (1.4542), offering good mechanical properties even at elevated temperatures. The mechanical load of the membrane is determined by finite-element (FE) analysis with COMSOL Multiphysics. Depending on the geometrical dimension (in this case: inner diameter: 3.2 mm, thickness: 260 µm), the membrane is deflected by 4.9 µm while experiencing a von Mises stress of 360 MPa upon a pressure of 250 bar. The maximum strain at the membrane's centre is 1.3 ‰, both in the radial and tangential directions, while developing a maximum radial compression at the rim of −0.8 ‰.

Figure 2(a) Von Mises stress derived from the FE analysis at 250 bar. (b) Laser-structured Wheatstone bridge design on the steel element. (c) Equivalent electrical circuit of the Wheatstone bridge.
The locations with nearly identical values for strain and compression are determined by FE analysis (Fig. 2a) to identify the correct positions of the Wheatstone bridge resistors (Fig. 2b, c). In order to obtain a reliable electrical insulation, the metallic sensing element was equipped with a 5 µm-thick SiO2 layer at first. Then some highly piezoresistive and temperature-stable thin films were deposited on the insulation layer. One of those films is a novel chromium thin film, showing gauge factors of up to 20, well explained in Schwebke (2021). Alternatively, the membrane was deposited with different carbon-containing metal films. These films offer gauge factors of 5 to 12 depending on the metal and carbon composition and the appropriate thermal ageing after thin film deposition (Schultes et al., 2018). For the metal–carbon films, the best results regarding temperature stability are achieved with an alloy composition of 50 wt % of Ni and 50 wt % of Cr, designated as Ni50Cr50-C:H. The Wheatstone bridge layout was structured by UV-laser ablation, also described in Schultes et al. (2015). To realize a good electrical connection for the lead wires and a temperature sensor Rtemp, the membrane was partially equipped with a further thin film sandwich of with a high temperature coefficient of resistance (TCR ≈3000 ppm K−1).
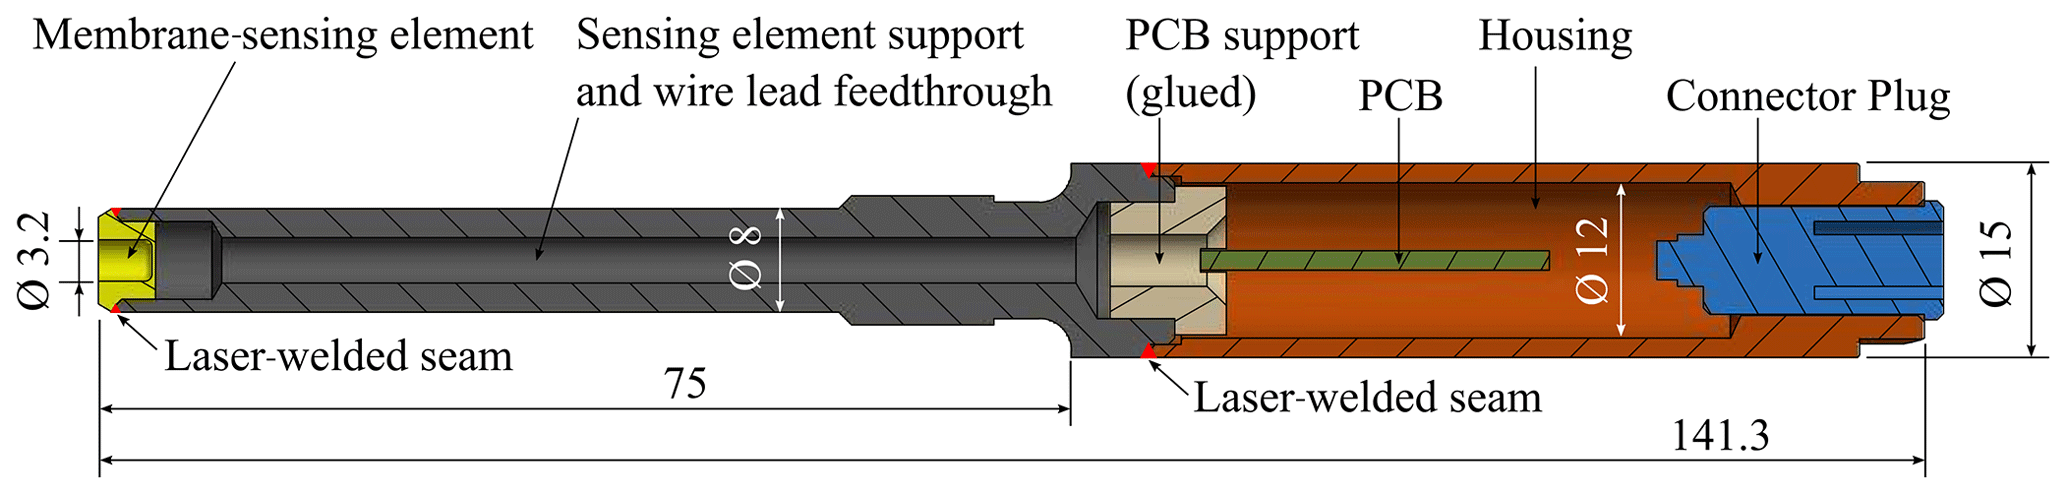
The electrical connection was realized by laser welding of copper wires onto the pads, a process specially developed to create reliable and temperature-stable connections described in detail in a previous paper (Vollberg et al., 2019). For a stable mechanical connection, the membrane-sensing element was laser-welded at the front end of the tube-like support (Fig. 3). Additionally, the support enables a wire lead feedthrough to connect the Wheatstone bridge with the electronics. To complete the smart sensor, a few more parts are needed as shown in Fig. 3, namely the printed circuit board (PCB) carrying the electronic components, the PCB support (material: PEEK), the housing made of stainless steel PH 13-8 Mo (1.4534), and a connector plug (LEMO, seven-pin).
2.2 Electronic design
The requirements for the sensor electronics are derived from the system concept of the smart sensor. With this approach, a purely analogue output of cylinder pressure, as is common for products currently available on the market, is replaced by an integrated, digital data acquisition system including dedicated pre-processing and evaluation. The structure of the sensor electronics can be divided into three functional blocks.
The first block is responsible for signal conditioning; i.e. the raw signal must be amplified, offset-corrected, and low-pass-filtered for further processing. The programmable gain amplifier (PGA) used for this purpose allows the signal-conditioning parameters to be set directly via its digital interface. The second and main block is the microcontroller unit (MCU), which handles both the digitization of the pressure signals and crankshaft position signals as well as the thermodynamic calculation. Real-time signal acquisition generates large amounts of data, which are not simply transmitted in our concept but processed in the sensor, so that only the results and characteristic parameters of the combustion analysis have to be transmitted to the external ECU. The third block is needed to realize the communication with the ECU. Since both recorded and calculated result parameters are available digitally in the microcontroller, it is obvious to use a digital communication interface. The CAN bus, which is common in automotive engineering, is therefore also predestined for our application. In addition to the robustness against external interference, the CAN bus architecture also allows integration into complex networks. This makes it possible to integrate the smart sensor into any existing combustion system. The results of the internal combustion are transmitted compactly to the ECU in one CAN message per combustion cycle.
2.2.1 Circuit board structure
During the development of the board, the focus was placed on sufficient computing power with simultaneous low power consumption (approx. 200 mW at 12 V) and size (27×11 mm). All components are specified for an operating temperature of up to 125 ∘C, thus enabling the sensor to be mounted close to the combustion chamber. The main components are described as follows.
The programmable gain amplifier (PGA308, Texas Instruments) is applied for signal conditioning and configured via UART while operated as an extension to the microcontroller. For this purpose, the PGA parameter set is loaded from the EEPROM of the MCU during initialization of the sensor and written into the RAM of the PGA via a UART interface.
The digitalization and further processing of the data are done by a MCU (STM32L4, STMicroelectronics). This ultra-low-power ARM Cortex-M4 MCU offers many advantages for smart sensor applications: high computing power combined with low power consumption and small dimensions. Functions such as direct memory access (DMA), controller area network (CAN), and 12-bit analogue-to-digital converter (ADC) and a maximum operating temperature of 125 ∘C further improve the performance of the sensor. Since the ARM platform needs a supply voltage of 3.3 V, an additional voltage regulator (LD39050, STMicroelectronics) from 5 to 3.3 V was integrated into the design of the board. The high-speed CAN transceiver (TCAN332, Texas Instruments) offers a transfer rate of 1 Mbit s−1 and is used for bus coupling from TX RX (TTL) of the CAN controller to CANH CANL of the CAN bus. In order to reach a form factor of just 11×27 mm, the described components were attached to a four-layer PCB together with additional passive electronic components as illustrated in Fig. 4.
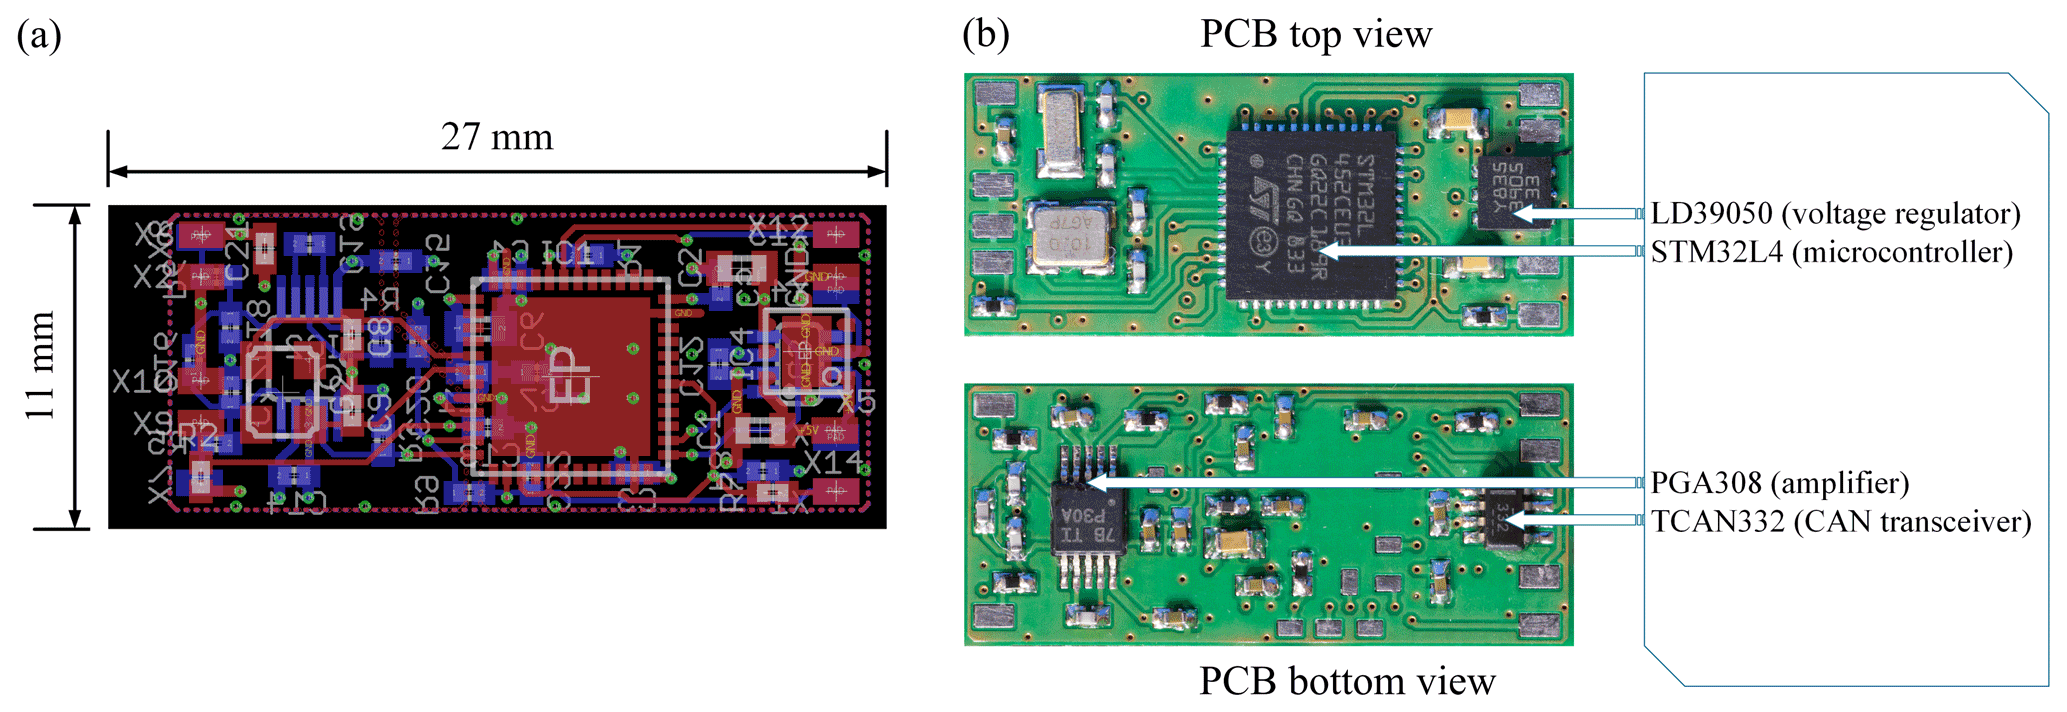
Figure 4(a) PCB layout with top (red) and bottom (blue) electronic part arrangements. (b) Operational PCB.
2.2.2 Algorithms
The algorithms represent the core functions of the smart sensor. Each individual cycle of the combustion pressure is evaluated by applying known, standardized thermodynamic calculation methods (Eqs. 1–3 of AVL, 2013, and Wolgast, 2014). A combustion measurement and analysis device from the company AVL was used as a reference system. The basis for all calculations is a pressure curve, referenced to the crankshaft angle or the cylinder volume calculated from it. After each working cycle of the engine, the microcontroller performs several calculations based on the recorded data, which characterize the combustion. The calculated parameters are described below as examples and are additionally shown in Fig. 5.
Heat release:
Indicated mean effective pressure:
Thermodynamic zero-point correction:
where i is the measuring index, Q the heat quantity, K a constant (unit conversion), k the polytropic exponent, p the cylinder pressure, V the volume, pimep the indicated mean pressure, VH the stroke volume, p1 the pressure at position X1, Δp the pressure difference between X1 and X2, V1 the volume at position X1, V2 the volume at position X2, X1 the measuring point 1 in the compression phase, and X2 the measuring point 2 in the compression phase.
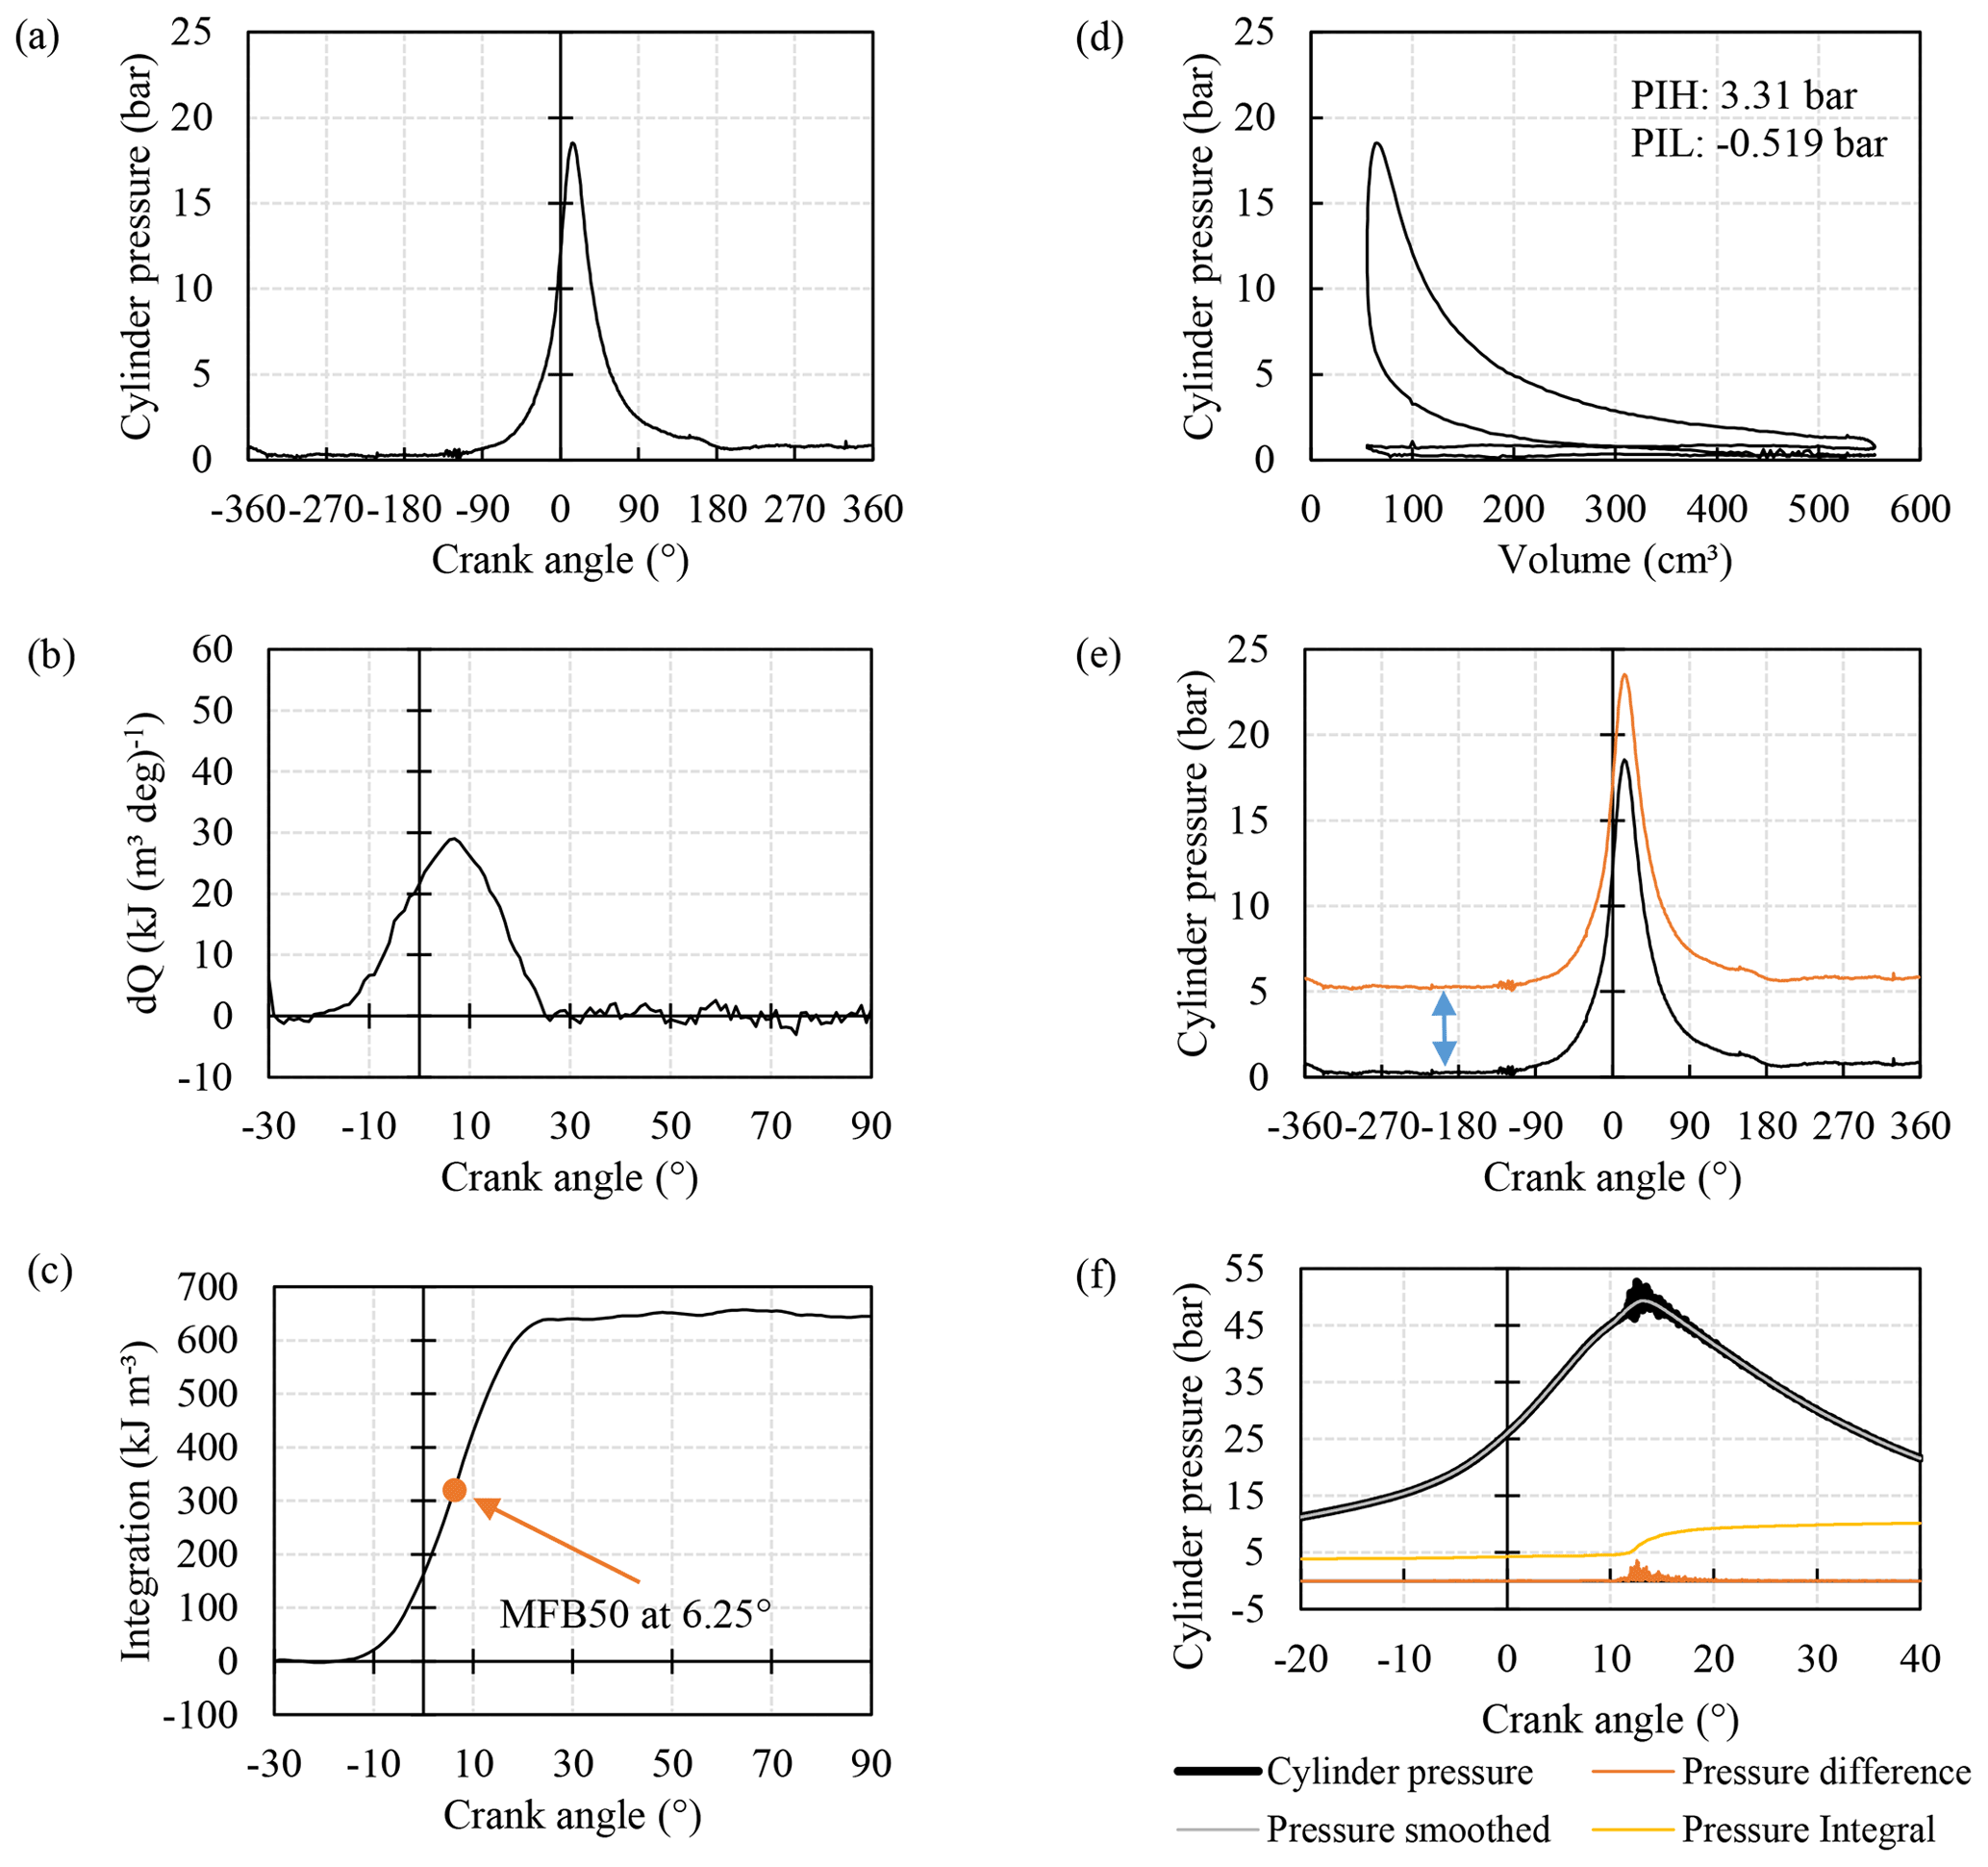
Figure 5Calculated combustion parameters derived from the measured pressure signal. (a) Cylinder pressure signal versus crank angle. (b) Thermal energy dQ per volume and per degree crank angle. As a basis for the mass fraction burned, the thermal energy has to be calculated. (c) Integration of dQ with the determination of the MFB50. (d) Indicated mean effective pressure with a high-pressure loop (PIH) and a low-pressure loop (PIL). (e) Zero-point correction. (f) Knocking appears as high-frequency pressure pulsation.
One of the most important parameters for the combustion control is the mass fraction burned parameter, especially the MFB50. It is a significant indicator for the ECU to operate the engine at its best point in terms of efficiency and emissions, illustrated in Fig. 5c and calculated by Eq. (1). The parameter of the IMEP represents the calculated indicated power per cylinder. The IMEP and other indicators are valuable for correcting for cylinder tolerances and ageing effects of the injectors (Fig. 5d, Eq. 2). The peak pressure indicates the magnitude as well as the position of the maximum pressure (PMAX). This value, together with the knock detection explained below, can be used to ensure that the motor operates close to, but not beyond, its mechanical and thermal limit under all circumstances. Knocking, the uncontrolled self-ignition of fuel, can cause thermal and mechanical overload, possibly resulting in serious damage to the engine. The knock detection is an indicator to operate the engine safely close to the so-called knock limit. Knocking appears in the pressure curve as high-frequency pressure pulsations. The calculated parameter indicates the amount of knocking events in one complete cycle (Fig. 5f). Thermal influences on the sensor membrane can cause an offset of the signal output that appears in the pressure curve. To compensate for this pressure offset, a correction factor is calculated. The compensation is achieved by thermodynamic calculations, the so-called zero-point correction. This compensation is recalculated for each cycle (Fig. 5e, Eq. 3).
2.2.3 Connectivity
For the thermodynamic calculations, a pressure curve over the crankshaft angle is necessary. A standard vehicle usually only has a relatively simple crankshaft sensor with moderate resolution of the engine flywheel. The tooth and tooth gap at the edge of the flywheel result in a signal of defined pulses per revolution, whereby the tooth gap is used for synchronization. This resolution, normally a 10∘ crankshaft angle per pulse, is too low for the smart sensor and is therefore multiplied in the developed electronics by interpolation. By multiplying the flanks, for example, a resolution of 0.1∘ can be achieved.
In our smart sensor concept, the pressure curves are analysed and pre-processed within the sensor, and finally only the essential, characteristic parameters of the examined cycle are transmitted via CAN interfaces to the ECU. This allows the amount of the transmitted data to be reduced to a minimum. At the current stage of development, one CAN data frame (8 bytes, 500 kbit s−1) is sufficient to transmit all data, as depicted in Fig. 6a. The transmission is cyclical: i.e. after each combustion cycle, first an analysis is performed and then the message is sent automatically. The CAN frame structure is freely programmable and can be easily adapted to existing systems.
Together with the electronics, a PC software (Fig. 6b) was developed for the vehicle-specific application beyond the actual development process. Raw data of the pressure sensor, such as pressure samples and combustion processes, can be displayed and stored for later evaluation. In addition, all parameters of the sensor can be checked and adjusted via the software. Due to the smart functionality of the sensor, there is the necessity of a one-time parameterization before the initial operation. The settings include parameters for signal processing, thermodynamic calculations, and communication.
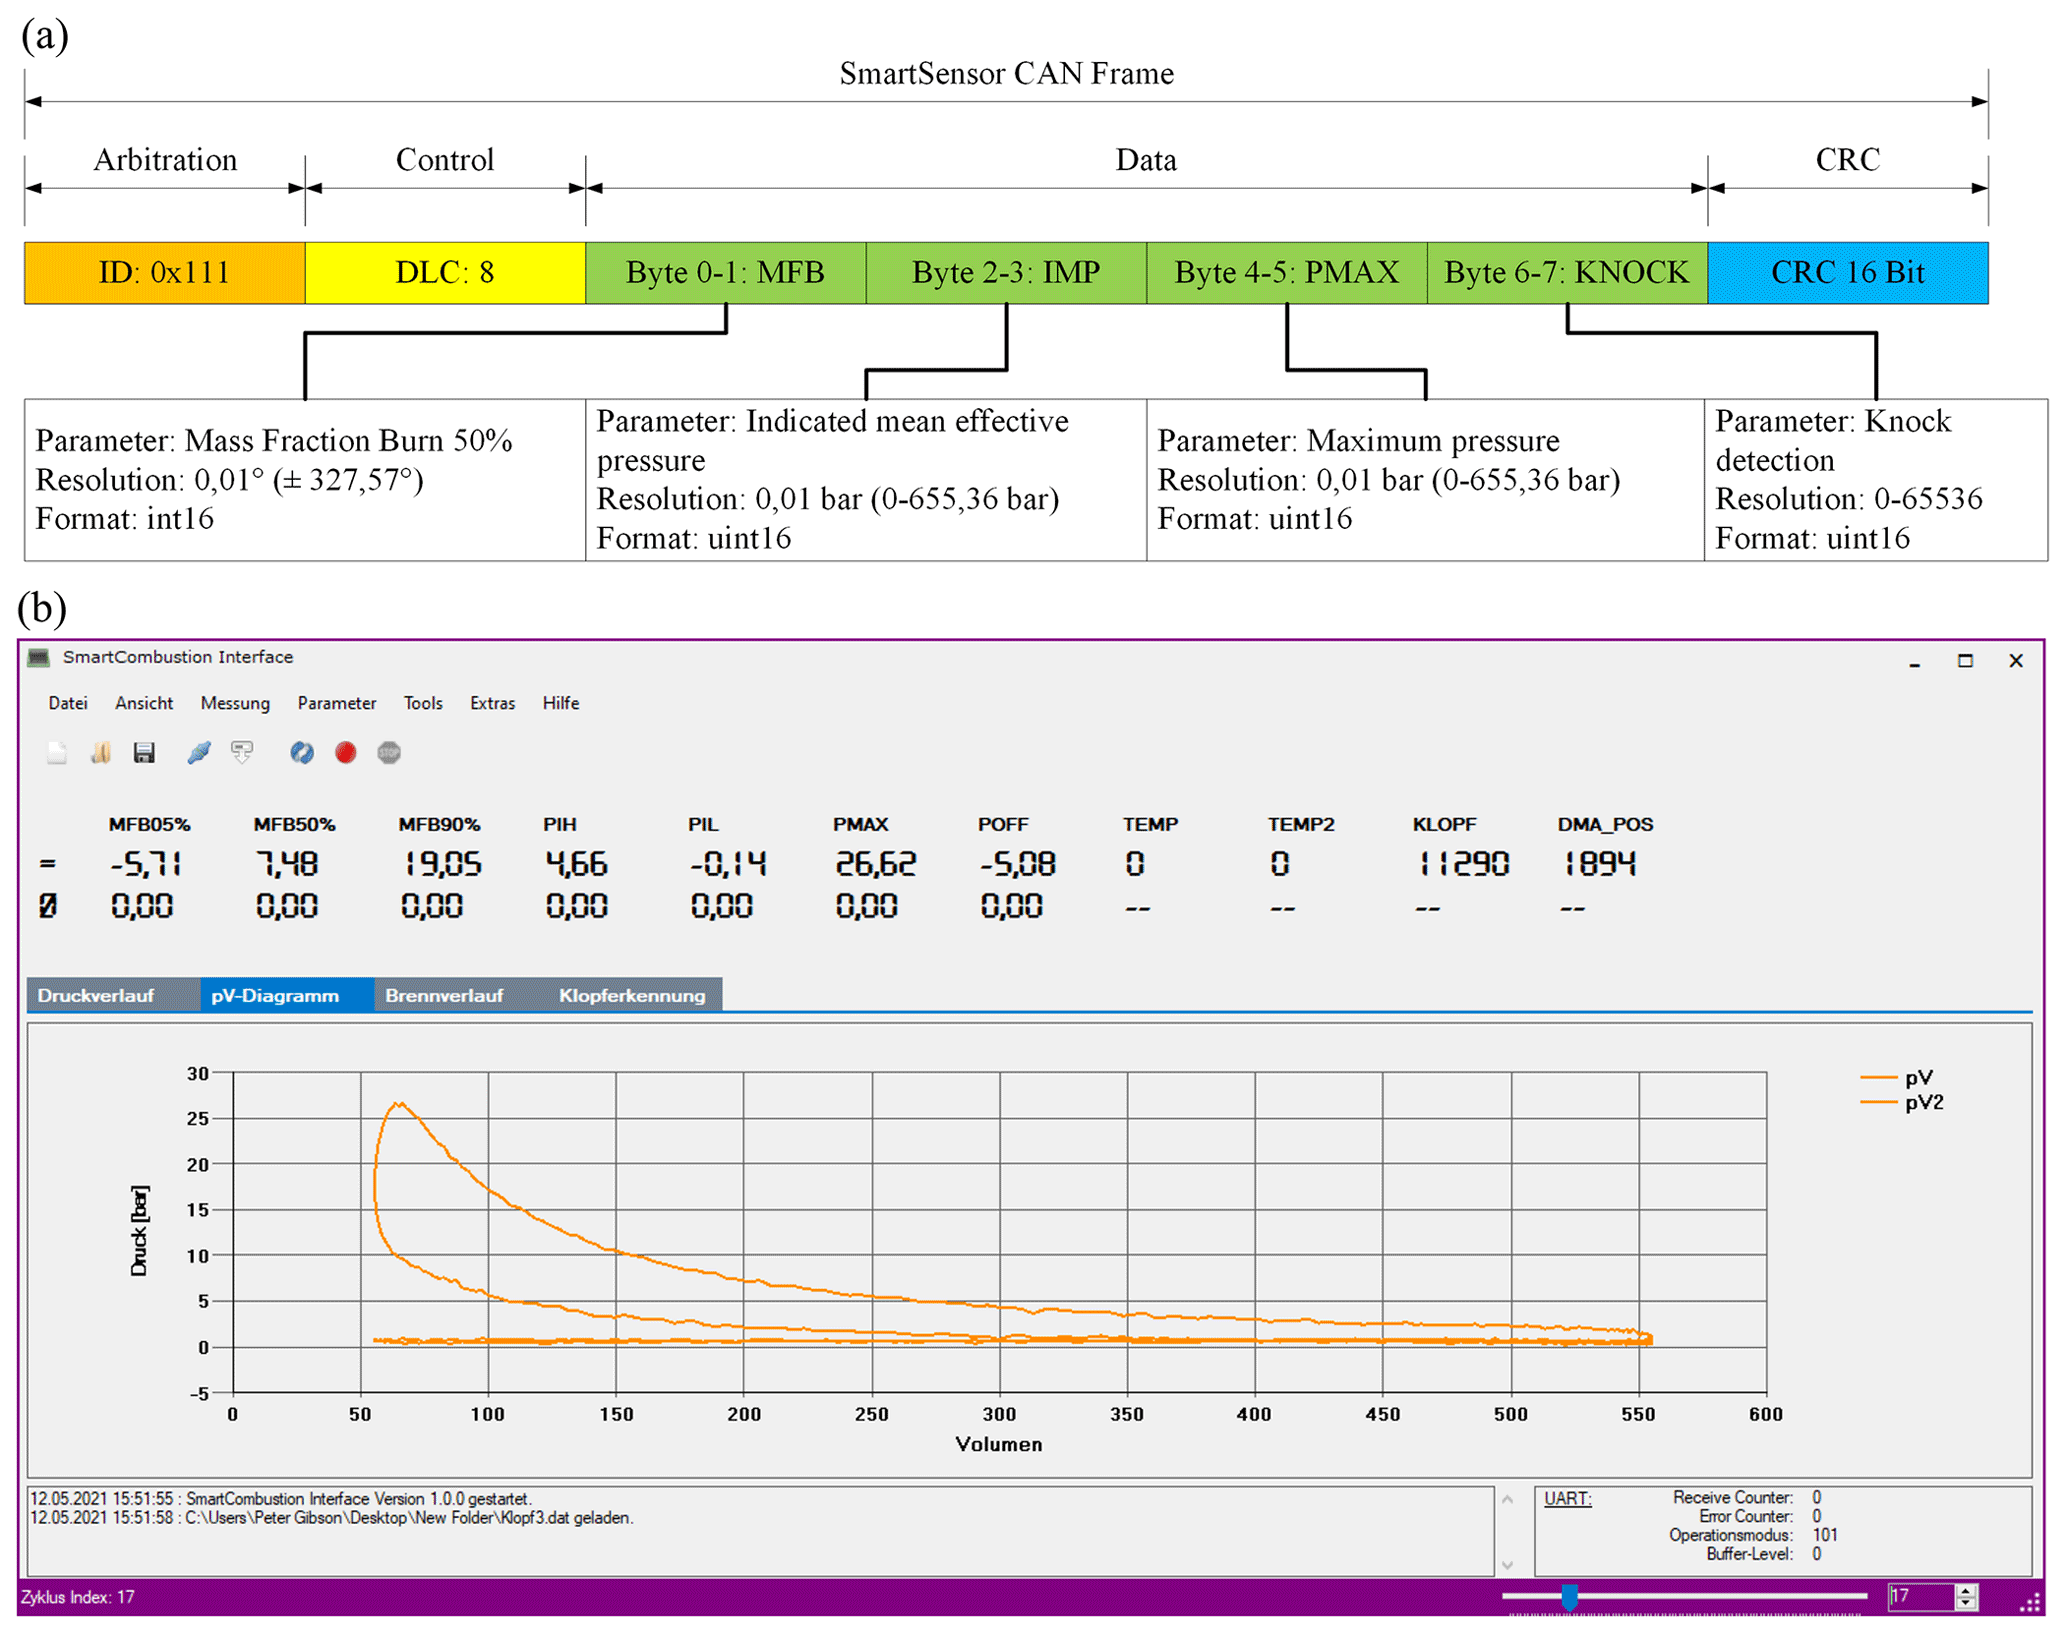
Figure 6(a) Utilized CAN frame. (b) Graphical user interface for sensor configuration and visualization of the processed data.
2.3 Implementation of the smart sensor in the motor control unit and closed-loop combustion control
A FlexECU approach from Robert Bosch GmbH was installed to combine the smart pressure sensor with the motor control unit. This hardware and software package is distributed from a subsidiary company named ETAS. A standard motor control unit was not applicable because such units do not allow the implementation of our new pressure sensors. The FlexECU includes a so-called low-level software which allows an open interfacing of external components like sensors and actors. However, the central motor control block to get a combustion engine running has to be implemented by the users themselves. Only this flexible in-house software approach opens the opportunity to include the smart pressure sensor in the optimization process.
The smart pressure combustion sensor has to be integrated beside the normal sensors and actors. Therefore, the MATLAB/SIMULINK environment is connected to the system via a PC platform running the ETAS application EHOOKS. This setup generates HEX and A2L files which are programmed onto the FlexECU via a serial interface using the INCA development software.
The smart pressure sensor provides high-resolution information to the MCU on the inner thermodynamic processes of the motor in real time. The built-in evaluation electronic generates detailed data and status information regarding the inner combustion process of the input signal coming from the sensor element. These data are fed to a standard control loop as shown in Fig. 7 within the FlexECU, getting the motor to work close to the optimum regarding fuel consumption, emissions, and motor protection. As described above, the MFB50 value is calculated by the built-in evaluation electronics using the measured pressure values and returns the angular position where 50 % of the injected fuel mass is burned. The best efficiency of a combustion engine can be expected for a MFB50 value of 8∘ crankshaft angle after upper dead centre (Wolf, 2019). Deviations of 2∘ from this optimum angle lead to an efficiency degradation of about 1 % (Wolf, 2019).
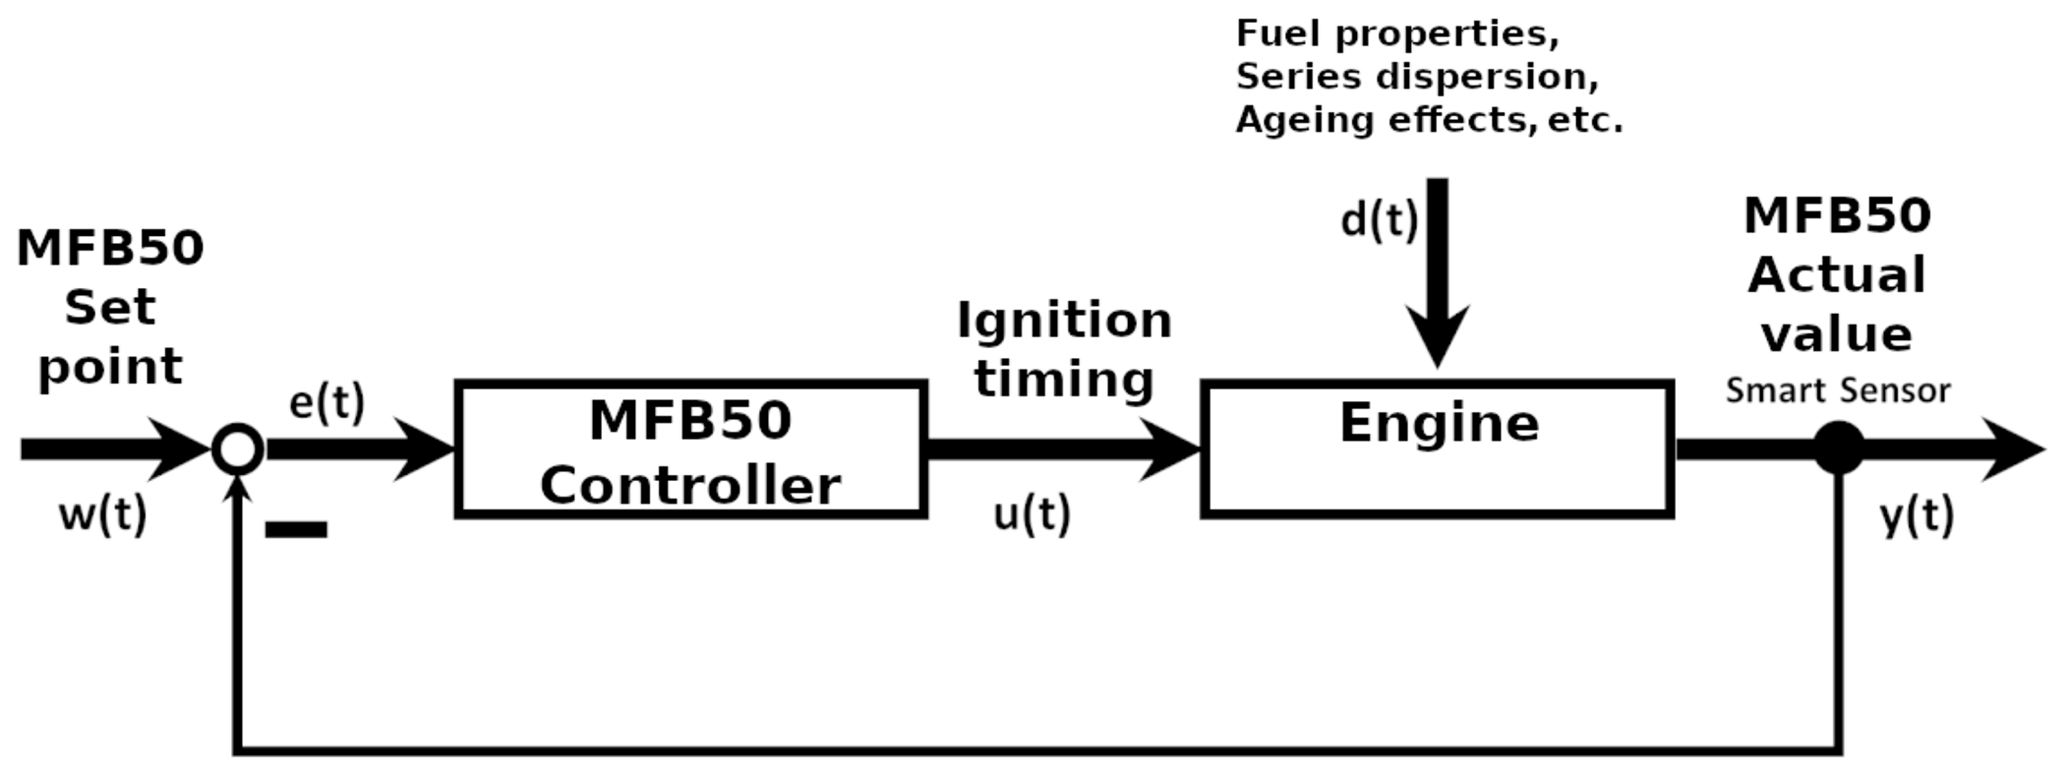
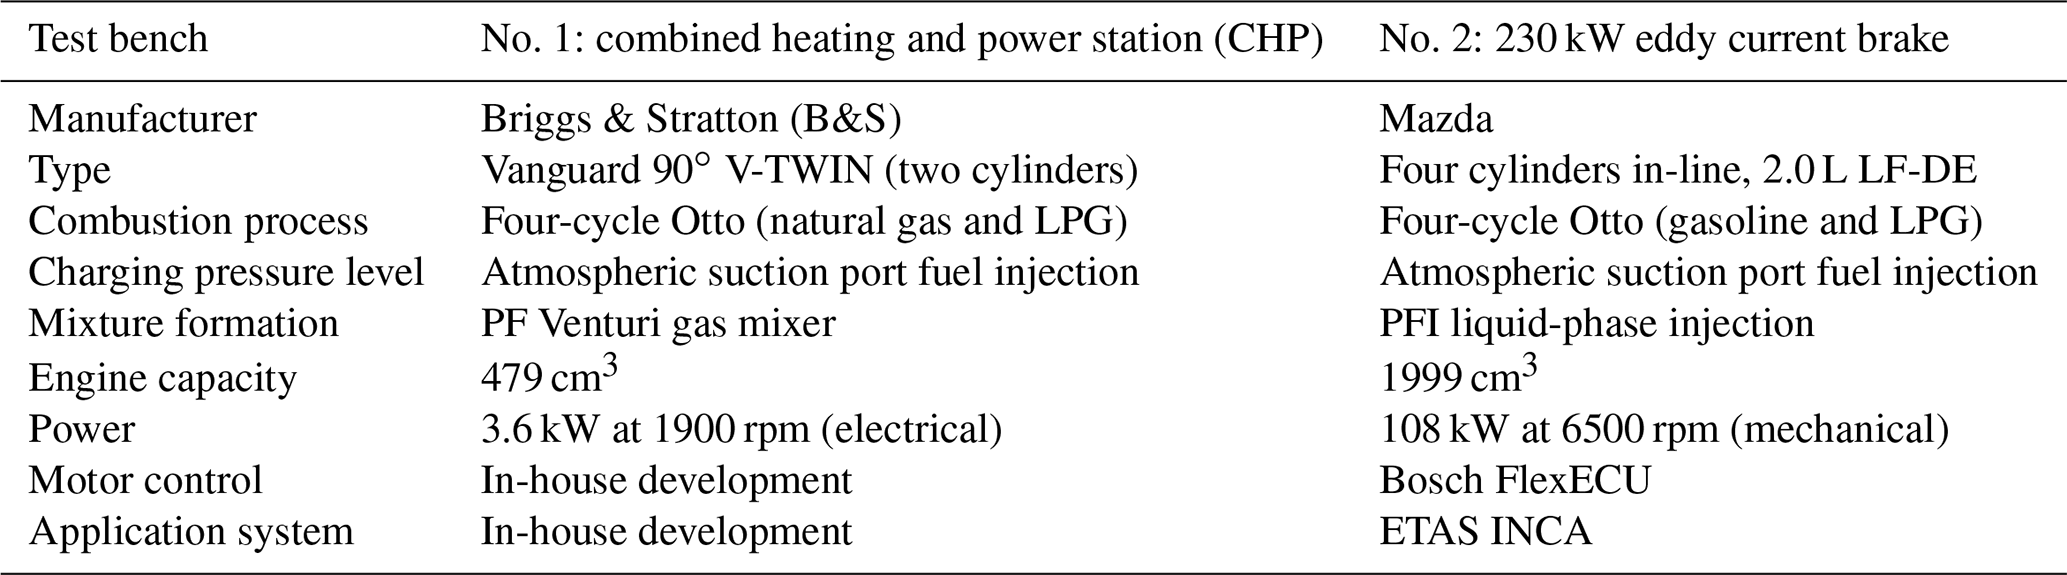
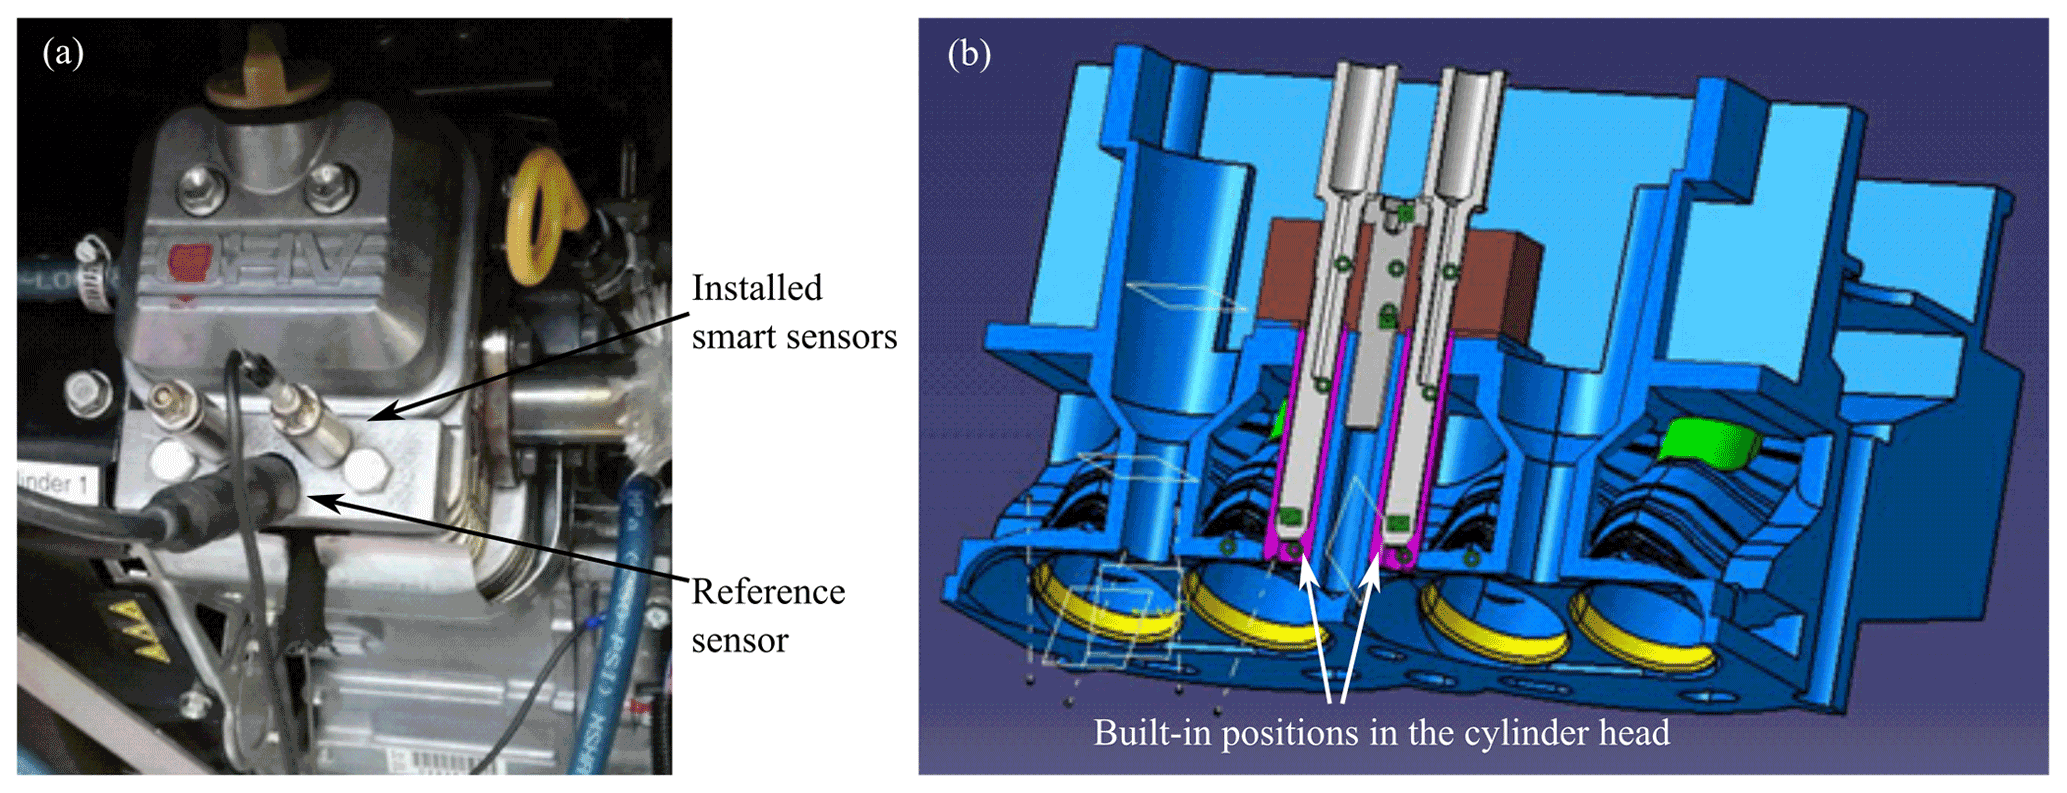
Figure 8Mounting of the pressure sensors: (a) on the Briggs & Stratton motor; (b) on the Mazda motor.
In Fig. 7, the MFB50 value is calculated from the output signal of the smart pressure sensor and is used as a feedback signal in the MFB50 closed-loop control. As the target or desired value, a MFB50 =8∘ crankshaft angle is fed to the control loop under ideal conditions. From the control deviation or error signal e(t) (difference between actual and desired MFB50 values), the controller calculates the control variable u(t) to adjust the ignition time of the FlexECU to bring the control deviation e(t) to zero. In this closed-loop operation, the combustion engine works with its utmost efficiency and operates independently of disturbing external influences like the quality of the gasoline and ageing processes.
3.1 Pre-test on a static pressure test bench
An initial characterization of the smart pressure sensors is performed on a static pressure test bench. At first, the raw pressure sensor without electronics is characterized. The pressure is stepwise increased to 250 bar and then reduced step by step again. In that way, the sensor sensitivity, linearity, and hysteresis errors are determined. A temperature chamber allows the determination of the temperature-dependent errors, like the temperature coefficient of resistance (TCR) and the temperature coefficient of zero (TC0).
3.2 Application and dynamic tests on cylinder heads of engine test benches
Pressure sensor tests and verification are carried out on two different engines on two test benches (Table 1).
Three pressure sensors were mounted for combustion chamber pressure measurement on one cylinder of the B&S motor (Fig. 8a), one of them being a reference, i.e. a spark plug with an integrated piezoelectrical pressure sensor (Kistler, type 6118, accuracy ±1 % FS). Two of our smart sensors were placed in additional threaded holes (M10×1) in a front mounting position.
The four-cylinder in-line Mazda motor was equipped with the same reference spark plugs, namely Kistler type 6118 with piezoelectrical pressure sensors on every cylinder. In addition, two vertical holes through the cooling system of the cylinder head were drilled to get access to cylinders 2 and 3 (Fig. 8b). Mounting sleeves were inserted into the holes and welded to the cylinder head. Finally, the smart pressure sensors were installed in the mounting sleeves, similarly to the B&S motor.

Figure 9(a) Characteristic output signals of sensors with different sensor materials, measured on the static pressure test bench at an ambient temperature of 200 ∘C. (b) Linearity deviations and hysteresis errors of sensors with both types of thin film materials at 200 ∘C.
4.1 Sensor raw signal characteristics derived from static and dynamic pressure tests
Figure 9a compares the sensor output signals versus applied pressure on the static test bench for two different sensor thin film materials at an ambient temperature of 200 ∘C as expected for the installation position. Obviously, the sensitivity of piezoresistive chromium with about 20 mV V−1 at 250 bar is much higher compared to Ni50Cr50:a-C:H with about 5 mV V−1. These sensitivities have to be compared with 2 mV V−1 of standard CrNi alloy films. The linearity deviations and hysteresis errors for sensors equipped with the two materials are depicted in Fig. 9b. The errors of approx. 0.5 % FS are small, and thus these pressure sensors with either sensor material fulfil the necessities of robust pressure sensors.
Additionally, the characteristic temperature coefficients TCR and TC0 are given in Table 2. The values deviate in the listed range, depending on coating parameters and thermal pre-ageing. Assuming the same TCR value for all four resistors within the measuring bridge, a homogenous temperature drift would not influence the output signal. However, under real conditions we have to face material and production process variations with different TCRs for every resistor, leading to non-zero TC0s.
Table 2Typical parameters of pressure sensor prototypes with different thin film materials at 200 ∘C.
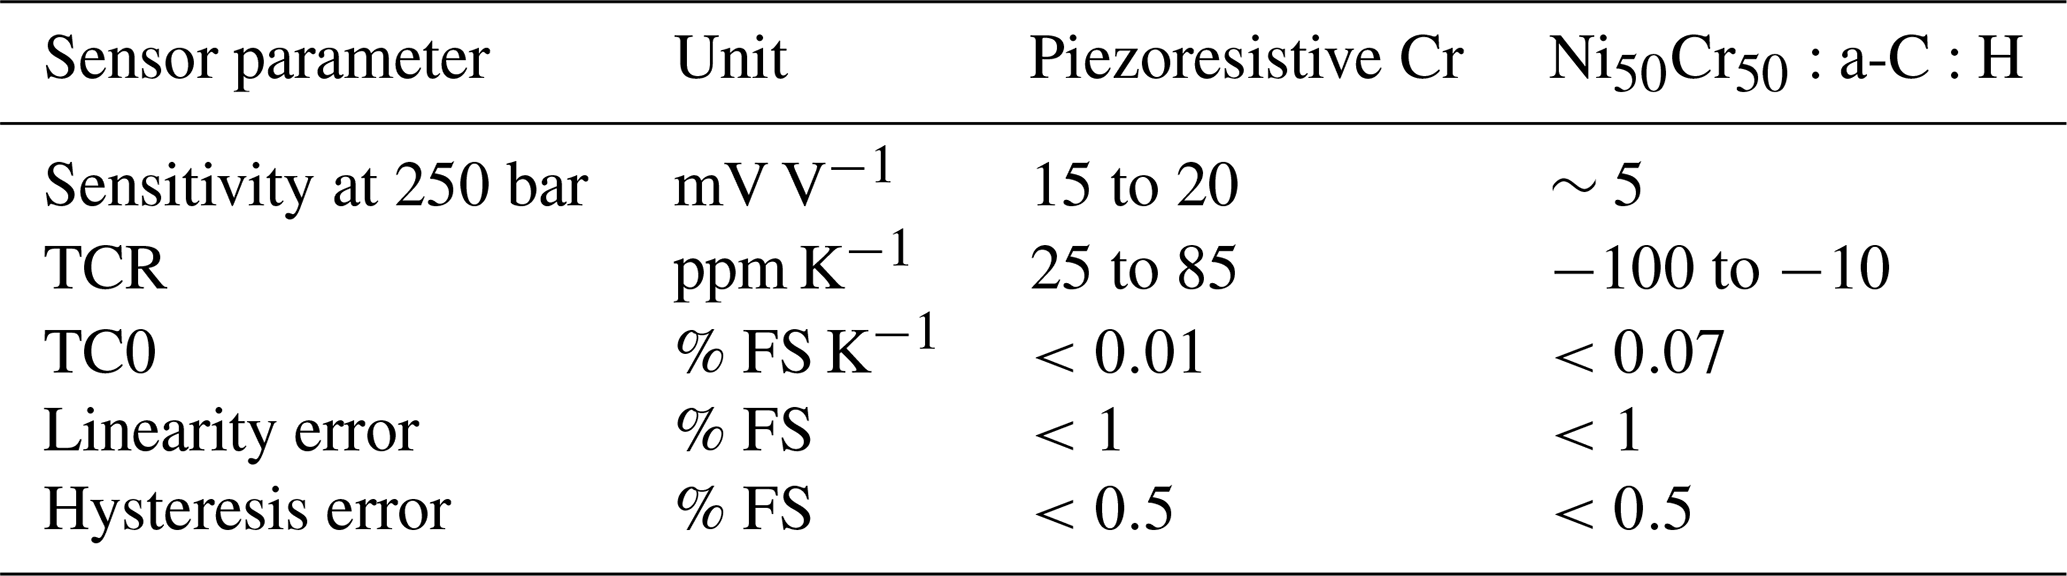
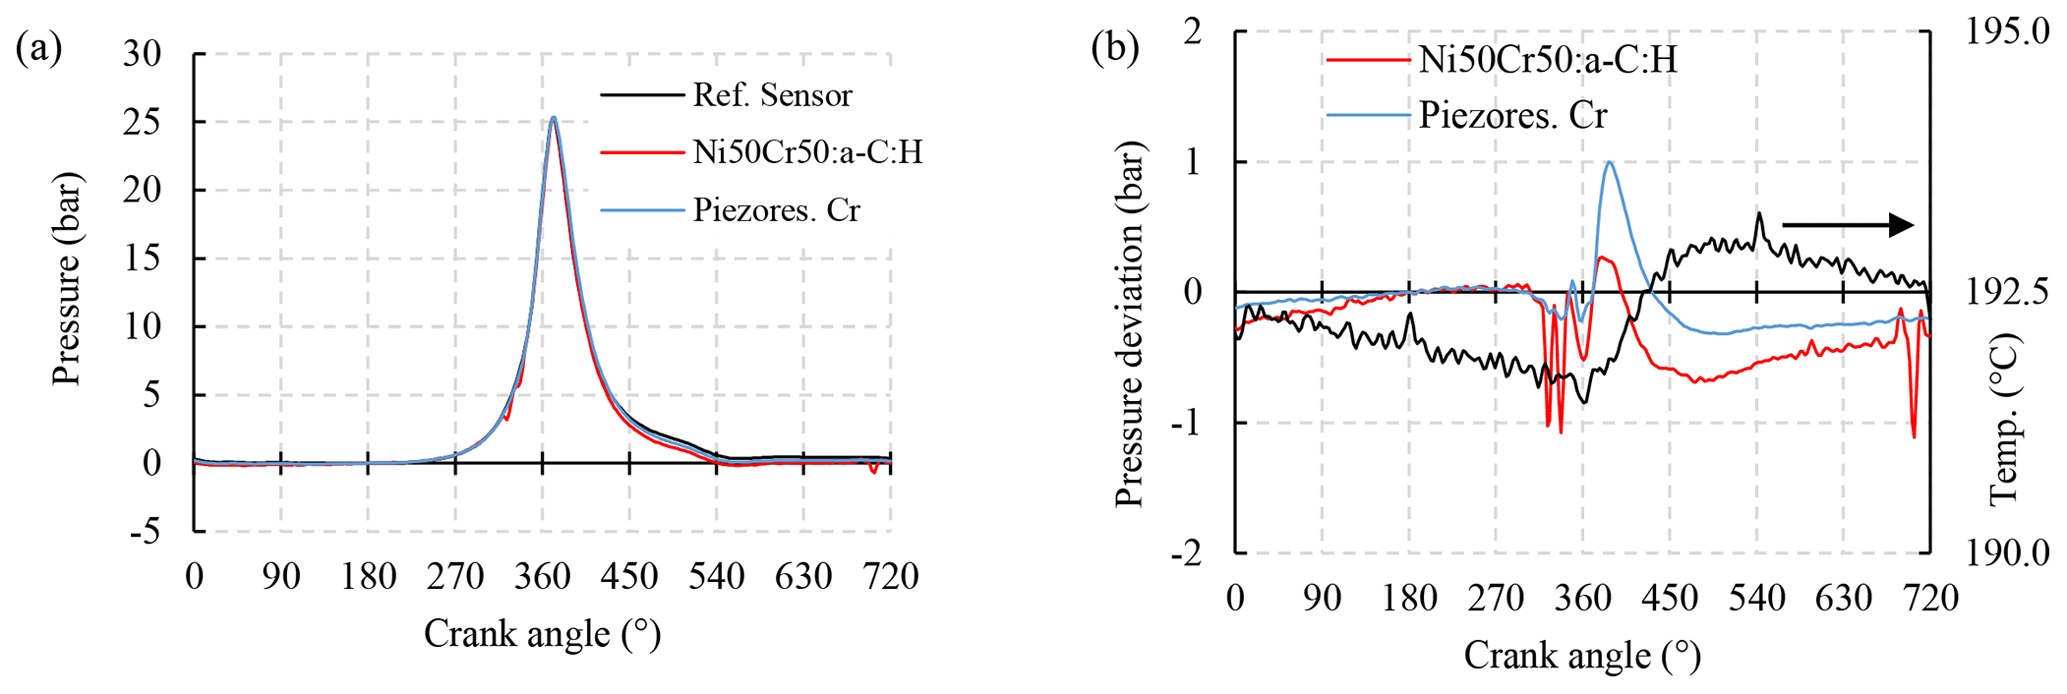
Figure 10(a) Characteristic pressure curves of two different prototype sensors and the Kistler reference sensor at 2000 rpm. (b) Inner cyclical pressure deviations of the prototype sensors compared to the reference sensor. The temperature on the membrane measured by means of RTemp is plotted as well (black curve with the ordinate on the right-hand side).
After the static characterization, the smart pressure sensors were tested under typical and practical conditions on the motor test benches described in Sect. 3.2. As mentioned above, a Kistler pressure sensor serves as a reference for all pressure curves generated by post-processing of the measured raw data. The result of one typical combustion cycle plotted in Fig. 10a shows a nearly perfect matching of all three sensor signals. The significant pressure peak occurs between 270 and 540∘ crankshaft angle and has a time duration of about 15 ms at a motor speed of 2000 rpm. The pressure deviations of the prototype sensors compared to the reference sensor are below ±1 bar (Fig. 10b). Also plotted in Fig. 10b is the temperature curve measured on the membrane during the combustion cycle (see RTemp in Fig. 2b). The largest signal deviations occur at crankshaft angles between 400 and 500∘, corresponding to the maximum temperature deviation (temperature gradient) on the membrane. These thermal shock signal deviations occur due to a spatially inhomogeneous temperature on the membrane. The higher the spread of the TCR values, the higher the signal deviations due to the thermal shock. Consequently, carefully performed and reproducible thin film processes can minimize the deviations. We state that both sensor materials are appropriate for high dynamic pressure measurements in combustion engine applications. As a consequence of the lower sensitivity of Ni50Cr50:a-C:H and the higher gain to calculate the pressure value, distortions like the ignition of the spark plug influence the pressure signal (see deviation peaks of the red line in Fig. 10b at a crankshaft angle of around 330 and 700∘). Taking into account the higher sensitivity and the higher signal-to-noise ratio of the piezoresistive chromium, the results imply a preference for this material. Thus, the required signal processing of the successive electronic is simplified, thereby reducing the potential influence of unwanted noise and other disturbing signals.
4.2 Verification of closed-loop control
4.2.1 Reduction of combustion process fluctuations
The combustion process of a gasoline engine is subject to fluctuations based on many factors. Besides ignition time variations, mixing as well as tumble and swirl flow have to be mentioned here. The result is a combustion process with random deviations of the MFB50 values, shown in the left part of Fig. 11 with a feed-forward controlled fixed ignition angle of 27∘ before the top dead centre (BTDC). For the first 32 s of the diagram the controller was deactivated, and hence the averaged MFB50 signal fluctuates by more than 15∘ crankshaft angle. In the next time section of the diagram, the closed-loop control is activated, leading to a significant reduction of the MFB50 fluctuations. The resulting controlled ignition angle of the controller is depicted in the upper curve (blue) in the unit of the crankshaft angle (CA).
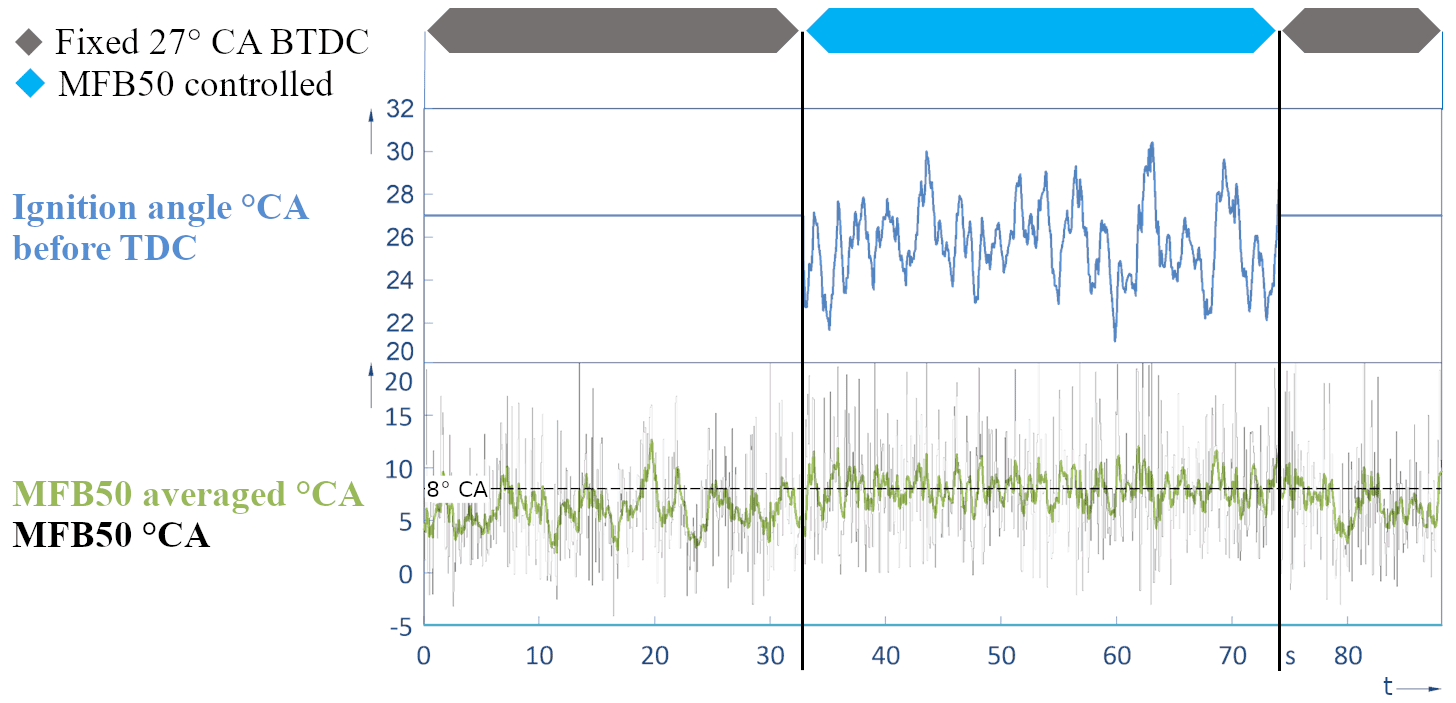
Figure 11Combustion fluctuation without control (first 32 s) and with the working MFB50 control algorithm, based on the smart pressure sensor.
4.2.2 Correction of ignition setting deviations
Various manufacturing tolerances as well as ageing and abrasion effects of the engine can influence the combustion characteristics. Hence, the implemented maps and look-up tables for initial engine control may no longer be optimal and will need adaption to the changed condition. To emulate such influences, the system has been forced to execute ignitions either too early or delayed, as shown in Fig. 12. With these pre-settings the control loop was activated during ongoing operation to verify the control precision. The MFB50 controller generates a control reaction as soon as it has been activated, as demonstrated within Fig. 12. According to the required difference, a control signal is generated and brings the MFB50 value almost immediately back to the optimum of 8∘ crankshaft angle. Thus the expected controller functionality has been tested and verified.
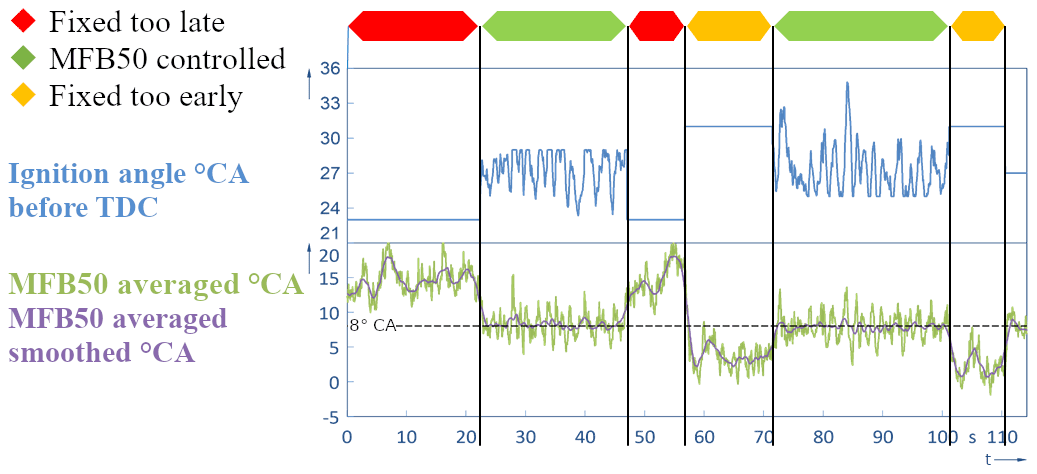
Figure 12Correction of either delayed or too early ignition. When the controller is activated, a controlled ignition signal is generated, correcting the MFB50 value (green) back to its optimum.
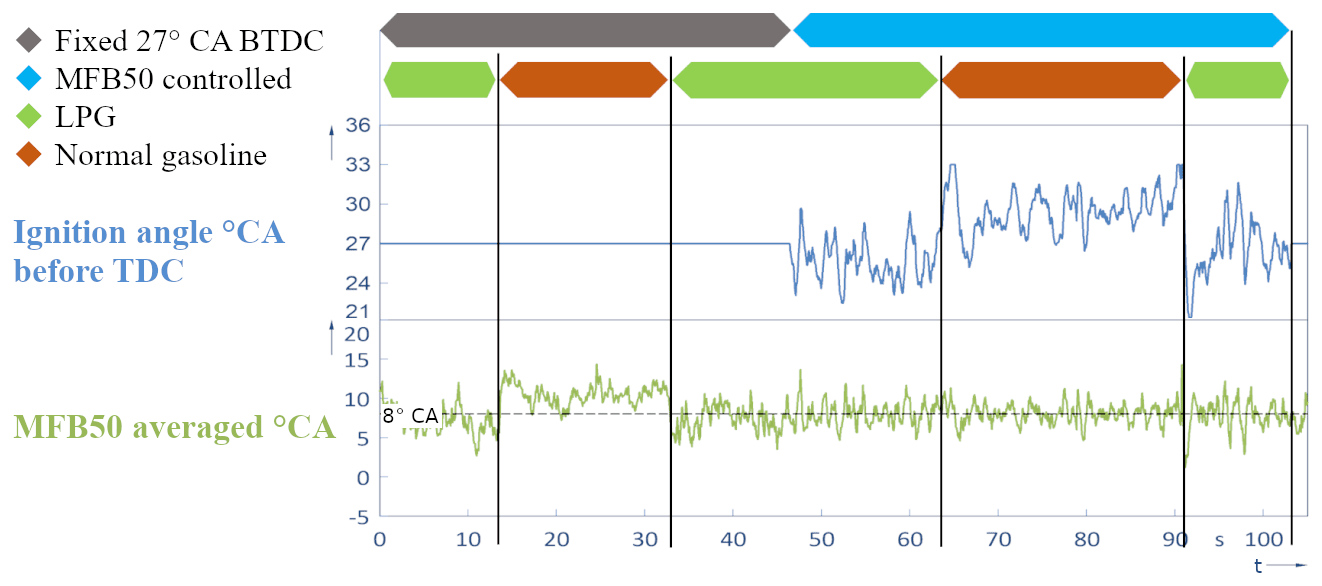
4.2.3 Reaction on different fuels
Another run was performed to test the response of the smart controller to different fuel grades. This is done by switching between fast-burning liquefied petroleum gas (LPG) and slow-burning normal gasoline (Krieck et al., 2016). As shown in Fig. 13, the switching from LPG to gasoline with a deactivated controller results in a delay of about 3∘ of the MFB50. With the action of the activated MFB50 controller and an almost instantaneous reaction of the MFB50 closed-loop control, the MFB50 is kept stable to its optimal value of 8∘. Once again the controller behaviour meets the expectation.
4.3 Integrated knock detection
The smart sensor algorithm is able to extract a robust and valuable parameter representing the number and intensity of pressure pulsations of the combustion process in every cycle. A knocking integral algorithm (KI) was implemented and shown to be very sensitive and selective in detecting knocking (Ohler, 2014). This is demonstrated in Fig. 14, where the engine is operated to develop an increasing knocking intensity. The original pressure signals are plotted with a smoothed signal, together with the calculated knocking integral during the cycles. The KI value represents the cumulated magnitude of the deviation between the different pressure curves. Only the integration value at the end of the integration window is transferred as a knocking intensity signal to the control unit via a CAN bus. In Fig. 14, the KI and ΔKI values are given at the top of the diagram. ΔKI corresponds to the KI difference of KI with knocking minus KI without knocking. A comparison of the knocking intensity shows especially the high sensitivity of the KI value even in case of small knocking intensity in the beginning phase (Fig. 14b). The four diagrams of Fig. 14 show the high potential of the smart combustion sensor to additionally detect knocking and thereby the potential to replace extra sensors.
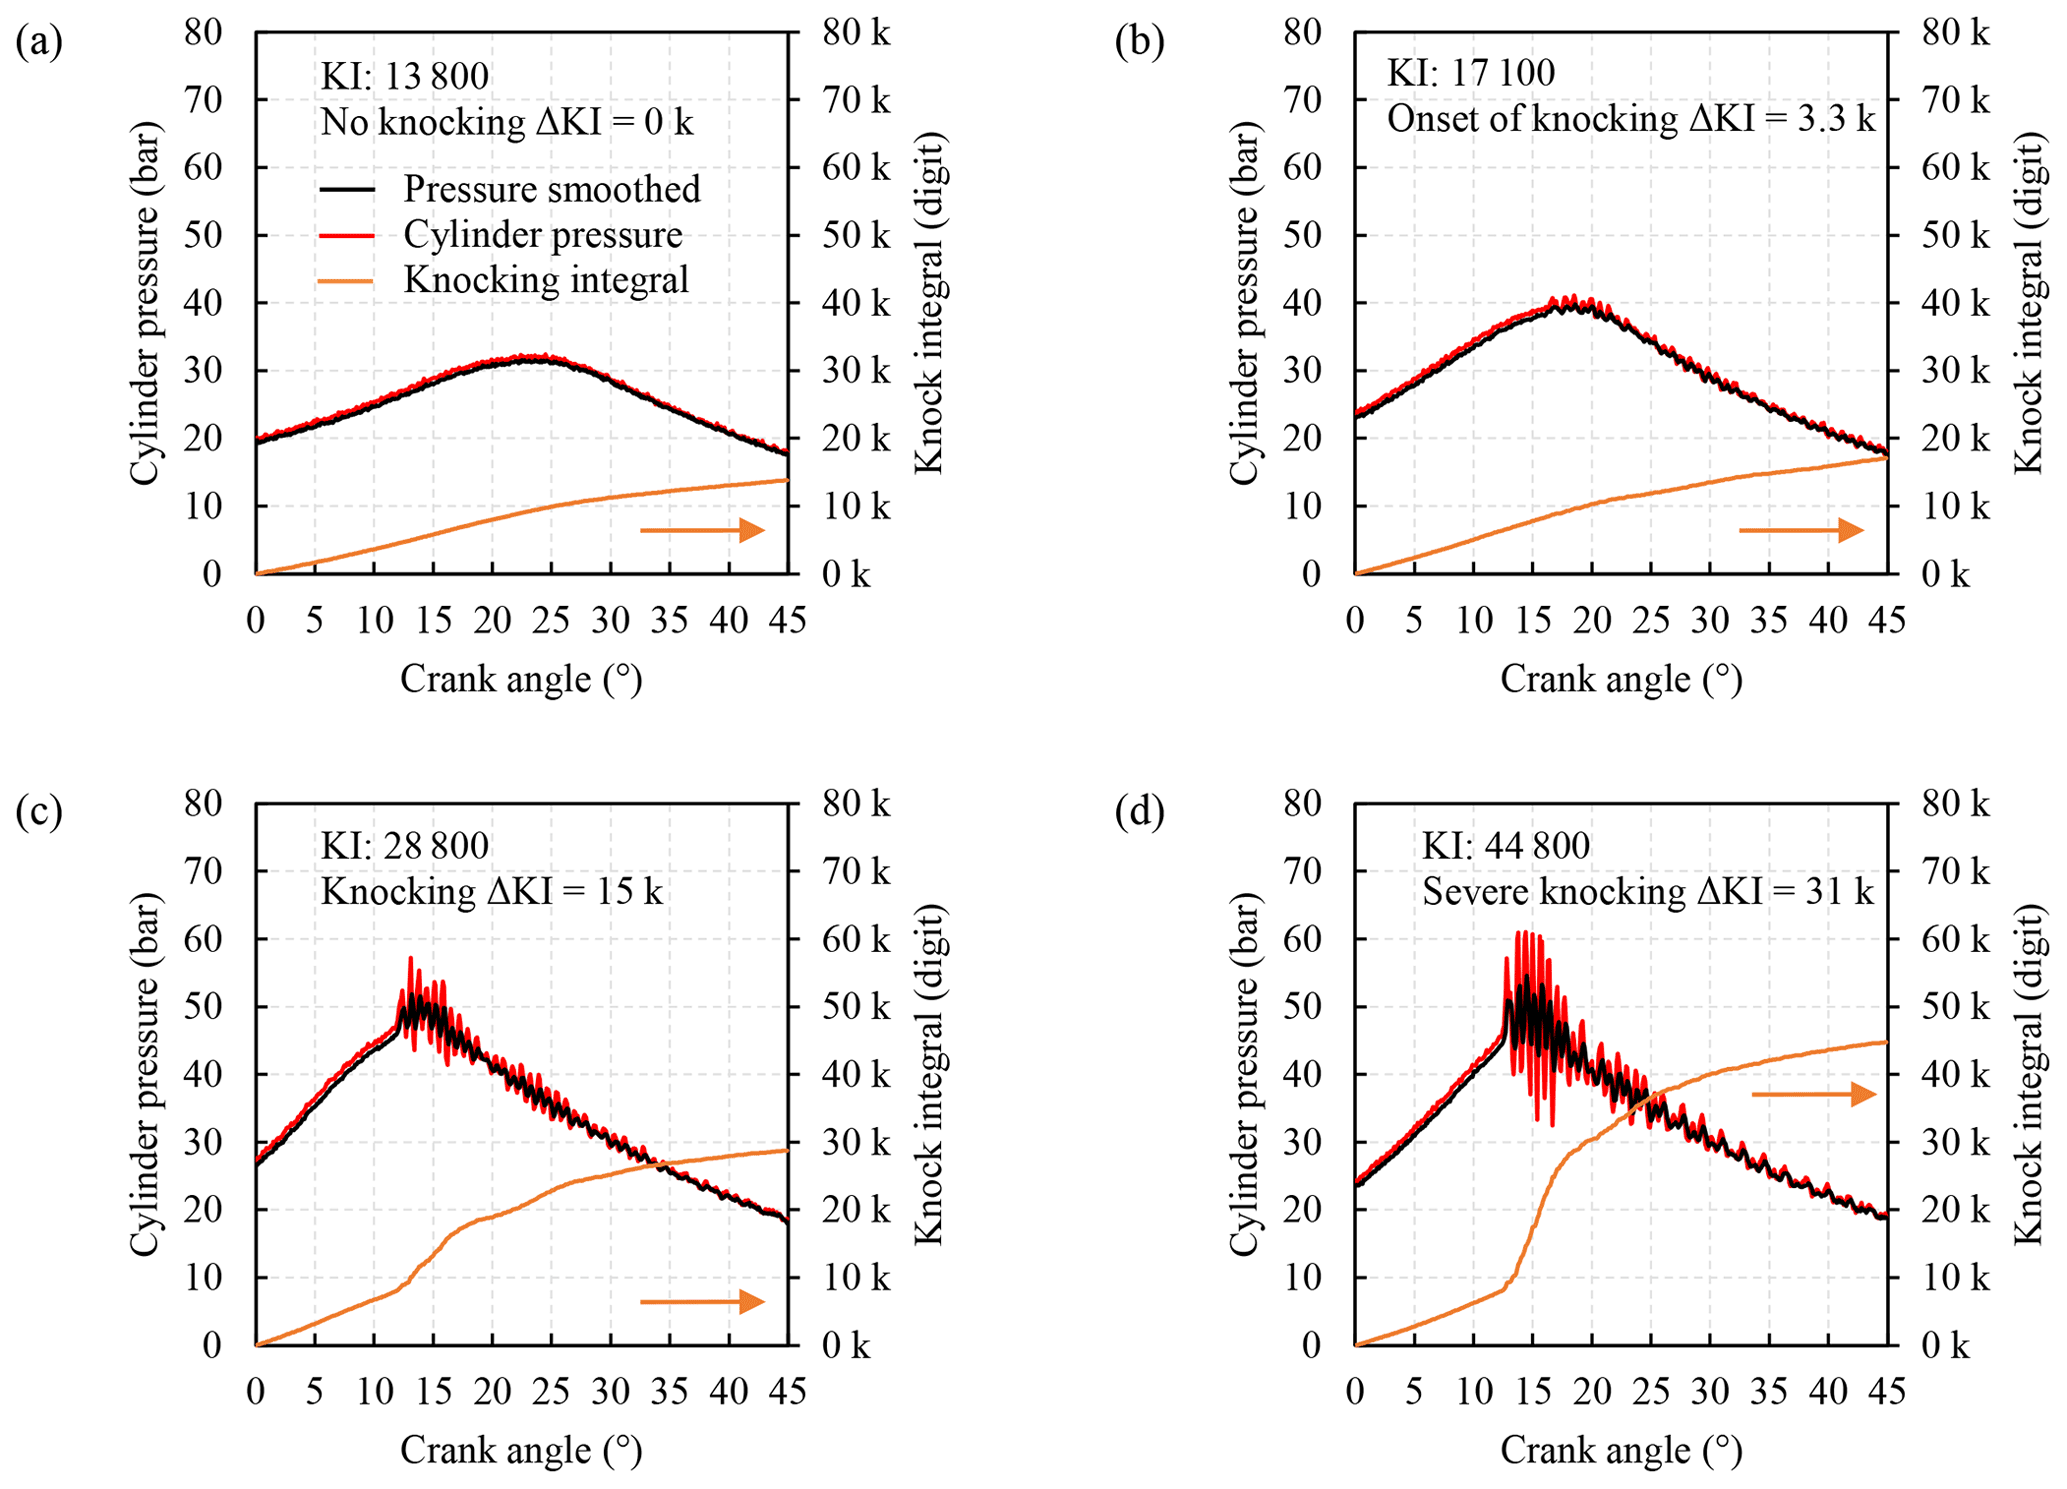
Figure 14Four combustion cycles with different intensities of knocking. The KI value is calculated and plotted (ordinate on the right).
The final state of our smart combustion pressure sensor concept represents a promising solution for an intelligent combustion motor control. The application of a well-established steel membrane in combination with highly strain-sensitive and temperature-stable thin films in combination with a cost-effective mixed-signal electronics yields the best results. Due to the high thermal conductivity of steel and a good thermal coupling to cooled engine parts, the sensor signal error caused by thermal shocks is effectively reduced down to ±1 bar within one combustion cycle. The high sensitivity of approximately 20 mV V−1 leads to very detailed pressure curves, allowing the electronics to operate with minimum signal gain. Hence, the signal noise is decreased, and no extensive signal filtering is required. The sensor-integrated electronics uses an ADC with 12-bit resolution able to digitize the measured signal with a high sampling rate enabling the system for high dynamic signal measurements.
A closed-loop combustion control was realized by implementing the thermodynamic equations directly in the sensor electronics, delivering only the important combustion parameters to an openly programmed ECU. This enables the control of the MFB50 in order to effectively reduce combustion fluctuations. The realized closed-loop control is able to readjust and control the proper combustion by means of the MFB50 parameter in case the ignition was intentionally misaligned too late or too early. The same holds if differently combustible fuels are used. These features would allow us to control the engine at its optimal operating point even if mechanical tolerances and ageing effects are considered. This is beyond the possibility of today's ECUs, controlling the engine by means of stored look-up tables for different situations. In addition, the computing capabilities of the ECU are preserved by outsourcing the calculation to the sensor electronics. A further conceivable scenario is the application of the sensor for machine learning by real-time measuring and controlling of the MFB50 under certain combustion engine conditions on the track. No extensive verifications would be required on test benches to evaluate different operating points for various engine types.
The benefit of our smart combustion sensor system is further increased by extracting more information on the combustion process, i.e. the detection of knocking. Therefore, a knock integral was implemented to reliably determine knocking if the combustion engine is driven beyond its common operating conditions. The evaluated calculation generates a very sensitive value that allows us to recognize knocking at an early stage. This feature would allow us to substitute knock sensors that are commonly applied on engines. Furthermore, a failure detection which observes the correct function of the sensor in series applications can be easily implemented in the firmware of our electronics. In summary, we developed a smart sensor system which reliably measures the pressure inside the combustion engine, calculates different combustion parameters, and works in a closed-loop combustion control.
The underlying measurement data are not publicly available and can be requested from the authors if required.
DV was mainly involved in development of the pressure sensor and the experimental verification of the measuring principle and the packaging and housing technology. He performed the tests and analysed the measurements. PG designed and realized the smart electronics and developed the algorithms. He conducted the experiments on the engine test benches and implemented the software. GS and HWG supported the research and experimental work with helpful discussions. TH provided the engine test benches and automotive measurement equipment. All the authors helped in preparing the manuscript and contributed to the discussions.
The contact author has declared that neither they nor their co-authors have any competing interests.
Publisher's note: Copernicus Publications remains neutral with regard to jurisdictional claims in published maps and institutional affiliations.
The authors kindly appreciate the support of all members in the smart combustion project conducted at the htw saar – University of Applied Sciences. The additional assistance from Michael Fries and Peter Birtel of the automotive powertrain team is gratefully noted.
The Federal Ministry of Education and Research of Germany (BMBF) funded the work under the program FHprofUnt2015 (grant no. 13FH010PX5).
This paper was edited by Bernhard Jakoby and reviewed by two anonymous referees.
AVL: User's Guide: Parametrierung AVL IndiCom, AVL List GmbH, 2013.
Borgers, M. G. J., Groenhuijzen, S., Zwollo, C. R., and Sloetjes, J.-W.: Pressure-measuring plug for a combustion engine, US patent, US8429956B2, 2013.
Carlucci, A. P., Laforgia, D., Motz, S., Saracino, R., and Wenzel, S. P.: Advanced closed loop combustion control of a LTC diesel engine based on in-cylinder pressure signals, Energ. Convers. Manage., 77, 193–207, https://doi.org/10.1016/j.enconman.2013.08.054, 2014.
Eicheldinger, S., Wachtmeister, G., Nguyen, H. D., and Dinkelacker, F.: Entwicklung von Brennverfahren für Gasmotoren mit extremen Mitteldrücken über 30 bar, MTZ Motortechnische Zeitschrift, 80, 102–108, 2019.
Guido, C., Beatrice, C., and Napolitano, P.: Application of bioethanol/RME/diesel blend in a Euro5 automotive diesel engine: Potentiality of closed loop combustion control technology, Appl. Energ., 102, 13–23, https://doi.org/10.1016/j.apenergy.2012.08.051, 2013.
Hellemans, A., Landrevie, L., Venzal, S., and Walker, E.: Direkte Zylinderdruckmessung, MTZ Motortechnische Zeitschrift, 72, 770–776, https://doi.org/10.1365/s35146-011-0172-6, 2011.
Krieck, M., Günther, M., Pischinger, S., Kramer, U., Heinze, T., and Thewes, M.: Future Specification of Automotive LPG Fuels for Modern Turbocharged DI SI Engines with Today's High Pressure Fuel Pumps, SAE 2016 International Powertrains, Fuels & Lubricants Meeting, SAE 2016-01-2255, ISSN 1946-3952, 2016.
Lehrheuer, B., Wick, M., Lakemeier, J., and Andert, J.: Potenziale für neue Brennverfahrenskonzepte durch In-Zyklus-Regelung, MTZ Motortechnische Zeitschrift, 76, 62–67, 2015.
Ohler, S.: Entwicklung und Vergleich von Kriterien zur Erkennung der klopfenden Verbrennung in Ottomotoren, dissertation, Helmut-Schmidt-Universität/Universität der Bundeswehr, Hamburg, 2014.
Schultes, G., Cerino, M., Langosch, M., Kuberczyk, T., Vollberg, D., Göttel, D., Freitag-Weber, O., and Probst, A.-C.: Drucksensoren aus Zirkonoxid-Keramik mit hochempfindlichen Sensorschichten, tm Technisches Messen, 83, 147–156, https://doi.org/10.1515/teme-2015-0096, 2015.
Schultes, G., Schmid-Engel, H., Schwebke, S., and Werner, U.: Granular metal–carbon nanocomposites as piezoresistive sensor films – Part 1: Experimental results and morphology, J. Sens. Sens. Syst., 7, 1–11, https://doi.org/10.5194/jsss-7-1-2018, 2018.
Schwebke, S.: Nanocermets und antiferromagnetisches Chrom als piezoresistive und temperaturbeständige Dünnschichten für Drucksensoren, dissertation, Johann Wolfgang Goethe Universität, Frankfurt, available at: http://d-nb.info/1228432627 (last access: October 2021), 2021.
Sellnau, M., Matekunas, F., Battiston, P., and Chang, C.: Cylinder-Pressure-Based Engine Control Using Pressure-Ratio-Management and Low-Cost Non-Intrusive Cylinder Pressure Sensors, SAE Technical Paper 2000-01-0932, https://doi.org/10.4271/2000-01-0932, 2000.
Sensata: Cylinder pressure-only sensors (CPOS), Sensor Solutions For Heavy Duty Applications, Technical brochure, Sensata Technologies, available at: https://www.sensata.com/resources/sensor-solutions-heavy-duty-applications-brochure (last access: July 2021), 36–37, 2015.
Vollberg, D., Wachter, D., Kuberczyk, T., and Schultes, G.: Cylinder pressure sensors for smart combustion control, J. Sens. Sens. Syst., 8, 75–85, https://doi.org/10.5194/jsss-8-75-2019, 2019.
Wlodarczyk, M. T.: Fiber optic-based in-cylinder pressure sensor for advanced engine control and monitoring, Combustion Engines, 51, 3–8, 2012.
Wolf, T.: Alternative ottomotorische Zündsysteme und Entflammung, dissertation, Karlsruher Institut für Technologie (KIT), available at: https://publikationen.bibliothek.kit.edu/1000096203/33867101 (last access: September 2021), 2019.
Wolgast, E. J.: Ein Beitrag zur Prozessrechnung an Verbrennungsmotoren unter Berücksichtigung der realen Gaseigenschaften, dissertation, Helmut-Schmidt-Universität/Universität der Bundeswehr, Hamburg, 2014.