the Creative Commons Attribution 4.0 License.
the Creative Commons Attribution 4.0 License.
 | 15 Jun 2022
Precise characterization of VCSEL in the 1550 nm band having a wavelength tuning range of 12 nm within 10 µs as light sources for fast sensor systems
Roman Kruglov
Gregor Saur
Rainer Engelbrecht
A wavelength tuning range up to 12 nm has been achieved over 12 µs pump current pulses within a usable time of 10 µs applied to VCSELs operating in the near infrared around 1550 nm. The instantaneous optical frequency shift has been measured with an interferometric setup; the overall tuning range has then been verified with an optical spectrum analyzer. The repetition rate of the current pulses can be as high as 20 kHz with almost no influence on the sweep parameters. These results can be used for fast spectroscopic gas analysis or for rapid interferometric swept-source distance sensors.
- Article
(2558 KB) - Full-text XML
- BibTeX
- EndNote


Vertical-cavity surface-emitting lasers (VCSELs) are reliable and practical light sources for optical communication and sensing applications because of their low power consumption, high-speed current modulation and high cost efficiency resulting from a small footprint and capability of the on-wafer-level testing and device selection (Iga, 2018). The short optical cavity of a VCSEL leads to a large longitudinal mode spacing in comparison to the in-plane laser diodes (LD), providing a mode-hopping free single-wavelength operation. A circularly symmetric beam profile with a small divergence angle allows to reduce fiber coupling losses. Multiple-wavelength VCSEL arrays are highly attractive for wavelength division multiplexing (WDM) systems providing an efficient aggregate bandwidth scalability and flexible network routing. VCSELs in the 1550 nm wavelength range are attractive because of the attenuation minimum of silica fibers there, and the availability of many fiber-optic components resulting from telecommunication applications (Müller et al., 2011). Furthermore, the ability of wide and continuous wavelength tuning makes VCSEL a strong competitor in optical coherence tomography (OCT), light detection and ranging (LIDAR), optical frequency domain reflectometry (OFDR) and spectroscopic applications (Hodgkinson and Tatam, 2012; Chinn et al., 1997). For example, a tunable diode laser spectroscopy (TDLAS) requires monochromatic light sources with a large wavelength tuning range λ(t) to enable multi-species measurements, as sketched in Fig. 1a. For interferometric methods like OCT and OFDR using a swept source approach, the distance resolution or range precision are both indirectly proportional to the optical frequency sweeping range ν(t), enabling more interference fringes to be evaluated as sketched in Fig. 1b. VCSEL employed potentially for these applications should provide a transversally and longitudinally single mode operation with a mode-hop free wavelength sweep. Furthermore, the polarization of the emission light has to be stable in order to avoid the possible reduction of the coherence. Coherently coupled VCSEL arrays might be an option (Choquette et al., 2019), but are beyond the scope of this work.

Figure 1Sketch of wavelength (red) and optical frequency (blue) tunable sources for applications in (a) spectroscopy and (b) for optical frequency domain reflectometry. The green lines show symbolic measurement results of the optical power during the sweep (a) for gas absorption and (b) for the output of an interferometer.

The wavelength tuning of VCSEL can be realized in different ways. Integration of micro-electromechanical system (MEMS) into VCSEL allows the optical cavity length to be controlled. Cantilever tuning structures (Chang-Hasnain, 2000) or deformable membrane mirrors being moved electrostatically provide wavelength tuning over several tens of nanometers (Gierl et al., 2011). But the simplest method relates to the temperature variation of the cavity – and thus change of the refractive index. Three-contact VCSEL employing Peltier effect to tune the wavelength within the range of ±0.6 nm was reported in Berger et al. (1991). A continuous red shift of 2.2 nm was also demonstrated in Wipiejewski et al. (1993) by applying a tuning-current to the highly resistive top reflector resulting in heating of the optical cavity. A continuous tuning range of 10.1 nm was achieved with a monolithically integrated thin-film metal heater (Fan et al., 1994). The pump current itself results not only in the output power variation, but also in the resistive heating of the laser diode providing a wavelength shift of several nanometers (Caliman et al., 2011; Lackner et al., 2003). The small volume of the VCSEL can be a beneficial feature in this case allowing a rapid wavelength tuning.
Compared to the cited literature, this work focuses on an intermediate range of wavelength tuning (∼10 nm), tuning speed (∼10 µs) and repetition rate (50 Hz to 50 kHz) of commercially available VCSEL in the 1550 nm range by a simple pulse modulation of the pump current, without deliberate control of the temporal current pulse shape. This parameter range is attractive for many applications like monitoring of vibrating machines and dynamic combustion analysis. In Totschnig et al. (2003) a similar VCSEL operating at 1540 nm has been employed for ammonia (NH3) measurements. The laser injection current has been modulated with a triangular ramp, which gives an almost linear wavelength sweep when the modulation pulse or sweep duration is in the milliseconds range. Compared to the paper above, this work discusses a laser diode modulation controlled by rectangular pulses with a duration in microseconds range and a current amplitude exceeding the maximum continuous wave (CW) permissible operating current. With the precise measurement of the optical wavelength sweep over time by a fiber optic Mach–Zehnder interferometer (MZI), the data captured by the sensor can be properly remapped to a linear frequency scale.
Table 1Key parameters of the VCSEL at TEC temperature of 20 ∘C.


Figure 3Typical waveforms for VL-1544 captured by photodetectors PD1 (blue) and PD2 (red) and the corresponding pump current pulse (green) with a pulse width of 12 µs and a repetition rate of 50 Hz (iB=1 and iP=16 mA).
There are two VCSELs discussed in the paper which operate at 1544 and 1577 nm. The authors' interest in the given wavelengths is motivated primarily by the subsequent VCSEL applications in the further research as well as availability in the market. Within the given spectral range, a fast spectroscopic gas analysis (e.g., ammonia NH3, hydrogen cyanide HCN, hydrogen sulfide H2S, carbon monoxide CO and carbon dioxide CO2) can be realized by employing the TDLAS method. The wavelength of 1544 nm belongs to the standard telecom C-Band where a large choice of passive and active components (e.g., erbium-doped fiber amplifiers) is available at competitive prices. A further proposed application for these VCSELs is a rapid distance measurement in industrial machines by coherent optical frequency domain reflectometry (c-OFDR). For both applications, a precise characterization of the transient wavelength tuning process is required. Therefore, this paper is focused particularly on the dynamic wavelength tuning properties of the VCSELs with an injection current. The overall spectral shift and the instantaneous emission wavelength during 12 µs current pulses with variable peak current and repetition rate are analyzed. The measurements are carried out with an interferometric setup providing a precise measurement of the dynamic wavelength shift and are then verified with an optical spectrum analyzer.
2.1 Fiber-optic Mach–Zehnder interferometer
The experimental setup used for the measurements is shown schematically in Fig. 2. A fiber-optic Mach–Zehnder interferometer (MZI) is a key component of the setup. The measurement method is based on the optical interference of the signals coming through two interferometer paths with different optical lengths. Transmission of an optical pulse with a continuous frequency sweep through such an interferometer will result in an oscillating interference pattern of the light intensity (interferogram) at MZI outputs as shown in Fig. 3. The spacing between adjacent intensity peaks is determined by the free spectral range (FSR) of the interferometer and corresponds to the beat frequency introduced in Sect. 3:
where c0 is the speed of light in vacuum, ng is the group index in the optical fiber and ΔL is the path length difference proportional to the time delay τ (see Fig. 2). By known MZI imbalance an optical frequency shift can then be derived analytically from the captured interferograms as further described in Sect. 3.
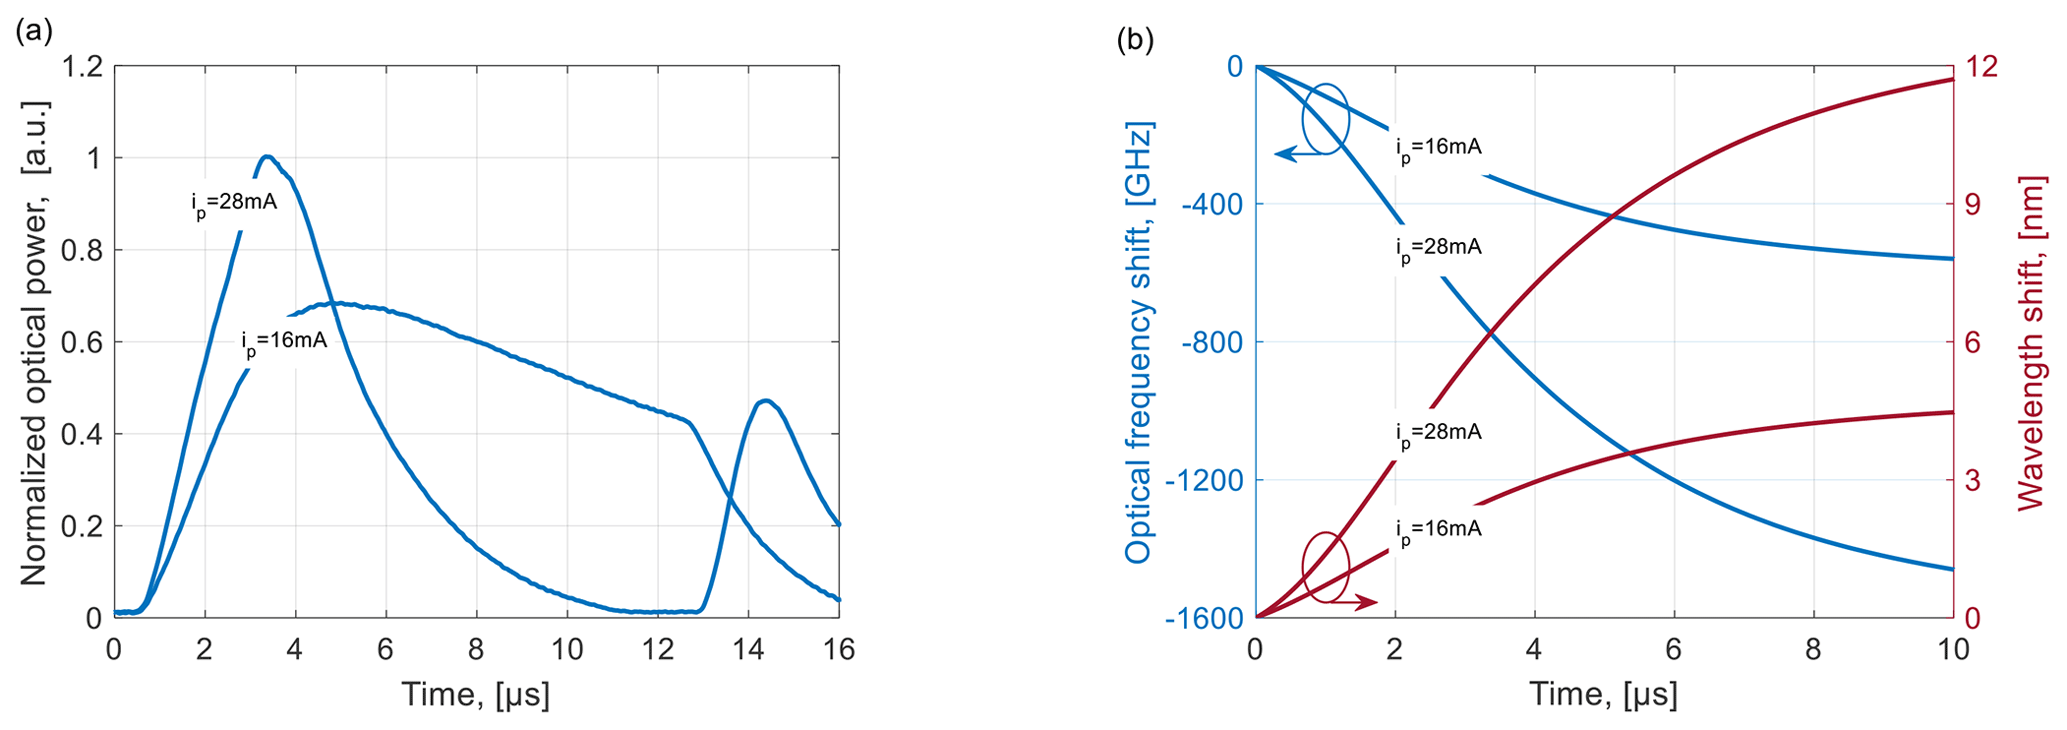
Figure 4Optical waveforms (a) for VL-1544 captured by photodetector PD3 and corresponding (b) instantaneous optical frequency and wavelength shift achieved with a pump current of iB=1, iP=16 and iP=28 mA by the pulse width of 12 µs and the repetition rate of 50 Hz.

Figure 5Optical waveforms (a) for VL-1577 captured by photodetector PD3 and corresponding (b) instantaneous optical frequency and wavelength shift achieved with a pump current of iB=1, iP=10 and iP=20 mA by the pulse width of 12 µs and the repetition rate of 50 Hz.
2.2 Vertical-cavity surface emitting lasers under test
There are two VCSELs under test produced by Vertilas GmbH VL-1544 and VL-1577, TO-46 packages with an integrated thermoelectric cooler (TEC) operating at 1544 and 1577 nm, respectively. These VCSEL are coupled to a standard single-mode fiber (SSMF) pigtail. Table 1 shows key parameters of the used VCSEL.
These VCSELs have been selected for applications in spectroscopy or swept-source interferometry as described in Sect. 1, as well as to check for potentially different tuning properties, in spite of their very similar structure.
2.3 Description of the experimental setup
A laser diode controller (LDC) Thorlabs LDC 202C injects a current into the VCSEL. It is modulated with rectangular pulses applied to the external analog modulation input of the LDC. The limited 3 dB bandwidth of the LDC results in gently rising and falling slopes of the VCSEL current as shown in Fig. 3, gradually linearizing the achieved dynamic wavelength sweep. However, no other means to linearize the wavelength sweep by shaping the pulse current have been made, for a maximum of the total tuning range. As shown in Fig. 3, the actual rise time of the pump current pulse is as high as 4.9 µs. The laser current is parameterized by the bias current iB and the pulse amplitude iP (Fig. 2). An increase of the pump current, and thus, the temperature of the active area leads to a shift of the peak material gain wavelength owing to a bandgap shrinkage (Michalzik, 2013). However, the overall red-shift of the spectral envelop is caused mainly by the change of the refractive index determining the cavity resonance by the temperature and the charge carrier density (Michalzik, 2013). In a pulsed-mode operation with a low duty-cycle in the range below 10 %, the peak current can exceed moderately the specified maximum continuous wave (CW) current by a factor of 2 without thermal damage.
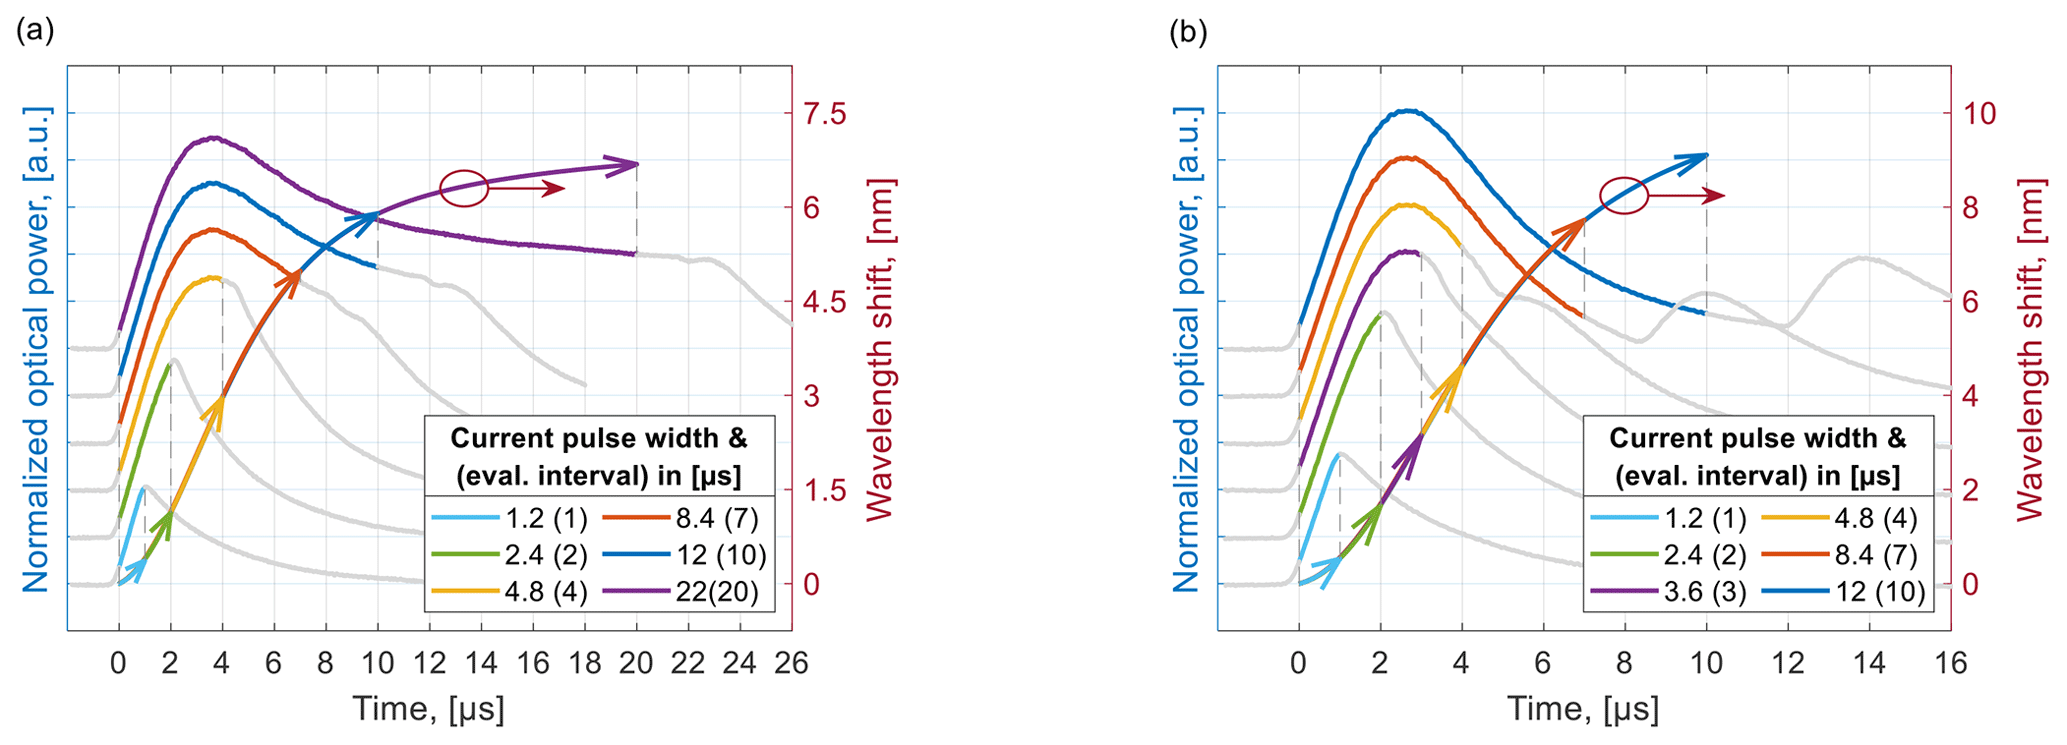
Figure 6Optical waveforms for VL-1577 and corresponding wavelength shift as a function of the pump pulse width at the repetition rate of 50 Hz for the pump pulse (a) iB=1, iP=14 mA and (b) iB=1, iP=18 mA.
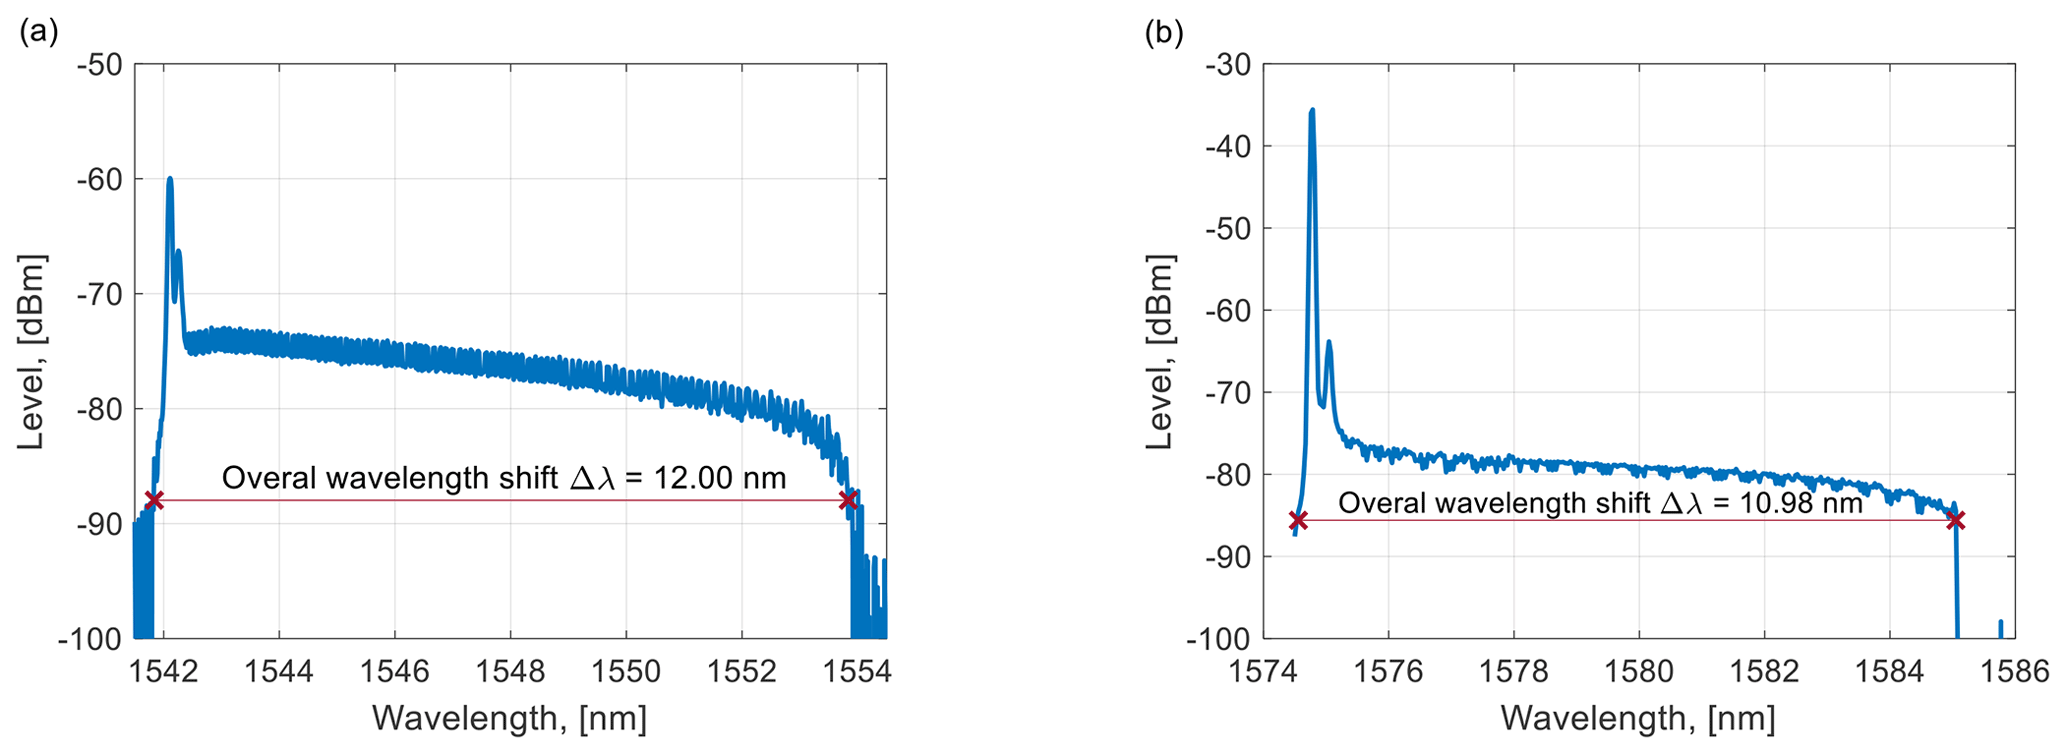
Figure 7Emission spectrum of the swept VCSEL measured with an OSA for (a) VL-1544 by a pump current of iB=1 and iP=28 mA and (b) VL-1577 by a pump current of iB=1 and iP=20 mA at the repetition rate of 50 Hz and pulse width of 12 µs.
The temperature controller was set to a thermistor resistance of Rth=12 kΩ serving as temperature sensor of the VCSEL mount, which corresponds to a temperature of 21 ∘C. This provides a stable center wavelength independent of the ambient temperature. Of course, the temperature of the active region and the Bragg mirror stack of the VCSEL will rise during a current pulse above this set point because of the thermal resistance of the VCSEL structure from the heat source, mainly in the pn-junction, and the temperature-stabilized mount. The thermal heat capacity gives rise to a thermal inertia similar to a first or second order low-pass in the temporal transfer function from the current pulse to the actual temperature and thus, wavelength. A fiber optic isolator prevents the reflection of optical power back into the VCSEL to stabilize single-mode operation, to accommodate mode-hop free tuning and to avoid excessive intensity noise. The optical signal passes through a fiber-optic Mach–Zehnder interferometer (MZI) with an imbalance τ of 1.049 ns. This time delay has been precisely determined from the separately measured frequency response of the MZI for the transmission of light with an intensity modulation at radio frequencies (RF) (Newton and Cross, 1983). The RF frequency difference between observed adjacent notches of this RF transfer function is equal to the free-spectral range of the MZI given by Eq. (1), and allows calculation of τ.
The oscillating optical signals (interferograms) during a current pulse are captured at the two MZI outputs (see Fig. 2) with Thorlabs photodetectors DET08CFC (PD1, PD2) and Keysight oscilloscope MSOX3104T (DAQ). Typically for an MZI, the two detected output voltages u1(t) and u2(t) are complementary as depicted by the blue and red traces in the inset of Fig. 2. The instantaneous frequency shift υ(t) is then calculated using the Hilbert Transformation Compensation Method (HTCM) described in Ahn et al. (2005) as shown in Sect. 3. The overall spectral shift Δλ corresponds to the difference between the end and start value of the instantaneous wavelength. These results have been verified by measuring the emission spectrum of the swept VCSEL with an optical spectrum analyzer Yokogawa AQ6370D (OSA) as well.
Finally, a photodetector PD3 has been employed to monitor an optical pulse shape and output power limitation caused by thermal rollover.
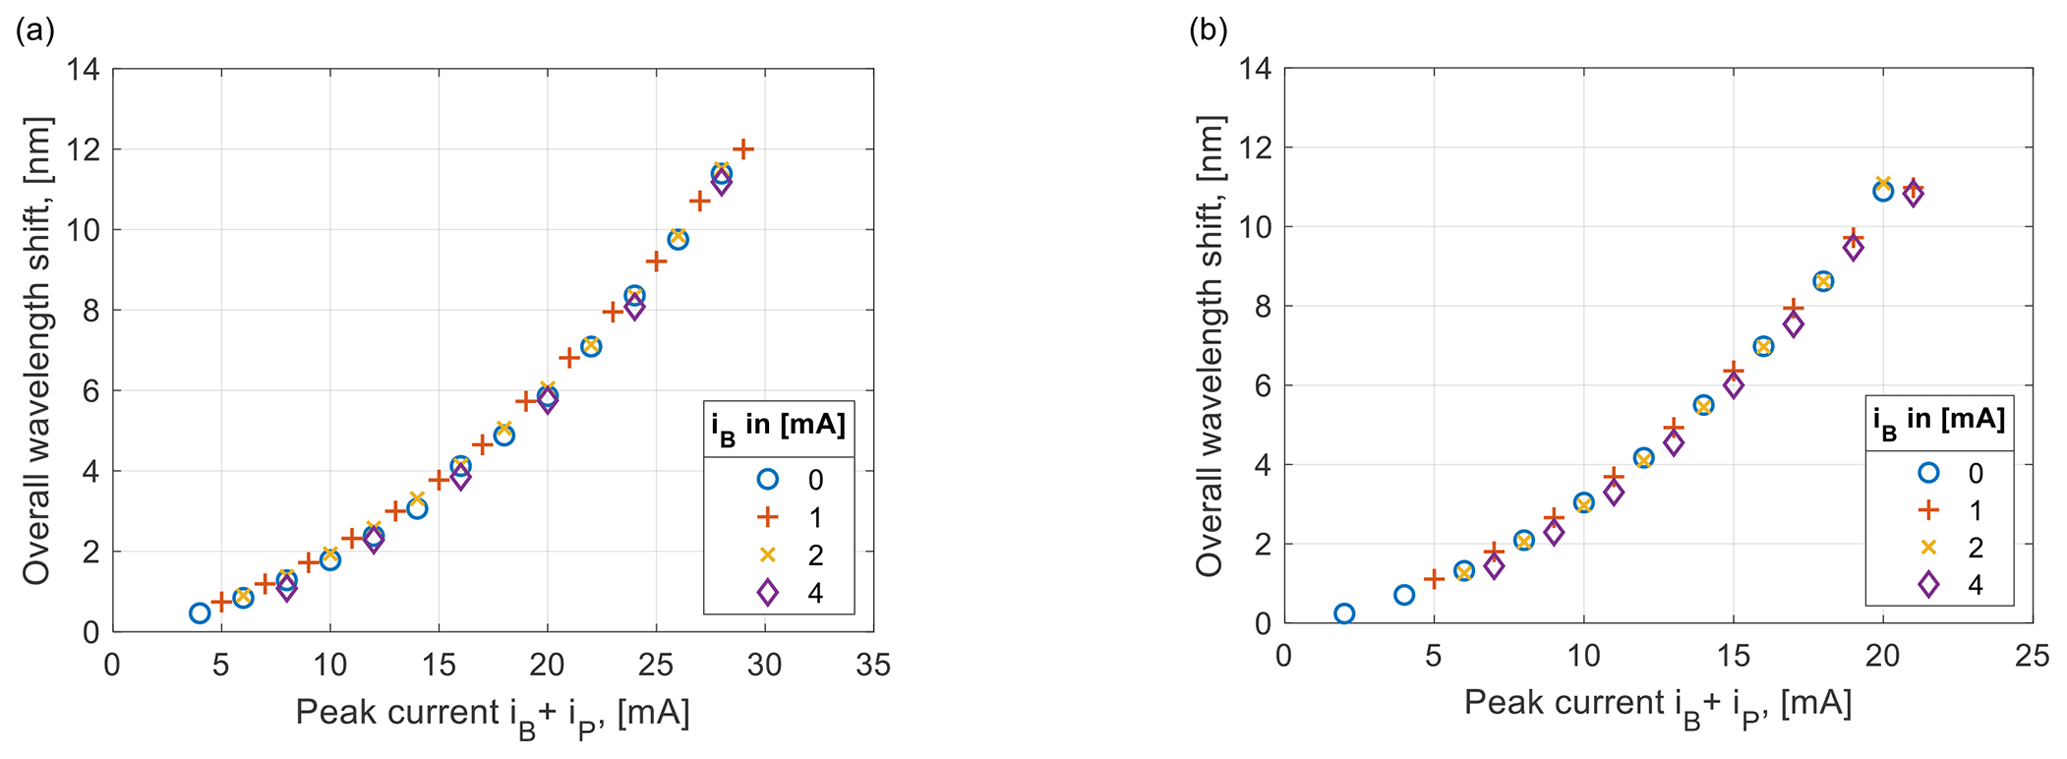
Figure 8Overall spectral shift within 12 µs pulse for (a) VCSEL VL-1544 and (b) VL-1577 as a function of the peak current.
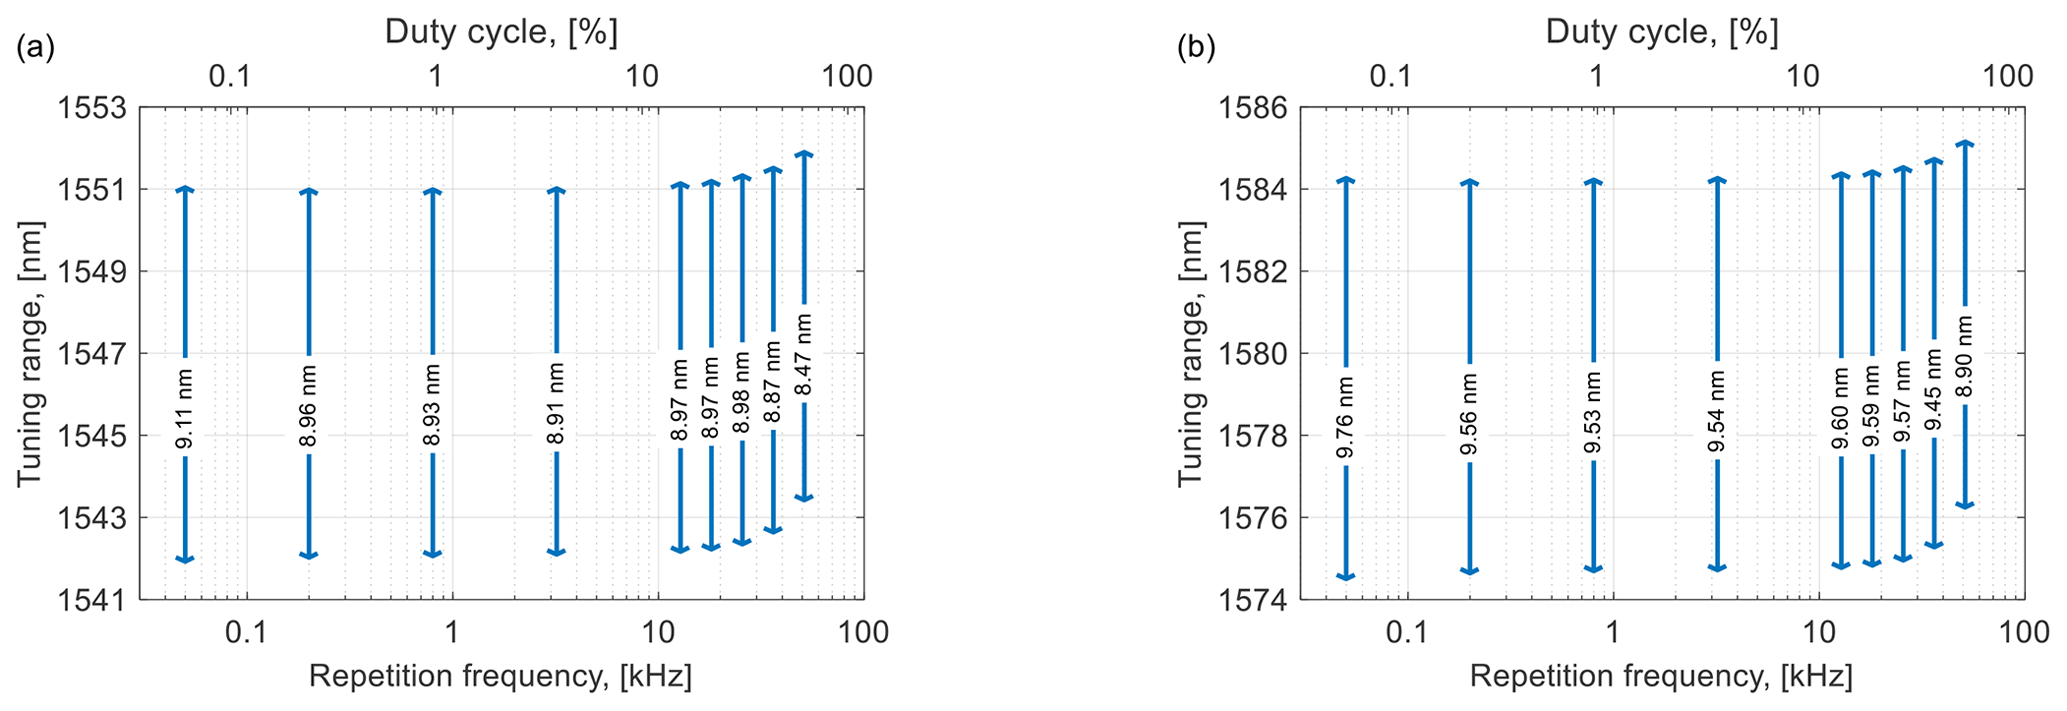
Figure 9Tuning range within 12 µs pulse for (a) VCSEL VL-1544 (iB=1, iP=24 mA) and (b) VL-1577 (iB=1, iP=18 mA) as a function of the pulse repetition frequency.
Figure 3 shows an example waveform detected at the two MZI outputs. The captured interferograms are processed with MATLAB® by a Hilbert Transformation Compensation Method (HTCM) described in Ahn et al. (2005). The output signals of the MZI u1(t) and u2(t) have to be normalized at first to get an offset-free signal with a nearly constant amplitude:
This signal over time is called the beat signal or simply, the normalized interferogram, of the swept light source. As described by Eq. (1), the maxima of this interferogram are separated by an optical frequency difference equal to the free spectral range of the MZI. At the same time, the idealized beat signal y(t) at the output of an interferometer with a light source having a time-varying optical frequency Δν(t) is defined as (Ahn et al., 2005):
where y0 is the voltage amplitude of the beating signal. The phase ξ0 results from the initial optical frequency ν0 of the light source at the start of the pulse. This absolute optical frequency cannot be determined by the interferometric measurement because of the 2π phase ambiguity. ξ0 is treated as an offset and only time-varying optical frequency shifts Δν(t) starting from zero are derived from the measurement. τ is the group delay determined by the path-length difference of the MZI. The phase Φ(t) of the beating signal y(t) can now be determined by (Ahn et al., 2005):
where H{y(t)} is the Hilbert transform of the real-valued waveform y(t), reconstructing the imaginary part of a complex-valued analytical signal not available directly from our interferometer. For a harmonic oscillation this results in a signal shifted by . The two-argument inverse tangent function atan2 has values in the range of 0 to 2π. An unwrapping function within MATLAB is used to deliver a continuous phase function Φu(t) without periodic phase jumps of 2π. The optical frequency shift Δν(t) can finally be obtained as:
The corresponding shift of the optical wavelength is calculated by
where λ0 is the initial wavelength, and c0 is the speed of light in vacuum.
Following the Eqs. (1)–(6) the instantaneous optical frequency and wavelength shifts have been measured over current pulses with a pulse width of 12 µs and with a repetition rate of 50 Hz. As can be seen in Fig. 3, the actually evaluated time interval of 10 µs is lower than the current pulse time due to the lower fringe visibility of the interferograms, particularly at the pulse beginning. The fringe visibility υ is defined as:
where Imin and Imax are minimum and maximum intensities of the oscillations.
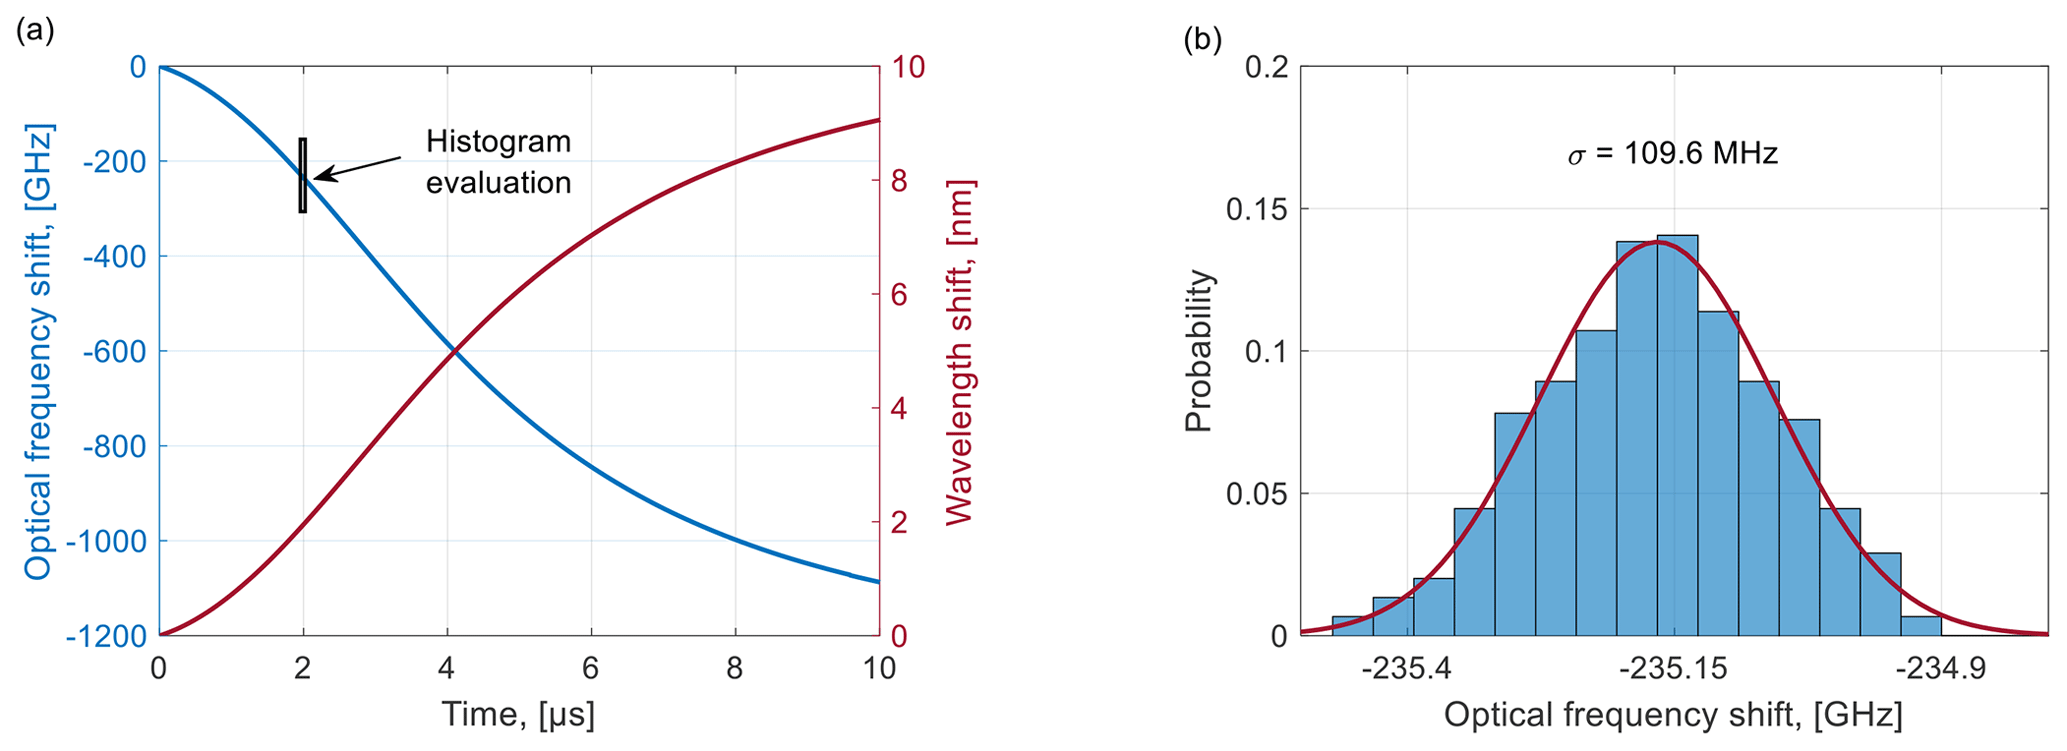
Figure 10(a) Overlapping of instantaneous optical frequency shifts over 450 consecutive pulses for VCSEL VL-1577 by the pump current pulse width of 12 µs and the repetition rate of 50 Hz (iB=1, iP=18 mA) and (b) histogram evaluated at a time of 2 µs and fitted with a normal distribution.
Furthermore, if a high peak current is applied, a thermal power rollover of the VCSEL at the pulse end becomes highly significant. Figures 4a and b show an example of the emitted optical pulse shapes, the corresponding optical frequency shift, and the wavelength shifts for VL-1544. The wavelength shift over time is non-linear. An ideal rectangular current pulse would result in the exponential increase of the instantaneous wavelength (Passy et al., 1994), with a time constant defined by the thermal properties of the VCSEL chip. In our setup, a gentle rise of the laser diode current, as shown in Fig. 3, caused by the bandwidth limitation of LDC is advantageous to avoid a too fast wavelength sweep at the beginning of the pulse, potentially unusable for a measurement or sensing. With the precise measurement of the sweep over time by the MZI, the data captured by the sensor can then be remapped from a time series to a precise linear frequency series. No mode hops have been observed in the interferogram, which is important for spectroscopy and OFDR or OCT applications.
As can be seen in Fig. 4b, by a pump pulse with a bias current iB=1 mA and an amplitude iP=16 mA corresponding to the maximum CW operating current shown in Table 1, the optical frequency sweep becomes stationary after 8 µs. Further increase of the pulse width does not extend an overall spectral shift. At the same time, by a current amplitude of 28 mA the VCSEL suffers noticeably from a characteristic rollover due to excessive internal heating. The increase of the pulse amplitude, as well as the pulse width, in this case may lead to a thermal damage of the VCSEL.
Figures 5a and b show an example of the emitted waveforms, the optical frequency and the wavelength shifts for VL-1577 respectively. VL-1577 demonstrates a similar behavior with respect to the pump current. As expected form the similar structures of these VCSELs, very similar dynamic properties are observed for these two VCSEL under test.
The wavelength shift as a function of the pump pulse width is shown in Fig. 6. An increase of the pulse width leads to the sequential extension of the wavelength sweep. By iP=14 mA (Fig. 6a) which slightly exceeds the recommended CW operating current (see Table 1), a pulse width can further be increased beyond 12 µs. However, the double of the evaluated interval (from 10 to 20 µs) results in approx. 12 % increase of the overall wavelength sweep only. By the pulse amplitude exceeding significantly the recommended value (Fig. 6b) a pulse duration over 12 µs may damage the VCSEL due to excessive internal heating.
The emission spectra of the swept VCSELs measured with an OSA allows verification of the results obtained with an interferometric setup. It should be noted, however, that these measurements relate to the total pulse duration of 12 µs and give, therefore, a slightly broader spectral shift (2 %–4 % typically) than the interferometric approach. Figure 7 shows spectra of the swept VCSELs captured with an OSA under the same measurement conditions as in Figs. 4, 5.
The ripple artifacts of the plots relate to spectral resolution and sweep time settings of an OSA. The height of the start wavelength peak relative to the sweep plateau depends on a duty cycle of the pump current pulses. A poor side mode suppression ratio (SMSR) in Fig. 7a is explained by the low bias current iB close to the lasing threshold.
The overall wavelength shift as a function of the peak pump current (iB+iP) is shown in Fig. 8.
The overall spectral shift depends on the peak modulation current determined as a sum of the bias and pulse amplitude. It means that a variation of the bias close to the laser threshold (approximately 1 mA) does not influence the maximum overall spectral shift by the constant peak current. Applying the bias current iB can be of advantage, providing higher signal-to-noise ratio and fringe visibility of the MZI interferogram at the pulse beginning (see Fig. 3). Increase of the peak current to approximately double the recommended limit results in a maximum of 12 nm overall spectral shift for the VCSEL VL-1544 (11 nm for the VCSEL VL-1577). Higher peak currents are of no benefit for a pulse duration of 12 µs, because the optical power drops significantly due to the excess heat, so that no usable spectral components are emitted (thermal power rollover). Further measurements have also shown that an overall spectral shift varies in the range of tenths of a nanometer for the TEC temperatures tuned between 15 and 30 ∘C.
If the peak pulse current exceeds the maximum CW operating current by approx. 50 %, the repetition rate of the current pulses can be varied within a wide range with almost no influence on the wavelength sweep (see Fig. 9). When the repetition frequency exceeds 20 kHz (duty cycle of approx. 25 %) a moderate red-shift as well as a reduction of the overall tuning range can be observed. This behavior is explained by an increase of the average temperature of the VCSEL chip, despite keeping the temperature of the mount constant. This also marks the limit of exceeding the maximum CW current by the peak current, before thermal damage occurs at higher duty cycles.
A further example for the VCSEL VL-1577 in Fig. 10a shows overlapping instantaneous frequency shifts over 450 consecutive pulses at a repetition rate of 50 Hz. The histogram in Fig. 10b was evaluated at a time of 2 µs and fitted with a normal distribution. The standard deviation of 109.6 MHz is apparently related to the noise of the optical source as well as the distortion induced by the measurement setup.
A method for rapid continuous wavelength tuning of VCSEL by pump current modulation has been experimentally demonstrated. The maximum overall spectral shift of 12 nm for the VCSEL VL-1544 and 11 nm for the VCSEL-1577 have been achieved for 12 µs long current pulses within a useful time for measurements of 10 µs. The repetition frequency can be as high as 20 kHz with almost no influence on the sweep parameters. As expected, the overall spectral shift increases by the peak current, determined as a sum of bias and pulse amplitude. However, an excessive increase of the peak current can lead to a power rollover due to internal heating. Besides a well-balanced combination between overall tuning range and measurement speed, this work provides a precision measurement of the dynamic wavelength sweep needed to linearize any sensor data to a linear wavelength scale. The interferometric setup and the evaluation algorithm described above can be directly implemented into a corresponding sensor system.
In comparison to conventional distributed feedback laser diodes, VCSELs provide typically faster and wider wavelength sweep by injection current pulse modulation. With these results, TDLAS-based gas sensor enables potentially rapid multi-species concentration analysis or high pressure measurements where a significant absorption line broadening occurs. A low-cost sensor systems based on c-OFDR could also be realized, achieving sub-millimeter two-point range resolution or even better single-point range precision within a few microseconds for a single measurement.
The underlying measurement data are not publicly available and can be requested from the authors if required.
RK wrote the manuscript and contributed to the measurements and data validation. GS was responsible for implementation and verification of the algorithms for the data evaluation and performed parts of the measurements. RE contributed to the project administration, editing and reviewing the manuscript and was responsible for methodology, funding acquisition and the ideas for the measurement setup. All authors contributed to the reviewing and editing of the final paper.
The contact author has declared that neither they nor their co-authors have any competing interests.
Publisher's note: Copernicus Publications remains neutral with regard to jurisdictional claims in published maps and institutional affiliations.
This article is part of the special issue “Sensors and Measurement Science International SMSI 2021”. It is a result of the Sensor and Measurement Science International, Nuremberg, Germany, 3–6 May 2021.
The authors would like to thank Vertilas GmbH, Garching, Germany, for providing the VCSELs.
This research has been supported by the Bayerisches Staatsministerium für Wissenschaft und Kunst (grant no. H.2-F1116.NÜ/56/3).
This paper was edited by Marco Jose da Silva and reviewed by three anonymous referees.
Ahn, T.-J., Lee, J. Y., and Kim, D. Y.: Suppression of nonlinear frequency sweep in an optical frequency-domain reflectometer by use of Hilbert transformation, Appl. Opt., 44, 7630–7634, https://doi.org/10.1364/AO.44.007630, 2005.
Berger, P. R., Dutta, N. K., Choquette, K. D., Hasnain, G., and Chand, N.: Monolithically Peltier-cooled vertical-cavity surface-emitting lasers, Appl. Phys. Lett., 59, 117–119, https://doi.org/10.1063/1.105547, 1991.
Caliman, A., Mereuta, A., Suruceanu, G., Iakovlev, V., Sirbu, A., and Kapon, E.: 8 mW fundamental mode output of waferfused VCSELs emitting in the 1550-nm band, Opt. Express, 19, 16996–17001, https://doi.org/10.1364/OE.19.016996, 2011.
Chang-Hasnain, C. J.: Tunable VCSEL, J. Sel. Top. Quant., 6, 978–987, https://doi.org/10.1109/2944.902146, 2000.
Chinn, S. R., Swanson, E. A., and Fujimoto, J. G.: Optical coherence tomography using a frequency-tunable optical source, Opt. Lett., 22, 340–342, https://doi.org/10.1364/OL.22.000340, 1997.
Choquette, K. D., Harshil, D., and Zihe, G.: Modulation Properties of 2x1 Coherently Coupled VCSEL Arrays, IEEE Photonics Society Summer Topical Meeting Series, https://doi.org/10.1109/PHOSST.2019.8795051, 2019.
Fan, L., Wu, M. C., Lee, H. C., and Grodzinski, P.: 10.1 nm range continuous wavelength-tunable vertical-cavity surface-emitting lasers, Elec. Lett., 30, 1409–1410, https://doi.org/10.1049/el:19940972, 1994.
Gierl, C., Gruendl, T., Debernardi, P., Zogal, K., Grasse, C., Davani, H.A., Böhm, G., Jatta, S., Küppers, F., Meißner, P., and Amann M.-C.: Surface micromachined tunable 1.55 μm-VCSEL with 102nm continuous single-mode tuning, Opt. Express, 19, 17336–17343, https://doi.org/10.1364/OE.19.017336, 2011.
Hodgkinson, J. and Tatam, R. P.: Optical gas sensing: a review, Meas. Sci. Technol., 24, 012004, https://doi.org/10.1088/0957-0233/24/1/012004, 2012.
Iga, K.: Forty years of vertical-cavity surface-emitting laser: Invention and innovation, Jpn. J. Appl. Phys., 57, 08PA01, https://doi.org/10.7567/JJAP.57.08PA01, 2018.
Lackner, M., Totschnig, G., Winter, F., Ortsiefer, M., Amann, M.-C., Shau, R., and Rosskopf, J.: Demonstration of methane spectroscopy using a vertical-cavity surface-emitting laser at 1.68 μm with up to 5 MHz repetition rate, Meas. Sci. Technol., 14, 101–106, https://doi.org/10.1088/0957-0233/14/1/315, 2003.
Michalzik, R. (Ed.): VCSELs: Fundamentals, Technology and Applications of Vertical-Cavity Surface-Emitting Lasers, Springer-Verlag, Germany, https://doi.org/10.1007/978-3-642-24986-0, 2013.
Müller, M., Hofmann, W., Gründl, T., Horn, M., Wolf, P., Nagel, R. D., Rönneberg, E., Böhm, G., Bimberg, D., and Amann, M.-C.: 1550-nm high-speed short-cavity VCSELs, IEEE J. Sel. Top. Quant., 17, 1158–1166, https://doi.org/10.1109/JSTQE.2011.2109700, 2011.
Newton, S. A. and Cross, P. S.: Microwave-frequency response of an optical-fibre delay-line filter, Electron. Lett., 19, 480–481, https://doi.org/10.1049/el:19830326, 1983.
Passy, R., Gisin, N., von der Weid, J. P., and Gilgen, H. H.: Experimental and theoretical investigations of coherent OFDR with semiconductor laser sources, J. Lightwave Technol., 12, 1622–1630, https://doi.org/10.1109/50.320946, 1994.
Totschnig, G., Lackner, M., Shau, R., Ortsiefer, M., Rosskopf, J., Amann, M. C., and Winter, F.: High-speed vertical-cavity surface-emitting laser (VCSEL) absorption spectroscopy of ammonia (NH3) near 1.54 μm, Appl. Phys. B, 76, 603–608, https://doi.org/10.1007/s00340-003-1102-1, 2003.
Wipiejewski, T., Panzlaff, K., Zeeb, E., and Ebeling, K. J.: Tunable extremely low threshold vertical-cavity laser diodes, IEEE Photonic. Tech. L., 5, 889–892, https://doi.org/10.1109/68.238244, 1993.
- Abstract
- Introduction: VCSELs as light sources for sensing
- Measurement setup for the dynamic wavelength sweep
- Processing of the measurement data
- Measurement results and discussion
- Conclusions
- Data availability
- Author contributions
- Competing interests
- Disclaimer
- Special issue statement
- Acknowledgements
- Financial support
- Review statement
- References