the Creative Commons Attribution 4.0 License.
the Creative Commons Attribution 4.0 License.
 | 16 Sep 2022
En route to automated maintenance of industrial printing systems: digital quantification of print-quality factors based on induced printing failure
Peter Bischoff
André V. Carreiro
Christoph Kroh
Christiane Schuster
Thomas Härtling
Tracking and tracing are a key technology for production process optimization and subsequent cost reduction. However, several industrial environments (e.g. high temperatures in metal processing) are challenging for most part-marking and identification approaches. A method for printing individual part markings on metal components (e.g. data matrix codes (DMCs) or similar identifiers) with high temperatures and chemical resistance has been developed based on drop-on-demand (DOD) print technology and special ink dispersions with submicrometer-sized ceramic and glass particles. Both ink and printer are required to work highly reliably without nozzle clogging or other failures to prevent interruptions of the production process in which the printing technology is used. This is especially challenging for the pigmented inks applied here. To perform long-term tests with different ink formulations and to assess print quality over time, we set up a test bench for inkjet printing systems. We present a novel approach for monitoring the printhead's state as well as the print-quality degradation. This method does not require measuring and monitoring, e.g. electrical components or drop flight, as it is done in the state of the art and instead uses only the printed result. By digitally quantifying selected quality factors within the printed result and evaluating their progression over time, several non-stationary measurands were identified. Some of these measurands show a monotonic trend and, hence, can be used to measure print-quality degradation. These results are a promising basis for automated printing system maintenance.
- Article
(2325 KB) - Full-text XML
- BibTeX
- EndNote


To reduce production and quality-assurance costs, manufacturers in the metal industry strive to digitize their production processes. The background is that factors such as varying processing temperatures or temperature exposure times can have significant impacts on the properties of the produced metal parts (Karbasian and Tekkaya, 2010; Venema et al., 2018). One major focus is to enable tracking and tracing of each manufactured metal part and to assign respective processing parameters to it. Obviously, to mark and identify each semi-finished product would facilitate the rejection of only those impacted by deviating process parameters. Hence, enabling tracking and tracing in production processes allows the reduction of the rejection rate and its associated costs. Individual part marking is therefore a key technology for unearthing the benefits of digitization.
Conventional marking methods, such as unique identifiers (UID) printed on labels, laser printing, or dot peen marking, fail in many metal production processes due to their low temperature resistance, or as they cause surface damage and subsequent corrosion. To solve these issues, a high-temperature and mechanical-deformation compatible ink was developed at the Fraunhofer Institute for Ceramic Technologies and Systems (IKTS). The temperature resistance is reached by adding glass and ceramic particles to a solvent-based ink. The glass pigments melt during the high-temperature step of the metal processing and mediate the adhesion of the ceramic particles to the part surface. The ceramic pigments in turn maintain their colour, and hence provide contrast even after high-temperature exposure. The ink can therefore be used to print data matrix codes (DMCs) on semi-finished products before high-temperature processing, for example, and also allows decoding the DMCs after heating.
One use for this ink is press hardening. With this technology, crash-relevant car body parts are produced by heating metal blanks to above 900 ∘C, followed by forming and fast cooling in one step. Hence, the austenitization induced by the high temperatures is maintained in the cooled parts, which leads to light and mechanically resistant components (Hu, 2012; Venema et al., 2018). Currently, more than 500 million press-hardened metal parts are produced annually worldwide (Palm et al., 2017). Assuming between 1 %–5 % of rejection rate, this shows the cost- and resource-saving potential which triggered several scientific groups to pursue process optimization for press hardening (Neugebauer et al., 2012; Penter et al., 2019). In this context, the temperature-resistant ink is highly welcomed in both the research and the production community as it allows individual marking and identification of press-hardened components for the first time. However, also the marking method itself needs to be cost efficient and reliable in operation, especially in production environments. This means that maintenance costs and downtimes of printing systems need to be as low as possible.
One way to achieve these prerequisites is to largely automate the monitoring and maintenance of the printing unit. This can be achieved by continuously collecting print data and analysing it using machine-learning (ML) algorithms and deep learning (DL) with respect to print quality. Subsequently, maintenance actions can be performed according to the results of data evaluation. To allow training of the respective models which follow the progression and possible decline of print quality, collecting large amounts of data is necessary. Since printing failures occur on rare bases at intervals typically only larger than several weeks, a printing unit in a production environment would have to be monitored over long periods (several months).
In this work we tested the possibility of accelerating the data collection process by performing long-term tests on a test bench operated in the laboratories at IKTS. We describe the functionality and design of this test bench in Sect. 3.1. It allows us to use inks with non-sufficient particle dispersion as it would occur after long storage or operation time, to accelerate print-quality degradation and inducing printing failures more frequently. With this setup, we were able to generate ample data sets which can be evaluated automatically concerning the temporal progress of print quality.
Secondly, we focused on the identification of several non-stationary measurands in the evolution of the printed patterns. Non-stationary measurands, which show the state and the degradation of the print quality, are the basis to pre-training a self-learning maintenance system upon the available data. We therefore consider these results as first steps towards fully automated (predictive) printing system maintenance.
This work is organized as follows: in Sect. 2, possible causes of the failure in drop-on-demand (DOD) printing are described in detail. Section 3 first presents the test bench used for the long-term experiments (Sect. 3.1), including automated print data acquisition, and secondly, provides details of the long-term test runs and elaborates on the data-evaluation approaches used to investigate the temporal behaviour of print quality (Sect. 3.2). Obtained results are presented and discussed in Sect. 4, which is followed by an outlook to future work (Sect. 5).
Drop-on-demand (DOD) inkjet printing is an active research area aiming at stable and accurate printing results. While some researchers focus on decreasing the drop radius to enable more detailed printing, others study the fluidal properties of the ink and process parameters that lead to stable printing behaviour (Jo et al., 2009; Dong et al., 2006). It is important to notice that there are substantial differences between DOD inkjet printing with Newtonian fluids and with colloidal suspensions (the latter is used in our experiments). Several studies explore the behaviour of colloidal suspensions in either general microchannel applications or DOD inkjet printing specifically (Lee et al., 2012; Xie et al., 2010; Zaccone et al., 2010, 2009; Ramachandran and Folger, 1999; Wyss et al., 2006; Georgieva et al., 2010).
One of the main challenges is the clogging of microchannels. This can be due to particle deposition as a result of adhesion to the inner nozzle surface (Wyss et al., 2006), hydrodynamic bridging, i.e. multiple particles smaller than the channel size arrive at the same time and therefore block the channel (Ramachandran and Folger, 1999), or due to aggregation of particles (Georgieva et al., 2010). The latter is studied in the context of DOD printing by Jo et al. (2009). They find that while for single-phase fluids the inverse Ohnesorge number can be used to predict jettability, suspensions can lead to nozzle clogging, even though it is in the identical Z-range (Lee et al., 2012). They further find that nozzle clogging is primarily due to flow-induced aggregation, which is promoted by a small fraction of micrometre-sized aggregates acting as nuclei for heterocoagulation of the suspended particles. This phenomenon can occur even if these aggregates are considerably smaller than the nozzle diameter and their concentration is small (a few hundred parts per million).
The described effects impact the quality of the printed patterns and are often observed especially when pigmented inks (i.e. inks containing ceramic particles) are used for printing. Figure 1a shows a test pattern printed in our test bench with high quality and minimum irregularities as a reference, together with an image of the nozzles (Fig. 1b) which correspond to the printed columns, while panels (c), (d), and (e) are detailed sections from different prints showing possible printing failures. In Fig. 1c, the drop size varies between the columns (or nozzles) and is significantly smaller on the left. Figure 1d shows how the drop position of the first printed dots deviates from a straight line but is decreasing to the expected grid position as printing continues. In Fig. 1e on the other hand, the dot positions are deviating from the grid positions in a constant fashion (either in column/nozzle direction or printing direction). This printing failure can be identified by the different spacing between the columns and the irregular positioning of the rows. These failure images are typical for agglomerated particles or pigments adhering to the nozzle, which can either prevent ink ejection from nozzles (completely or partially) or alter the drop trajectory. Partial prevention of ink ejection leads to significantly reduced dot size (Fig. 1c), which lowers the contrast and leads to more difficult dot detection in the readout stage. Trajectory deviations, on the other hand, lead to mispositioning of the dot on the surface as shown in Fig. 1d and e.

Figure 1Printing failures caused by the solid particles in the ink impacting the printing quality in different ways: (a) Print with minimum printing failures as reference. (b) Nozzle plate of the printhead with 16 nozzles, corresponding to the 16 columns in the test pattern. (c) Dot size varying from nozzle to nozzle. (d) The first printed dots (lower area of the image) deviate from their expected positions (indicated by the broken line). The deviation decreases as printing continues (towards the upper end of the image). (e) Constant deviation from expected dot position in vertical and horizontal direction.
In the case of printing DMCs, all these potential failures lower the quality gradings of the codes according to industry standards. In the worst case, a complete loss of decodability results (Zeh et al., 2021). The aim of automated printing system monitoring and maintenance is to detect such declining print quality early and trigger impactful maintenance actions (e.g. rinsing of nozzles, wiping of the nozzle plate, or complete replacement of the printhead) in accordance with maintenance intervals planned by plant operators. Monitoring DOD printing systems is typically done using high-speed cameras and observing the ink ejection from the nozzles as described by Chang et al. (2021) and Choi et al. (2015). To our knowledge, no related work exists on the automation of DOD printer maintenance or assessing the printheads state by analysing the printed pattern.
3.1 Inkjet printing test bench
A test bench was designed to test new ink compositions, to print on different kinds of metal surfaces, and to acquire training data as well as to validate software and ML algorithms. It enables laboratory experiments before tests in an industrial production environment are run. The test bench, which is shown as a CAD model in Fig. 2, comprises four major components: the DOD inkjet printing module (Fig. 2a: Matthews Marking Systems, VIAJet V-Series), a robotic arm (Fig. 2b), a camera station (Fig. 2c and d), and the central control unit (CCU). Additionally, Fig. 3 shows a detailed photograph of the printhead above a metal sheet. The general print cycle consists of the CCU initiating the robotic arm to take up a metal sheet from the input tray and move it underneath the printhead where either a predefined test pattern or a DMC is printed on the metal sheet. The robotic arm then moves the metal sheet to the camera station where the print is documented before the sheet goes into the output tray (we refrain from providing technical details and settings for the cameras as our results are independent from the exact camera technology and can be reproduced with any camera and an appropriately fitted analysis pipeline). Individual sheets can be moved to heat treatment manually to test temperature resistance of the applied marking. Moreover, it is possible to take images of the ink-drop from the nozzle during the printing process by a separate camera (Fig. 2e: IDS uEye) which is positioned sideways to the printhead. Lastly, the setup allows us to take images of the nozzle plate to detect ink residues there (Fig. 2f). The most important components, which are the printing module and the CCU, are described in more detail in the following.
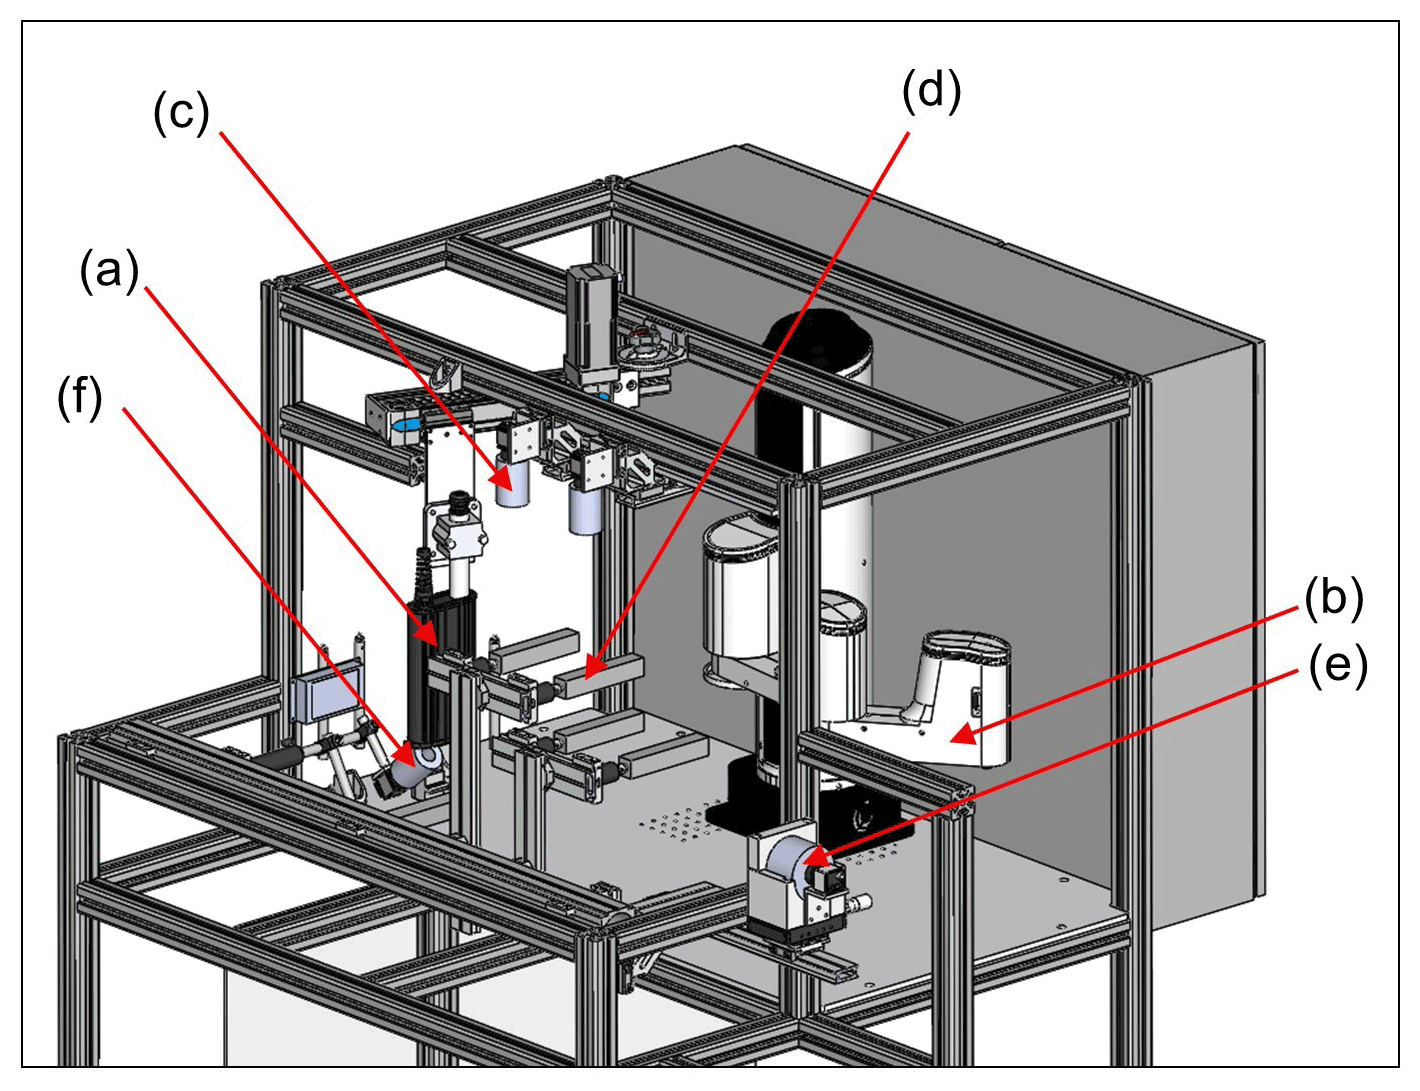
Figure 2CAD model of the test bench comprising of the following components: (a) printhead, (b) pick-and-place robot for metal test sheets, (c) fluorescence and colour cameras for quality control, (d) industrial LED lighting equipment (Top-Line-D2, Büchner GmbH) to ensure a constant image quality by providing uniform illumination and minimizing unwanted reflections on the metal sheets’ surfaces, (e) camera to document drop ejection and the formation of satellite droplets, and (f) camera to observe ink residues on the nozzles on the bottom of the printhead. The metal sheets as well as input and output tray are not shown for clarity.
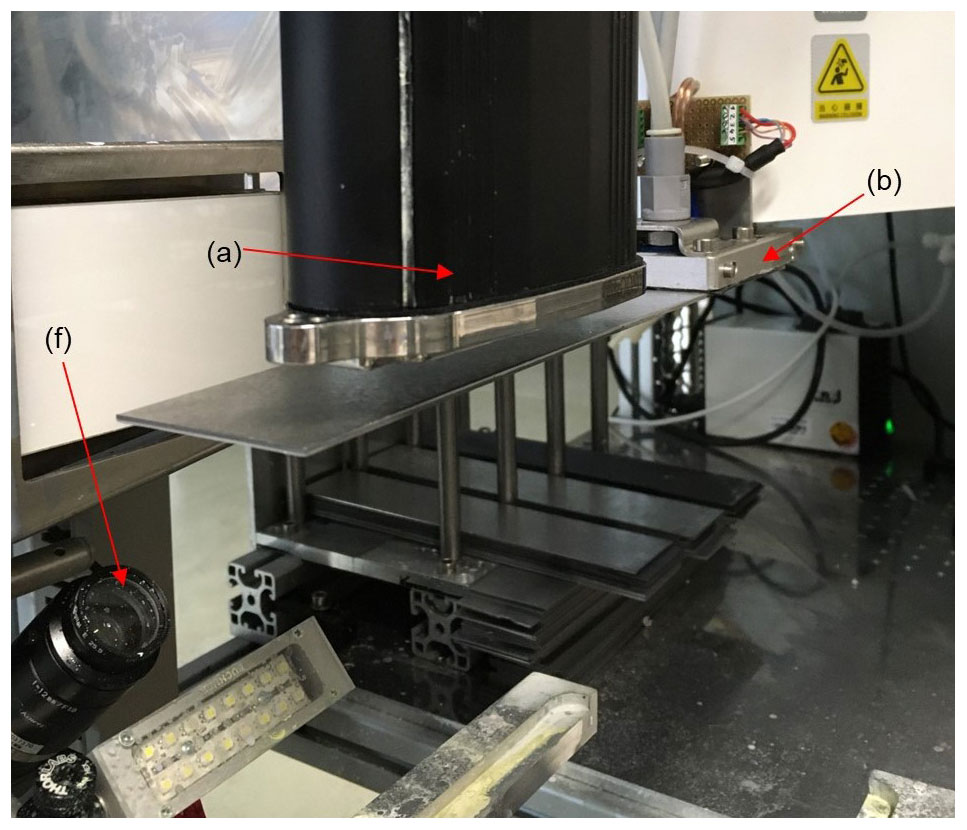
Figure 3A detailed photograph of the test bench showing the printhead (a) with a metal sheet that is moved underneath the printhead by the robot (b). Additionally, the camera observing ink residues on the printhead is visible (f).
The printing module itself consists of the ink supply unit, the printhead, and a separate control unit. This control unit triggers the printhead to eject ink. It logs and controls all necessary parameters, e.g. drop size, vertical resolution, and predefined patterns or codes that are printable. These parameters can be set externally and updated through an interface. Mounting the printhead skewed with respect to the printing direction, allows printing patterns with a column distance smaller than the nozzle distance. The CCU performs all necessary steps for a test session. It communicates with other components using TCP/IP over Ethernet or by triggering certain actions over digital I/O (input/output) switches. The user defines procedure schedules, e.g. “test pattern printing”, which defines the sequence of steps (e.g. getting a new sheet, printing, and taking an image) and the configuration for each step (e.g. coordinates to move to). A test session is defined by a sequence of procedure schedules and is loaded for each session via a web interface. Process parameters as well as images taken at the test bench are logged to a database from where they can be accessed by analysing services.
3.2 Data-collection process and identification of measurands
A set of long-term printing tests was performed to acquire print-quality data from test patterns. As outlined in the introduction, our first and predominant aim was to identify measurands in the printed patterns which show a non-stationary temporal behaviour. At a later stage, such measurands may also enable the evaluation of print quality in production environment and, subsequently, allow the planning of maintenance measures. To accelerate print-quality degradation, an ink with imperfect particle dispersion, and hence higher agglomeration and sedimentation tendency, was used. This represents an ink after longer storage or operation time, for example, and leads to more frequent printing failures. (We refrain from providing details of the ink composition as this is beyond the scope of this work.)
Before each test, the printing unit was cleaned and maintained. A run-in test was performed in which the nozzles were calibrated to assure constant printing quality at the beginning of all tests. Then, 10 test patterns were printed for reference purposes. The actual tests finally started with a 3-minute section, during which the nozzles were activated every 30 s to eject ink into a container. This procedure simulates printing without the need to provide a cleaned metal sheet. Next, one test pattern was printed on a metal sheet for evaluation purposes, i.e. images of the print as well as of the nozzle plate and the ink-drop tear off were taken in the test bench as described in Sect. 3.1. For the data analysis described in the following paragraph, we only used print images taken by the colour camera (Fig. 2c). These steps were repeated until the test was interrupted due to evidently insufficient printing quality, i.e. the printing failures of Fig. 1 were clearly observable for the operator.
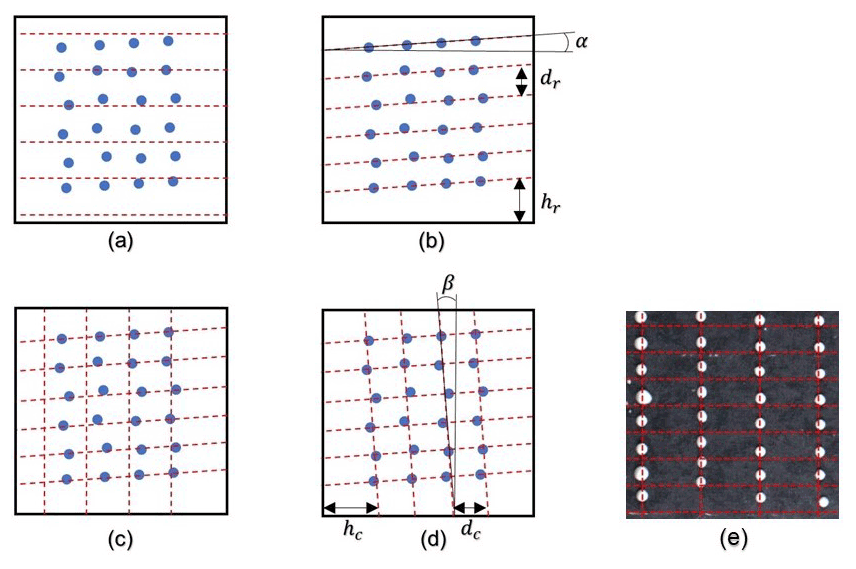
Figure 4Graphical step-by-step representation of the algorithm used for calculating deviations from grid positions on a set of exemplary points with highly exaggerated deviations from a regular grid including an overall skew. (a) A set of horizontal lines is placed over the centroid positions of the printed dots. Line distance is in accordance with the line distance of the printed pattern. (b) The starting height hr of the first row, the absolute distance dr between rows, and the angle α are then optimized. (c) As the next step, a set of vertical, evenly spaced lines is added. The starting height hc of the first column, the column distance dc, and column angle β are optimized analogous to the first set of lines as seen in (d). The grid positions (on which dots are expected to appear) are defined as the cross points of the two sets of lines. In (e) the result of a real computation of the described algorithm on a printed image is shown. The different characteristic errors from Fig. 1 are observable and now quantifiable.
Print-data analysis was performed as follows: the ink drops were identified within the images taken with the colour camera using a U-Net model which segments the drops from the background (Bischoff et al., 2021). The resulting binary mask was labelled using the connected-component labelling algorithm (van der Walt et al., 2014). Thus, the centroid position as well as size and shape of each ink dot were obtained. The grid positions on which the dots are expected to appear were estimated with the following approach: in a first step, a set of parallel, horizontal lines were defined, in which the number of lines matches the number of rows in the printed pattern (see Fig. 4a). The sum of the distances of all dot-centroid positions to the nearest line was minimized by optimizing the angle α of the parallel lines, the distance dr between the lines, and the starting height hr in the image coordinate system (Fig. 4b). We use the index r here to denote the variables defining the rows and the index c for variables defining the columns. In a second optimization step, a set of parallel, evenly distanced vertical lines was added in a similar fashion in which the number of lines is equal to the number of columns (or nozzles) (Fig. 4c). The grid positions (on which printed dots are expected to appear) were finally defined as the crossing points of the lines, which are specified by the optimized variables hr, dr, α and hc, dc, β, respectively (Fig. 4d). Each printed dot was assigned to the closest of those grid positions. Knowing the true position of each dot on the one hand, and the expected grid position on the other hand, each dot was attributed to a particular nozzle, and the order in which the dots of one nozzle were printed was determined.
Furthermore, using the position of each printed dot and the respective grid position, the different failure types of Fig. 1 were quantified for different time series of images obtained in various printing tests. In particular, we assessed the dot size (A) by counting the number of pixels belonging to the same dot according to the connected-component labelling, the deviation (Euclidean distance measured in millimetres) of each printed dot (Δs) from its expected grid position, and the deviation of the printed dots of the first two printed rows only (Δs2). For each measurand, the mean value and the standard deviation were determined for the respective drops of one image. The standard deviation of the described printing failures is particularly expected to change over time if the printing quality degrades.
We then analysed the mean values of the three measurands and their respective standard deviations concerning their temporal evolution from image to image. Outliers outside the 3σ interval were sorted out and the temporal evolutions were smoothed using a simple moving average with a window size of 10 images (SMA10). It should be noted that the tests were of different lengths, i.e. different numbers of images, as severe printing failures leading to abortion of the test occurred by chance after different numbers of prints. The shortest test lasted only a few hours (20 images), the longest approximately 1 d (314 images). We consider this spread of durations a realistic representation of real-world conditions under which printing failures also occur on strongly varying timescales. To mimic real-world conditions even further, we varied the printing frequency between different tests to account for different production frequencies or short downtimes during change of operator shifts. Measurands suitable for describing the temporal evolution of print quality should be applicable for all of these varying conditions.
To test for the presence of a monotonic trend (non-stationary behaviour) in the time series of the respective measurand, a Mann–Kendall (MK) test was performed (Kendall and Gibbons, 1990; Mann, 1945). Additionally, the time series were tested for the presence of unit roots, which could indicate that a time series is not mean-reverting (therefore is converging towards a different growing mean value) after a shock, and thus difficult to predict. This has been tested using an augmented Dickey–Fuller (ADF) unit root test and a Kwiatkowski–Phillips–Schmidt–Shin (KPSS) unit root test, which use the opposite alternative hypotheses (Kwiatkowski et al., 1992; Dickey and Fuller, 1979). Thus, deriving a clear statement concerning the existence or non-existence of a unit root from the two tests is possible if one (and only one) of the null hypotheses was rejected. In any other case (either both tests positive or both negative), the tests do not allow a clear statement concerning unit root existence.
In addition to the methods described above, we conducted further long-term tests using an ink with a more stable particle dispersion. These tests led to less printing failures, and hence were only aborted due to time constraints. Of these three tests, two lasted for over 600 images, while the third was aborted after approximately 170 images. The printing failures of Fig. 1 were practically not observed visually, and no degradation trend was seen experimentally. The printed patterns in these runs were analysed in the same way as described above. The aim was to investigate the stability of the methodology against false-positive degradation trend detection.
Ten long-term printing tests were performed, of which seven showed a clear visual decline in printing quality. Figure 5 shows the relative number of occurrence for both the different monotonic trend behaviours and the presence of a unit root for each time series of mean values and standard deviation values. The trend-behaviour distribution is shown in the left bar stack, differentiating between increasing, decreasing, or no trend. The right bar stack shows the occurrence of time series either including or not including a unit root, and the ones for which the test results of the ADF and the KPSS tests were inconclusive.
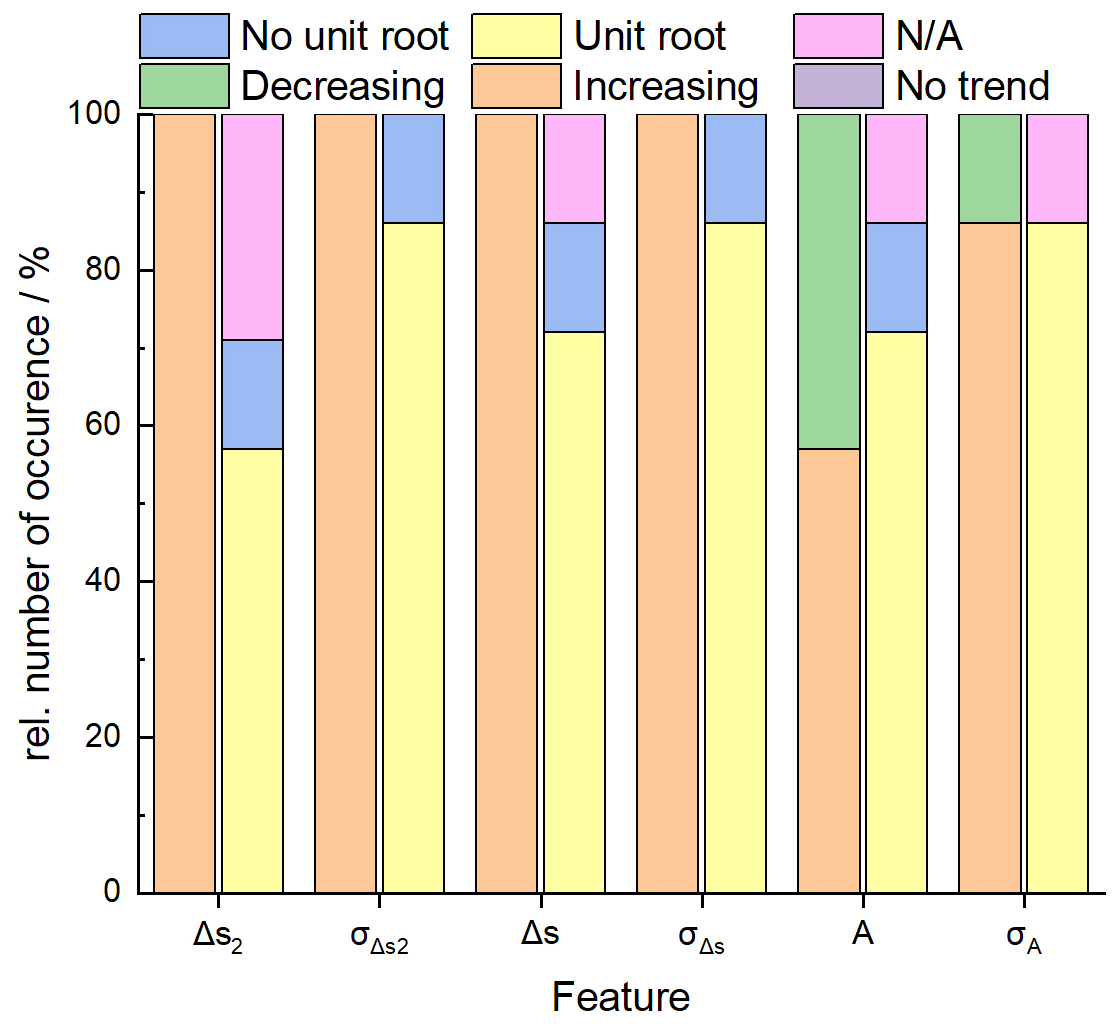
Figure 5Relative number of occurrence for the trend behaviour and the presence of a unit root for the measurands in the long-term tests with a clear quality degradation. For each measurand, the mean over time and the standard deviation over time is tested. The left stack of bars represents the respective trend behaviour, while the right stack shows the presence of unit roots. If the ADF and KPSS tests show conflicting results, the time series is listed as “N/A”.
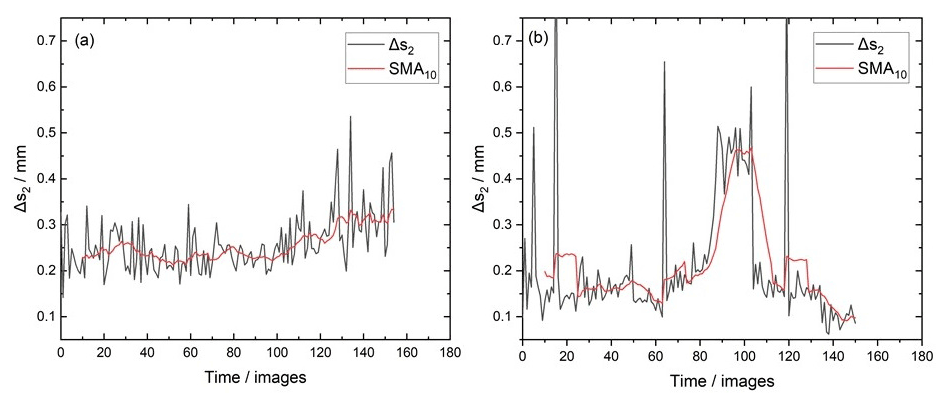
Figure 6Mean deviation of the first two rows printed in each test pattern of two different long-term tests and the simple moving average with a window size of 10 images (SMA10), respectively. (a) Long-term test with increasing trend. (b) Long-term test performed with more stable ink formulation. No trend detected according to the Mann–Kendall test.
For continued printing and decreasing print quality, it is expected that the mean deviation over the first two rows Δs2 and over all rows Δs show increasing trends, while the mean area A of all dots is expected to decrease over time. Assuming that the printing quality for each nozzle degrades at a different rate, the standard deviation of all the measurands is expected to increase over time. As seen in Fig. 5, most of these expectations are indeed confirmed. In all tests, Δs2, Δs, and their standard deviations increased. This shows that these measurands and the methodology to extract them from the images are suitable to monitor the progression of print quality in our test bench and are promising metrics for evaluating prints performed in industrial environments in the future.
The dot size A shows irregularities as the mean value is increasing in more than 50 % of the tests. We attribute this behaviour to organic layers on the metal surface, in particular to a corrosion protection film based on oil which represents another important parameter for industrial applications. This film delays the adhesion process of the ink to the metal surface after printing and leads to merging dots that form larger ink accumulations. In summary, A is a rather unreliable measurand and does not seem recommendable.
Figure 5 also shows that many of the time series on their own are unit root processes. Unit root processes do not return to their initial mean value after a shock but may jump to another value. Therefore, such time series are difficult to predict and the corresponding measurand needs careful monitoring and interpretation when used to describe the printing quality over time. This is shown exemplarily in Fig. 6 which compares the mean deviation over the first two printed rows in two different long-term tests.
Figure 6a shows an increasing trend confirmed by the MK test, but without the presence of a unit root. This time series originates from one of the test runs that were aborted due to the occurrence of failures. In contrast, the long-term tests performed with a more reliable ink, and not aborted due to the occurrence of printing failures of Fig. 1, do not show such trend behaviour. Figure 6b shows the shortest of those tests for which the MK test cannot prove the presence of any trend. However, it is worth discussing another effect occurring in these stable long-term tests. Figure 6b also depicts that there is a clear increase of the measurand Δs2 until around the 100th image. However, the mean value decreases rapidly as the time series continues beyond image number 110 (in which it can be justified that their is no overall trend detected). This shows that the printing quality can improve at random, e.g. when particles that clog a nozzle are getting cleared by the following ejections of ink. In an automated print-quality assessment system, this behaviour can be taken into account, e.g. by continued monitoring of the measurands over time and their continued comparison to threshold values.
In this work, we presented a test bench for hardware and software components of printing systems, for validating new ink formulations, and – most importantly – for acquiring print-quality data for printed patterns. We demonstrated that the setup allows us to acquire printing-failure data in a shorter time (less than 24 h) than it would be possible in industrial applications without causing production interruptions, where printing failure might only occur after a few weeks. This was achieved by using an ink with non-sufficient particle dispersion. From our main research question, we were able to show that using the failure data, a set of non-stationary measurands were defined in the printed patterns which facilitate the automatic quantification and monitoring of the print-quality degradation over time. This is an important result, as we only need to monitor the print result using standard camera technology instead of monitoring the droplet ejection with high-speed cameras, for example. An even more accurate representation of the print quality, also taking into account random processes, may be based on combining the explored measurands for print-quality assessment.
Although our results also show that randomly occurring qualitative leaps in some measurands may happen, the obtained insights form the basis for building an intelligent system which assures constantly high printing quality. Our goal is to approach this challenge using a reinforcement learning model, which is rewarded upon the printing cost per completed print and can interact with its environment through the recommendation (and possibly automated execution) of different maintenance actions. This requires large amounts of training data to enable a pre-training before deploying such models to production. We plan to generate further sample data on our test bench to explore the impact of different maintenance actions and also to use as a basis for generating synthetic time-series data of arbitrary length and varying sampling frequency which will further accelerate the development process by not having to deploy the test bench for thousands of hours.
The software code for this research is subject to internal regulations and can only be shared upon reasonable request. Please contact the authors regarding the implementation.
The data analysed in this research are subject to internal regulations and cannot be published.
PB contributed to conceptualization, data curation, formal analysis, methodology, visualization, and writing. AVC contributed to conceptualization, methodology, supervision, and writing (review and editing). CK contributed to investigation and writing (review and editing). CS and TH contributed to conceptualization, funding acquisition, project administration, resources, supervision, and writing (review and editing).
The contact author has declared that none of the authors has any competing interests.
Publisher’s note: Copernicus Publications remains neutral with regard to jurisdictional claims in published maps and institutional affiliations.
The authors thank Robin Anton for conducting the long-term test experiments and Manuela Heymann and Christoph Zeh for their work in the ink-development process. We would also like to thank Stefan Effenberger (Beschriftungstechnik Gärtner GmbH) for providing a CAD model of the test bench.
This research has been supported by the Bundesministerium für Wirtschaft und Energie (grant nos. 03EFMSN146 and 16GP105802). This work was also funded by the Fraunhofer International Mobility Programme (FIM grant no. 068-633102).
This open-access publication was funded by the Technische Universität Dresden (TUD).
This paper was edited by Alexander Bergmann and reviewed by two anonymous referees.
Bischoff, P., Zeh, C., Schuster, C., Härtling, T., and Kroh, C.: D5.1 Image-Based Predictive Maintenance Concept for Inkjet Printing of Ceramic Inks, in: SMSI 2021 – Measurement Science, AMA Service GmbH, Von-Münchhausen-Str. 49, 31515 Wunstorf, Germany, 262–263, https://doi.org/10.5162/SMSI2021/D5.1, 2021. a
Chang, T., Mukherjee, S., Watkins, N. N., Benavidez, E., Gilmore, A. M., Pascall, A. J., and Stobbe, D. M.: Millimeter-wave electromagnetic monitoring for liquid metal droplet-on-demand printing, J. Appl. Phys., 130, 144502, https://doi.org/10.1063/5.0065989, 2021. a
Choi, I. H., Kim, Y. K., Lee, S., Lee, S. H., and Kim, J.: A Pneumatic Drop-on-Demand Printing System With an Extended Printable Liquid Range, J. Microelectromech. S., 24, 768–770, https://doi.org/10.1109/JMEMS.2015.2433955, 2015. a
Dickey, D. A. and Fuller, W. A.: Distribution of the Estimators for Autoregressive Time Series with a Unit Root, J. Am. Stat. Assoc., 74, 427–431, https://doi.org/10.1080/01621459.1979.10482531, 1979. a
Dong, H., Carr, W. W., and Morris, J. F.: An experimental study of drop-on-demand drop formation, Phys. Fluids, 18, 072102, https://doi.org/10.1063/1.2217929, 2006. a
Georgieva, K., Dijkstra, D. J., Fricke, H., and Willenbacher, N.: Clogging of microchannels by nano-particles due to hetero-coagulation in elongational flow, J. Colloid Interf. Sci., 352, 265–277, https://doi.org/10.1016/j.jcis.2010.08.065, 2010. a, b
Hu, P.: Theories, methods and numerical technology of sheet metal cold and hot forming: Analysis, simulation and engineering applications, Springer series in advanced manufacturing, Springer, London, https://doi.org/10.1007/978-1-4471-4099-3, 2012. a
Jo, B. W., Lee, A., Ahn, K. H., and Lee, S. J.: Evaluation of jet performance in drop-on-demand (DOD) inkjet printing, Korean J. Chem. Eng., 26, 339–348, https://doi.org/10.1007/s11814-009-0057-2, 2009. a, b
Karbasian, H. and Tekkaya, A. E.: A review on hot stamping, J. Mater. Process. Tech., 210, 2103–2118, https://doi.org/10.1016/j.jmatprotec.2010.07.019, 2010. a
Kendall, M. G. and Gibbons, J. D.: Rank correlation methods, 5th ed., ISBN 9780852643051, 1990. a
Kwiatkowski, D., Phillips, P. C., Schmidt, P., and Shin, Y.: Testing the null hypothesis of stationarity against the alternative of a unit root, J. Econ., 54, 159–178, https://doi.org/10.1016/0304-4076(92)90104-Y, 1992. a
Lee, A., Sudau, K., Ahn, K. H., Lee, S. J., and Willenbacher, N.: Optimization of Experimental Parameters to Suppress Nozzle Clogging in Inkjet Printing, Ind. Eng. Chem. Res., 51, 13195–13204, https://doi.org/10.1021/ie301403g, 2012. a, b
Mann, H. B.: Nonparametric Tests Against Trend, Econometrica, 13, 245, https://doi.org/10.2307/1907187, 1945. a
Neugebauer, R., Schieck, F., Polster, S., Mosel, A., Rautenstrauch, A., Schönherr, J., and Pierschel, N.: Press hardening – An innovative and challenging technology, Arch. Civ. Mech. Eng., 12, 113–118, https://doi.org/10.1016/j.acme.2012.04.013, 2012. a
Palm, C., Vollmer, R., Aspacher, J., and Gharbi, M.: Increasing performance of Hot Stamping systems, Procedia Engineer., 207, 765–770, https://doi.org/10.1016/j.proeng.2017.10.826, 2017. a
Penter, L., Link, P., Stoll, A., Albert, A., and Ihlenfeldt, S.: Predictive Analysis from numerical and experimental data in press hardening, IOP Conf. Ser.-Mat. Sci., 651, 012060, https://doi.org/10.1088/1757-899X/651/1/012060, 2019. a
Ramachandran, V. and Folger, H. S.: Plugging by hydrodynamic bridging during flow of stable colloidal particles within cylindrical pores, J. Fluid Mech., 385, 129–156, https://doi.org/10.1017/S0022112098004121, 1999. a, b
van der Walt, S., Schönberger, J. L., Nunez-Iglesias, J., Boulogne, F., Warner, J. D., Yager, N., Gouillart, E., and Yu, T.: scikit-image: image processing in Python, PeerJ, 2, e453, https://doi.org/10.7717/peerj.453, 2014. a
Venema, J., Hazrati, J., Matthews, D., Stegeman, R. A., and van den Boogaard, A. H.: The effects of temperature on friction and wear mechanisms during direct press hardening of Al-Si coated ultra-high strength steel, Wear, 406–407, 149–155, https://doi.org/10.1016/j.wear.2018.04.006, 2018. a, b
Wyss, H. M., Blair, D. L., Morris, J. F., Stone, H. A., and Weitz, D. A.: Mechanism for clogging of microchannels, Phys. Rev. E, 74, 061402, https://doi.org/10.1103/PhysRevE.74.061402, 2006. a, b
Xie, D., Wu, H., Zaccone, A., Braun, L., Chen, H., and Morbidelli, M.: Criticality for shear-induced gelation of charge-stabilized colloids, Soft Matter, 6, 2692, https://doi.org/10.1039/c002043e, 2010. a
Zaccone, A., Wu, H., Gentili, D., and Morbidelli, M.: Theory of activated-rate processes under shear with application to shear-induced aggregation of colloids, Phys. Rev. E, 80, 051404, https://doi.org/10.1103/PhysRevE.80.051404, 2009. a
Zaccone, A., Gentili, D., Wu, H., and Morbidelli, M.: Shear-induced reaction-limited aggregation kinetics of brownian particles at arbitrary concentrations, J. Chem. Phys., 132, 134903, https://doi.org/10.1063/1.3361665, 2010. a
Zeh, C., Bischoff, P., Rjelka, M., Schuster, C., and Härtling, T.: D6.4 Monitoring Inkjet Printer Condition via Image Analysis of Printed Patterns, in: SMSI 2021 – Measurement Science, AMA Service GmbH, Von-Münchhausen-Str. 49, 31515 Wunstorf, Germany, 273–274, https://doi.org/10.5162/SMSI2021/D6.4, 2021. a