the Creative Commons Attribution 4.0 License.
the Creative Commons Attribution 4.0 License.
Ultrasonic measurement setup for monitoring pre-thawing stages of food
Ruchi Jha
Walter Lang
Reiner Jedermann
The food industry relies on various technical processes, from storing, freezing, thawing, and packaging to logistics. With the increasing population and the equational growth in food production, it is preferred to have increased automation in the food industry to reduce human labor. To provide an automated and green solution, it is required to monitor and control food-processing steps, such as thawing. This research aims to design an ultrasound-based setup that can monitor the pre-thawing state of food. A change in the signal by 20 %–27 % for herring fish and 60.7 % for chicken soup was obtained when monitored from a frozen state to a room-temperature state. Various other sample food products were tested, and related challenges and observations are discussed.
- Article
(1863 KB) - Full-text XML
- BibTeX
- EndNote
Food processing is a rapidly growing sector today. In simple terms, it consists of all the different steps which are required for agricultural, meat, fish, and dairy products to transcend into usable commodities with nutritional values. To achieve this, different processing steps like heating, drying, irradiation, chilling, and fermentation are used. Preservation techniques like brining, freezing, extraction, and thawing often require technologies based on ultrasound, X-ray, or electromagnetic measurements for controlled and precise results (Taufiq et al., 2015). In some food factories, the conveyor belts are laced with infrared sensors to monitor the temperature of food items and thus help create a controlled freezing system. Although it could still be a challenge to monitor the decay in food at a molecular level, it helps to perform the first screening test for identifying an unsuitable product. A similar application is realized by using smart-camera systems and image-processing algorithms to collect data on the food product's size, shape, and color at the conveyor belt. Later the collected data are fed to a machine-learning algorithm to help segregate usable and nonusable products (Cheng et al., 2015). Detection of a foreign object or a falsely grouped product can also be achieved with trained algorithms (Zhu et al., 2021). Despite the high success rates of such algorithms, some food items likely take a longer time to reflect a physically noticeable change due to decay, and, thus, for more accuracy, a secondary system that could also detect the changes in the internal structure of food is also recommended. A microwave system is also used to determine the changes in food's dielectric properties. In research using a microwave on frozen hake fish, the time and temperature of stored fish were monitored to sort them into defined groups based on the season of catching, quality, etc., and a success rate of 92 % was obtained for the assignment of the right catching season (Ken et al., 2005). A very similar system also works based on radio frequency. For controlled heating and thawing of frozen tuna fish, samples were defrosted using 13.56 MHz parallel-plate radio-frequency systems (Llave et al., 2014). It was observed that the thawing time was reduced 3-fold compared to conventional heating. Methods based on the application of heat and high frequency could also bring damage to food and especially when the experiment required long hours of heat exposure.
A large scale of food products such as dairy, meat, fish industry, fresh or frozen vegetables, and fruits use ultrasound methods in various processing steps (Gallo et al., 2018). A very commonly used ultrasound method is based on pulse echo, which is useful in the process where sound velocity and attenuation are important. Examples of such processes are food-quality checks, reduction in structural damages, and various food-preservation steps (Schneider et al., 2009; Arnold et al., 2009; Comandini et al., 2013). In some processes like cheese and bread cutting, ultrasound is promising for accuracy and precision. In some crucial food processes like emulsification, drying, thawing, freezing, brining, and sterilization, the ultrasonic transmission method is used (Bhargava et al., 2020). They can also be categorized as the process where a change in the physical state of food is intended to be brought or measured. For example, using uniform heat transfer, processes like filtration, thawing, crystallization, and sanitization can be achieved (Archer, 2004). Each of the processes has its independent significance, and the usage of ultrasound, in general, benefits the system by reducing processing time and rapid temperature change. Freezing is one of the most vital steps of food processing. It is not only a traditional method of food preservation, but also accepts modern technologies like acoustic heating to stop the growth of micro-bacteria. It also slows down enzyme activity, which can spoil food (George, 1993). Furthermore, some of the physiochemical reactions bring off flavor, and changes in color or texture changes in the food are also avoided during freezing (Bahceci et al., 2005).
In the following section, the existing research in food technology using ultrasound is discussed.
1.1 Water content in food and usage of ultrasound in the food industry
In general, chicken breast has 60 %–69 % of water content, and fishes contain about 70 %–82 % of water (Popkin, 2011).
This points out the feasibility of having a measurement system built on the properties of water, which can later be used to comment on the conditions of the food sample.
In Astrain-Redin et al. (2021) the authors discuss the use of ultrasound for contact freezing of chicken breast samples. The research focuses on using ultrasound technology to reduce freezing time, hence potentially reducing the energy intake for the food-processing system and taking a step towards “green” food processing. This also highlights that water-holding capacity and cooking-loss values did not significantly differ for the conventional control and ultrasonic freezing systems. This creates a framework for utilizing ultrasound for the measurement of the water content of the sample food item.
1.2 Monitoring systems based on ultrasound
The physical properties of food have a direct relationship with the change in the temperature of the surroundings and thus acoustic impedance changes concerning time and temperature (Aparicio et al., 2008). This research describes a system to monitor food items during their freezing and unfreezing times and use the information to create a relationship between the quality and state of food.
Research monitoring the various states from pure frozen to thawing is presented in El-Kadi et al. (2013). The authors discuss a nondestructive ultrasound measurement technique to characterize the fish-thawing process. Red drums and salmon fillets were used for the study. It was observed that there is a decrease of 65.5 % in the peak-to-peak voltage in the reflected signal during thawing. This also points out a decrease in acoustic impedance.
Another research based on designing a poroelastic wave model to study the propagation of ultrasound through frozen orange juices is described by Carcione et al. (2007). The authors compare the ultrasonic properties of partially frozen orange juice based on their attenuation coefficients and wave velocities with a wave model based on Kevin's model and Biot's poroelastic theory to show good agreement with the experimental data. This research helps in predicting the freezing of orange juice using the characteristics based on wave velocity and attenuation factors.
1.3 Scope of this study
It is well established that changes in acoustic impedance have a direct relationship with the content of ice in food and also with the condition of food. To explore the use of ultrasound measurement techniques in the food industry, this research aims at monitoring the changes in food during unfreezing and also the various factors including the measurement setup, use of ultrasonic gel for contact, suitability of test-food items, and the challenges associated with them. The goal of the study is to establish a continuous monitoring system to decide when to stop thawing as per the requirement rather than the fixed time. This also promises faster heating and energy saving at the same time. For tender food products such as fish, overheating could likely cause quality losses and damage to the surface if continued. It also aims to study various factors concerning the different types of food products and the changes required in the setup for the same. The experiments were repeated for multiple trials for frozen/unfrozen food material with varying factors such as the type of transducers used, frequency of operation, contact material, pulse length, type of spring, and setup discussed in Jha et al. (2022).
To understand the process of thawing in industry, we cooperated with a company called TFE (The Fish Experts) in Bremerhaven, Germany. The purpose was to understand the technique used in common fish-processing industries and also to understand the challenges faced by the concerned working group. The surface temperature was measured to monitor the progress of the tuna fish's thawing process. iButton data loggers (DS19 series, Maxim Integrated) were attached to the tuna loins of weight ranging between 2 and 5.2 kg. For the measurement, we had two loins of tuna fish from Mexico and two loins from the Fijian islands. The loins had a triangular cross section and were around 75 cm long and up to 15 cm thick. To evaluate the data, the iButton was programmed and read out with a Java program, and the temperature (ranging from −7 to +8 ∘C) was measured periodically. After attaching the logger carefully with the loins, they were left for unfreezing in the production hall with no additional ventilation or heating system (Fig. 1). After 20 h, the data loggers were detached. It was observed that the surface temperature of the loins was between 0 and 4 ∘C.
The unexposed parts of the loins (ones at the bottom side) were still at a lower temperature value between 0 and 2 ∘C, depending on their position, and due to less exposure to air, the time taken by all the loins until the surface temperature had exceeded the 0 ∘C mark (on average) and fluctuated greatly. For the two Mexico loins, the required time was 4.6 and 11.7 h and, for the Fiji loins, it required around 15 h.
It was also observed that different loins, based on their shapes, took a different amount of time to react to the temperature change. With such observations, it was clear that an automated timer-based thawing system impacts different parts of fish differently and thus could impact the quality of food.
Measurement system: theory and design
Once the sound passes through the test food item, the velocity of sound changes, based on the acoustic impedance, creating a delay at the receiver end. The obtained delay is found to be related to the amount of ice in the frozen system and thus to readings taken at multiple stages; it establishes a relationship with the condition of food and answers whether it is a suitable time to start/stop thawing.
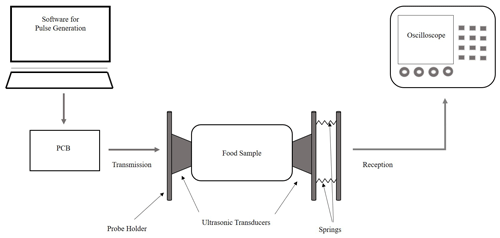
Figure 2Setup designed for the ultrasonic measurement system. The system consists of electronics and software to drive the ultrasonic transducers placed in 3-D printed holders and is supported using springs and metal rods for mechanical stability and also for creating a holder for sample food of dimensions up to 20 cm in length and 8 cm in width.
Having this understanding, the setup (Fig. 2) was designed to transmit the ultrasonic waves from one transducer and receive them from another transducer. To achieve the same, four commercially available transducers operating at 40 kHz (AliExpress, Conrad), 200 kHz (AliExpress), 1 MHz (AliExpress) and Omron ultrasonic transducers (with an optional wide range of frequencies between 1 kHz and 20 MHz) are used. A software program written in the C programming language was used with the microcontroller (Arduino-Nano) to provide the pulses and thus drive the ultrasonic transducers. The received signal was then amplified, and an oscilloscope was used to read the signal out and also to observe the pulses and the transmitted peak.
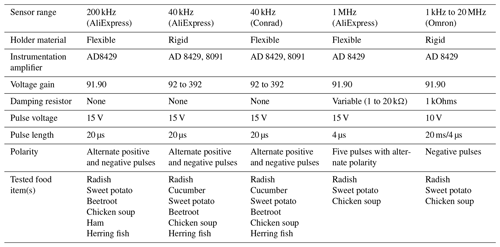
To design the electronics board, a MOSFET package with low threshold values is used as a switching element. Industrial Op-Amps with suitable power adapters are used to provide amplification in two stages. After multiple trials, it was decided to use a pulse voltage of 15 V with a single pulse length of 20 µs to trigger the circuit. The voltage-gain values were kept variable, depending on the food item in the test. For example, we needed a gain of 392 to test cucumber; for the remaining products, a gain of 92 at first-stage amplification was sufficient. Similarly, while using a 1 MHz transducer, a damping resistor varying in the range of 1–20 kOhm was also needed. Further details about the electronic system can be found in Table 1.

Figure 3Initial measurement setup (a) made with wooden holders (20 × 20 × 15 mm3), facilitating a space to accommodate a sample of dimension 10 cm in length and 8 cm in width, and (b) the change in amplitude versus frequency response for a cucumber of length 6 cm using a lock-in amplifier.
To understand the change in signal through food, experiments were done to compare the signal strength through frozen and unfrozen food samples. A lock-in amplifier (ZI Instruments, Switzerland) and LabOne toolset software were used to analyze the signals (Fig. 3). Vegetables like beetroot, cucumber, radish, and sweet potatoes were cut into sizes ranging from 3 to 12 cm and were tested at room temperature and after they were frozen overnight at −5 ∘C.
The system setup was improved by replacing the wooden holders with 3-D-printed flexible plastic materials to provide better damping. After observing the changes in amplitude and the signal strength for various vegetables, an experiment was first conducted on an ice block and water to establish a test case (Jha et al., 2022).
To establish the impact, ice blocks of varying thicknesses (7, 3.5, and 1.3 cm) with water were used in a plastic box, such that at every point of the experiment, a total of 7 cm of the test sample is created between the transducers. Similar room and temperature conditions were maintained to measure the change in delay values through them.
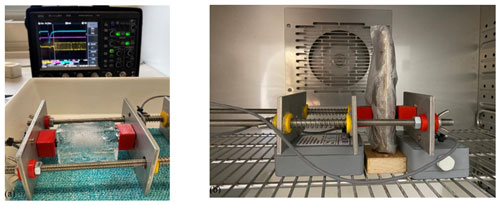
Figure 4Test setup with an oscilloscope for an ice block (7 cm), showing the measurement through the ice block of known length (7 cm) to study the change in the speed of sound through the various phases of meltdown. (b) Measuring the change in signal delay through a herring fish in a climate chamber using 200 kHz ultrasonic transducers.
Several experiments were carried out for chicken soup (Jha et al., 2022), herring fish, ham (Fig. 4), and freshly-cut meat slices under frozen and unfrozen conditions. The same setup and similar ones room temperature conditions are used for all the measurements. A climate control chamber with the possibility of letting the cables in with a closed door was used to ensure uniformity in the test conditions. A standard freezing temperature of −10 ∘C was maintained overnight in the climate chamber. Over the day, the temperature was increased to up to +10 ∘C to replicate the pre-thawing conditions.
The initial setup to record the change in temperature at the fishery resulted in interesting observations with different fishes, based on the position of the iButton data logger. It was found that loggers inside the foil tend to be 0.2 to 2 ∘C colder than outside the foil. However, the logger placed at the tail of the fish (with a thickness of around 2–3 cm) recorded 6 ∘C. To summarize these measurements, it can be pointed out that, based on the shape and the air packets available to the test food item, a different part of the same sample heats up differently. From these observations, a note to take a uniform food sample was taken.
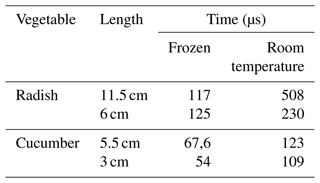
Following the outcomes, the uniform size and length of different vegetables were first tested using the lock-in amplifier. Out of cucumber, sweet potatoes, beetroot, and radish, the most distinguishable results were obtained for beetroot. Regardless of the chosen length or the frequency of operation, it was noted that, for a frozen beetroot, a lower amplitude was obtained. However, for lower frequencies (< 20 kHz), a similar amplitude was obtained for both frozen and unfrozen states. We also noticed that when we tested beetroot at room temperature, the signal obtained was stronger for a higher frequency of around 30 kHz. Similar measurement steps were taken for cucumber and radish and, in this trial instead of measuring amplitude, the change in signal delay was measured (Table 2).
To understand the effect of freezing in depth, slices of ice with increasing thickness were placed in a box with water. As the speed of sound is faster in ice, we could study the change in average sound speed from 1.35 km s−1 (0 % ice + 100 % water) to 3.18 km s−1 (100 % ice + 0 % water). For a length of 7 cm of ice, a time delay of 22 µs suggests the speed of sound in ice as measured with this setup is 3.18 km s−1, whereas, in theory, the speed of sound in bubble-free ice is approximately 3.9 km s−1 (Vogt et al., 2009). The ice block used in the experiment was not completely bubble free, and the transducers themselves have a metallic casing, which could be interfering with the expected sound propagation that justifies the difference between experimental and theoretical values of the speed of sound in ice.
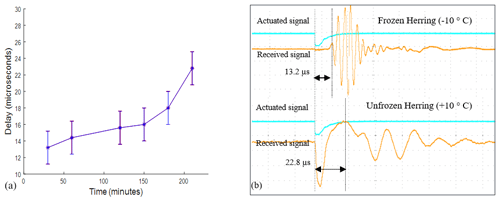
Figure 5Change in signal delay concerning time while a 3 cm-thick herring fish was unfrozen from −10 to +10 ∘C and (b) oscilloscope measurement of the delay signal.
Similar experiments were repeated for herring fish in slices of 3 cm thickness, and there was a slight change in the delay value ranging from 20 % to 27 % in different trials. As shown in Fig. 5, the transmitted signal in blue was sent through one transducer and, after a delay, the receiving transducer picked up the signal. The figure shows the difference in the speed of sound transmission from frozen to unfrozen states. However, as the fish was slowly unfreezing, a new peak in the signal was observed. It is expected that, as more and more ice melts away, the signal through the fish will get stronger, and hence the non-noticeable peaks highlight themselves.
A laboratory-based setup for measuring the changes in ultrasonic signals, concerning the ice content in the food sample, was achieved. The setup could be used on various vegetables, fish, and meat products. A change of 20 %–27 % in the signal delay could be measured for herring fish. Using the same setup on packed chicken soup, a change in the delay signal of 60.7 % was measured (Jha et al., 2022). However, for the ham piece, no significant change in signal could be measured, and more work is required in qualitative analysis for repeated trials. It is suspected that ham contains only 7 %–8 % of added water and, for an experiment based on water properties, it might not be sufficient to reflect a noticeable change in the signal.
Compared to meat or fish products, vegetables like cucumber and beetroot contain a high percentage of water, and the tests on cucumber and beetroot met the expectation of an increasing time delay with increasing water content. However, the relative increase in delay with the size of the food sample was not justified. On the other hand, while testing with the sweet potato sample, no significant difference was observed, regardless of the temperature and physical state.
During the measurement, it was observed that different food products had different responses to freezing. For example, the same length of cucumber when frozen did not have the same reduction in amplitude as beetroot. For some of the soft-food items (vegetables or fish), the shape of the test food changed during unfreezing, and it created missing or loose contacts with the sensor setup. Hence, it is recommended to use a stable mechanical setup that could adapt itself to changing shapes in food and thus ensure stable contact throughout the measurement. To gain more stability in the setup, springs with metal plates were used, but for further enhancements in the setup, a provision of automatic balance in the system with changing shape could be provided. It was also noted that ultrasonic transducers working at different frequencies worked best based on the food type used. For example, 200 kHz transducers provided the best results with beetroot and fish, and the 40 kHz transducers had their best performance only for chicken soup. Thus, it is recommended to find a suitable frequency of operation with respect to the food product.
No data sets were used in this article.
RuJ carried out the experimental work, ReJ helped to design experiments and measurement electronics, and WL supervised the work.
The contact author has declared that none of the authors has any competing interests.
Publisher’s note: Copernicus Publications remains neutral with regard to jurisdictional claims in published maps and institutional affiliations.
This article is part of the special issue “Sensors and Measurement Systems 2022”. It is a result of the “Sensoren und Messsysteme 2022, 21. ITG/GMA-Fachtagung”, Nuremberg, Germany, 10–11 May 2022.
This paper was edited by Jürgen Wöllenstein and reviewed by two anonymous referees.
Aparicio, C., Otero, L., Guignon, B., Molina-Garcıa, A. D., and Sanz, P. D.: Ice content and temperature de-termination from ultrasonic measurements in partially frozen foods, J. Food Eng., 88, 272–279, https://doi.org/10.1016/j.jfoodeng.2008.02.011, 2008.
Archer, D. L.: Freezing: an underutilized food safety technology, Int. J. Food Microbiol., 90, 127–138, https://doi.org/10.1016/s0168-1605(03)00215-0, 2004.
Arnold, G., Leiteritz, L., Zahn, S., and Rohm, H.: Ultrasonic cutting of cheese: Composition affects cutting work reduction and energy demand, Int. Dairy J., 19, 314–320, https://doi.org/10.1016/j.idairyj.2008.11.007, 2009.
Astrain-Redin, L., Abad, J., Rieder, A., Kirkhus, B., Raso, J., Cebrián, I., and Álvarez, G.: Direct contact ultrasound assisted freezing of chicken breast samples, Ultrason. Sonochem., 70, 105319, https://doi.org/10.1016/j.ultsonch.2020.105319, 2021.
Bahceci, K. S., Serpen, A., Gökmen, V., and Acar, J.: Study of lipoxygenase and peroxidase as indicator enzymes in green beans: change of enzyme activity, ascorbic acid, and chlorophylls during frozen storage, J. Food Eng., 66, 187–192, https://doi.org/10.1016/j.jfoodeng.2004.03.004, 2005.
Bhargava, N., Mora, S. R., Kumar, K., and Sharanagata, V. S.: Advances in the application of ultrasound in food processing: A review, Ultrason. Sonochem., 70, 105293, https://doi.org/10.1016/j.ultsonch.2020.105293, 2020.
Carcione, J. M., Campanella, O. H., and Santos, J. E.: A poroelastic model for wave propagation in partially frozen orange juice, J. Food Eng., 80, 11–17, https://doi.org/10.1016/j.jfoodeng.2006.04.044, 2007.
Cheng, X., Zhang, M., Baoguo Xu, B., Adhikari, B., and Sun, J.: The principles of ultrasound and its application in freezing related processes of food materials – A review, Ultrason. Sonochem., 27, 576–585, https://doi.org/10.1016/j.ultsonch.2015.04.015, 2015.
Comandini, P., Blanda, G., Soto-Caballero, M. C., Sala, V., Tylewicz, U., Mujica-Paz, H., Fragoso, A. V., and Toschi, T. G.: Effects of power ultrasound on immersion freezing parameters of potatoes, Innov. Food Sci. Emerg. Technol., 18, 120–125, https://doi.org/10.1016/j.ifset.2013.01.009, 2013.
El-Kadi, A. Y., Moudden, A., Faiz, B., Maze, G., and Decultot, D.: Ultrasonic monitoring of fish thawing process optimal time of thawing and effect of freezing/thawing, Agricultural University of Poznan Press, 12, 273–281, http://hal-normandie-univ.archives-ouvertes.fr/hal-02167130 (last access: 21 April 2022), 2013.
Gallo, M., Ferrara, L., and Naviglio, D.: Application of Ultrasound in Food Science and Technology: A Perspective, MDPI Foods, 7, 164, https://doi.org/10.3390/foods7100164, 2018.
George, R. M.: Freezing processes used in the food industry, Trends Food Sci. Tech., 4, 134–138, https://doi.org/10.1016/0924-2244(93)90032-6, 1993.
Jha, R., Lang, W., and Jedermann, R.: Monitoring of defrosting in food by ultrasound measurement techniques, Sensoren und Messsysteme 21. ITG/GMA-Fachtagung, 10–11 May 2022, Nuremberg, Germany, 303, 492–495, https://ieeexplore.ieee.org/abstract/document/9861935 (last access: 5 September 2022), 2022.
Ken, M., Knochel, R., Daschner, F., Schimmer, O., Tejada, M., Huidobro, A. Nunes, L., Batista, I., and Martins, A.: Determination of the quality of frozen hake using its microwave dielectric properties, Int. J. Food Sci. Tech., 40, 55–65, https://doi.org/10.1111/j.1365-2621.2004.00910.x, 2005.
Llave, Y., Terada, Y., Fukuoka, M., and Sakai, N.: Dielectric properties of frozen tuna and analysis of defrosting using a radio-frequency system at low frequencies, J. Food Eng., 139, 1–9, https://doi.org/10.1016/j.jfoodeng.2014.04.012, 2014.
Popkin, B. M.: Contemporary nutritional transition: determinants of diet and its impact on body composition, Proc. Nutr. Soc., 70, 82–91, https://doi.org/10.1017/S0029665110003903, 2011.
Schneider, Y., Zahn, S., Schindler, C., and Rohm, H.: Ultrasonic excitation affects friction interactions between food materials and cutting tools, Ultrasonic, 49, 588–593, https://doi.org/10.1016/j.ultras.2009.03.001, 2009.
Taufiq, M. K. M., Ibrahim, S., Mohd, A. M. Y., and Faramarzi, M.: Contact and non-contact ultrasonic measurement in the food industry: A review, Meas. Sci. Technol., 27, 012001, https://doi.org/10.1088/0957-0233/27/1/012001, 2015.
Vogt, C., Karim, L., and Christopher, K. W.: Speed of sound in bubble-free ice, J. Acoust. Soc. Am., 124, 3613, https://doi.org/10.1121/1.2996304, 2009.
Zhu, L., Spachos, P., Pensini, E., and Plataniotis, N. K.: Deep learning and machine vision for food processing: A survey, Current Research in Food Science, 4, 233–249, https://doi.org/10.1016/j.crfs.2021.03.009, 2021.


