the Creative Commons Attribution 4.0 License.
the Creative Commons Attribution 4.0 License.
 | 15 Jun 2023
Metrological assessment of a robotic total station for use in post-earthquake emergency conditions
Giulio D'Emilia
Emanuela Natale
The paper provides synthetic indications regarding the measuring performances of procedures for using a robotic total station (RTS) in emergency situations, such as the survey of the structural conditions of buildings and the assessment of the safety level for rescue operations after the occurrence of an earthquake. Particular attention is paid to operative aspects that could impact on the performance of the system in this situation; specifically considered is the effect of the layout of the measurement setup and of the number of monitoring points, depending on the geometry of the site and of the considered buildings, because the criticality of emergency conditions imposes geometrical solutions which are far from having optimal solutions. The analysis is carried out with reference to two different buildings, which have different characteristics from the point of view of height and distance from the instrument, and that implies different geometrical constraints for the instrument during the acquisition of the monitoring points. The methodology allows the evaluation of the repeatability, reproducibility, and detection limit of a RTS, in field conditions, referring to a 1-year observation period, with reference to different quantities, like positions of the monitoring points and the inclination of walls and façades. In particular, the analysis of the geometrical characteristics of reduced configurations of the monitoring points has highlighted interesting aspects in view of defining a simplified procedure, which is also suitable for speeding up the acquisition of reliable data in emergency conditions.
- Article
(5733 KB) - Full-text XML
- BibTeX
- EndNote


The use of mobile mapping systems (MMSs), like terrestrial laser scanning (TLS) or robotic total stations (RTSs), is becoming to be more and more widely used in standard and innovative geodetic structural validation and modeling, geological analysis, and safety tasks (Kalvoda et al., 2021; Tobiasz et al., 2019); in fact, if only a few of the many practical examples are considered, then such systems have been used as a support in structural analysis to determine the displacements and deformation of the timber beams of a building (Kovacic et al., 2021), to monitor the static and dynamic behavior of big structures like bridges (Kwiatkowski et al., 2020), to monitor buildings (Alicandro et al., 2021) and tunnels (Sun et al., 2020), or to monitor large areas for geological studies (Franzini et al., 2021). As a very particular task, the use of these geomatic instruments could be highlighted also for forensic applications, like crime scene reconstruction or documenting different kinds of scenes (Berezowski et al., 2020).
The motivation for why these systems are so largely used is mainly due to their ability to supply, in a comfortable way and a relatively short time, measurement data which are automated, meaningful, representative of the whole scenario, and accurate (Kovacic et al., 2021; Alicandro et al., 2021).
Nevertheless, assessing the uncertainty in the measured data is a mandatory task, if reliable suggestions for decision-making are needed, especially in safety applications, which is not a trivial task. In fact, many uncertainty causes could be individuated, which are instrumental, environmental, and derive from operating and data processing aspects (Tobiasz et al., 2019), which are difficult to consider in a coherent, exhaustive, and synthetic uncertainty budget.
Many very detailed and deepened studied can be found in the literature about the uncertainty evaluation of TLS or RTSs, with reference to their performances in laboratory conditions (Siaudinyte and Suh, 2015; Siaudinyte and Grattan, 2016; Kersten et al., 2021; Kersten and Lindstaedt, 2022) and in the field (Sun et al., 2020; Kersten et al., 2021; Kersten and Lindstaedt, 2022).
Furthermore, as for field measurements, the effect on the accuracy of specific interfering quantities is also studied, like the influence of the position and number of the control points (Kalvoda et al., 2021), the effect of the shape of the target points and the algorithms used to identify the reference systems putting all the measurements together (Janßen et al., 2019, 2022), and the effect of the Sun and of the power supply status (Beshr and Abo Elnaga, 2011). The time stability of both systems is also of concern, especially when the monitoring of structures during a long interval of time is carried out, which has been studied in Janßen et al. (2021) and Medić et al. (2020).
Standards also are available concerning the validation of measurements carried out with RTSs (ISO 17123 – 5:2018a) and TLS (ISO 17123 – 9:2018b). The standards present simplified and full measurement procedures in order to consider different operating situations, and guidelines for the estimation of uncertainty are also given for both cases. As further evidence of the careful attention to the practical aspects concerning accuracy, one standard series is provided by VDI/VDE, where three different independent test methods are presented to investigate geometric accuracy of terrestrial laser scanners under laboratory conditions. This includes the (a) distance measurement accuracy to black/white (B/W) targets and spheres on the 20 m comparator track, (b) comparison of spatial distances in the 3D test field on B/W targets, and (c) investigation of the flatness measurement (VDI/VDE Richtlinien 2634, part 1-2-3:2002). Examples of the uncertainty estimation for measurements of both RTSs and TLS are given in Kersten et al. (2021) and Kersten and Lindstaedt (2022), according to the standard procedures described in VDI/VDE -Richtlinien 2634 (2012), which is a useful contribution for understanding the performances of the geomatic systems when a standard condition should be guaranteed.
Nevertheless, even though the scenario of scientific work devoted to the accuracy assessment of these measuring systems is widely known and well described, the number of uncertainty causes is so high (Tobiasz et al., 2019), and also the way that the system could be calibrated has such variety, that it is difficult to obtain quantitative information for uncertainty by taking into account the specific application of interest.
An interesting attempt to give a quantitative evaluation of the uncertainty in the measurements systems that are generally valid is given in Kassotakis and Sarhosis (2021); in fact, for both systems, RTSs and TLS, a sub-centimeter (intended as being less than 1 cm) accuracy is provided. For comparison, it is useful to refer to the manufacture's specification, which suggests a typical measurement uncertainty in the high-level systems that is of the order of 1 mm. Of course, a different uncertainty level could be reached if the evaluation of accuracy is carried out in the laboratory or field, with both contexts being different in terms of the strength and the effect of the interfering quantities. Furthermore, it should be also considered whether measurements are taken into account in terms of relative position, distance, inclination, and relevant angle.
For in-field measurements, the dimensions of the structure to be monitored are relevant, according to the possibility that a roof, a single building, or a bridge has to be monitored (Kovacic et al.,2021; Kwiatkowski et al., 2020).
As a further example, the magnitude of the estimated difference with respect to the reference is varying in the range ± 2 mm if a distance is considered to be of the order of a few tenths of meters (Kersten et al., 2021).
A final element to be considered is the way in which the instruments are calibrated. The literature, the laboratory (Siaudinyte and Suh, 2015; Siaudinyte and Grattan, 2016), and the standards for both RTSs and TLS suggest different possible ways (Kersten et al., 2021; Kersten and Lindstaedt, 2022). Cross-comparison is also used for calibration, meaning that the RTSs are, in general, able to validate the TLS, due to a reduced uncertainty with respect to the latter (Kovacic et al., 2021; Kwiatkowski et al., 2020; Sun et al., 2020). Last, but not the least, some considerations could be found suggesting the operation of an in situ calibration by empirical methods after the canonical calibration is carried out in an accredited laboratory for optimized results (Medić et al., 2020).
Bearing the above considerations in mind, the aim of this work is to add some useful metrological and experimental information that is able to improve the capability of the operator to assess the uncertainty in the mobile geodetic system, with particular reference to the following aspects:
-
the effect of the layout of the measurement setup and of the number of monitoring points, depending on the geometry of the site and of the studied buildings, when the criticality of the situation imposes geometrical solutions which are far away from solutions according to a very good practice;
-
the repeatability and reproducibility assessment of RTSs and TLS in the real-world situation for the evaluation of the uncertainty budget (D'Emilia et al., 2018), with reference to assessments in a short period of time or to the monitoring of buildings over time;
-
the effect of the skill of the operator, who will not necessarily be an expert at using the instrumentation or very involved in the fulfilling of a standardized procedure and mainly being involved in emergency post-earthquake operations, actions, and risks.
In fact, just after an earthquake, most resources are spent on evaluating the level of damages suffered by buildings and infrastructure, both in the immediate aftermaths of the event, to support the logistics of the rescue itself and to assess the level of safety of the rescue operations, and in the following phases, to implement provisional measures able to secure buildings and, in particular, the cultural heritage; all of these tasks require that the measurement data uncertainty is known in an accurate way, so that reliable decisions and actions are taken. However, this uncertainty estimate must take into account the particular constraints imposed by the emergency situation, such as spatial constraints, due to the limited space often available, and time constraints that affect the number of points that can be acquired. Another aspect that differentiates this application from the others commonly studied is represented, as mentioned, by the characteristics of the operators who, although trained for the execution of this type of measurements, are focused on dealing with the emergency. The novelty that the authors believe can be offered by this work consists precisely of providing quantitative indications on how such constraints and conditions can influence the uncertainty found in the results.
The paper will describe the methodology in order to carry out the uncertainty assessment of RTSs and the motivations for the choosing of the specific location; then the results of measurements will be described, covering 1 year of monitoring. A discussion of them will allow us to highlight some interesting aspects, which will be outlined in Sect. 4 at the end of the paper.
The test area is a square surrounded by three buildings and a tower. Two buildings in the square have been considered for the analysis, namely one house, called “Building 1” and one tower, called “Building 2”, which is in front of it (Fig. 1).
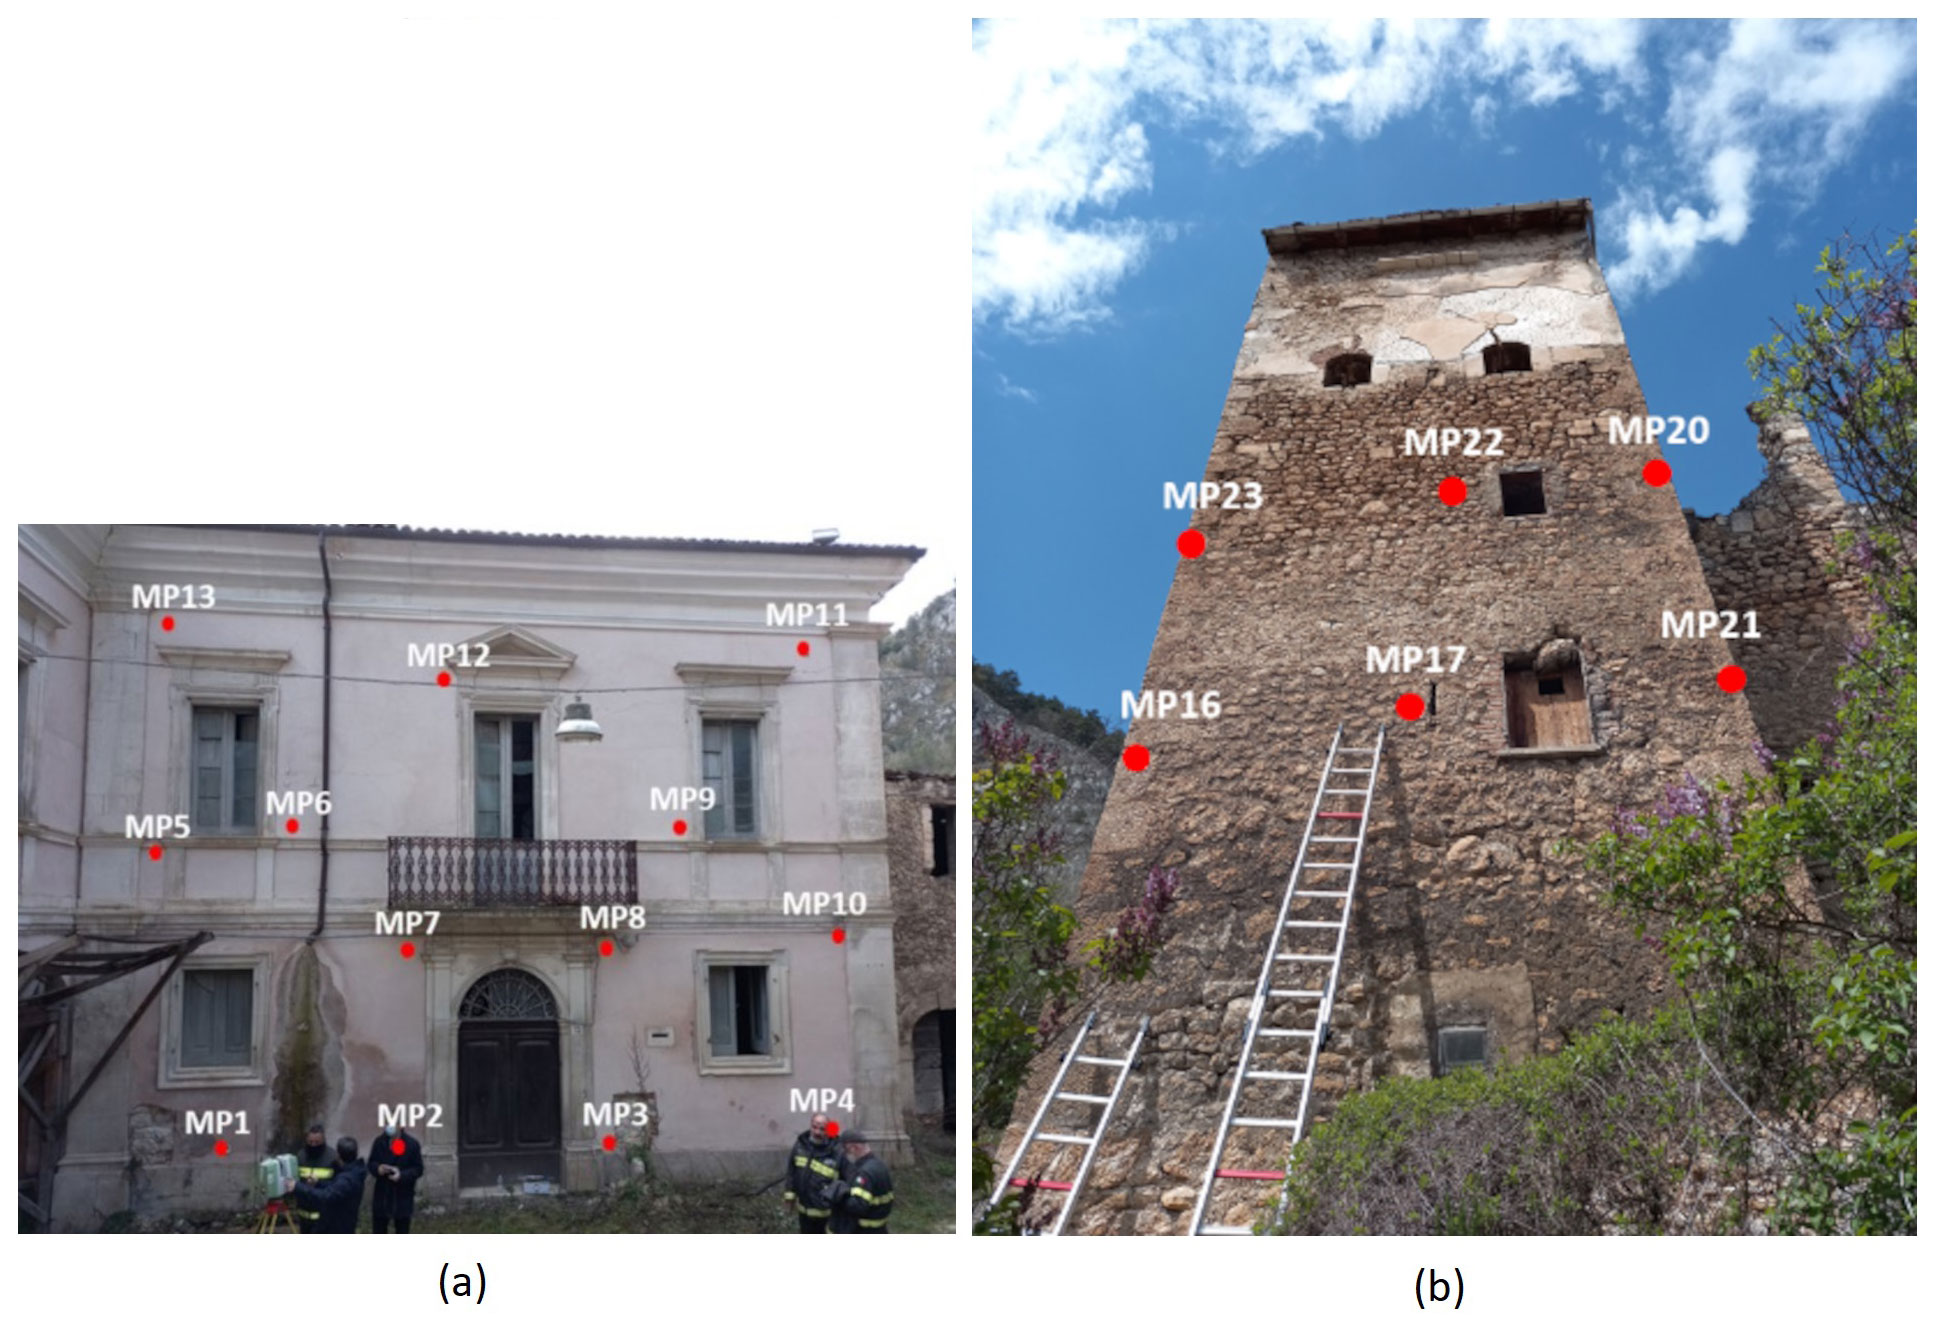
Figure 1Monitoring points (MPs) on the considered buildings. (a) Building 1. (b) Building 2.
These buildings have been chosen as test cases for the analysis, as they have different characteristics from the point of view of height that implies different angles of rotation of the instrument for the acquisition of the monitoring points located on the buildings.
The total station is placed between the two buildings, in such a way as to have complete visibility of both structures.
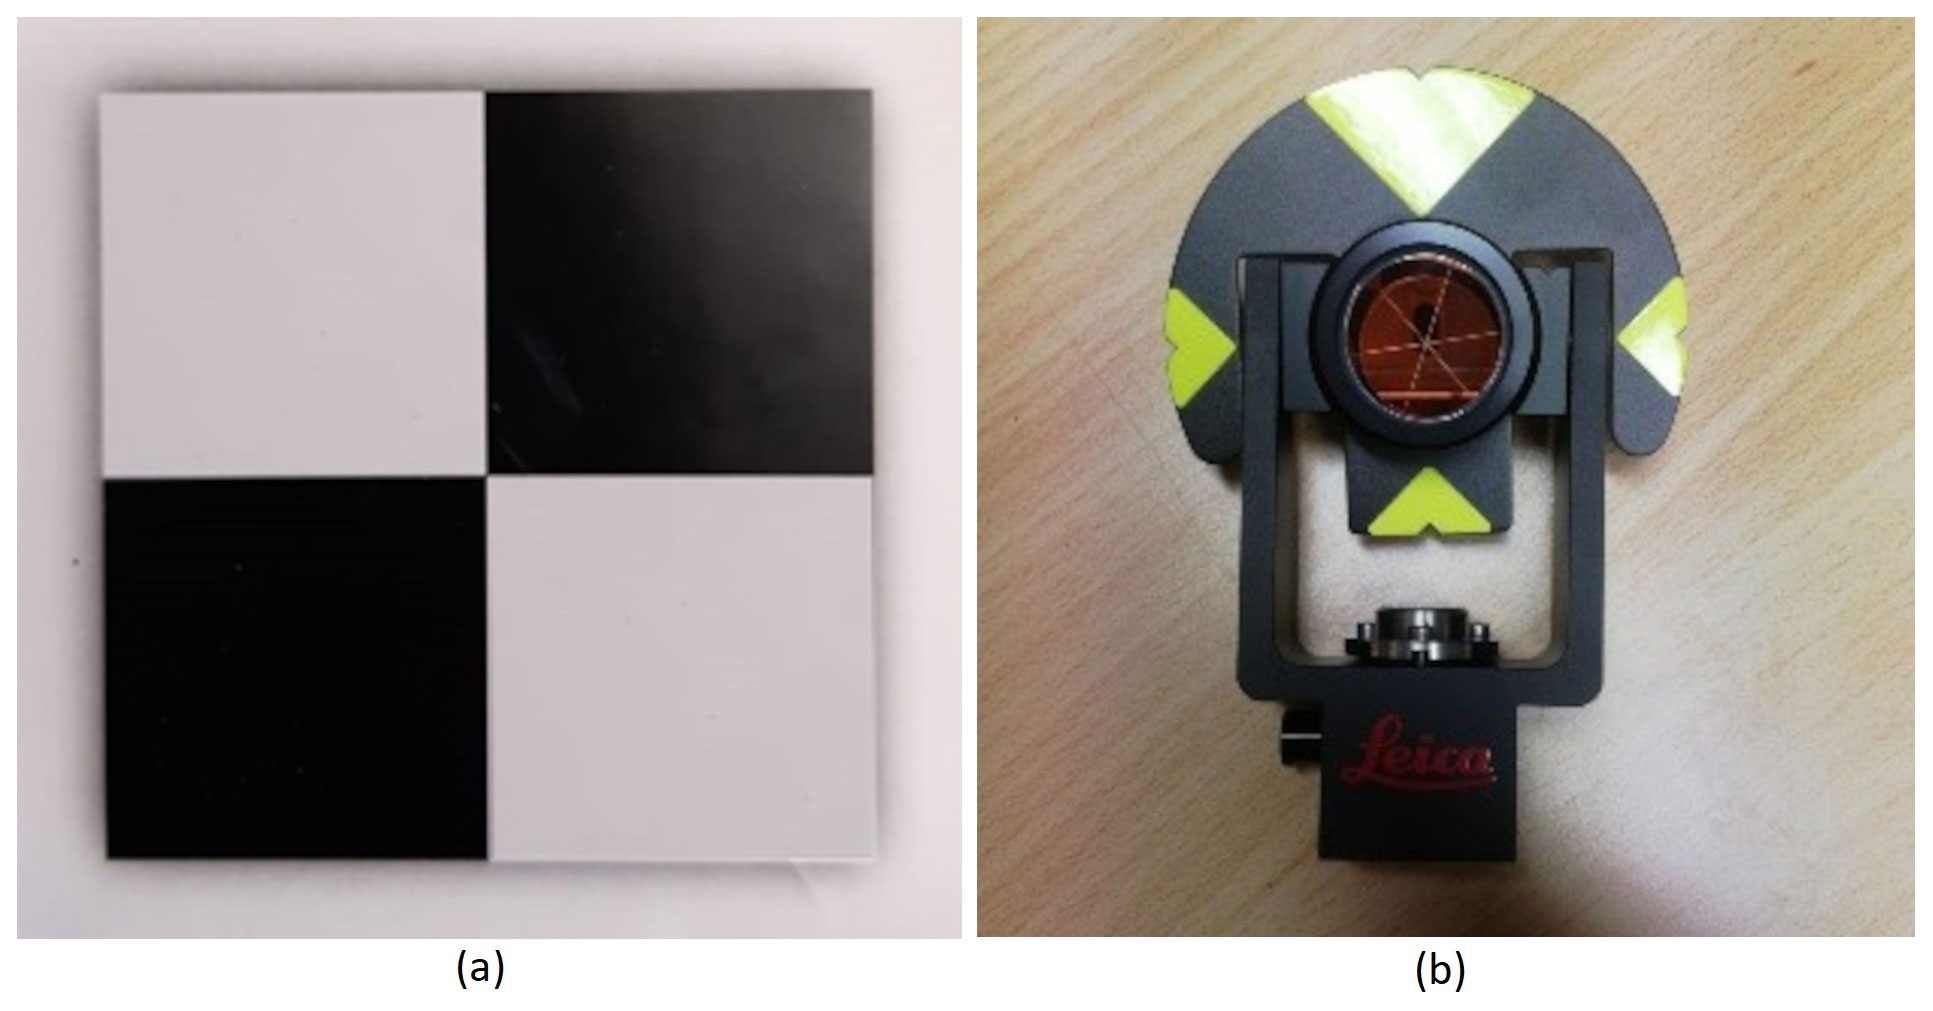
In total, 13 monitoring points have been positioned on Building 1 and 6 on Building 2; instead, seven reference targets have been placed in independent positions deemed stable, so as to be able to repeat the acquisitions after a few days, which entails relocating the instrument but always referring to the same reference system. At the reference points, prisms are used; at the monitoring points, black/white targets (Fig. 2) are attached to a flat base and glued to the wall by epoxy resins to have identifiable reference positions on which to impose known displacements in order to evaluate the behavior of the instrument. The black/white targets used for the analysis have reflectivity characteristics similar to those of a common building wall. In this way, the results obtained in this study could be extended to the real applications, when the laser beam is projected directly on the wall of the buildings, as it is not possible to apply targets in emergency situations for reasons of time and security.
It is worth noting that the configuration analyzed is optimal from the point of view of the number and location of the reference points (1), in order to focus the study on the effect of the number and positioning of the monitoring points. In the continuation of the work, the effects of a non-optimal configuration for the reference points will also be analyzed.
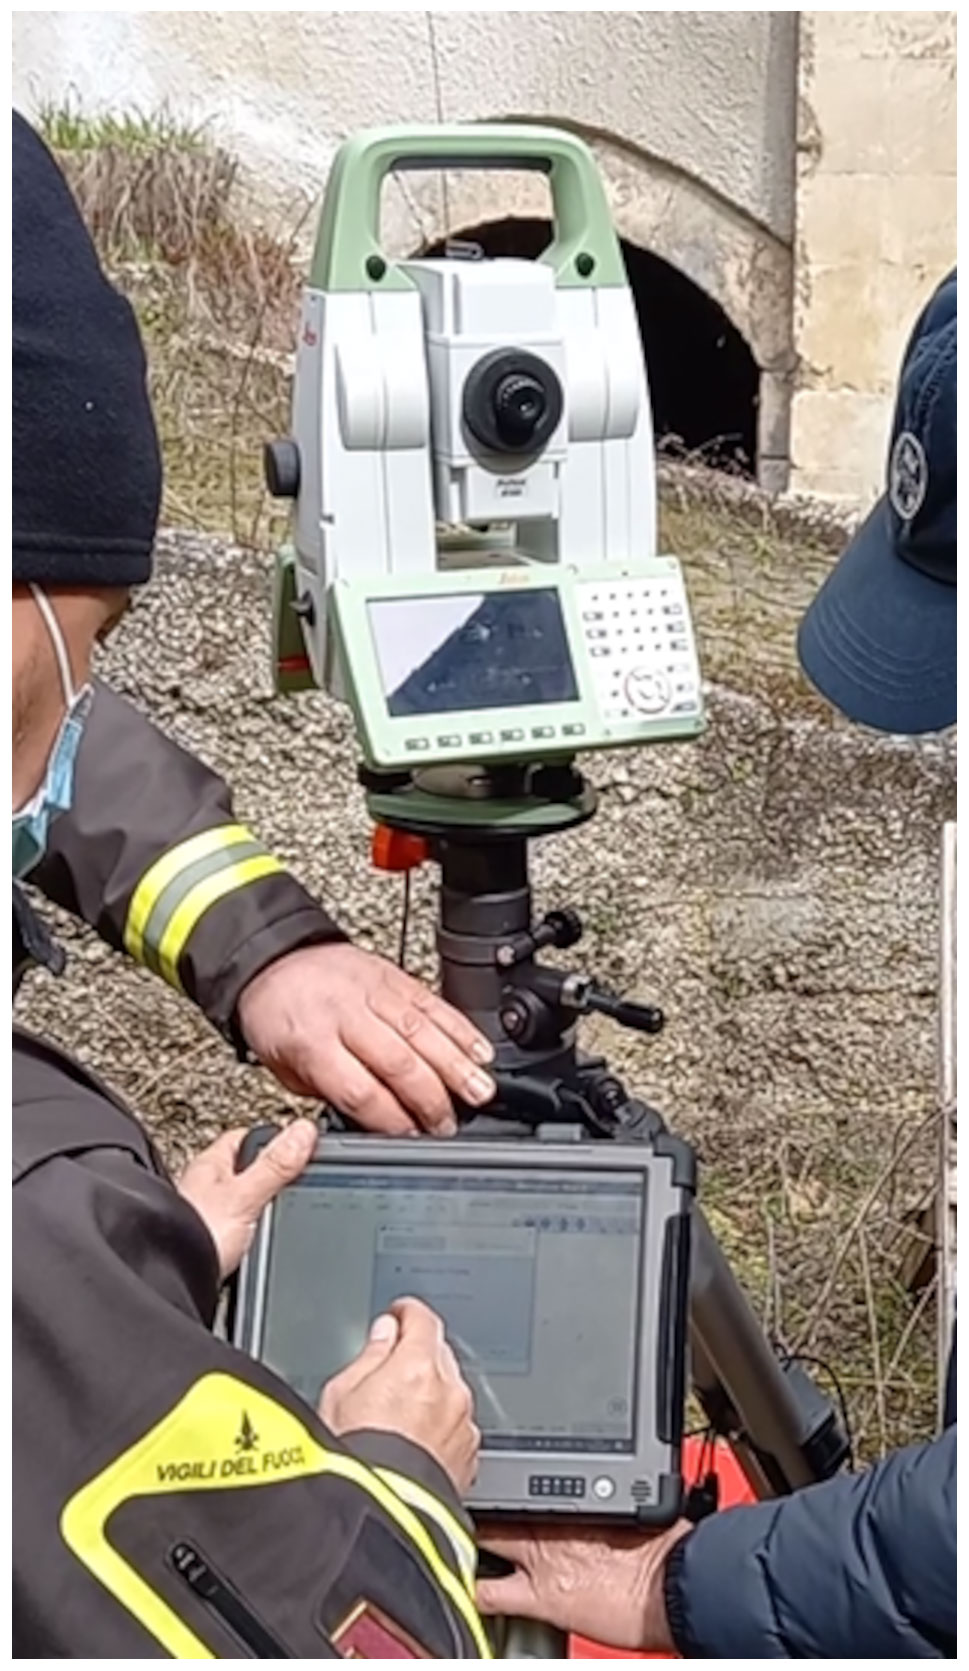
The SafeR system (Fig. 3), by Leica Geosystems, used to carry out the measurements, is a customized system specifically developed for the needs of firefighters and which, in particular, provides user-friendly software focused on the acquisition of information in a short time. It is composed of the following:
-
a total station, model TS16 Imaging, which measures azimuthal and zenithal angles and distances from the instrumental center to the monitoring point. These polar coordinates are transformed by the system into Cartesian coordinates (X, Y, Z).
-
SafeR software, which manages the total station and its acquisitions.
-
a tablet PC, with software installed on it that is able to communicate with the Leica total station wirelessly or by dedicated cabling.
All the preliminary operations, required by the standard procedures for using this kind of equipment (e.g., fixing the tripod to the ground and leveling), have been correctly carried out. The measurements are carried out by manually pointing by the laser, with the help of a viewfinder, at the monitoring points in a first series of acquisitions; in subsequent acquisitions, the instrument automatically carries out the measurements on the points initially identified, either in repeatability tests or even after a long time, as long as the reference targets remain stable in their positions.
A coordinate system has been defined with reference to Building 1, the house, in such a way that the origin of the system in on its façade, the z axis, is vertical (in the direction of the vertical axis of the instrument) and its zero is at the height of the instrument, the y axis, enters the wall of the house.
It should be noted that all of these operations (preliminary installation and adjustment actions, pointing of the monitoring and reference targets, reference system definition, etc.) have been carried out by operators of the National Fire and Rescue Service for the purpose of including any contribution due to the operator in the assessment of uncertainties.
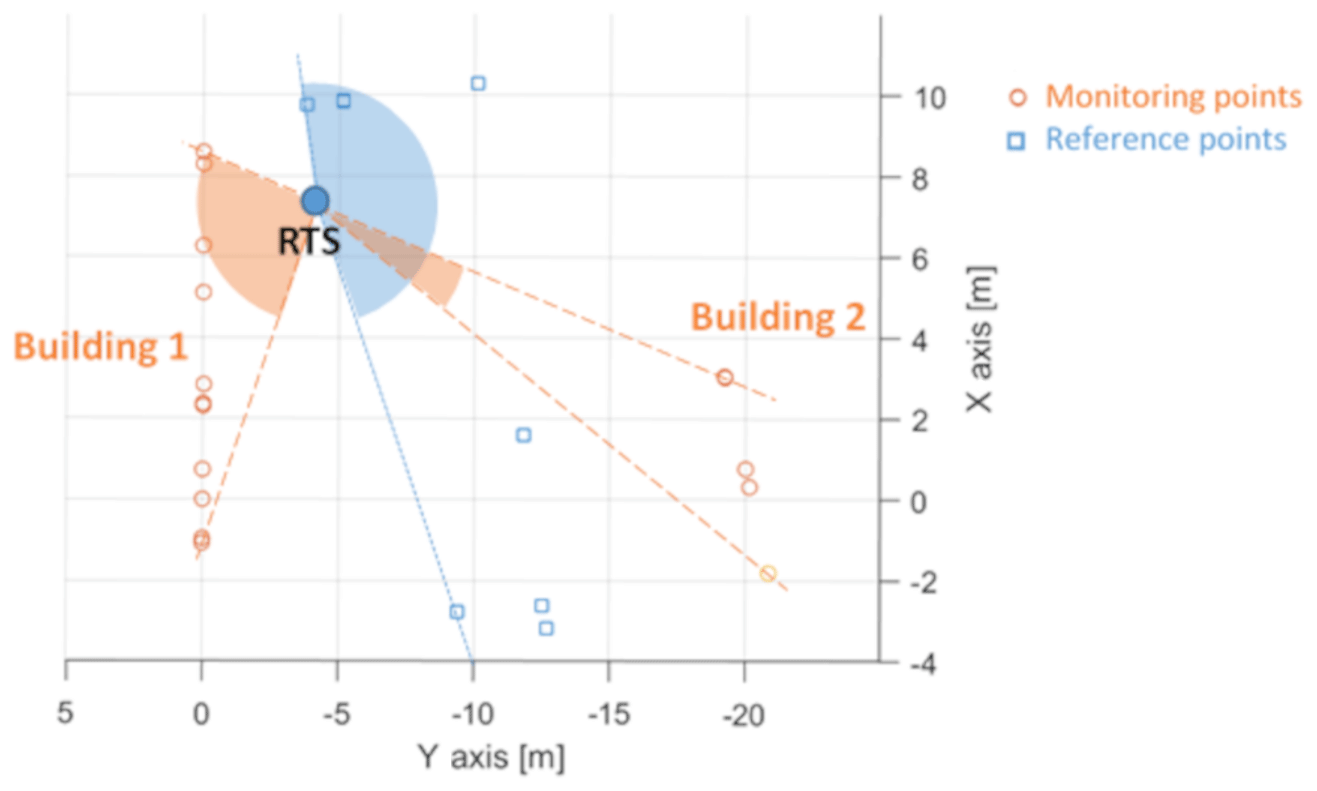
Figure 4 shows the position of the RTSs with respect to the monitoring and reference points in the top view. In particular, the horizontal maximum rotation angle of the total station (TS) for the direction of all reference points is ∼160∘ and, with reference to the monitoring points, the horizontal rotation angles are ∼80 and ∼13∘ for Buildings 1 and 2, respectively. Instead, the maximum vertical rotation angle of the TS, with respect to the horizontal plane, is ∼48∘ for the reference points and ∼56 and ∼39∘ for the monitoring points on Buildings 1 and 2, respectively.
The methodology provides the acquisition of 20 repeated measurements for each monitoring point indicated in Fig. 1.
Measurements have been carried out on the first day (day 1), repeated after 1 year (day 2), and, subsequently, after 3 d (day 3) to investigate the repeatability and reproducibility behavior of the instrument.
Then, the following comparisons have been carried out:
- a.
between monitoring points, to identify the points characterized by greater variability;
- b.
between measurements obtained within a few days, in terms of the distances between the points and slope of the façade;
- c.
between measurements obtained 1 year away, in terms of distances between points and slope of the façade;
- d.
between coordinates (y coordinate, in particular) of the monitoring points, before and after applying tablets of known thickness to them;
- e.
among slopes of the façade obtained on the basis of different reduced point configurations, with respect to the reference configuration (REF), which includes all of the monitoring points.
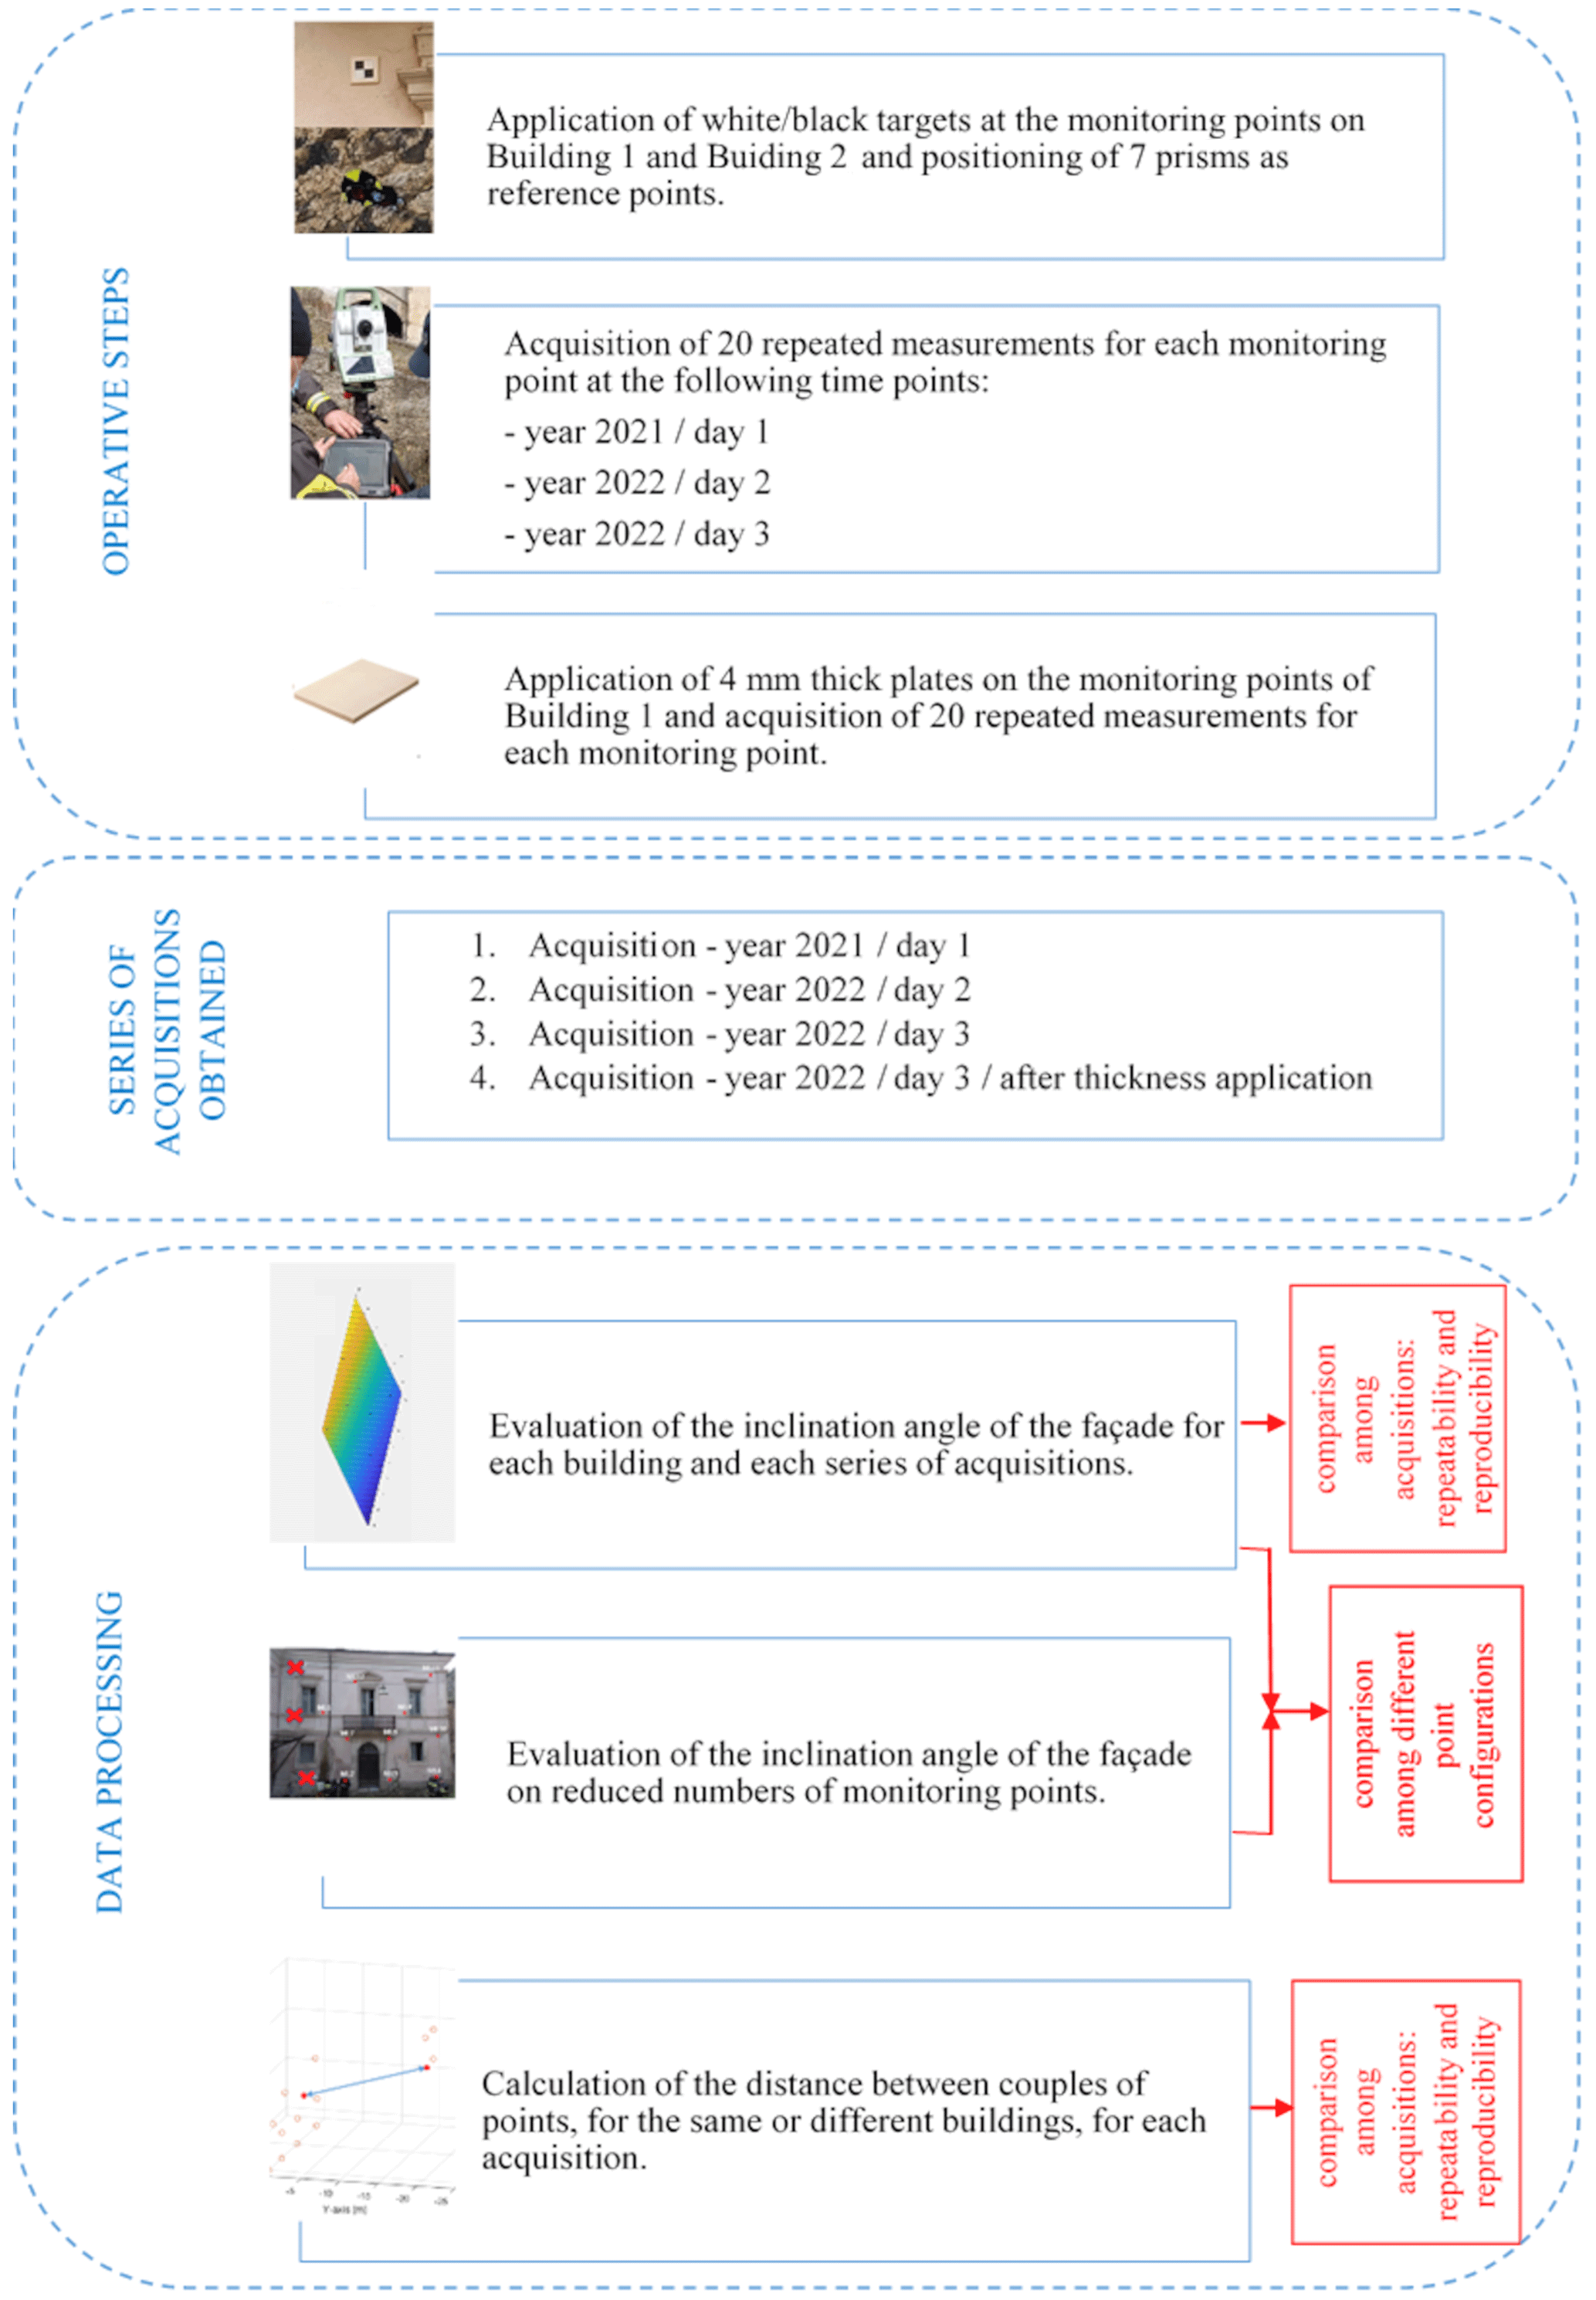
The whole methodology is described in Fig. 5, in terms of the operative steps,series of acquisitions analyzed, and data processing.
This approach aims to provide information on the following interesting aspects of the method for the purpose of defining procedures in emergency conditions:
-
the repeatability and reproducibility,
-
the detection limit,
-
the effect of the distance and angle of rotation of the RTSs in measuring the monitoring points, and
-
the effect of different configurations of monitoring points on the calculation of the slope of a façade.
Evaluations of the repeatability and reproducibility are all made with reference to the Euclidean distances calculated between the monitoring points, known as the coordinates of each point. These distances can relate to pairs of points located on the same building (Building 1 or Building 2) or on different buildings (Buildings 1–2).
The results of the tests carried out highlight both the instrumental and procedural aspects that influence the metrological behavior of the instrument.
The main results of the experimental campaign can be summarized according to the following:
- a.
the repeatability calculated on 20 consecutive repeated measures during the same day (total acquisition time of ∼40 min),
- b.
the repeatability calculated on measurements carried out over a few days,
- c.
the reproducibility calculated on repeated measurements after 1 year,
- d.
a check of the system measurement threshold, applying a 4 mm thickness to the monitoring point,
- e.
the calculation of the slope of the façades in all the examined situations (day 1, day 2, and day 3), and
- f.
a comparison among slopes of the façade, calculated on the basis of reduced configurations of monitoring points.
The results of tests (a–c) are summarized in the graph of Fig. 6, where the standard deviation of the distance measurements is represented with reference to the three considered situations, namely the repeatability of the 20 consecutive repeated measures during the same day (day 2), the repeatability within 3 d (comparison of day 2 with day 3/2022), and the reproducibility on the basis of 1 year (2021–2022).
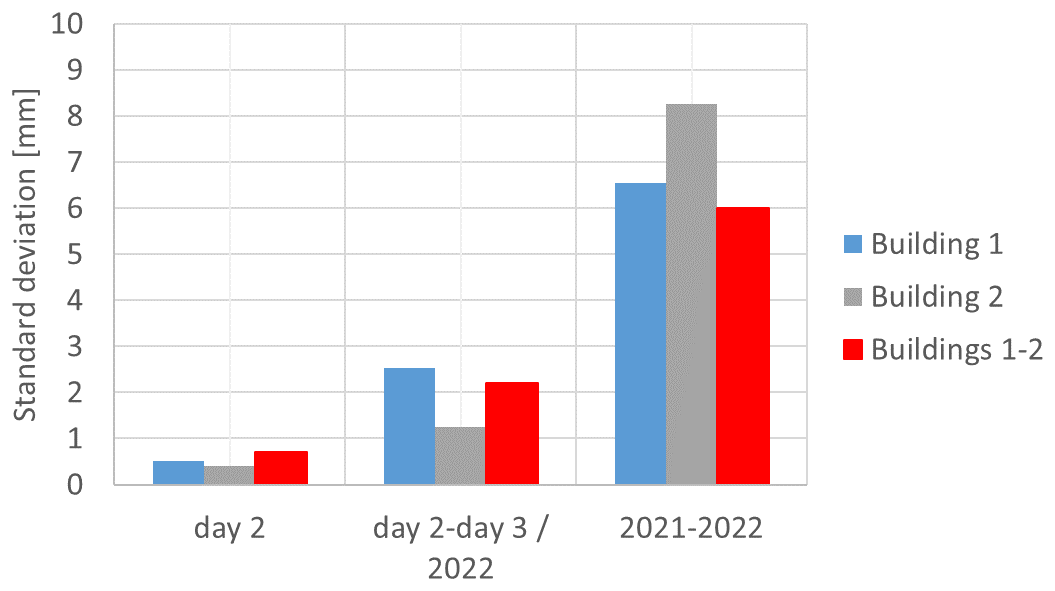
Figure 6Variability in distances calculated on 20 repeated measurements (day 2), measurements within 3 d (day 2–day 3/2022), and measurements after 1 year (2021–2022).
It should be noted that the standard deviation has been calculated as the maximum root mean square in the case of the repeatability on the 20 repeated measures; in the other two cases, it has been calculated on the basis of the differences between the distances determined after 3 d and those determined after 1 year, respectively. In particular, in these cases, the standard deviation is obtained as the maximum difference (Dmax) divided by the square root of 3 (.
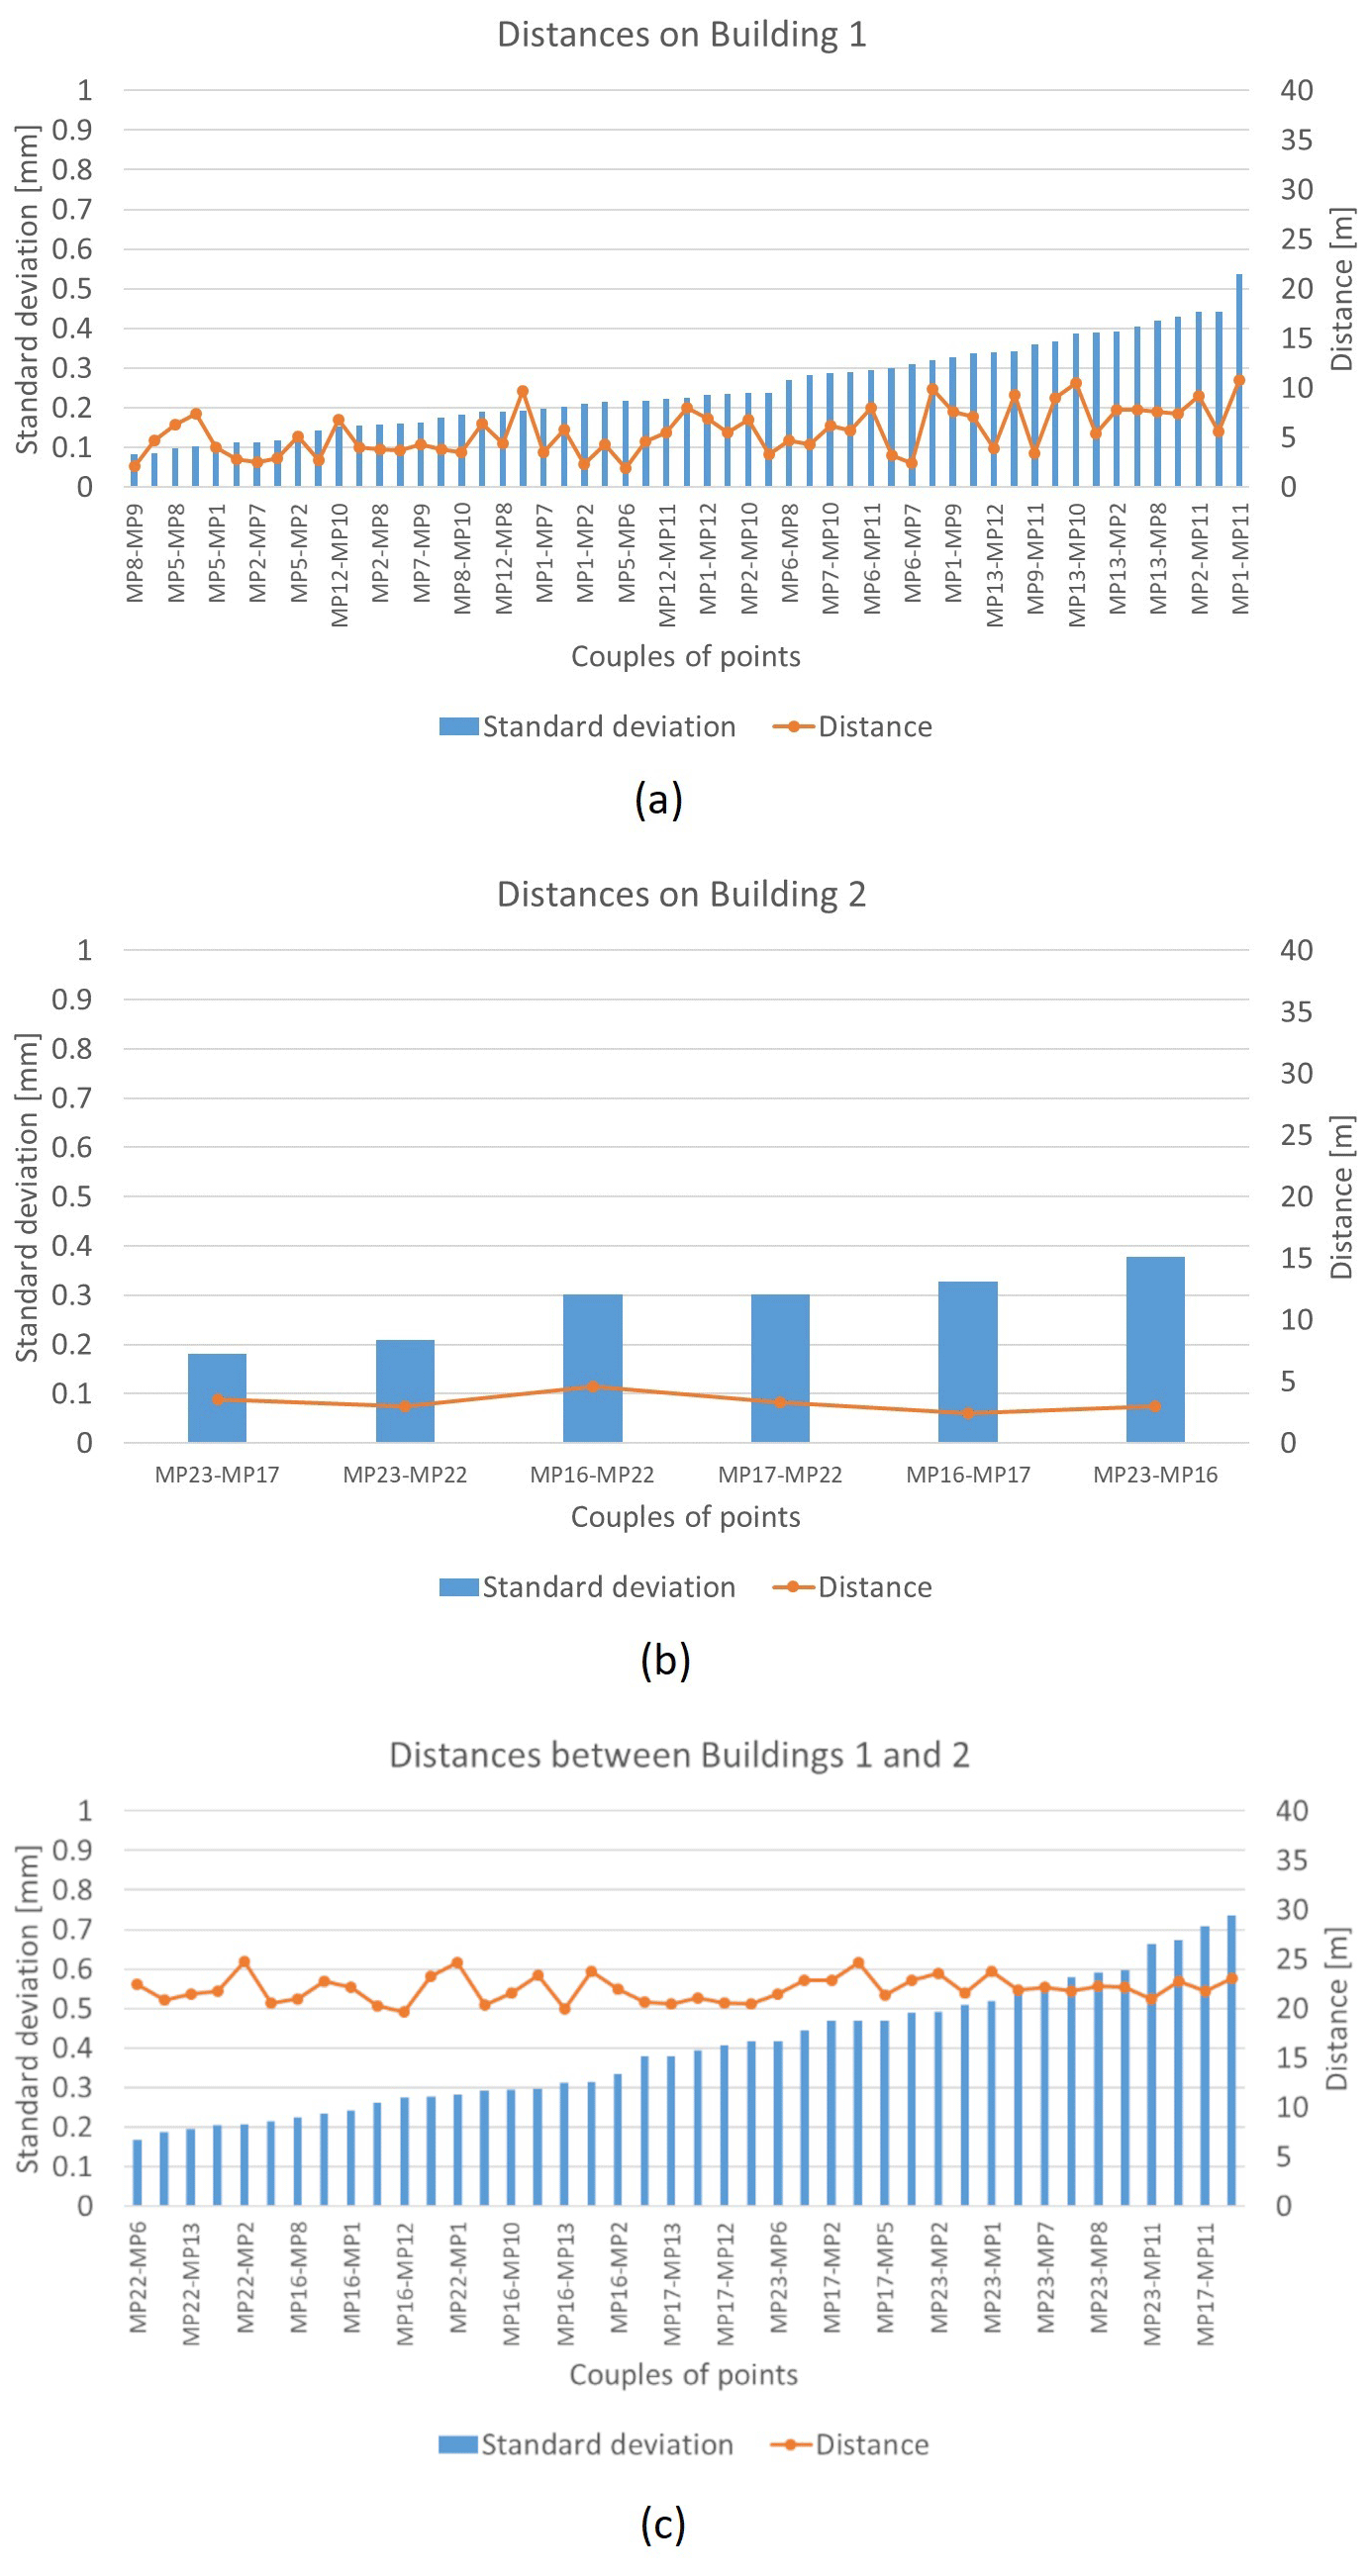
Figure 7Distances and their variability between points on (a) Building 1, (b) Building 2, and (c) Buildings 1 and 2.
The variability, to be intended as repeatability over a short period of time, is less than a millimeter, which is in line with the manufacturer and the indications in the literature (Kersten et al., 2021); within a few days, it is about 2 mm. It reaches 8 mm for measurements after 1 year, which is the case of reproducibility estimation. In fact, it is necessary to consider that for these measurements different operators, different environmental conditions and different configurations are involved. Furthermore, it must be considered that some small surface deformations may have taken place after 1 year.
If a more detailed analysis is carried out with reference to the single distances between pairs of points, other interesting observations can be made. Figure 7 shows the standard deviations calculated on the same day (day 2) for all the distances between the points on Building 1, Building 2, and Buildings 1 and 2. Note that the following applies.
-
The variability in the distances is greater for Building 1 than on Building 2; regarding the latter, the standard deviations are also more uniform.
-
The variability in the distances to Building 1 is greater for distances that involve points MP11, MP12, and MP13, which are those with the highest altitude and highest angles of rotation with respect to the horizontal plane (40–60∘), as can be seen in Fig. 1.
-
Distances between buildings have the greatest variability, as expected, given the greater distances between the points themselves.
With reference to test (d), Fig. 8 shows the calculated means and standard deviations for the monitored points on the house. The mean difference in the measured distance is 3.5 mm, if all the measuring points are considered, after installing a 4.0 mm thickness. It can be also noticed that points MP12 and MP13 are those for which the determination of the thickness is more critical, as can be deduced from the graph; when excluding these points, in fact, the mean is equal to 3.9 mm. Evidently, even in this case, the angle of rotation has an influence on the results.
With reference to test (e), Table 1 shows the slopes of the façades, calculated on the basis of point acquired on day 1, day 2, and day 3.
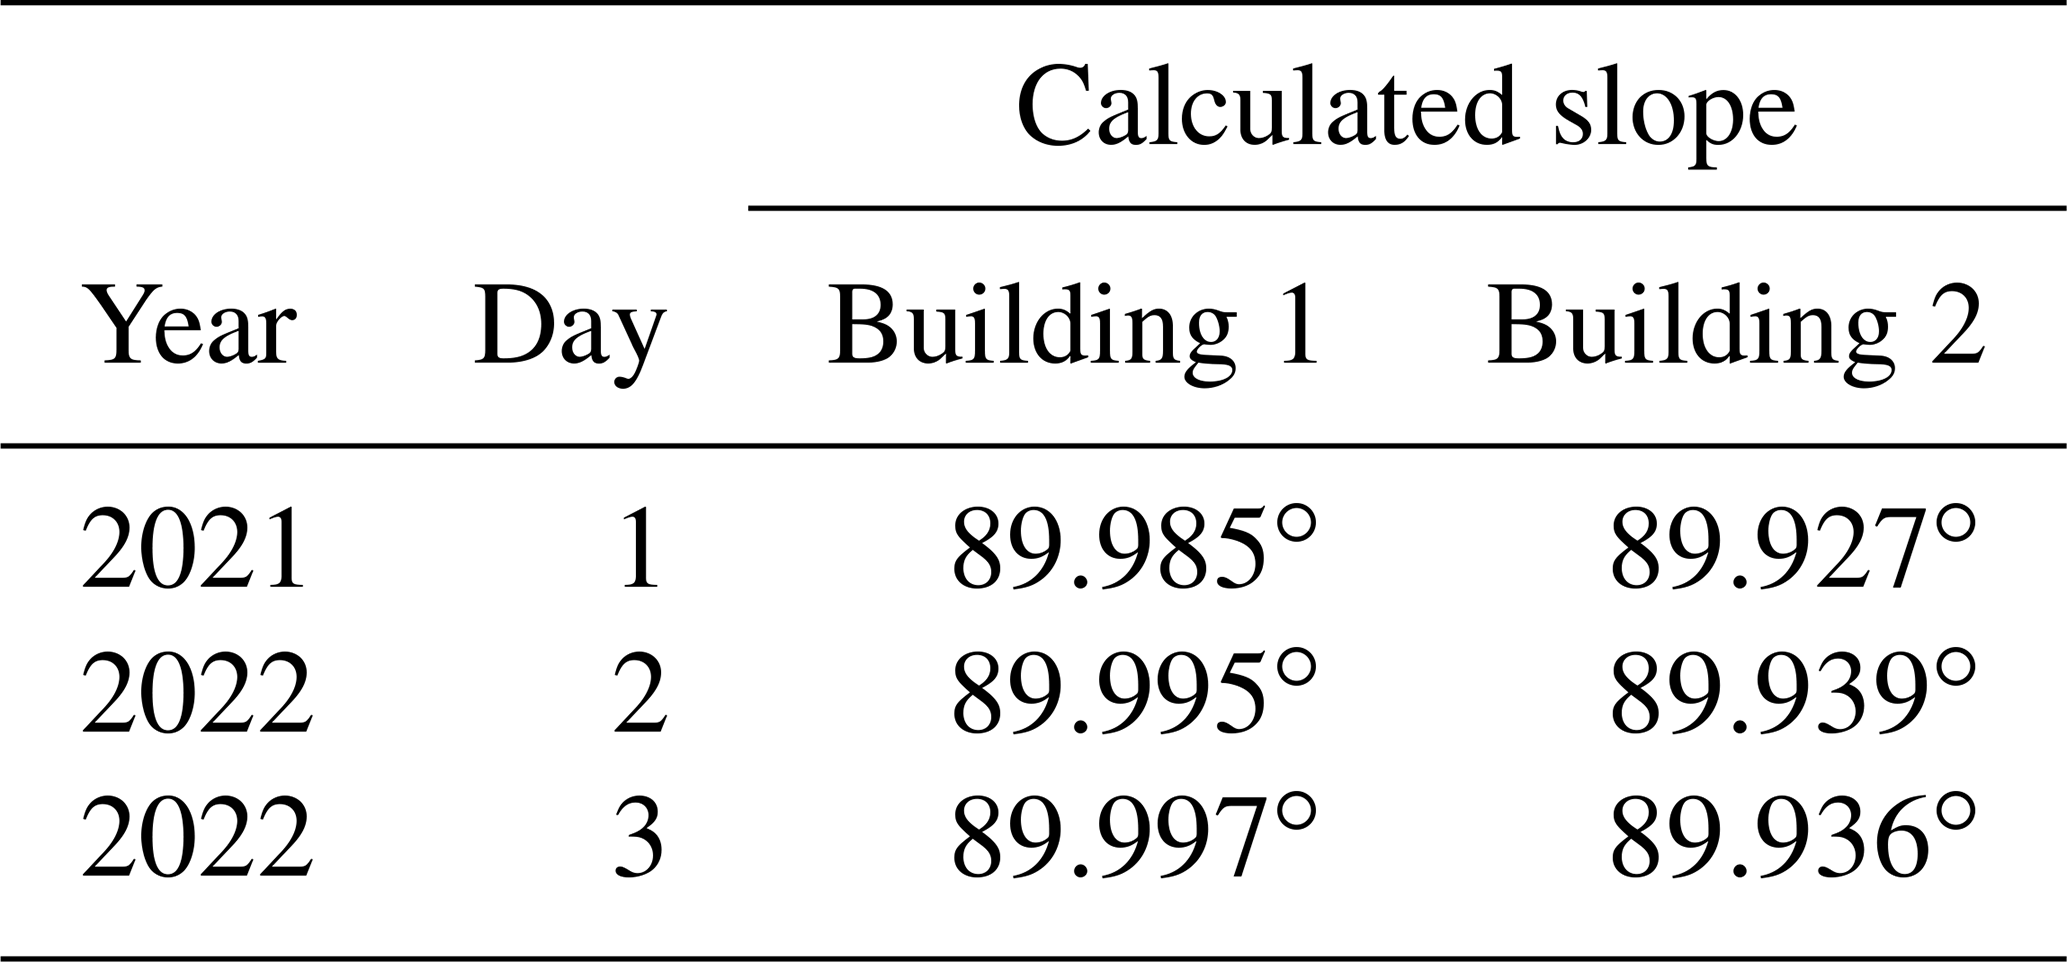
As can be deduced from the data of Table 1, if the façade's vertical inclination is considered, then repeatability is of the order of 4”, and the reproducibility value is of the order of 30”.
Finally, interesting information can be obtained from the analysis of the slopes calculated on reduced configurations of monitoring points (test f), shown in Fig. 9. It is noted that the use of extreme points only (configuration 10) is the solution that, with the least number of points, allows us to obtain a slope closest to that calculated on the basis of the reference configuration. In general, the choice of a set of points that contains positions located at the base and at the highest level of the building provides better results (configurations 5–10). These results provide useful suggestions for the definition of guidelines for the simplification of RTS measurement procedures in emergency conditions.
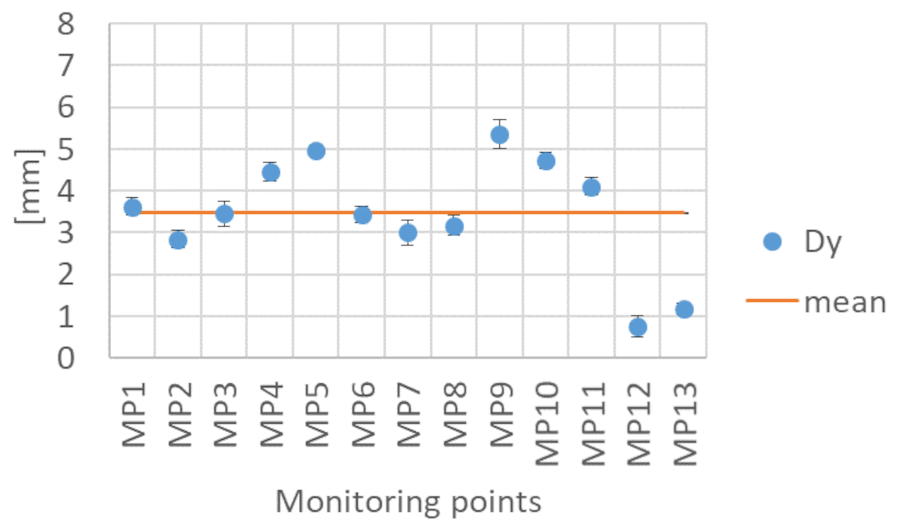
Figure 8Variation Dy of the y coordinate in the comparison between points before and after the application of thickness on Building 1.
With reference to the objectives defined in Sect. 2, the main findings can be summarized as follows:
-
Repeatability and reproducibility of the method. The standard deviation of the data is a maximum of 0.7 mm for repeatability over a short period of time (mean sampling period of ∼2 min; total acquisition time of ∼40 min) and ∼2 mm for repeatability after 3 d. Instead, the reproducibility after 1 year is of the order of 7–8 mm, even if small local displacements of the targets cannot be excluded. This type of information can be useful when it is necessary to monitor the building of interest over time, in order to know the variations to be considered significant.
-
Detection limit of the method. The presence of 4 mm thicknesses has been clearly identified by the system.
-
Effect of the angle of rotation of the RTSs on the measurement of the monitoring points. Vertical rotation angles greater than about 40∘ seem to significantly impact on the variability. The quantitative indications provided with reference to the angles can be useful, in particular, when it is necessary to carry out measurements in confined spaces (for example, an alley) and to be aware of the variability that can be expected.
-
Effect of the distance. The distance of the monitoring points from the instrument, in the range examined (within about 15 m), does not influence the results.
-
Effect of different configurations of monitoring points on the calculation of the slope of a façade. The choice of a set of points that contains positions located at the base and at the highest level of the building provides results comparable to those obtained on the basis of the complete configuration. Slope variations up to about 0.3∘ occur in the other configurations examined. In emergency conditions, when the time available for surveys is reduced, or when there are obstacles (fixed or mobile) that prevent one from acquiring points in some areas of the façade, then these results can be taken into account to limit the number of monitoring points, while being aware of the effects of such solutions.
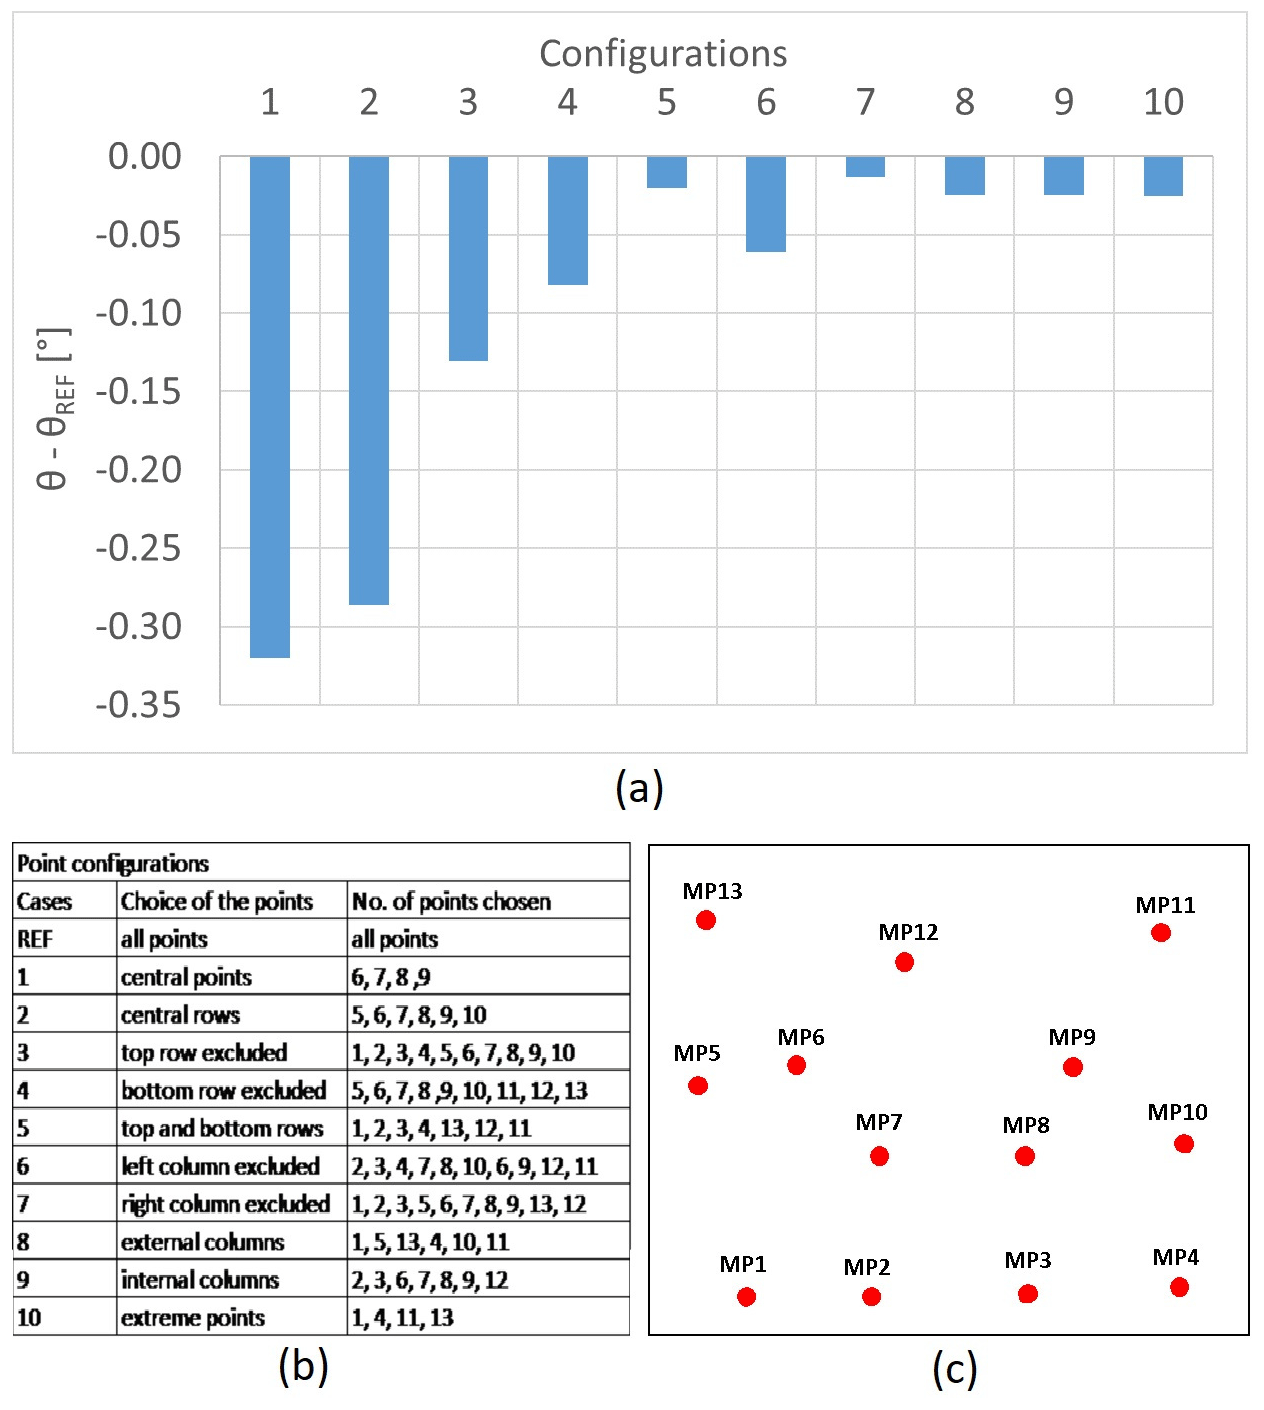
Figure 9Comparison among point configurations. In panel (a), the differences in the slope (θ) with respect to that calculated on the basis of the REF configuration (θREF) are represented. In panel (b), the configurations taken into account are described. In panel (c), the scheme of the monitoring points on the façade is shown.
The paper describes a methodology in order to assess repeatability, reproducibility, and detection limit of a RTS, in field conditions, when referring to a 1-year observation period. Furthermore, the effect of reducing the number of monitoring points has been investigated in order to define simplified procedures to be used in emergency situations.
The results show that the standard deviation of data is maximum of 0.7 mm for repeatability on a short period of time and 2 mm for repeatability after a few days. Instead, the reproducibility after 1 year is of the order of 7–8 mm, but small local displacements of the targets cannot be excluded.
The distance of the monitoring points from the instrument, in the range examined (within about 15 m), has no significant effect on the results; on the contrary, the angles of rotation of the instrument with respect to the horizontal plane have an influence on the results, worsening the variability. This aspect, depending on the geometry of the site and of the studied buildings, cannot always be kept under control, especially when the criticality of the situation imposes geometrical solutions which are far away from optimal ones.
By applying 4 mm thicknesses to the monitoring points, the system measuring threshold has also been validated.
The analysis of the reduced configurations of the monitoring points has highlighted interesting aspects in terms of defining a simplified procedure.
In future work, the effects of a non-optimal localization of the reference points will also be studied, and more extreme positioning angles of the instrument with respect to the buildings walls will be realized, to take into account the critical operational situations that could occur in practice.
Finally, it should be observed that the correct use of the façade inclination as an indication of the risk of collapse is a critical task with respect to a post-earthquake safety. This step requires interfacing with structural experts and will be the subject of the final development of the project.
All measurement data and codes are not publicly available and can be accessed upon request to the corresponding author.
Conceptualization: GD and EN; methodology: GD and EN; software: EN; validation: GD; formal analysis: GD and EN; investigation: EN; resources: GD; data curation: EN; writing and preparation of the draft: GD and EN; review and editing: GD and EN; visualization: EN; supervision: GD; and project administration: GD.
The contact author has declared that none of the authors has any competing interests.
Publisher’s note: Copernicus Publications remains neutral with regard to jurisdictional claims in published maps and institutional affiliations.
Angelo Celano and Luca Macerola of Leica Geosystems S.p.A. are gratefully acknowledged for the technical support.
This paper was edited by Rosario Morello and reviewed by three anonymous referees.
Alicandro, M., D'Emilia, G., Dominici, D., Gaspari, A., Marsella, S., Marzoli, M., Natale, E., and Zollini, S.: Validation of a measurement procedure for the assessment of the safety of buildings in urgent technical rescue operations, ACTA IMEKO, 10, 140–146, https://doi.org/10.21014/acta_imeko.v10i4.1141, 2021.
Berezowski, V., Mallet, X., and Moffat, I.: Geomatic techniques in forensic science: A review, Sci. Justice, 60, 99–107, https://doi.org/10.1016/j.scijus.2019.10.006, 2020.
Beshr, A. A. A. and Abo Elnaga, B. M.: Investigating the accuracy of digital levels and reflectorless total stations for purposes of geodetic engineering, Alex. Eng. J., 50, 399–405, https://doi.org/10.1016/j.aej.2011.12.004, 2011.
D'Emilia, G., Gaspari, A., Mazzoleni, F., Natale, E., and Schiavi, A.: Calibration of tri-axial MEMS accelerometers in the low-frequency range – Part 2: Uncertainty assessment, J. Sens. Sens. Syst., 7, 403–410, https://doi.org/10.5194/jsss-7-403-2018, 2018.
Franzini, M., Casella, V., Marchese, P., Marini, M., Della Porta, G., and Felletti, F.: VALIDATION OF A UAV-DERIVED POINT CLOUD BY SEMANTIC CLASSIFICATION AND COMPARISON WITH TLS DATA, Int. Arch. Photogramm. Remote Sens. Spatial Inf. Sci., XLIII-B2-2021, 83–90, https://doi.org/10.5194/isprs-archives-XLIII-B2-2021-83-2021, 2021.
ISO 17123 – 5: Optics and optical instruments – Field procedures for testing geodetic and surveying instruments – Part 5: Total stations, 28 pp., Technical Committee: ISO/TC 172/SC 6; ICS: 17.180.30, 2018a.
ISO 17123 – 9: Optics and optical instruments – Field procedures for testing geodetic and surveying instruments – Part 9: Terrestrial laser scanners, 43 pp., Technical Committee: ISO/TC 172/SC 6; ICS: 17.180.30, 2018b.
Janßen, J., Medić, T., Kuhlmann, H., and Holst, C.: Decreasing the uncertainty of the target center estimation at terrestrial laser scanning by choosing the best algorithm and by improving the target design, Remote Sens., 11, 845, https://doi.org/10.3390/rs11070845, 2019.
Janßen, J., Kuhlmann, H., and Holst, C.: Assessing the temporal stability of terrestrial laser scanners during long-term measurements, in: Contributions to International Conferences on Engineering Surveying, 69–84, https://doi.org/10.1007/978-3-030-51953-7_6, 2021.
Janßen, J., Kuhlmann, H., and Holst, C.: Target-based terrestrial laser scan registration extended by target orientation, J. Appl. Geod., 16, 91–106, https://doi.org/10.1515/jag-2020-0030, 2022.
Kalvoda, P., Nosed, J., and Kalvodova, P.: Influence of control points configuration on the mobile laser scanning accuracy, IOP Conference Series: Earth and Environmental Science, 906, 012091, https://doi.org/10.1088/1755-1315/906/1/012091, 2021.
Kassotakis, N. and Sarhosis, V.: Employing non-contact sensing techniques for improving efficiency and automation in numerical modelling of existing masonry structures: A critical literature review, Structures, 31, 1777–1797, 2021.
Kersten, T. P. and Lindstaedt, M.: Geometric accuracy investigations of terrestrial laser scanner systems in the laboratory and in the field, Appl. Geomat., 14, 421–434, https://doi.org/10.1007/s12518-022-00442-2, 2022.
Kersten, T. P., Lindstaet, M. and Stange, M.: Investigations into the geometric accuracy of latest terrestrial laser scanners in the laboratory and in the field, AVN Allgemeine Vermessungs-Nachrichten, 128, 59–67, 2021.
Kovacic, B., Straus, L., Drzecnic, M., and Pucko, Z.: Applicability and analysis of the results of non-contact methods in determining the vertical displacements of timber beams, Appl. Sci., 11,8936, https://doi.org/10.3390/app11198936, 2021.
Kwiatkowski, J., Anigacz, W., and Beben, D.: Comparison of non-destructive techniques for technological bridge deflection testing, Materials, 13, 1908, https://doi.org/10.3390/ma13081908, 2020.
Medić, T., Kuhlmann, H., and Holst, C.: A priori versus in-situ terrestrial laser scanner calibration in the context of the instability of calibration parameters, in: Proceedings of the 8th International Conference on Engineering Surveying & 4th SIG Symposium on Engineering Geodesy (INGEO & SIG 2020), 128–141, https://doi.org/10.1007/978-3-030-51953-7_11, 2020.
Siaudinyte, L. and Suh, H. S.: Uncertainty evaluation of proposed setup for the calibration of vertical angle measuring systems by using means for the flat angle calibration, Measurement, 67, 177–182, https://doi.org/10.1016/j.measurement.2015.01.001, 2015.
Siaudinyte, L. and Grattan, K. T. V.: Uncertainty evaluation of trigonometric method for vertical angle calibration of the total station instrument, Measurement, 86, 276–282, https://doi.org/10.1016/j.measurement.2015.10.037, 2016.
Sun, H., Liu, S., Zhong, R., and Du, L.: Cross-section deformation analysis and visualization of shield tunnel based on mobile tunnel monitoring system, Sensors, 20, 1006, https://doi.org/10.3390/s20041006, 2020.
Tobiasz, A., Markiewicz, J., Lapinski, S., Nikel, J., Kot, P., and Muradov, M.: Review of methods for documentation, management, and sustainability of cultural heritage. Case study: museum of king Jan III's palace at Wilanòw, Sustainability, 11, 7046, https://doi.org/10.3390/su11247046, 2019.
VDI/VDE Richtlinien 2634: part 1-2-3, Optical 3D Measuring systems – Imaging Systems with point-bypoint probing, 16 pp., Creators: VDE and VDI; ICS: 17.040.30, Part 2, 2012.