the Creative Commons Attribution 4.0 License.
the Creative Commons Attribution 4.0 License.
 | 26 Jun 2023
New publication of the VDI/VDE guideline 3520 “Surface temperature measurement with contact thermometers” – contents and background of the development
Silke Augustin
Marc Schalles
Temperature measurement at the surface of solids by means of contact thermometers has its own metrological characteristics, which are in contrast to characteristics of the measurement with immersed contact thermometers. They significantly influence the accuracy and the measurement uncertainty of the measured temperature and its deviations. Up to now, no national or international guideline exists which deals with the determination of the static and dynamic measurement deviations. Therefore, the guideline committee “VDI/VDE-GMA FA 4.62 Contact Thermometry” has developed the new VDI (Association of German Engineers) and VDE (Association for Electrical, Electronic and Information Technologies) guideline 3520 “Surface temperature measurement with contact thermometers”. It contains information about the most important properties of contact surface thermometers and error sources, and it presents typical measurement results for various applications. In addition, the parameters influencing the measurement result and test equipment for their determination are described, and concrete examples of thermometer data sheets are given.
- Article
(2866 KB) - Full-text XML
- BibTeX
- EndNote


The temperature at the surface of solids can be measured contact-free with radiation thermometers as well as with contact thermometers (typically resistance thermometers, thermocouples) which are placed at the surface. The advantage of non-contact measurements is, among other things, that the radiation thermometer does ideally not influence the surface temperature. The measurement principle is especially suited for measurements at high temperatures and moving surfaces. A disadvantage is the high measurement uncertainty.
When measuring with contact thermometers, the thermometer must be brought into mechanical contact with the surface of which the temperature should be measured. The VDI (Association of German Engineers) and VDE (Association for Electrical, Electronic and Information Technologies) guideline 3520 “Surface temperature measurement with contact thermometers” (VDI, 2022) refers exclusively to temperature measurements in which the contact is realized by detachable clamping or probing. Measurements with non-detachably fixed thermometers, such as embedding in a surface or welding, are not considered.
A thermometer placed on a surface influences its temperature field (Fig. 1). The locally changed thermal coupling of the surface to the environment changes the heat flow in the measuring object. A disturbed surface temperature results for the case that ambient temperature and measuring object temperature are different. It deviates from the undisturbed surface temperature by the contribution . This contribution is the amount of the thermal measurement deviation resulting from the thermal coupling. It depends on the design of the surface thermometer, its thermal coupling to the solid, and the coupling of the solid to heat sources or sinks. In case of thin solids such as foils or pipe walls and low heat supply from the surrounding medium (fluid), the temperature TM of the medium itself may be influenced (VDI, 2022). The resulting thermal measurement deviations depend on the individual conditions of the measurement and are described below.
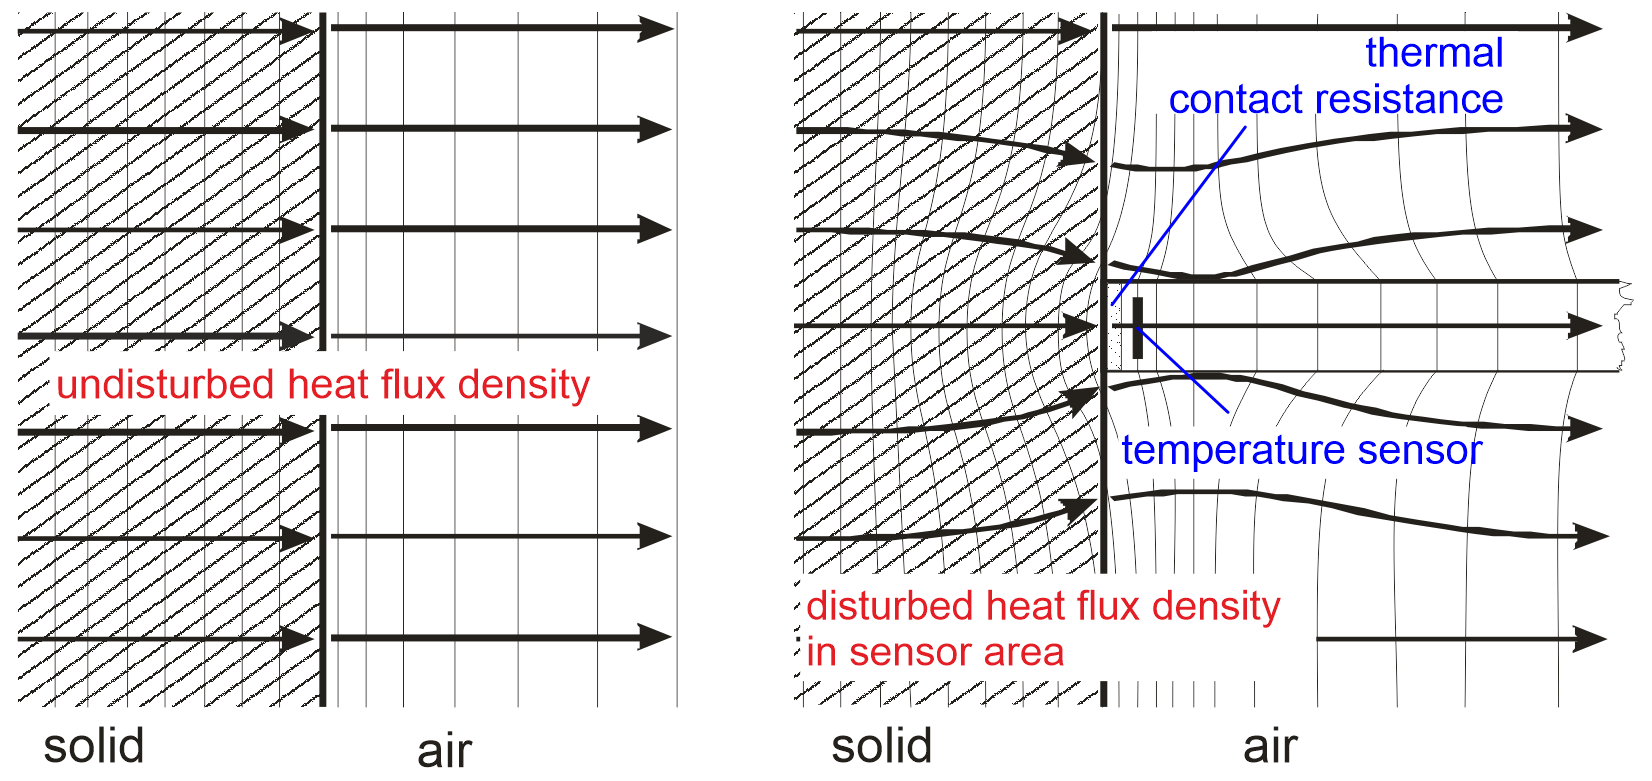
Figure 1Undisturbed temperature field (left) and temperature field disturbed by the thermometer (right) of a solid and surrounding air (Bernhard, 2014).
Both touching and clamp-on thermometers can be used to measure the surface temperature. Touching thermometers are brought into non-permanent mechanical contact with the measured object. They have a special holder or handle to allow them to be placed on or pressed against the surface.
Clamp-on surface thermometers can also be permanently attached to surfaces or at least for a long period. For these contact thermometers, fastening elements adapted to the measurement situation are generally used. Contact thermometers are usually attached to pipelines or tanks. The target quantity for these measurements is their inside fluid temperature TF. Less often, the detection of the wall temperature is aimed for (VDI, 2022).
Due to the difference between the temperature to be measured (solid temperature TK or fluid temperature TF) and the ambient temperature TU, measurement deviations, or , occur. They can be static, ΔTTH= constant, or dynamic ΔTTH=f(t).
Heat transport conditions at the measuring point significantly influence the measurement result and its deviations. To get a better understanding of the cause of measurement deviations, one can use thermal-equivalent circuit diagrams (Fig. 2) to model the heat transport. Here, a one-dimensional heat flow and steady state are assumed for simplification. Dynamic effects during measurement with contact surface thermometers are discussed in Sect. 4.6.
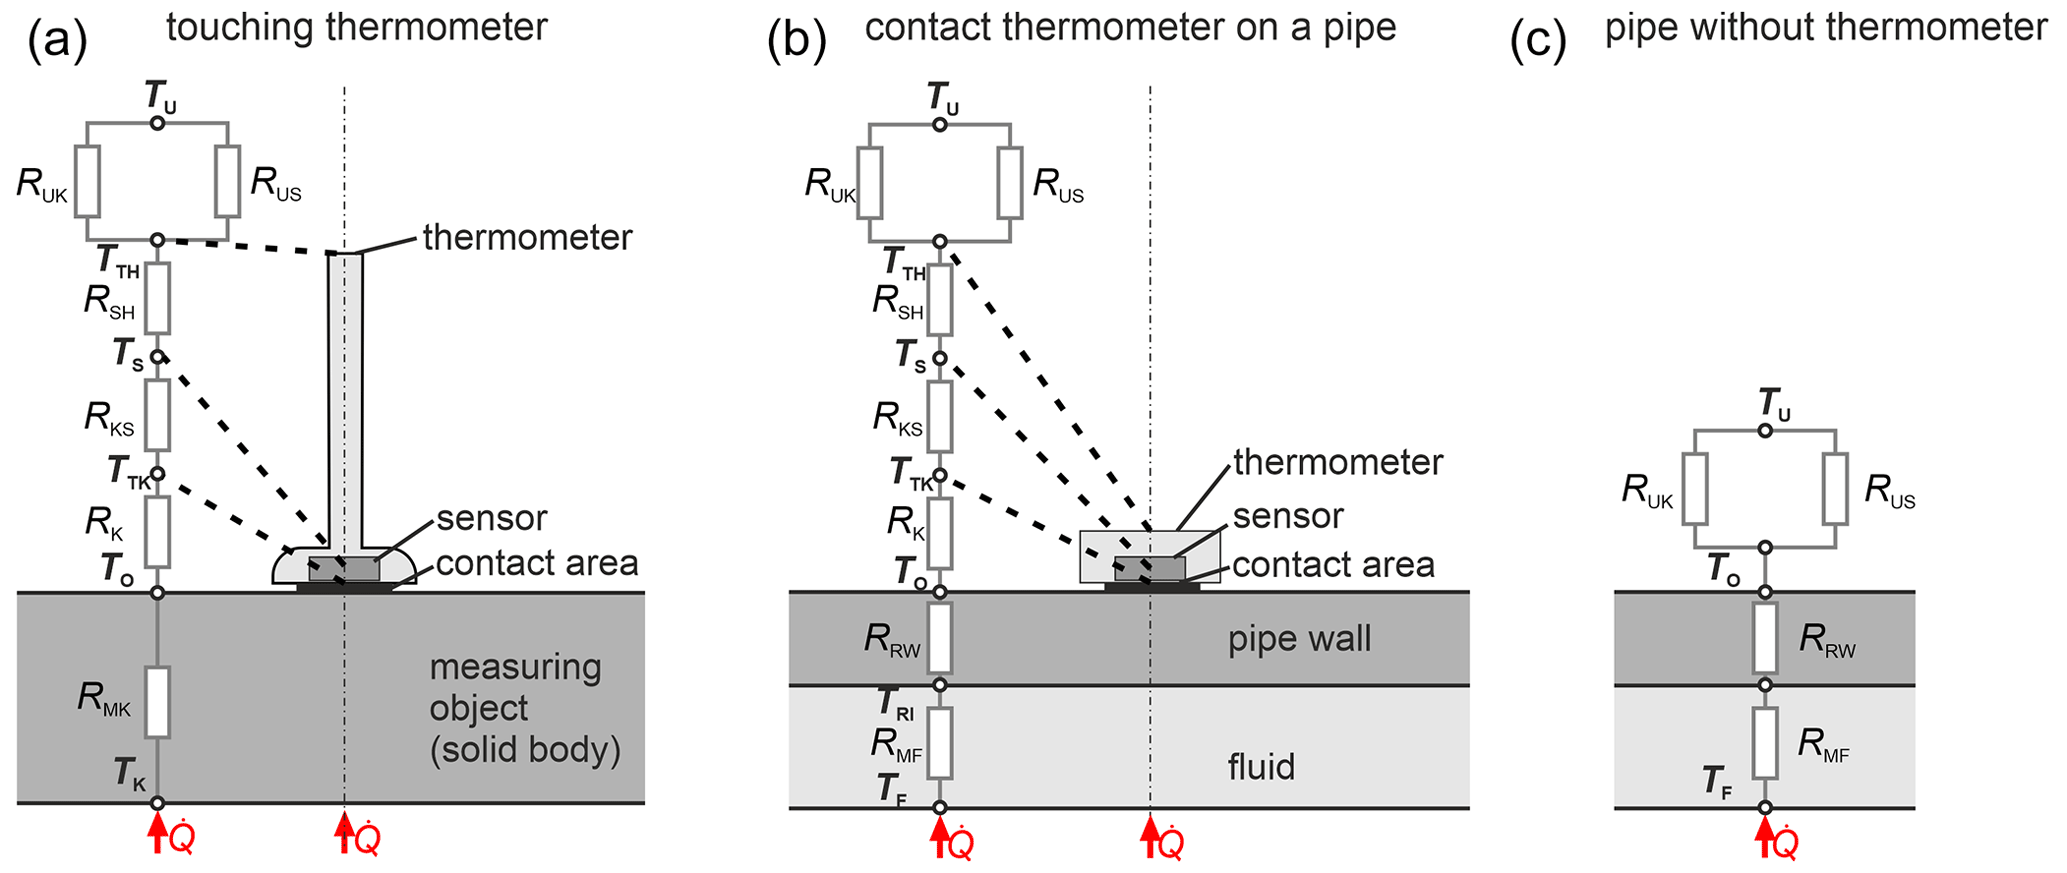
Figure 2Thermal-equivalent circuit diagrams for a touching thermometer on a solid body (a), a clamp-on thermometer on a pipe (b), and a pipe without a thermometer (c).
In Fig. 2a, the thermal-equivalent circuit for a surface temperature measurement on a solid body is shown. The body is heated by a heat source from below. This generates a higher temperature in the body TK than in the environment TU resulting in a heat flow . The equivalent circuit for surface temperature measurement on a pipe is shown in Fig. 2b. Here, the heat is typically transferred into the pipe wall by convection or radiation. Without the attached thermometer, the equivalent circuit is significantly simpler (Fig. 2c).
The value of the thermal resistances in the equivalent circuits depends on a large number of influencing factors, which are described in detail in VDI (2022).
On the one hand, thermometer design plays an important role. Here, material properties and thermometer dimensions affect the resistances RSH (between sensor and thermometer surface) and RKS (between contact surface of the thermometer and the sensor). They depend on the thermometer design and cannot be influenced by the user. The resistances to the environment RUK (heat transfer resistance by convection) and RUS (heat transfer resistance by radiation) can be changed by the user, for instance by thermally insulating the measuring point.
On the other hand, the measuring object is relevant, too. The contact resistance RK between the surface to be measured and the thermometer surface usually has the greatest influence on the measurement deviation. The main influencing factors here are the size and roughness of the contact surfaces, shape deviations, the contact pressure or angle between the contacting surfaces, the material properties of the intermediate medium, any thermal shielding of the contact surface, and the temperature field in its area contact.
Furthermore, the dimensions of a solid or pipe, the thermal conductivity of their materials, and further quantities influence resistance RMK as well as RRW. This can be seen in the diagrams in Sect. 4.1 that give a deeper insight into the heat transport in pipes. Even without an attached thermometer, the surface temperature of a pipe TO may vary although the temperature of the fluid TF is constant. This is due to changing heat transport conditions, which can be expressed by RMF and RUK. The resistances are indirectly proportional to the heat transport coefficients αI at the inner pipe wall and αO at the outer pipe wall, which depend on the thermal properties of the media, their temperature, flow velocities, and pipe dimensions.
The heat transport conditions at a surface temperature measuring point are very complex. Due to that, an estimation of the thermometer properties and its characterization cannot be done only by theoretical modeling. Furthermore, it is necessary to conduct experiments with test or calibration equipment, which takes into account the specific features of a surface temperature measurement. In the following two sections, two test benches are exemplarily described that are in use at Technische Universität Ilmenau for that purpose.
3.1 Equipment for measurement on flat surfaces
Temperature measurement on solid bodies with flat surfaces is usually carried out with touching surface thermometers. They are mostly placed manually on the surface – as a result, the contact force and angle and, consequently, the thermal contact resistance can vary. Depending on that, the measured temperature as well as the temperature profile in the solid develop. Since they depend further on material and dimensions, the guideline has therefore described test equipment for thermometer characterization and the requirements for this equipment. Among others, these are a generation of a one-dimensional heat flow, ensuring a defined and reproducible thermometer placement and an appropriate determination of the reference temperature TO. A typical setup of a test and calibration device, which is used in different configurations at international metrological institutes, is shown in Fig. 3 (VDI, 2022). A heat source (6), a plate for thermal homogenization (5), thermal insulation (7), and a metal test specimen (3) are used to provide a stable reference surface temperature TO,U or TO,G at the specimens surface. It is estimated by extrapolation from the temperatures of three mineral-insulated thermocouples. They are distributed and placed at different distances to the surface of the block. The test item (2) is positioned by means of a vertical guide with a clamping device (1) on the surface.
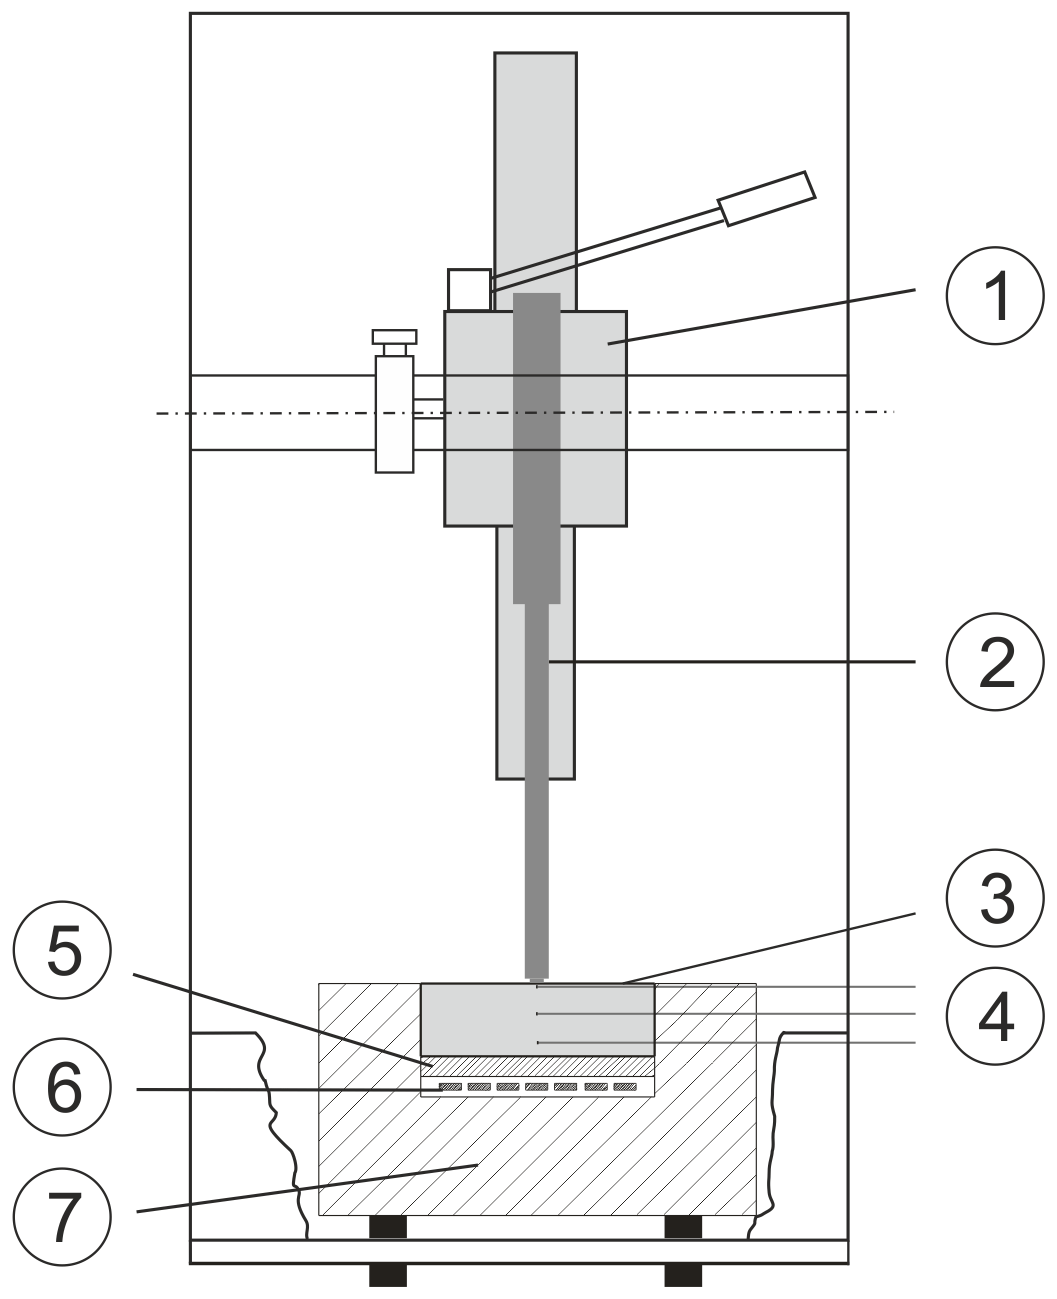
Figure 3Test and calibration equipment for contact thermometers with a flat, heated metal test specimen: (1) vertical guide with clamping device, (2) test item (surface contact thermometer), (3) metal test specimen, (4) three mineral insulated thermocouples, (5) homogenization plate, (6) heating foil, and (7) thermal insulation.
Similar test conditions can also be provided with dry block calibrators with an adapted measurement insert. It provides an exposed surface on which the surface thermometer to be tested and one or more embedded temperature sensors for estimation of the surface temperature are placed.
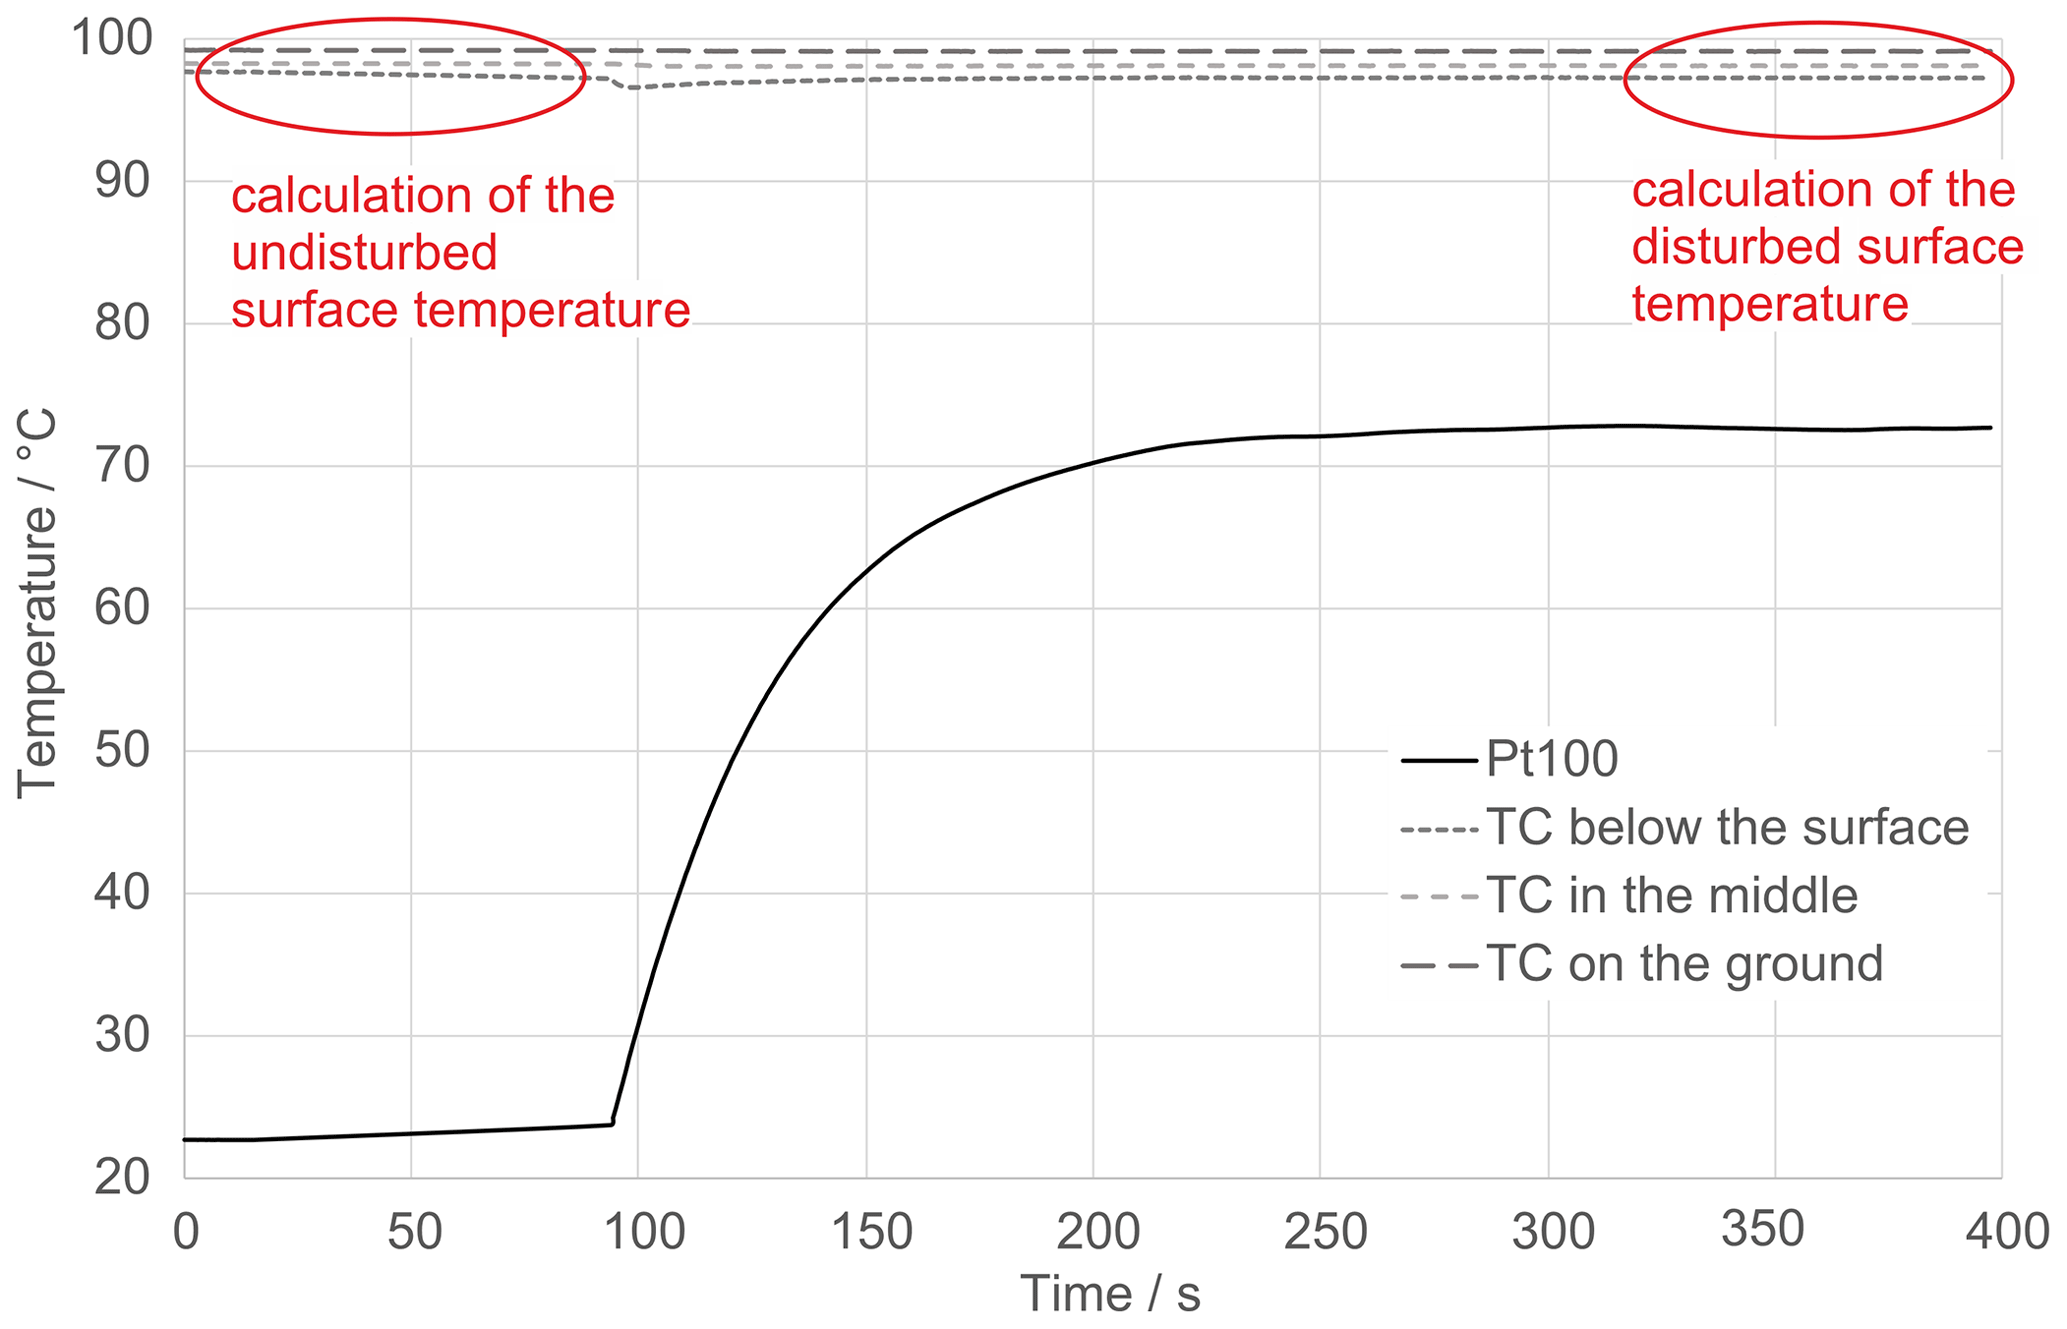
A measurement procedure is as shown in Fig. 4. The furnace is stabilized to a defined temperature. The undisturbed surface temperature TO,U is calculated by extrapolating the temperature profile in the axis of the test specimen. After a certain period, the surface thermometer is attached to the surface and its temperature rises. After reaching the steady state, the sensor temperature TS and the disturbed surface temperature TO,G are estimated.
3.2 Equipment for measurement on curved surfaces
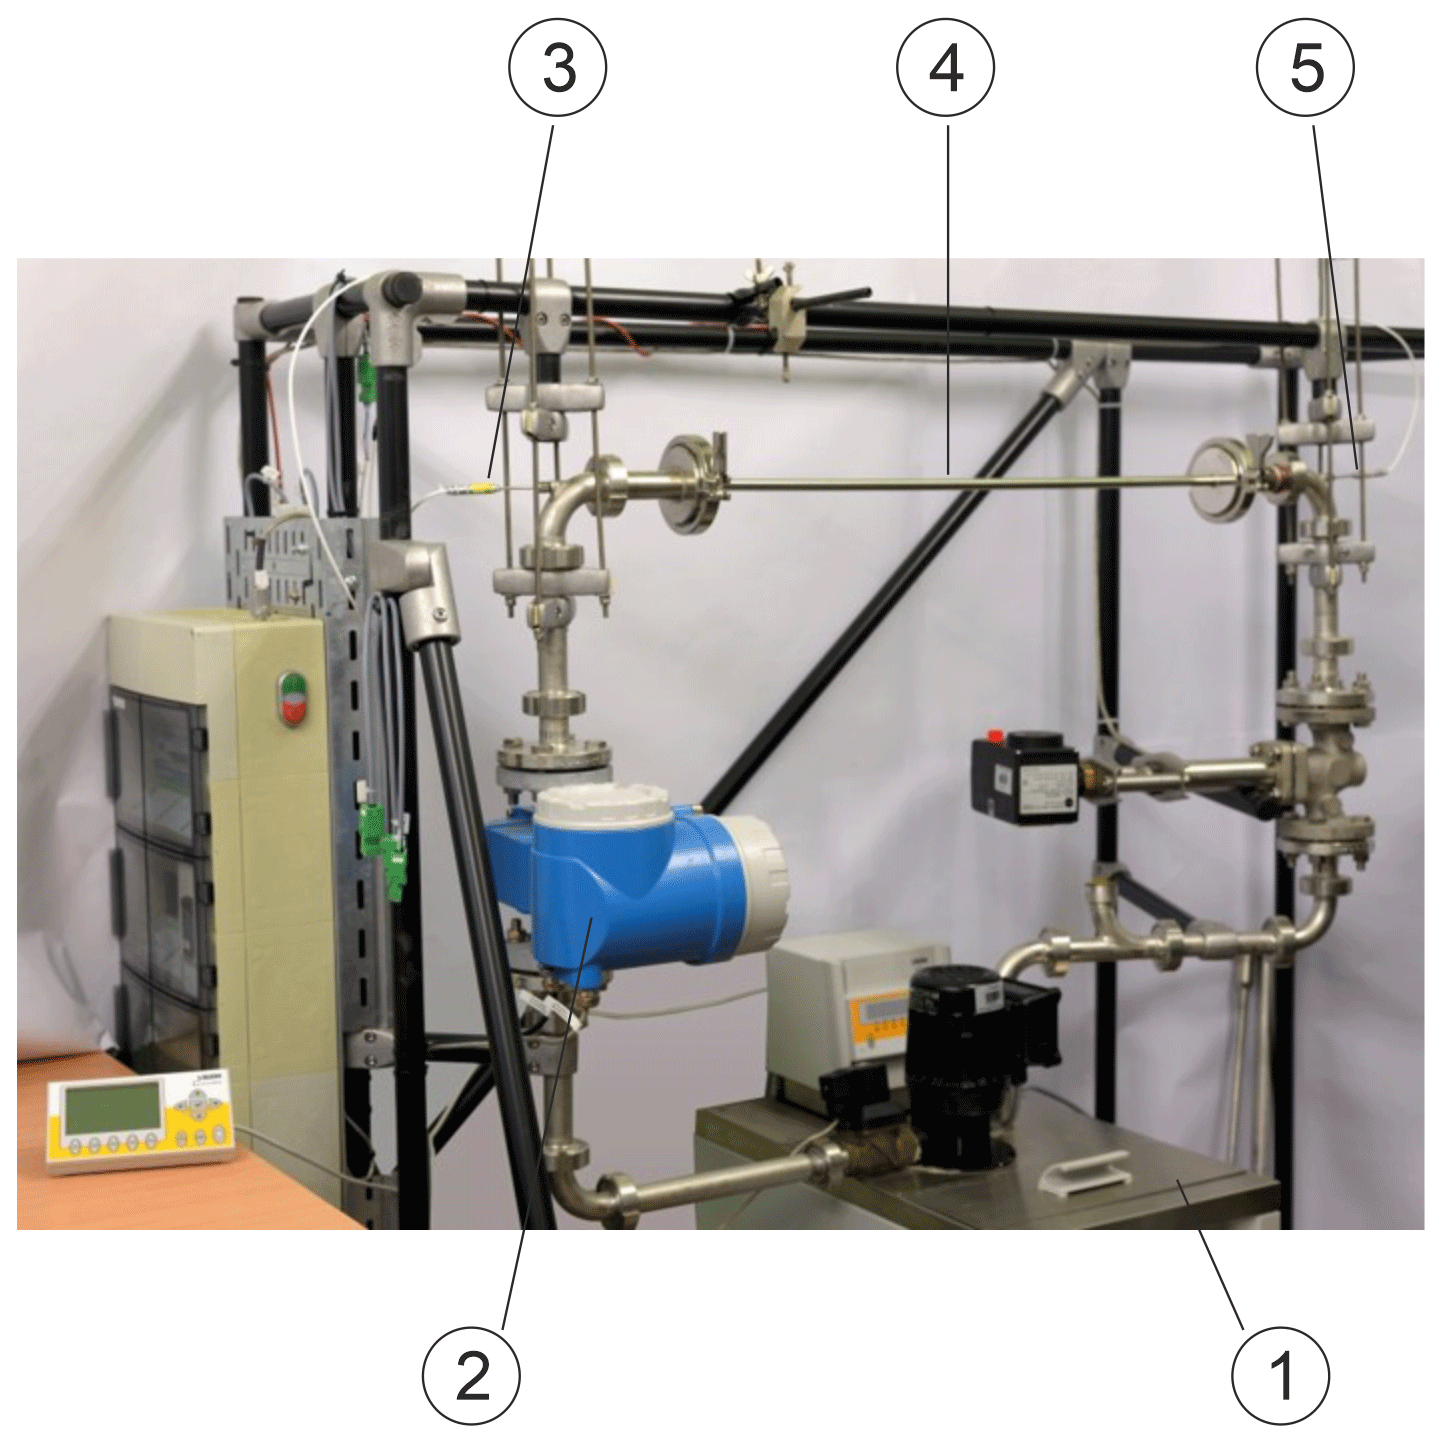
The determination of values of characteristic parameters of surface thermometers, which are intended for measurement on curved surfaces (especially pipe clamp probes), is done with separate test equipment. Typically, closed conduits with pipe flow are used. A fluid tempers the pipe wall, and the fluid temperature is the reference temperature of the measurement. In order to generate a homogeneous temperature in the pipe cross-section, turbulent flow conditions must be present. Figure 5 shows an example of a test facility for contact thermometers with a pipe test section (4) connected to a temperature-controlled water bath (1). The water is circulating through the pipe system with variable flow. A flow meter (2) monitors the flow. The reference temperature in the fluid is determined before (3) and after (5) the test section by means of built-in resistance thermometers. As an alternative to flow-through pipes, cylindrical solids can also be used to provide a reference temperature (VDI, 2022).
The effect of the influencing factors on a surface temperature measurement and, thus, their influence on the measurement result depend on the individual measurement situation and the thermometer used. Therefore, exemplary measurement and simulation results are presented in the following sections, which provide information about the effect of various influencing quantities. This is in addition to the factors mentioned in Sect. 2.
Some of the influencing factors are explained for thermometers for measurement at flat surfaces or curved surfaces only. But, mostly, the general claims hold for both types of surface thermometers.
4.1 Pipe material and fluid heat transfer
The measured surface temperature of pipe clamp probes depends on the thermal coupling between the probe and the fluid, which is dominated by the heat transfer between fluid and the inner pipe wall as well as pipe material and dimensions. The following theoretical calculations illustrate this.
Figure 6 presents the deviation of the wall temperature, of a stainless-steel pipe of DN1/2 in. (DIN, 2016) with respect to the heat transport coefficients. The deviation increases with αO, and, thus, with increasing heat loss to the environment. In contrast, it decreases with increasing αI, which, for liquid media, is existent at adequately high flow velocities. In those situations, the surface temperature TO is close to TF, and a surface thermometer could be used to measure TF. To illustrate this, the two stars in Fig. 6 mark two different conditions of heat transfer. At the black star, αI is 1500 W (m2 K)−1 and αO is 10 W (m2 K)−1, and at the red star, αI is 7300 W (m2 K)−1 and αO is 85 W (m2 K)−1. These conditions are met when water flows through the pipe at m s−1 and is circulated by air with natural convection and m s−1 and vAIR=5 m s−1, respectively.
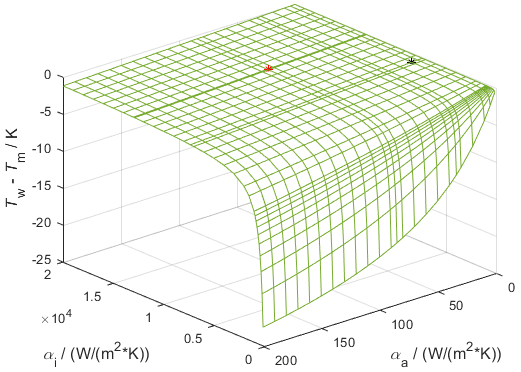
Figure 6Measurement error at a stainless-steel pipe DN1/2 in. with an inner diameter of 7 mm and outer diameter of 10.2 mm, λ=15 W (m K)−1, TF=50 ∘C, and TU=20 ∘C. The deviation at the red star is K and at the black star K. αO and αI are calculated according to VDI (1997: chaps. Ga and Gf).
The dimensions of the pipe decisively change the value of RMF additionally to the flow conditions. The thicker the pipe wall is, the higher the deviation gets (Fig. 7). Furthermore, the pipe material strongly effects the surface temperature. The lower the thermal conductivity of the material is (Fig. 8), the higher the deviation gets. It can be seen clearly that mostly the surface temperature on metallic pipes is close to the medium temperature with relative errors below 1 % to 2 %. This value increases remarkably when plastic pipes are used.
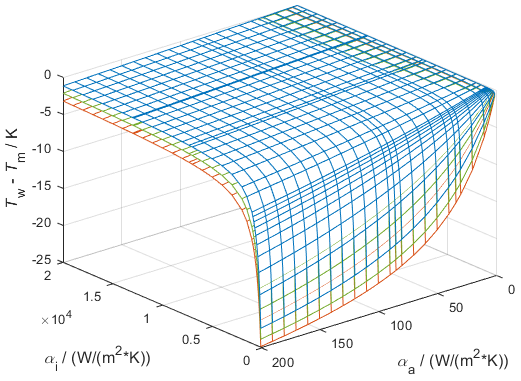
Figure 7Measurement error at a stainless-steel pipe DN1/2 in., λ=15 W (m K)−1, TF=50 ∘C, and TU=20 ∘C. The blue curve shows the results of Fig. 3 with an inner diameter of 7 mm and outer diameter of 10.2 mm. The outer diameter of the pipe was increased to 13.4 and 16.6 mm for the green and red curve. The inner diameter remained constant. αO and αI are calculated according to VDI (1997: chaps. Ga and Gf).
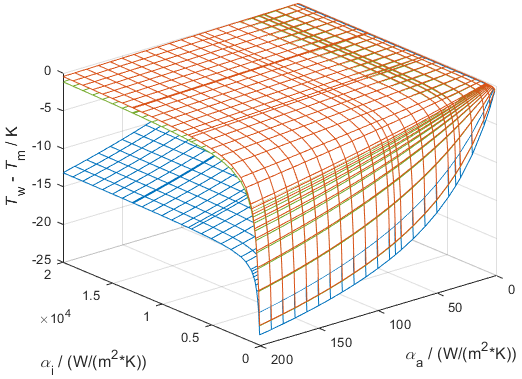
Figure 8Measurement error at a pipe DN1/2 in. with an inner diameter of 7 mm and outer diameter of 10.2 mm, TF=50 ∘C and TU=20 ∘C for pipe material copper with thermal conductivity of λ=400 W (m K)−1 (red), stainless steel λ=15 W (m K)−1 (green), and plastics λ=0.5 W (m K)−1 (blue). αO and αI are calculated according to VDI (1997: chaps. Ga and Gf).
4.2 Thermometer design
The static–thermal measurement deviation, , is shown in Fig. 9 for measurements with contact thermometers of different design. Here, the stainless-steel pipe is used in a water flow (Sect. 3.2). The different thermal measurement deviations due to the design can be seen clearly. They change additionally with the volume flow Q of the water in the pipe.
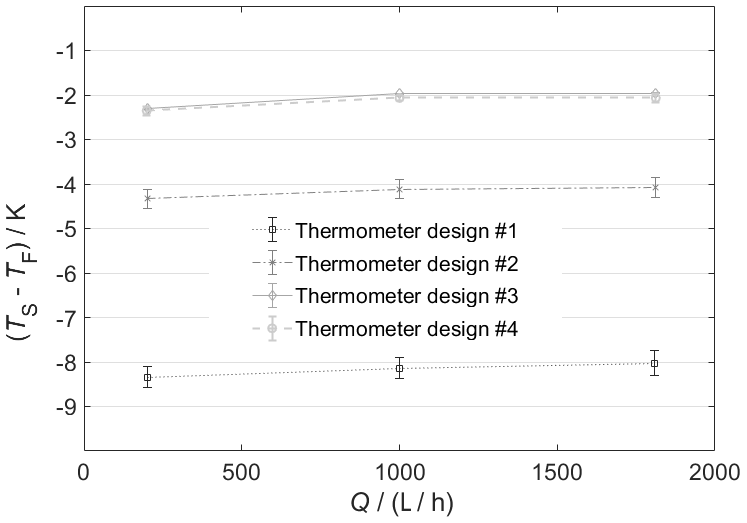
Figure 9Measurement deviation as a function of the thermometer design and the volume flow rate. The error bars indicate the standard deviation of the measured values during a measurement run.
4.3 Contact resistance
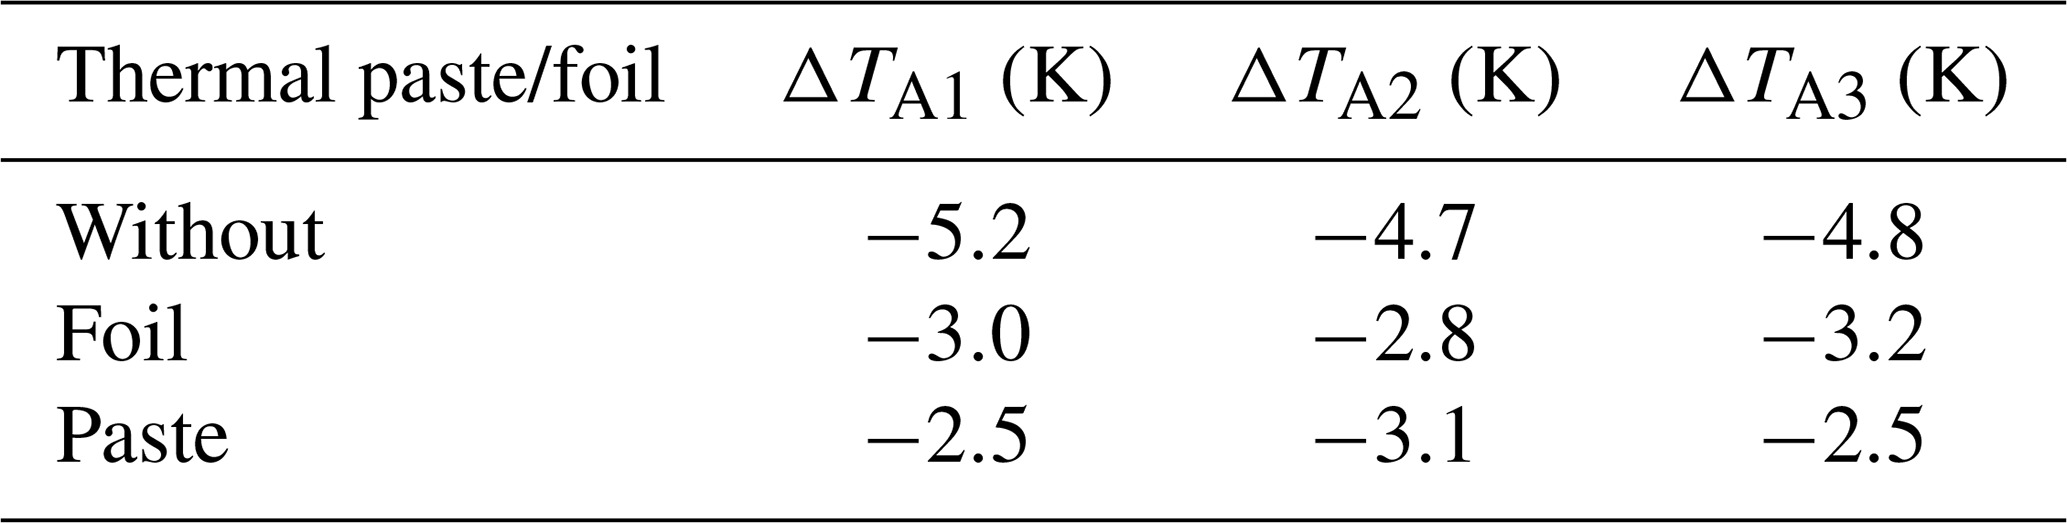
Measurements with different pipe clamp probes (A1–A3) of the same design on a stainless-steel metal pipe (DN1/2 in., hot steam, TF≈150 ∘C; Pufke and Fröhlich, 2019) showed that the measurement deviation is significantly reduced when using thermal paste and foil as an intermediate medium compared with measurements without an intermediate medium (Table 1). However, it must be noted that the use of thermal paste is not always a favorable solution, since it can harden over the service lifetime for example and thus change its metrological properties.
Table 1Measurement deviations of pipe clamp probes A1–A3 (Pufke and Fröhlich, 2019).
4.4 Influence of the surface material on measurements at solid bodies
The resistance RMK is influenced by the thermal conductivity of the solid body in stationary measurements at solids (VDI, 2022). The higher the thermal conductivity is, the better the heat can be conducted from the core of the solid body to the surface. This reduces the difference TO−TK and the difference TS−TK, which is comparable to the effect of the pipe material on the surface temperature in Sect. 4.1. It depends on the heat transfer conditions to the environment. If no thermometer is attached to the surface, TO is equal to TO,U, if attached, TO it is equal to TO,G (Sect. 3.1). Both TO,U and TO,G as well as their deviations to TS depend on the material of the test specimen (Fig. 10). The left diagram of Fig. 10 shows the temperature deviation of the temperature at the bottom of a test specimen TK made of aluminum or stainless steel and the temperature TS for different core temperatures. The right diagram shows the difference between the sensor temperature TS and the disturbed TO,G or undisturbed TU,G surface temperature. All estimated results are depending on the core temperature.
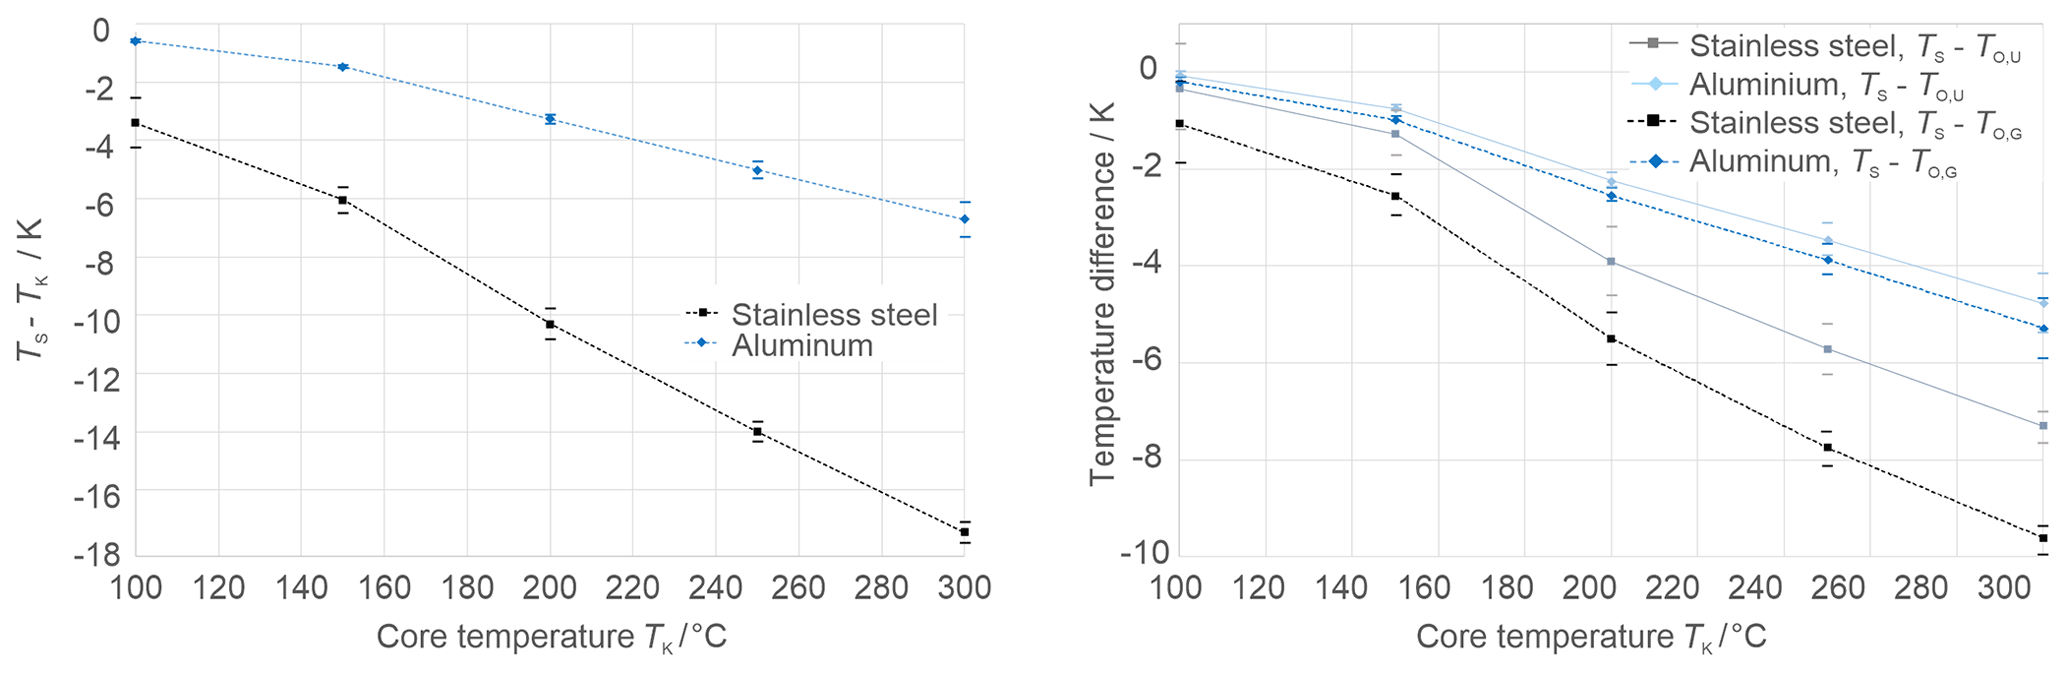
Figure 10Stationary temperature differences when measured with the test equipment of Fig. 4. The test specimens have a diameter of 76 mm and a height of 25 mm and are made of stainless steel and aluminum. The item under test was a cross-band thermocouple placed vertically and centered on the test specimen.
4.5 Reproducibility of the measurements
The contact resistance as well as the design of the surface thermometers have a great influence on the reproducibility of the measurements. This can be seen in Fig. 11, in which the results of a cross band thermocouple (see Sect. 4.4) and a resistance thermometer are shown. The error bars indicate the standard deviation of TS in the steady state at TK=100 ∘C during a measurement run. The measurement was repeated nine times.
For both thermometers, the standard deviation is very small, which shows the good stability of the setup temperature. However, the mean values of each measurement run are significant for the thermocouple K. This deviation as well as the fluctuations are considerably higher for the resistance thermometer. This is due to the worse thermal contact with this thermometer type at these measurement conditions, which is a result of its construction (see left side in Fig. 11). Comparable effects also occur in measurements with pipe clamp probes (Pufke, 2019).
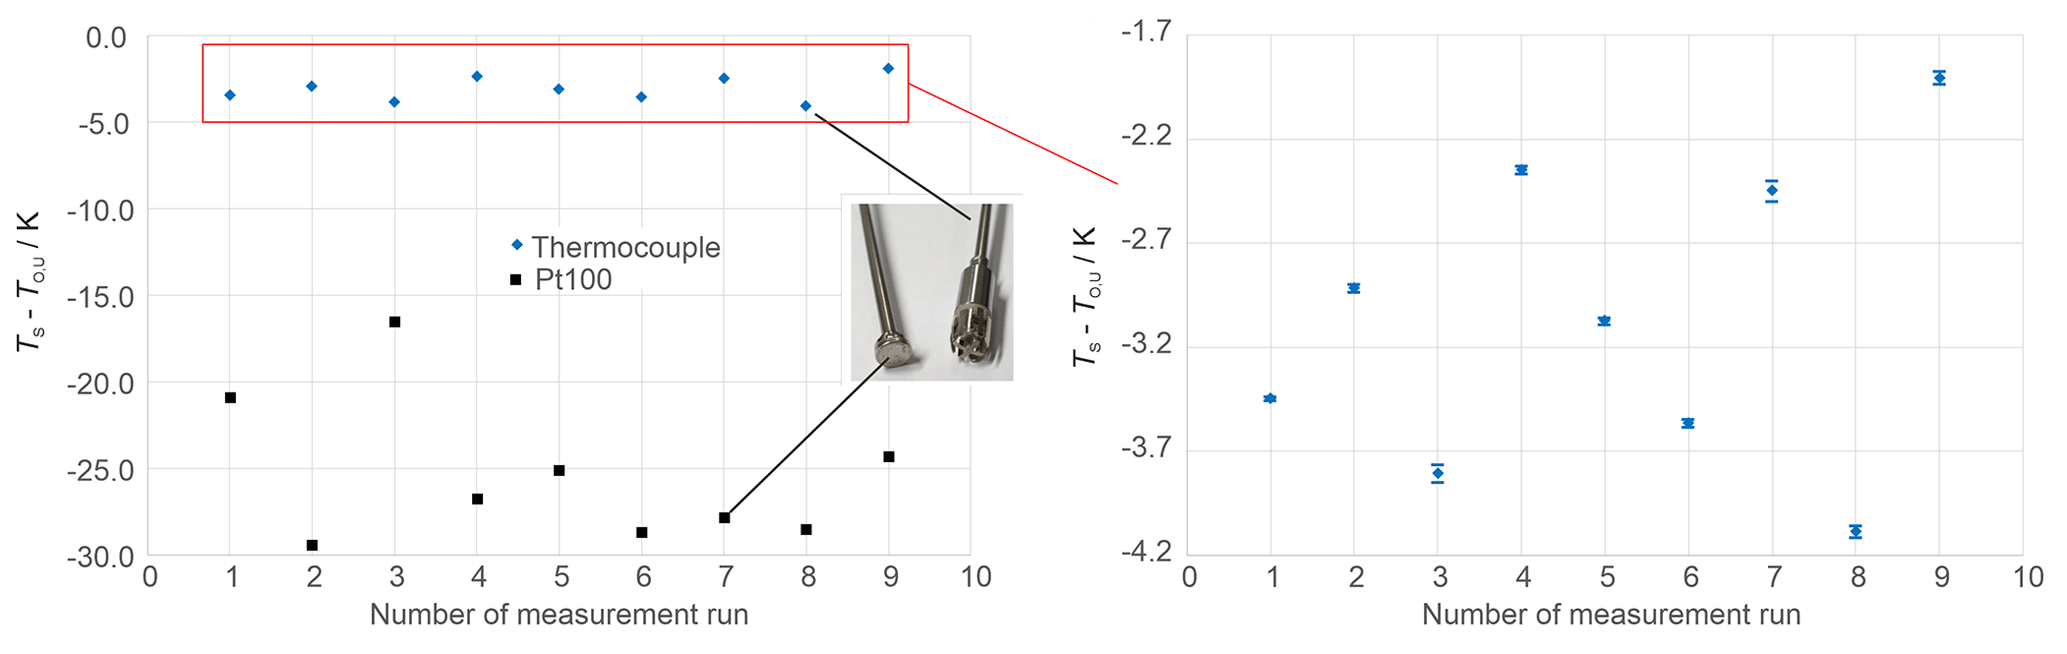
Figure 11Measurement deviation and standard deviation for a repeated probing of a stainless-steel surface (Sect. 3.1). The thermometers were placed vertically on the surface using the clamping device. The error bars indicate the standard deviation of the measured values during a measurement run.
The considerations in the previous sections show that the measurement error does depend on many individual factors, which are thermometer specific and depend on the individual measurement task. Hence, it is not possible to make generalized statements or recommendations on sensor type, design or manufacturer to be used to achieve the best results. That is why it is not recommended to choose the thermometer according to its tolerance class (AA, A,…) as well (DIN, 2009). It states only how good a thermometer or sensor matches the standard characteristic curve, which is typically a minor contribution to the overall measurement deviation. Instead, the measurement deviation is mostly dominated by the thermal error, which needs to be estimated for each thermometer individually.
4.6 Dynamic characteristic
The influencing factors on the measurement were discussed in the previous sections for stationary conditions. Nevertheless, ΔTTH=f(t) is a function of time as well, as can be seen in Fig. 4. How the ΔTTH is developing does not depend only on the thermal resistances, but also on the thermal masses and capacities of the thermometer and measuring object. They are not shown in Fig. 2.
Dynamic characterization of a thermometer is common for immersed contact thermometers (Augustin and Fröhlich, 2016; VDI, 2014). It is even mandatory for resistance thermometers (DIN, 2009). Similar to that, a dynamic characterization of surface thermometers is useful and recommended, too. It can be done by means of the test bench explained in Sect. 3.1. Out of the step response (Fig. 4), the response times t0.x can be estimated as for other contact thermometers as well.
Data sheets provided by the manufacturers of surface thermometers usually contain little information on the effect of the influencing quantities, their effects on the measurement result, and measurement uncertainty or the thermal error. Hence, users of specific thermometers can hardly estimate the expected deviation or uncertainty of the measurement. For this reason, there was a need for the guideline committee “VDI/VDE-GMA FA 4.62 Contact Thermometry” to develop a corresponding guideline, especially since no national or international guidelines dealing with that field of temperature measurement exist.
This guideline complements VDI/VDE guidelines on technical temperature measurement with electrical contact thermometers. The document first discusses the fundamentals of temperature measurement with contact thermometers. The differences between the determination of the surface temperature and immersion measurements in fluids are worked out, and the influencing factors presented are explained in detail using various examples. The specifics of touching and clamp-on thermometers are discussed. For both types of thermometers, the specific parameters are given, which should be specified in documents characterizing the thermometers, such as data sheets. In addition, the measurement conditions to be specified for the determination of these characteristic parameters are defined. Test or calibration equipment for determining the values of these parameters is also described in the guideline. The appendix contains examples of data sheets corresponding to the specifications of the guideline.
Its content helps users of surface thermometers to design the measuring point and to select and compare thermometers. Manufacturers of surface thermometers or calibration laboratories are supported in determining the characteristic parameters of surface thermometers, in designing measurement setups for their characterization and validation, and in creating transparent data-sheet specifications.
The guideline enables the user to determine the characteristic parameters, which allows for a transparent comparison of the metrological properties of different surface thermometers. For this, test equipment is described in the guideline, which reproduces typical applications of surface temperature measurements. Measurements on flat as well as curved surfaces are considered. Test equipment should be constructed in a way that it meets the requirements of the guideline.
VDI/VDE guideline 3520 was published in 2022. It initially explains the special features of contact measurement of the surface temperature on solids. The guideline describes characteristic parameters for characterizing surface thermometers as well as test equipment for their determination. It thus provides the basis for comparing the metrological properties of different surface thermometers with each other, for compiling data sheets for surface thermometers, and for designing and validating suitable measurement setups.
The guideline deliberately refrains from drawing up calibration regulations for the calibration of surface thermometers. A subgroup of the DKD (Deutscher Kalibrierdienst) Technical Committee “Temperature and Humidity” is working on that.
No data sets were used in this article.
SA carried out the measurements on flat surfaces and undertook the data evaluation. MS carried out the measurements on curved surfaces and undertook the data evaluation and calculations on theoretical models. Both authors prepared the manuscript and reviewed and edited the publication.
The contact author has declared that neither of the authors has any competing interests.
Publisher’s note: Copernicus Publications remains neutral with regard to jurisdictional claims in published maps and institutional affiliations.
This article is part of the special issue “Sensors and Measurement Systems 2022”. It is a result of the “Sensoren und Messsysteme 2022, 21. ITG/GMA-Fachtagung”, Nuremberg, Germany, 10–11 May 2022.
The VDI/VD guideline was developed by the members of the VDI/VDE work group 4.62 “Contact Thermometry”. The authors acknowledge the contributions of all of the group members as well as the technical support from the Verein Deutscher Ingenieure.
This paper was edited by Marco Jose da Silva and reviewed by two anonymous referees.
Augustin, S. and Fröhlich, T.: Dynamisches Verhalten von Berührungsthermometern unter Berücksichtigung der Temperaturabhängigkeit der Materialdaten – Erweiterung der VDI/VDE-Richtlinie 3522, tm – Technisches Messen, 83, 402–409, https://doi.org/10.1515/teme-2015-0068, 2016.
Bernhard, F. (Ed.): Handbuch der Technischen Temperaturmessung, 2. Auflage, Springer-Verlag, https://doi.org/10.1007/978-3-642-24506-0, 2014.
DIN: DIN EN 60751 Industrielle Platin-Widerstandsthermometer und Platinsensoren, Beuth Verlag Berlin, https://doi.org/10.31030/1507857, 2009.
DIN: 11866 Komponenten aus nichtrostendem Stahl für aseptische Anwendungen in der chemischen und pharmazeutischen Industrie – Rohre, Beuth Verlag Berlin, https://doi.org/10.31030/2540822, 2016.
Pufke, M.: Messtechnische Untersuchung von Rohranlegethermometern, Dissertation, TU Ilmenau, urn:nbn:de:gbv:ilm1-2019000255, https://www.db-thueringen.de/receive/dbt_mods_00039456 (last access: 2 June 2023), 2019.
Pufke, M. and Fröhlich, T.: Einflussfaktoren auf die Messung mit Rohranlegethermometern, tm – Technisches Messen, 86, S67–S71, https://doi.org/10.1515/teme-2019-0033, 2019.
VDI (Verein Deutscher Ingenieure): VDI Wärmeatlas – Berechnungsblätter für den Wärmeübergang, 8. Ausgabe, Springer, https://doi.org/10.1002/cite.330701234, 1997.
VDI: VDI/VDE Richtlinie 3522: “Dynamisches Verhalten von Berührungsthermometern”, Blatt 1, VDI-Verlag GmbH, 2014.
VDI: VDI/VDE Richtlinie 3520: “Oberflächentemperaturmessung mit Berührungsthermometern”, VDI-Verlag GmbH, 2022.
- Abstract
- Introduction
- Measurement of the surface temperature with contact thermometers and influencing factors
- Test and calibration equipment for surface thermometers
- Effect of different influencing factors on measurements
- VDI/VDE guideline 3520 “Surface temperature measurement with contact thermometers”
- Outlook
- Data availability
- Author contributions
- Competing interests
- Disclaimer
- Special issue statement
- Acknowledgements
- Review statement
- References