the Creative Commons Attribution 4.0 License.
the Creative Commons Attribution 4.0 License.
 | 25 Jan 2023
Non-invasive blood sugar detection by cost-effective capacitance spectroscopy
Shazzad Rassel
Md Rejvi Kaysir
Abdulrahman Aloraynan
Dayan Ban
Capacitance spectroscopy is a promising technique for detecting small changes in electrical properties of human blood such as conductivity, permittivity, capacitance, and dielectric constant due to the change of glucose concentration. We studied the capacitance of tissue-mimicking phantoms and the human body, in vitro and in vivo, for detecting blood sugar levels non-invasively by a simple and cost-effective setup. We found that, in tissue-mimicking phantoms, capacitance decreased ∼19 % for glucose concentration increases of 85 % with a correlation coefficient of R2=0.96. In the oral meal tolerance test (OMTT), the body capacitance increased less than 9 % for a 50 % increase in blood sugar level, and it followed the invasive reference with a lag time of ∼25–45 min and semi-invasive reference with a nominal time delay. This lag time is associated with the food digestion time and the diffusion time for the glucose to reach interstitial fluid from blood vessels. We also studied different types of metal pads made of copper, gold-coated copper, and aluminum with various sizes for system optimization. Considering the simplicity, low cost, easy operation, and moderate performance, this capacitive spectroscopy could potentially be a promising technique of detecting blood sugar levels and could be incorporated into other blood sugar detection techniques to reinforce the overall performance.
- Article
(4905 KB) - Full-text XML
- BibTeX
- EndNote


Diabetes mellitus (DM) is one of the very common and chronic diseases in the present world. According to a World Health Organization (WHO) report on diabetes, 422 million adults globally were living with diabetes in 2016, leading to 1.5 million deaths in 2012 and 4.9 million in 2014 (World Health Organization, 2016, https://apps.who.int/iris/bitstream/handle/10665/204871/9789241565257_eng.pdf;jsessionid=CA462223510EC06B030B3827B601A61B?sequence=1, last access: 1 February 2022). The number of diabetic patients is increasing rapidly and is projected to be doubled by 2030 (Wild et al., 2004). In Canada, about 3 million people (8.1 %) were living with diagnosed diabetes in 2013–2014, and by 2022, 2.16 million new cases of diabetes are expected (Diabetes in Canada, 2019), corresponding to CAD 15.36 billion in health care expenditure (The cost of diabetes in Canada over 10 years, 2019).
To date, there is no cure for diabetes; however, it can be controlled by regulating the sugar intake in the blood. Hence, diabetic patients need to monitor their blood sugar levels regularly, a few times a day. The conventional techniques for measuring blood sugar levels are invasive in nature and require drawing out blood by pricking fingertips. To measure this sugar level without any pricking, researchers have been working for decades on the development of non-invasive techniques by exploring different approaches, such as near-infrared spectroscopy (Maruo et al., 2003; Rachim and Chung, 2019), mid-infrared spectroscopy (Liakat et al., 2014; Rassel et al., 2020), Raman spectroscopy (Shih et al., 2015), optical rotation of polarized light (Ozana et al., 2016), optical tomography (Kuranov et al., 2007; Esenaliev et al., 2001) and so on. Meanwhile, a limited work was reported with non-optical techniques where electrical properties of human blood, plasma, interstitial fluid (ISF), and tissues were characterized utilizing skin impedance spectroscopy (Ollmar et al., 2013; Amaral and Wolf, 2007), capacitance, and dielectrics spectroscopy (Karacolak et al., 2013; Venkataraman and Freer, 2011; Yilmaz et al., 2014b). Among these electrical spectroscopic techniques, capacitance spectroscopy in particular is a promising nondestructive method with good sensitivity in detecting blood sugar levels as well as other diseases (Arpita, 2016). This technique is comparatively cheaper and simpler which makes it useful for measuring the quality of food such as banana, pears, sapota, and papaya (Raja and Shanmugasundaram, 2020; Soltani, 2010; Azadbakht et al., 2020; Soltani Firouz et al., 2011; Mohapatra et al., 2017; Bhosale and Sundaram, 2015). For example, the starch of any fruit is converted to glucose during the ripening process which increases their electrical energy storability (e.g., capacitance), relative permeability, moisture level, and ionic concentration over time. This electrical storability was measured in terms of capacitance using a parallel plate capacitor during various stages of the ripening process with a linear positive correlation of R2=0.97 with more than 90 % accuracy for sapota fruit (Raja and Shanmugasundaram, 2020).
This sensitivity of capacitance to the change of glucose concentration in fruits can be applied to correlate blood sugar levels for diabetic patients. The capacitance along with related electrical parameters are very sensitive to changes of glucose concentration in aqueous solution, blood plasma, phantoms, and diabetic blood. The complex permittivity of an aqueous glucose solution was investigated for the 1–8 GHz range (Turgul and Kale, 2016). The real and imaginary part of the complex dielectric constant decreased with the increase in glucose in an aqueous solution (Zeng et al., 2018; Park et al., 2003; Jang et al., 2018). The relative permittivity and conductivity of blood samples collected from diabetic patients were studied by a network analyzer over the frequency range 1–10 GHz (Venkataraman and Freer, 2011). The dielectric constant decreased for the 0.3–20 GHz range measured by patch and microchip resonator in blood-mimicking phantoms similar to wet skin, fat, and muscle (Yilmaz et al., 2014a, b). A similar trend for dielectric constant was also found in blood plasma for the 0.5–20 GHz frequency range (Topsakal et al., 2011). However, a change of glucose concentration is reported to be more sensitive in a lower frequency regime due to the presence of α and β dispersion which usually occur below 1 MHz and contribute to electrical properties of bio-cells (Schwan, 1985). Still, very few investigations are reported in the literature. The electrical conductivity of an aqueous glucose solution was studied in the frequency range of 50 Hz to 1 MHz (Juansah and Yulianti, 2016; Li et al., 2018). The dielectric constant showed a negative correlation to blood sugar levels using two electrode measurement systems at frequency range 40 Hz to 30 MHz (Gemanam and Suardi, 2021). Beside these in vitro investigations at different frequency ranges, a parallel plate capacitor is reported as a promising method of correlating blood sugar levels in vivo. The value of the dielectric constant followed the variation of the blood sugar levels when a needle-type parallel plate capacitor was pinned to a tail of a hamster (Park et al., 2003). A similar parallel plate capacitor was attached to the human forearm and the measured capacitance followed the blood sugar level when artificial sweeteners or sucrose were taken orally (Periyasamy and Anand, 2016). Recently, a promising result was reported where a finger was inserted inside a semi-cylindrical parallel plate capacitor made of copper (Dutta et al., 2019). The body capacitance increased linearly with blood sugar level at a measurement error of only ±3.5 % with respect to the glucometer reference. They verified their results with nine subjects at different combinations of sex, age, and diabetic conditions. Considering the small number of published works on body capacitance measurement along with the lack of comprehensive investigations, we were inspired to explore capacitance spectroscopy for detecting blood sugar levels. To improve the performance of the existing capacitance spectroscopic methods for measuring blood sugar, it is necessary to improve the detection accuracy with inexpensive design. This work aimed at implementing a cost-effective design with improved sensitivity for monitoring blood sugar in the human body.
In this paper, a comprehensive capacitive response of tissue-mimicking phantoms and the human body is thoroughly studied both in vitro and in vivo, non-invasively. A simple recipe is developed to prepare tissue-mimicking phantoms with minimum constituents, and their purity and hardness are checked by FTIR (Frontier transform infrared) and a d33 meter, respectively. Interdigital electrodes, parallel plate capacitors, and metal pads are made from three different materials (copper, gold, and aluminum) and their performances are studied. A promising correlation coefficient R2=0.96 is observed between the capacitance measured from tissue-mimicking phantoms with varying glucose concentrations from 0 to 500 mg dL−1. In addition, human body capacitance is measured through an oral meal tolerance test (OMTT) and compared to reference glucose level acquired from a commercial glucometer. Less than a 9 % increase in body capacitance is observed for a 50 % increase in blood sugar level with 25–45 min of lag time. The proposed experimental setup is very simple in design and inexpensive to construct compared to contemporary optical glucose detection systems with comparable detection ability.
In Sect. 2, we discussed the preparation of phantom samples, metal pads, and experimental setup. In the beginning of Sect. 3, we discussed the physics behind the origin of human body capacitance along with the sanity-checking results of phantoms. Later, we discussed both in vitro and in vivo results of glucose detection along with the discussion of system optimization. Finally, we discussed the common sources of experimental errors. Hopefully, this work will indicate a direction for measuring blood sugar non-invasively in an easy and cost-effective manner, yet with promising results.
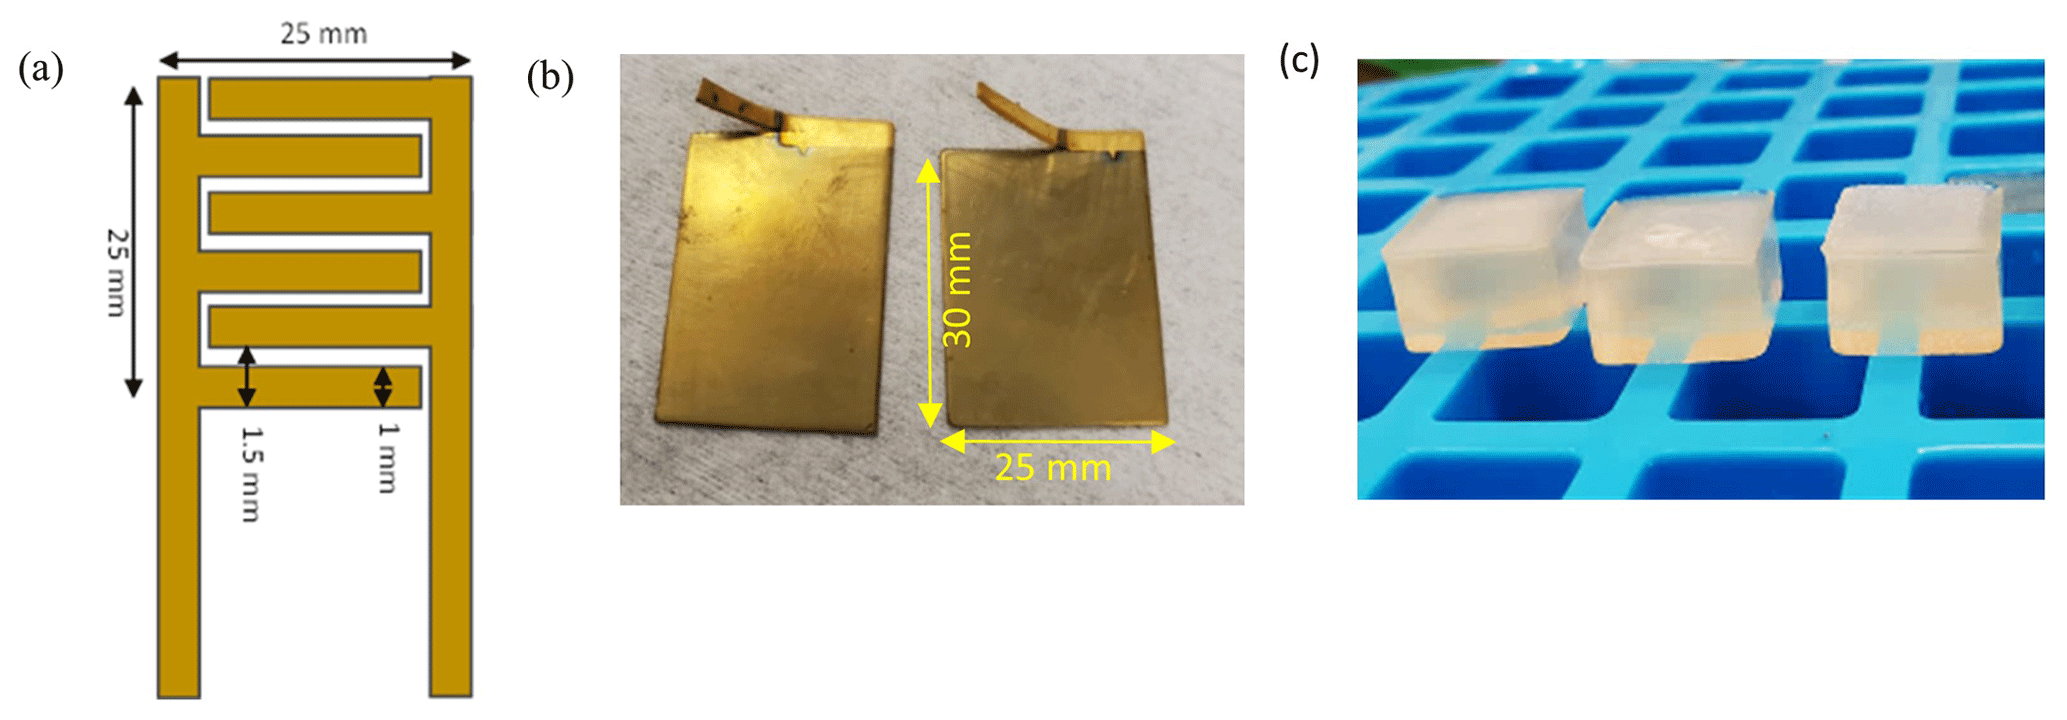
Figure 1(a) Interdigital electrode for in vitro measurement, (b) metal pads with gold coating for in vivo measurement, (c) picture of the phantom sample.
2.1 Phantom tissue preparation
To mimic the human tissue, phantom samples were prepared with varying glucose concentrations from 100 to 600 mg dL−1 with a 50 mg dL−1 step. A simple recipe for preparing phantom tissues was developed composed of only bovine gelatine, water, D-glucose, and formaldehyde. The D-glucose and bovine gelatine were purchased from Sigma Aldrich. Before preparing the phantom samples, a mother glucose solution of 1000 mg dL−1 was prepared and diluted according to the glucose concentration needed; 50 mL of water was heated to 50 ∘C and 2 g of gelatine was poured into the aqueous solution followed by vigorous stirring until the solution looked semi-transparent. Then, the temperature was increased to 70 ∘C and 100 µL of formaldehyde (formalin) was dispensed to provide mechanical hardness. The resultant solution was cooled down to near 40 ∘C and poured into the mold. The size of the samples was approximately cm3. The samples were refrigerated for 24 h for cross linking. The picture of the transparent samples is shown in Fig. 1c.
2.2 Metal pad preparation
Two types of electrodes were prepared as shown in Fig. 1. Interdigital electrode (Fig. 1a) for in vitro measurement was prepared by putting conductive adhesive copper tape of ∼100 µm thick on microscope glass slides. The total metal area of the pad was mm2 with ∼1 mm thick metal electrode at ∼1.5 mm gap. Metal pads (Fig. 1b) for in vivo measurement were made from a 0.5 mm thin copper sheet with an area of mm2. These pads were electroplated with ∼300 nm of gold. A thin layer of polydimethylsiloxane (PDMS) was deposited on both the interdigital electrode and metal pads by the drop-casting method (Kaliyaraj SK et al., 2020).
The material of the interdigital electrode plays an important role in the measurement of the capacitance. We prepared electrodes with copper tape and aluminum foils available in our lab. Specifically, we choose copper tape because it has adhesive on one side which offered better control in preparing the finger electrodes. The top of the copper electrodes was covered with thin plastic to protect the copper tape from degradation due to oxidation from the environment. However, when we prepared a parallel plate capacitor, we considered three electrode materials, i.e., copper, aluminum, and gold-coated copper, and correspondingly investigated their performance.
2.3 Experimental setup
The experimental setup of the capacitance spectroscopy is shown in Fig. 2. The tissue-mimicking phantoms were characterized by a parallel plate configuration as shown in Fig. 2a, where phantoms were sandwiched between two copper plates along with a force-sensitive pressure sensor (SEN0295, Thorlabs) placed at one side. The resistive output of the pressure sensor was monitored by the multimeter. An LCR meter (880 LCR meter from B & K Precision Corporation) was connected to the parallel plate electrodes by alligator clips and controlled by a custom-written LabView program. The frequency of the LCR meter was varied from 1, 10, and 100 kHz with an applied bias voltage of 0.6 V. After characterizing in parallel plate configuration, phantoms were placed on top of the interdigital electrodes (Fig. 2b), followed by putting a force sensor on top. A pressing metal plate was placed on top of the pressure sensor to exert a uniform pressure. For in vivo measurement, index and middle fingers were placed on top of metal pads as shown in Fig. 2c. These pads were connected to the LCR meter by metal clips. All experiments were carried out on top of an optical table to minimize vibration. During in vivo measurement, the body was isolated from touching the optical table to avoid any presence of unwanted grounding leakage.
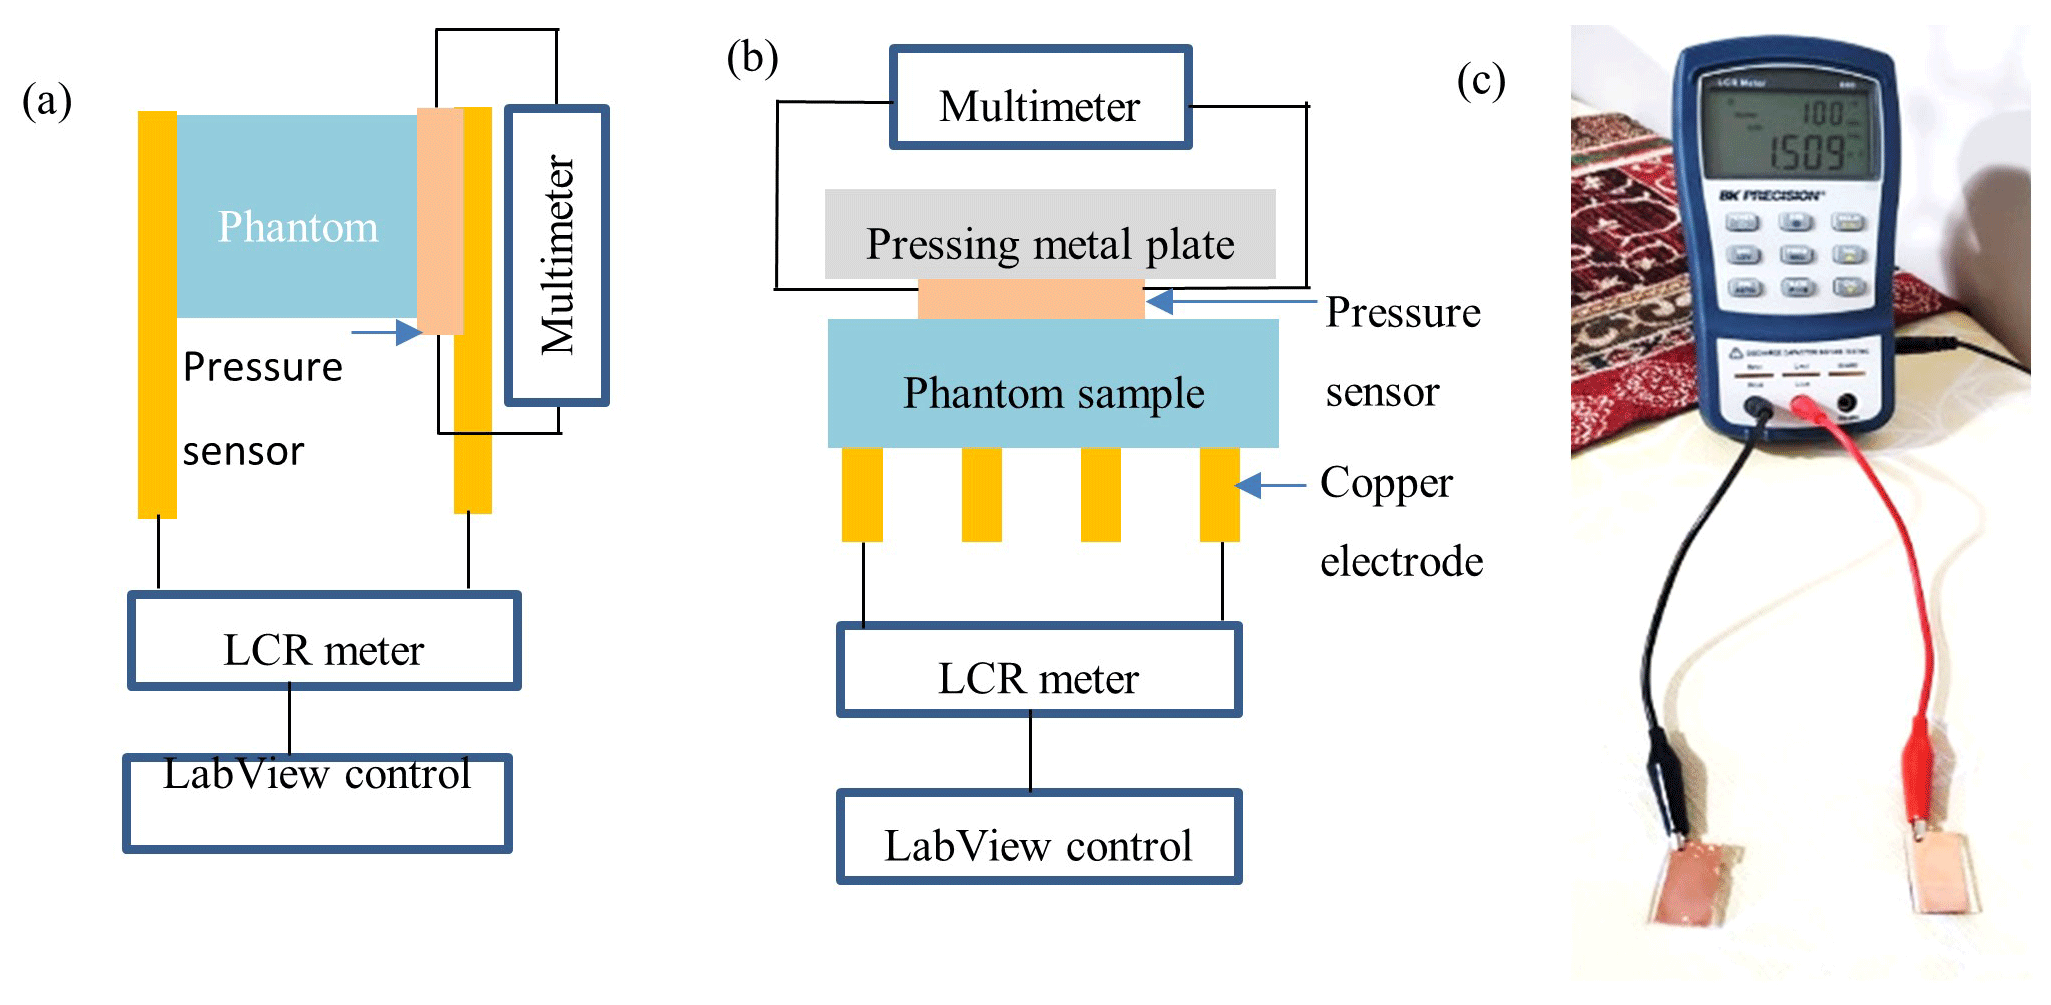
Figure 2(a) Parallel plate configuration, (b) interdigital electrode configuration, (c) metal pads with LCR meter connected.
3.1 Origin of the body capacitance
The main form of sugar that we typically consume every day is D-glucose. After we digest food, the generated D-glucose passes through the bloodstream, reaches body cells, and gets absorbed. When glucose concentration increases in human blood plasma, a significant rearrangement of electrolytes occurs through cell membranes due to the movement of bodily fluids (Katz, 1973; Hillier et al., 1999), especially the concentration of sodium ion decreases and potassium ion increases (Hillier et al., 1999). This electrolyte rearrangement tends to create a balance to maintain the osmolarity and cell sizes (Lindmark and Engström, 2000). As a result, the cell potential changes due to ion concentration change which eventually impacts the overall dielectric property of the cell membrane. This behavior of a cell's electrical property can be determined by capacitance spectroscopy (Caduff et al., 2004; Beving and Eriksson, 1994; Hayashi et al., 2003; Feldman et al., 1996).
The cell membrane consists of a layer of nonconductive lipid material sandwiched between two conductive protein layers and behaves like a capacitor when an alternating current passes through (Kamat et al., 2014; Caduff et al., 2019). The specific membrane capacitance of a biconcave human erythrocyte (red blood cell without nucleus) increases by more than 25 % for a blood sugar level increase of 360 mg dL−1 (Livshits et al., 2006; Caduff et al., 2019). The dielectric permittivity of the lipid bilayer in aqueous surroundings increases with the increase in the sucrose due to the possible alternation in the membrane structure and organization induced by the interaction of cell membrane and sugar (Vitkova et al., 2021). Overall, the dielectric constant, the relative permittivity, and the conductivity of diabetic blood is found to be 13 %–43 % more than that in normal human blood (Abdalla et al., 2010; Man et al., 2013; Gemanam et al., 2020; Desouky, 2009) because glucose stimulates the formation of free radicals in diabetes blood by several bio-oxidation processes (Obrosova et al., 2002). These free radicals increase the dipole density in blood and consequently increase conductivity and permittivity.
3.2 Characterization of the phantoms
3.2.1 FTIR spectrum
Phantom samples and constituent materials were investigated by FTIR spectroscopy to verify the presence of contamination. The FTIR scans of the phantom and constituent materials such as bovine gelatine, sugar, water, and formaldehyde were collected individually as shown in Fig. 3b. The scan frequency was kept to a 1–1.5 µm range because only visible and near-infrared light could pass through semi-transparent phantoms. The 0 mg dL−1 phantom could be considered as pure gelatine which exhibited nominal absorption in the near-infrared region as expected (Shimokawa et al., 2019). Note that gelatine had strong absorption peaks in the mid-infrared region in the 3–10 µm range (Das et al., 2017). All FTIR spectra showed a similar shape which evidently portrayed that the tissue-mimicking phantoms were free from any contamination that came from the preparation or storage phase.
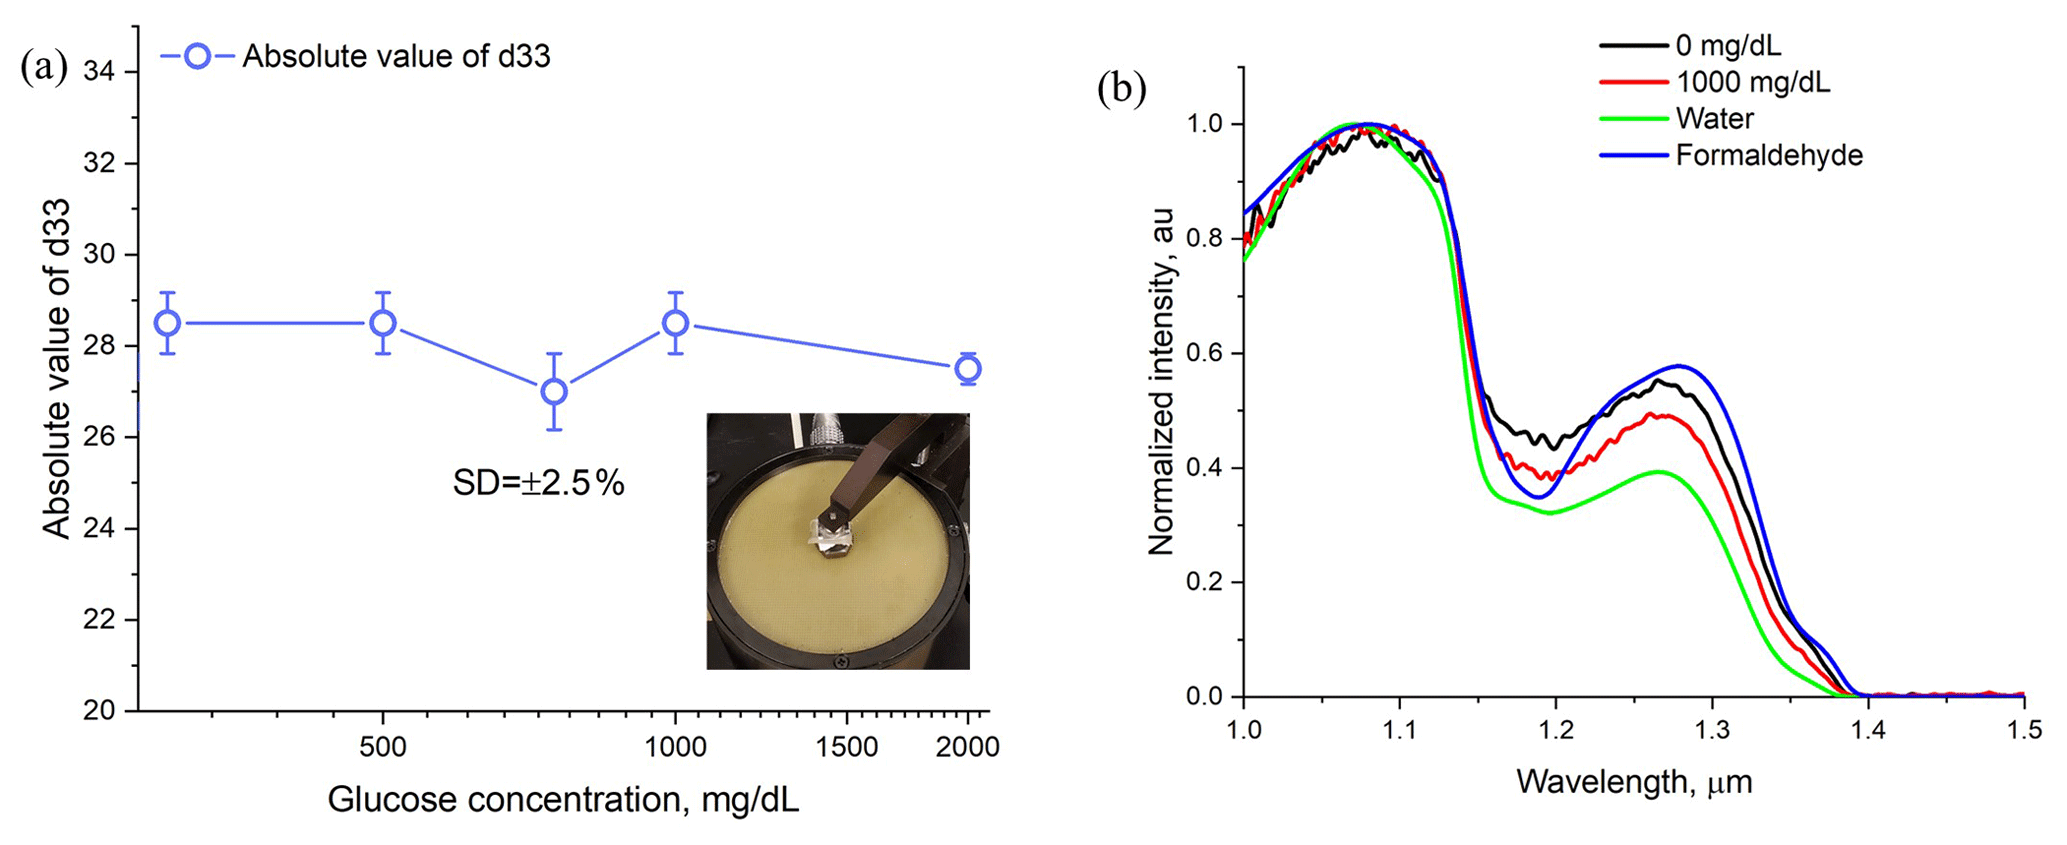
Figure 3(a) Value of d33 of different phantom samples with varying glucose concentration, inset: sample was placed on top of the d33 meter, (b) FTIR characterization of the samples with all the constituents of 0 and 100 mg dL−1 of aqueous glucose solution, water, and formaldehyde.
3.2.2 Sample hardness
The hardness of phantoms might come from the variation of glucose concentration, cross-linking time, and humidity level of the lab and impact electrical properties. Hence, it was measured by a d33 PiezoMeter to verify the mechanical stability; d33 measures the deformity or the strain of phantoms in a parallel direction in response to an applied electric field. In other words, this coefficient represents charge per unit force in the direction of polarization (d33 PiezoMeter Systems, 2018). The hardness was measured by clamping phantoms on the d33 meter as shown in the inside of Fig. 3a followed by applying a constant force of 246 mT. Figure 3a shows that the absolute value of d33 remains constant for all variations of glucose concentration with a standard deviation of ±2.5 %. This result portrays the conformity of hardness in phantoms. Indeed, the amount of error due to hardness differences should be very small because the amount of glucose was very small compared to gelatine in phantoms (mg vs. g).
3.3 In vitro measurement
Capacitance was measured from blood-mimicking phantoms by using both parallel plate and interdigital configuration. The capacitance of a simple parallel plate capacitor shown in Fig. 1b can be written as
where C is the total capacitance, εr is the relative permittivity of the material between the parallel plates, εo is the permittivity of the vacuum F/M, A is the surface area of the electrode plate, and d is the distance between the plates. In our experiment, the human body part between two fingers acted as a dielectric medium. The capacitance of the interdigital electrode as shown in Fig. 1a is a complex analytical calculation and needs advanced mathematics (Igreja and Dias, 2004; den Otter, 2002). However, it can be estimated by the following simplified equation
where A is the area of the electrode and l is the distance between adjacent electrodes (Kidner et al., 2006).
The performance of the capacitive spectroscopy can be affected by the dimension of the parallel plates, the electrode materials, and the sensing area. For example, the output of the capacitor meter varies when the sensing area of the interdigital capacitor varies depending on the size of the phantom samples. To eliminate this variation due to sensing area differences, we prepared our sample using a uniform-sized mold as shown in Fig. 1c. The area of the contact surface of our phantom samples has dimensions of approximately 1.5×1.5 cm2. Considering that the contact surface area of our phantom samples is uniform, we kept the sensing area variation error to a minimum value. Besides minimizing the sensing area error, we also used a straightforward structure of interdigital electrodes to keep the process simple. Different types of interdigital electrode configurations are routinely used as a sensor in the food and beverage industry, biological application, environmental monitoring, and medical diagnosis areas. The most popular types of configuration are finger-type comb electrodes, circular-type electrodes, and so on (Soares dos Santos et al., 2019), many of which are chosen according to specific applications. Based on the suitability of our square-shaped phantom samples, we choose finger-type comb interdigital electrode configuration to get maximum electrode to the phantom contact area. The calculation of capacitance of any interdigital electrodes requires solving analytical equations and depends on many parameters such as electrode finger size, length, thickness, spacing, and material. To keep the complexity minimum, we designed few electrodes and picked the best one considering that it can be compatible with the size of our phantom samples and demonstrate maximum output capacitance.
Phantoms were placed between two electrodes for parallel plate configuration, and on top of electrodes for interdigital capacitors. A uniform pressure was applied to phantoms and monitored by a force-sensitive pressure sensor. A semiconductor characterization system (Keithley 4200-SCS) was used to measure the capacitance of phantoms with varying frequencies due to the limitation of our LCR meter at high frequency. The plot of phantom capacitance vs. frequency is shown in Fig. 4a, where the value of capacitances exhibits a sharp decreasing trend with increasing frequencies. A similar trend is also observed for the case of blood collected from diabetes patients in Gemanam and Suardi (2021). This sharp decrease in capacitance is associated with the strong interaction of high microwave frequency with the dipole orientation and ionic conduction that are known to take place within the blood (Abdalla et al., 2010; Beving et al., 1994).
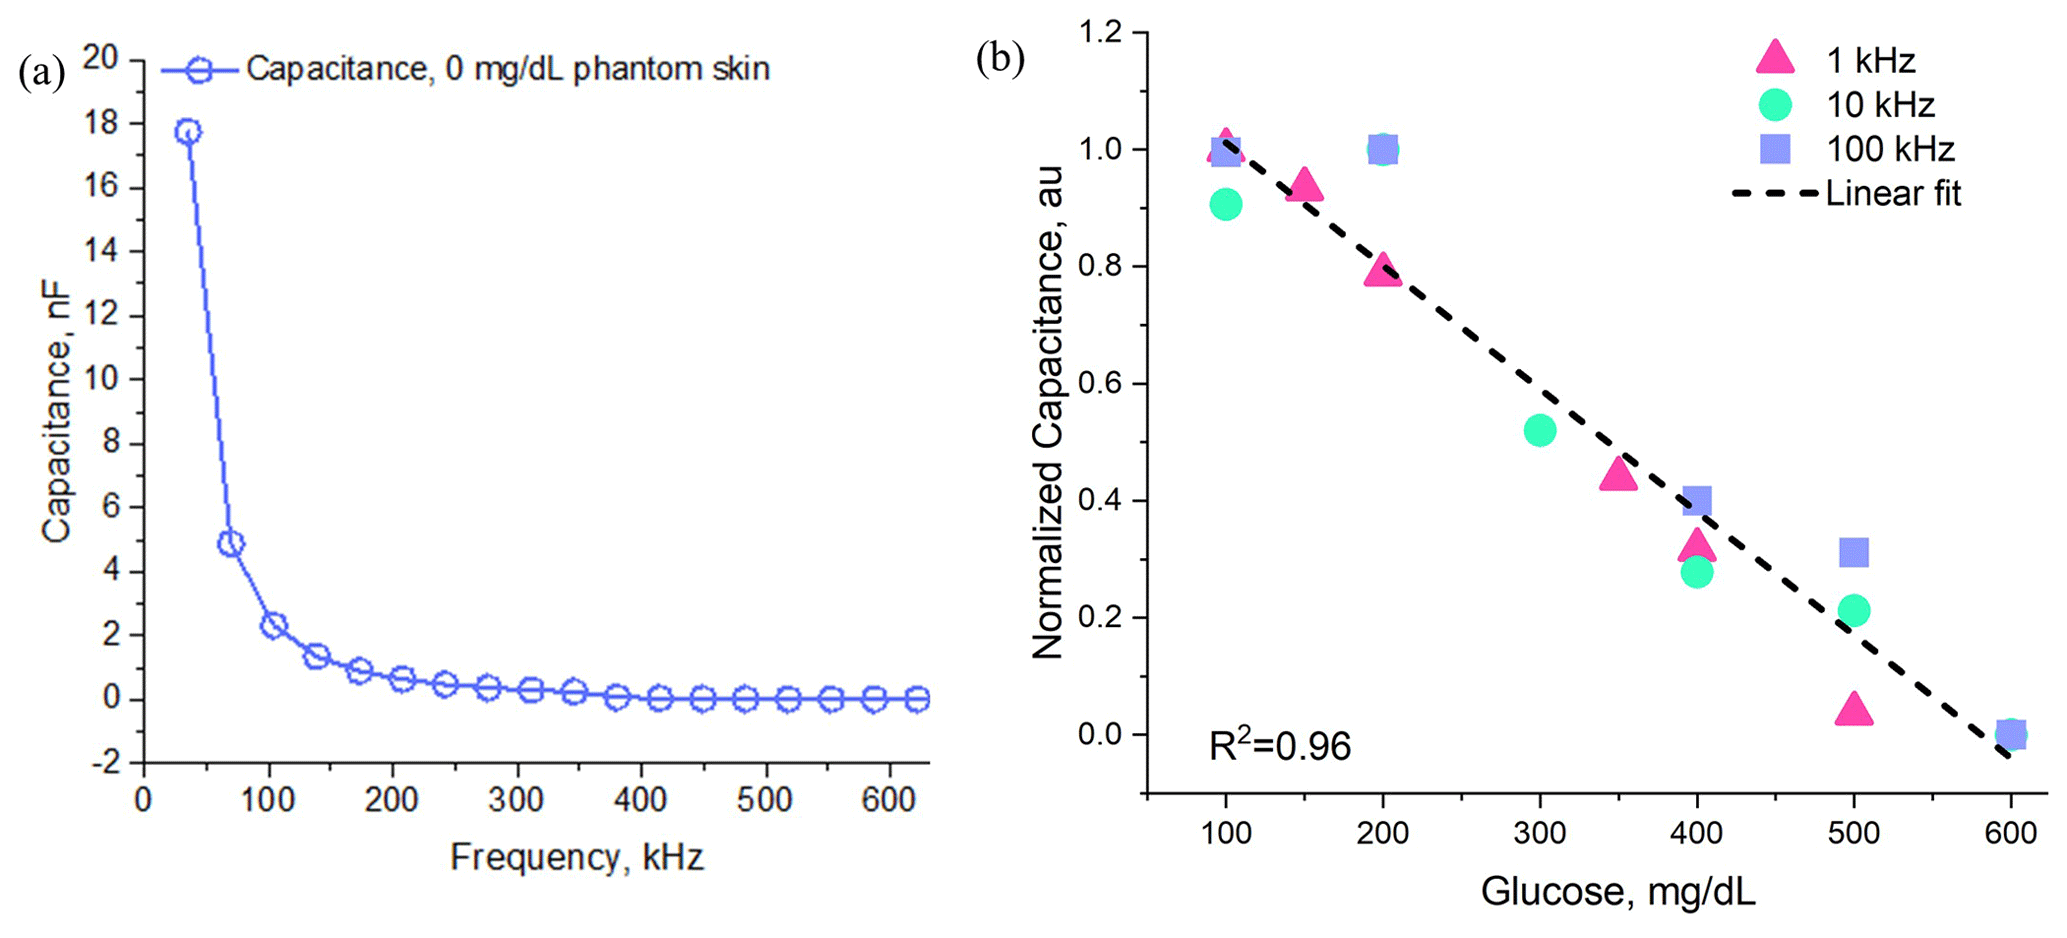
Figure 4(a) In vitro measurement of blood-mimicking phantoms with varying frequency, (b) normalized capacitance of phantom samples with varying glucose concentration.
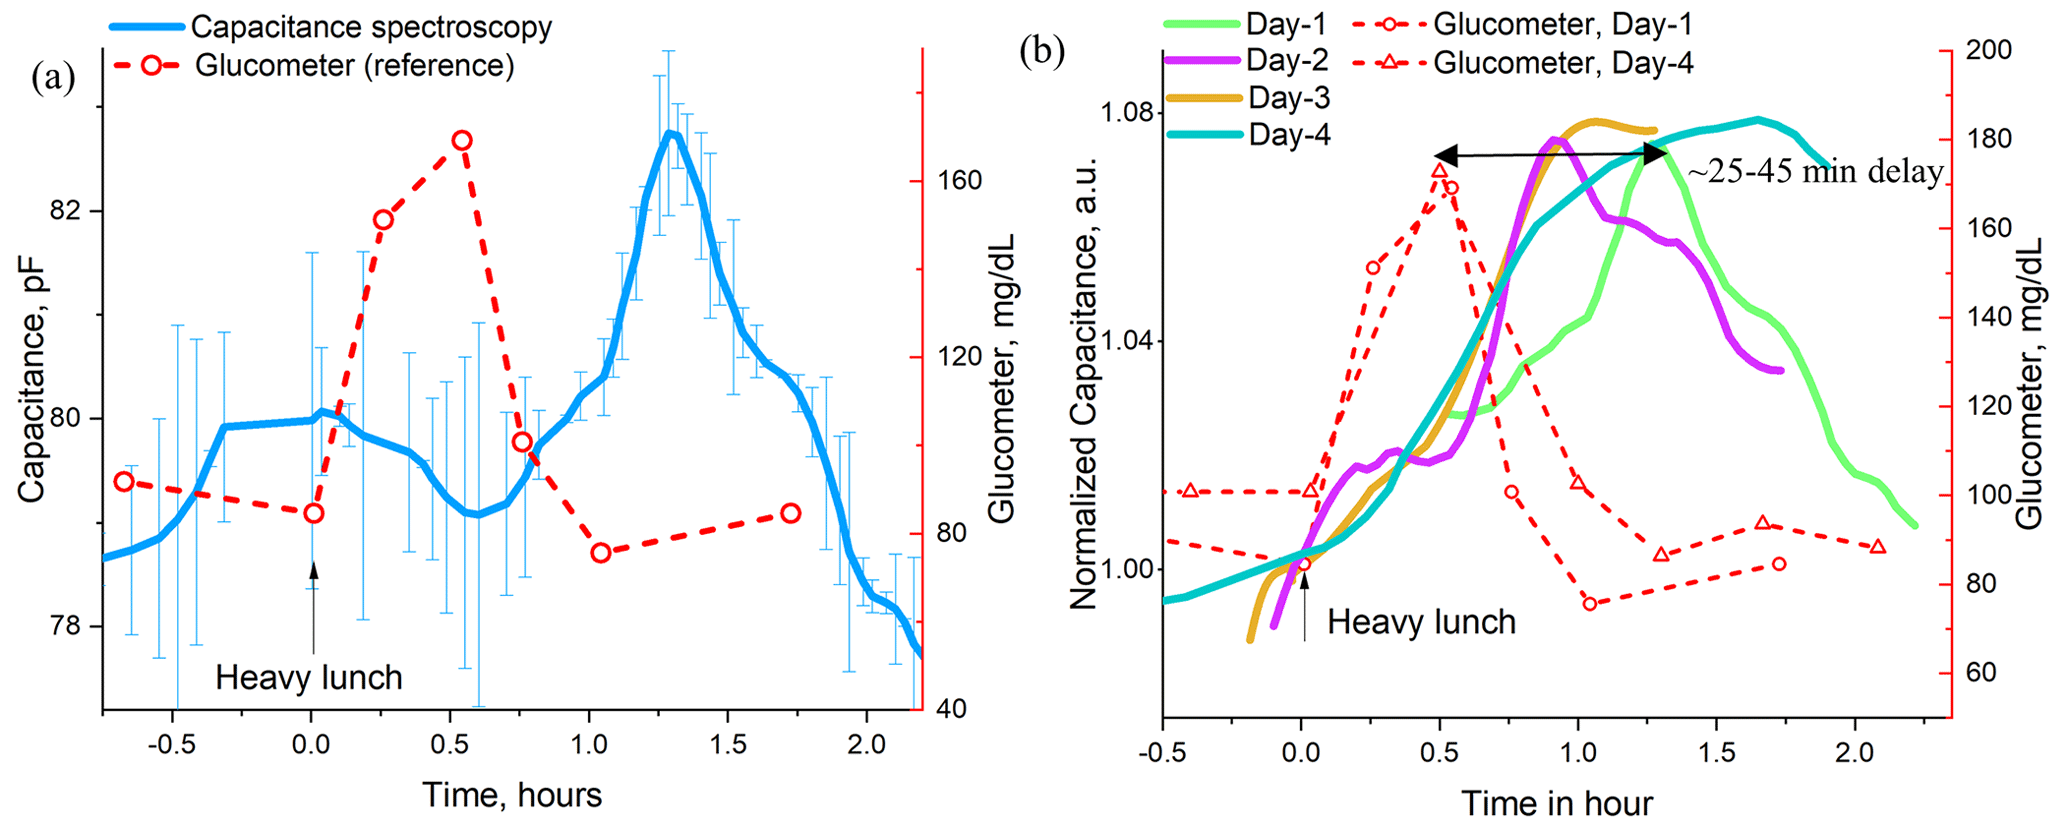
Figure 5(a) Oral meal tolerance test (OMTT) for capacitance measurement with reference measurement from glucometer, (b) summary of the capacitance spectroscopy at different date.
A commercially available LCR meter was used to replace the semiconductor characterization system. The value of capacitances was recorded for phantoms with a varying glucose concentration of 100–700 mg dL−1. Capacitances were measured multiple times and their mean values were recorded considering the usual fluctuations in biological samples. Figure 4b shows that the capacitance decreases monotonously with a correlation coefficient of R2=0.96. Overall, less than 19 % decrease in capacitance was observed in phantoms for an 85 % increase in sugar concentration for 1–100 kHz range. The maximum ∼19 % contrast in capacitance was reflected at 1 kHz frequency. This result is comparable to Yilmaz et al. (2014a) and Yilmaz and Hao (2011) where a multilayer digital phantom was characterized. A similar trend is also reported in Topsakal et al. (2011).
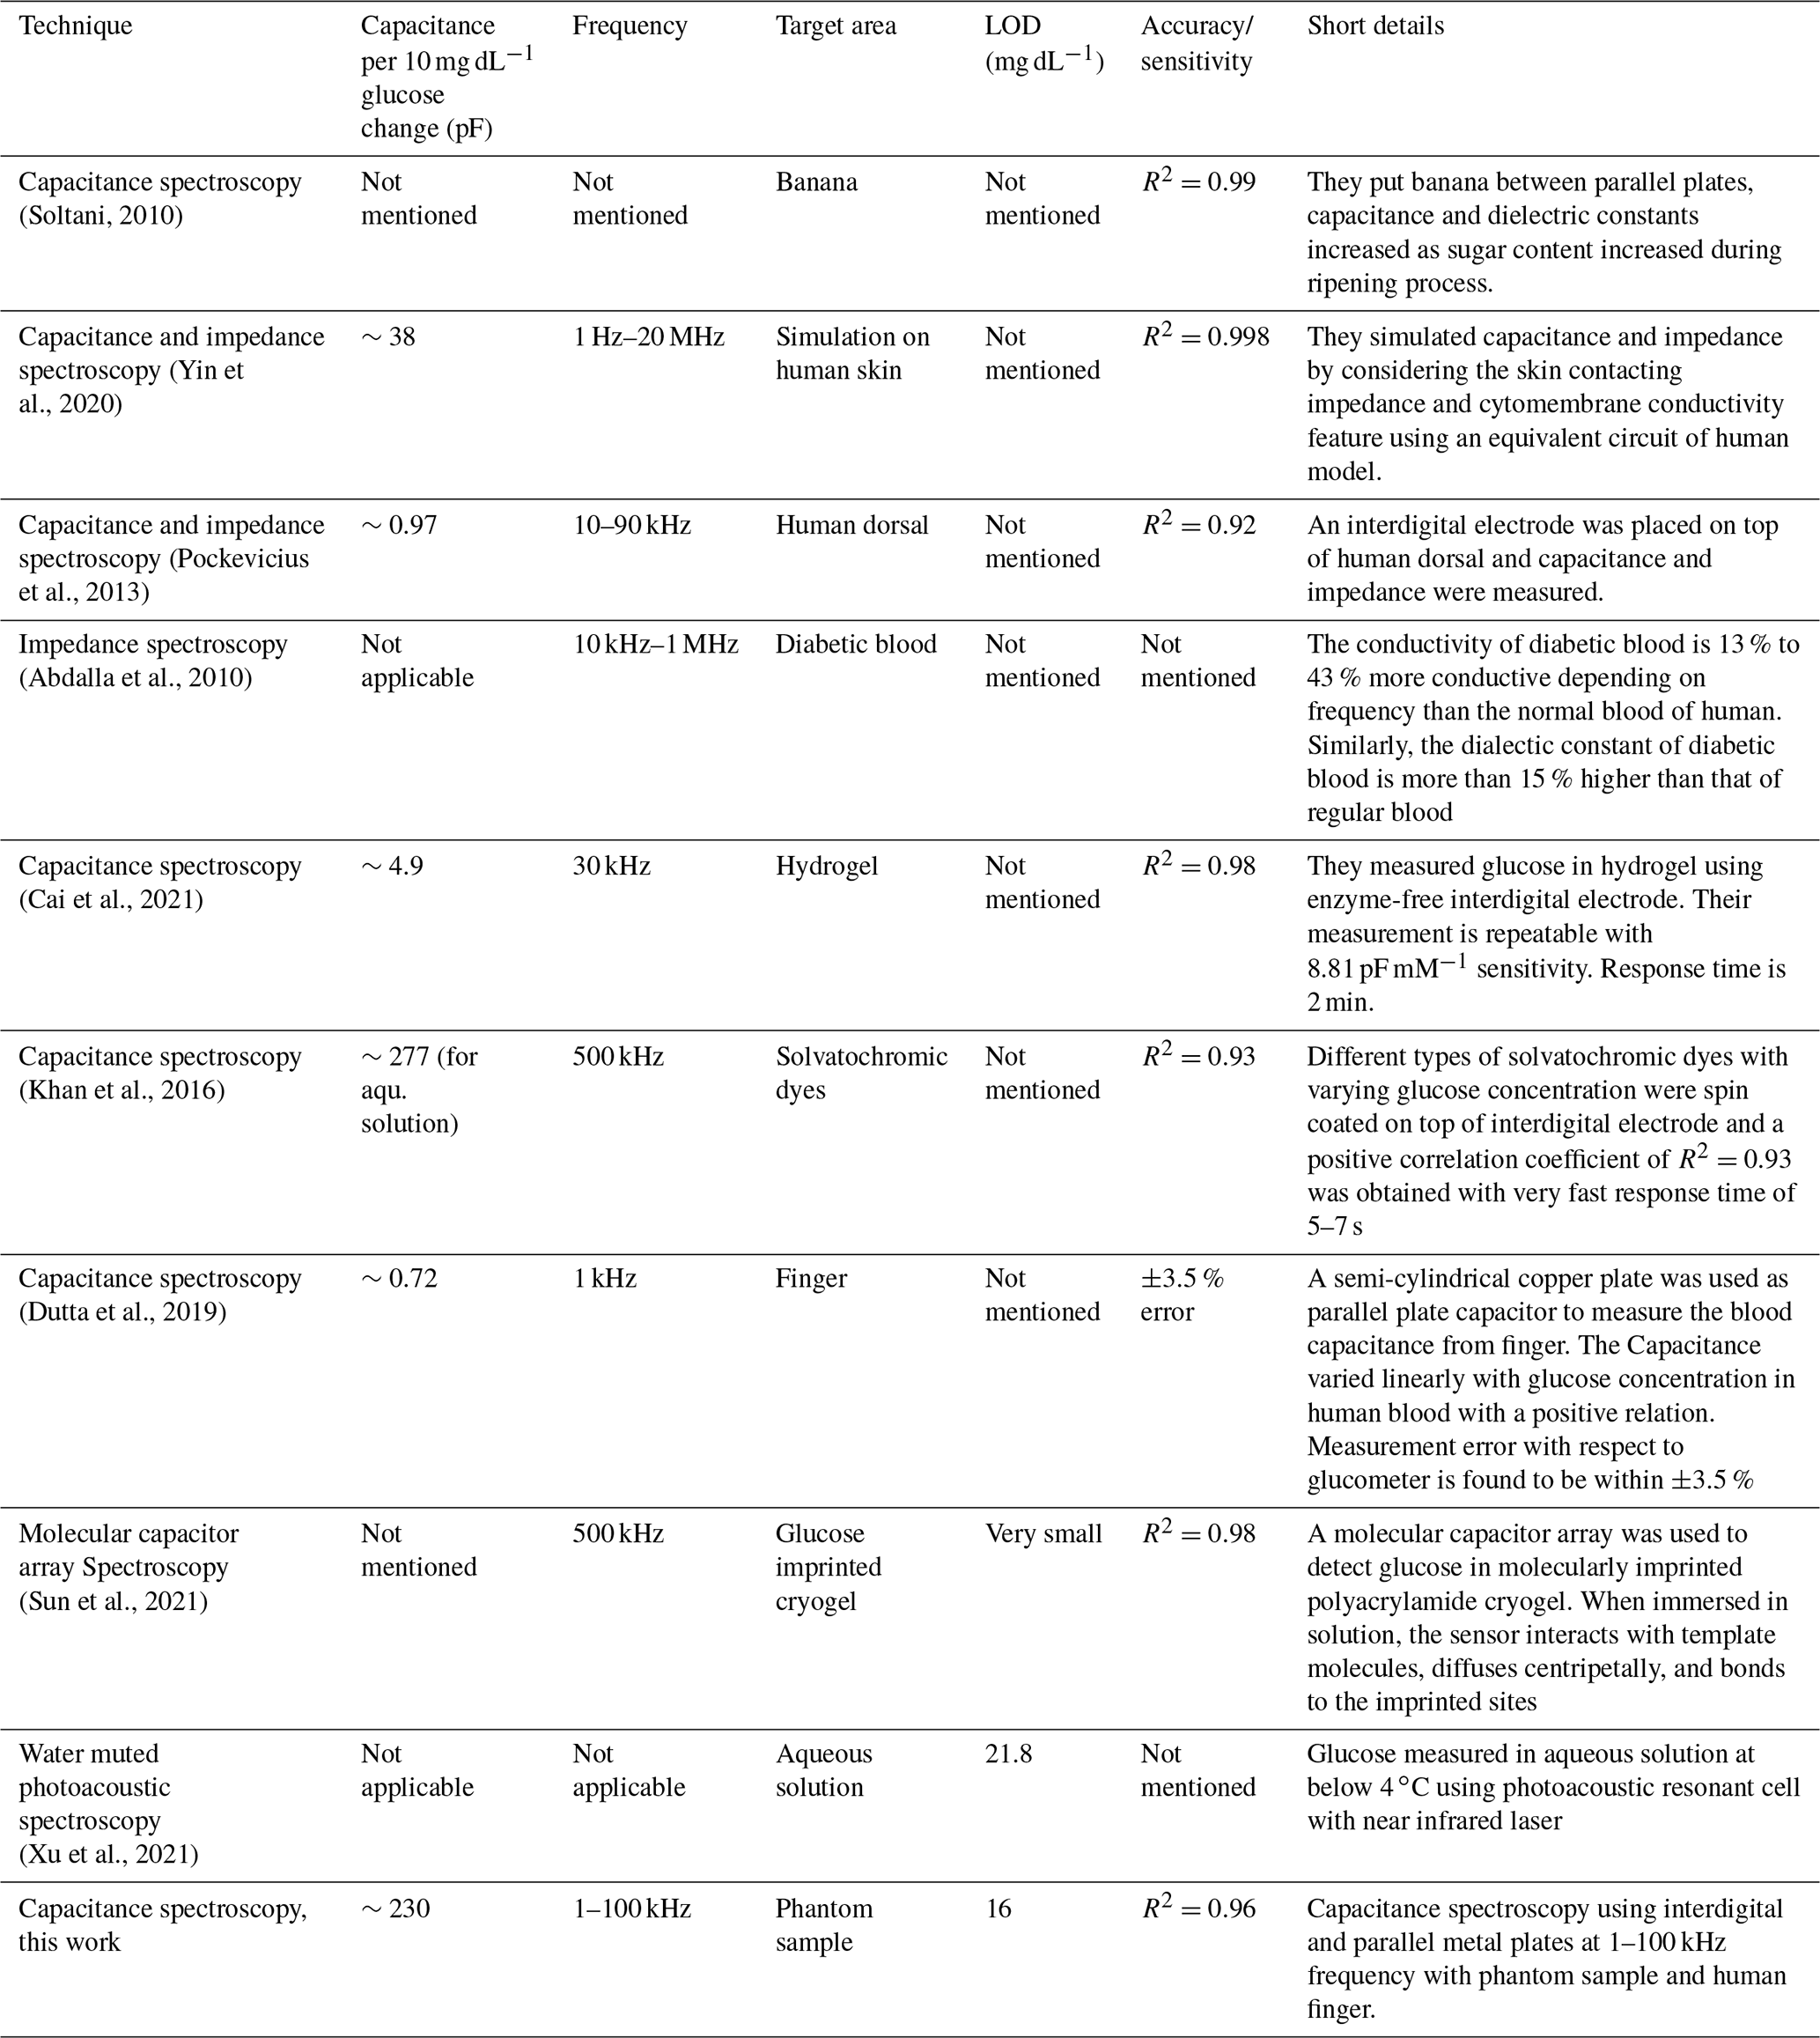
We calculated the limit of detection (LOD) by using the equation k* standard deviation/slope where k was chosen as 2 which corresponds to a confidence level of 95 % (Xu et al., 2021; Castle, 2020). The LOD is estimated to be 16 mg dL−1 up to the clinically relevant 400 mg dL−1 glucose concentration. In this range, the glucose sensitivity is estimated as ∼23 pF for a 1 mg dL−1 change of glucose concentration in phantom samples. Table 1 summarizes our results along with contemporary non-invasive techniques of glucose detection.
Table 1Contemporary glucose detection techniques and their performances.
3.4 In vivo measurement
The human body capacitance was measured by putting the index and ring fingers of the same hand on gold-coated copper metal pads. Body capacitance was measured by an LCR meter at 0.6 V bias and 1 kHz frequency. The frequency of 1 kHz was chosen because the body capacitance showed a smaller number of fluctuations. Multiple readings were recorded, and their mean value was calculated. The blood sugar level was also monitored by a commercial glucometer invasively and recorded as a reference.
In the OMTT (oral meal tolerance test) study, the healthy subject took a heavy lunch followed by drinking a sweetened coffee to gradually increase the blood sugar level. The values of the body capacitance along with the reference value from the glucometer are plotted in Fig. 5a for a single day and in Fig. 5b for multiple days. It is evident from these plots that body capacitance followed the reference blood sugar level with an approximate delay of ∼25–45 min. A similar trend is also found in Dalla Man et al. (2005), Brodovicz et al. (2011), and Numao et al. (2016) for the OMTT. For all days, body capacitance increases less than 9 % for a 50 % increase in blood sugar level. This increasing trend of body capacitance is expected because of the restructuring of the erythrocyte's membrane due to the increase in glucose concentration for food intake. As a result, a significant change is observed for the relative permittivity (∼22 %), dielectric loss (∼20 %), and ac conductivity (∼45 %) in diabetes red blood cells below 1 MHz compared to normal blood (Desouky, 2009).
A lag time of ∼25–45 min delay is observed between the capacitance spectroscopy and the reference glucometer reading as shown in Fig. 5b for multiple days. This lag time is believed to be associated mainly with the diffusion delay of sugar from the blood to the interstitial fluid (ISF). The ISF is a thin layer of bio-fluid located in the epidermis layer underneath the skin with water solvent containing sugars, salts, and other related chemicals (Wikipedia, 2019). This layer does not contain any blood vessels; however, glucose diffuses into this layer (Cengiz and Tamborlane, 2009). A diffusion time delay of 5–15 min was observed by different types of optical spectroscopies when 50–75 g of glucose was taken orally in an oral glucose tolerance test (OGTT; Kottmann et al., 2016; Huang et al., 2003; Pleitez et al., 2013). A variation in the lag time is associated with the rate of glucose diffusion, the magnitude of concentration difference in various tissues, blood flow, blood vessel permeability to glucose, and acute changes in the release of insulin and glucagon (Færch et al., 2021). However, the lag time we obtained in the OMTT is higher than that of the OGTT (∼15 min vs. ∼45 min). This difference can be associated with the time the human body needs to convert foods into a soluble glucose format along with subsequent diffusion time of blood sugar to reach ISF. A similar lag time of 45 min to 1 h is reported for OMTT in Dalla Man et al. (2005) and Dr. Andreas Eenfeldt's documentary as cited in Chris (Blood Sugar Levels, 2020). It is evident, based on our observation of lag time as shown in Fig. 5, that metal pads in our capacitance spectroscopy are obtaining capacitive information regarding blood sugar variation from interstitial fluid.
We investigated the lag time more closely by using another commercial continuous glucose monitoring (CGM) system named Freestyle Libre from Abbott Laboratories (Why CGM, 2022). This is a semi-invasive sensor attached to the back of the upper arm which can provide real-time glucose readings for up to 10 d for 24 h. Freestyle Libre uses subcutaneous, wired enzyme glucose sensing technology to detect glucose levels from ISF (Heller and Feldman, 2010). We conducted the OGTT by drinking 50 g of glucose and an OMTT by eating carbohydrate-rich food followed by drinking 330 mL of Coke (35 g sugar). During these tests, we collected glucose information from CGM sensors every few minutes. We plotted the continuous glucose information from a healthy volunteer for a time duration of 100 min in Fig. 6. The blue plot in Fig. 6 represents the average of four OMTT results taken on four different days. The shape of these 4 plots taken in 4 different days are identical, but the heights are different. This height depends on the amount of food or glucose the volunteer took during the test. Usually, if the volunteer consumes more food and glucose, then the height increases; it could reach 300 mg dL−1 or more. As the CGM sensor is based on a semi-invasive technique, the blue plots collected glucose information from interstitial fluid located beneath the skin surface. Alternately, the green plot in Fig. 6 collected glucose information directly from the blood vessel by pricking the fingertip. We found that blood sugar reached its peak approximately 30 min after the food or glucose intake as shown by the green plot. On the other hand, we observed a 35–45 min lag time in CGM sensors for similar OGTTs and OMTTs. Overall, there is approximately 12–15 min lag time observed between blood sugar and interstitial fluid which can be explained by the travel time required for the glucose to reach the ISF from the blood vessel.
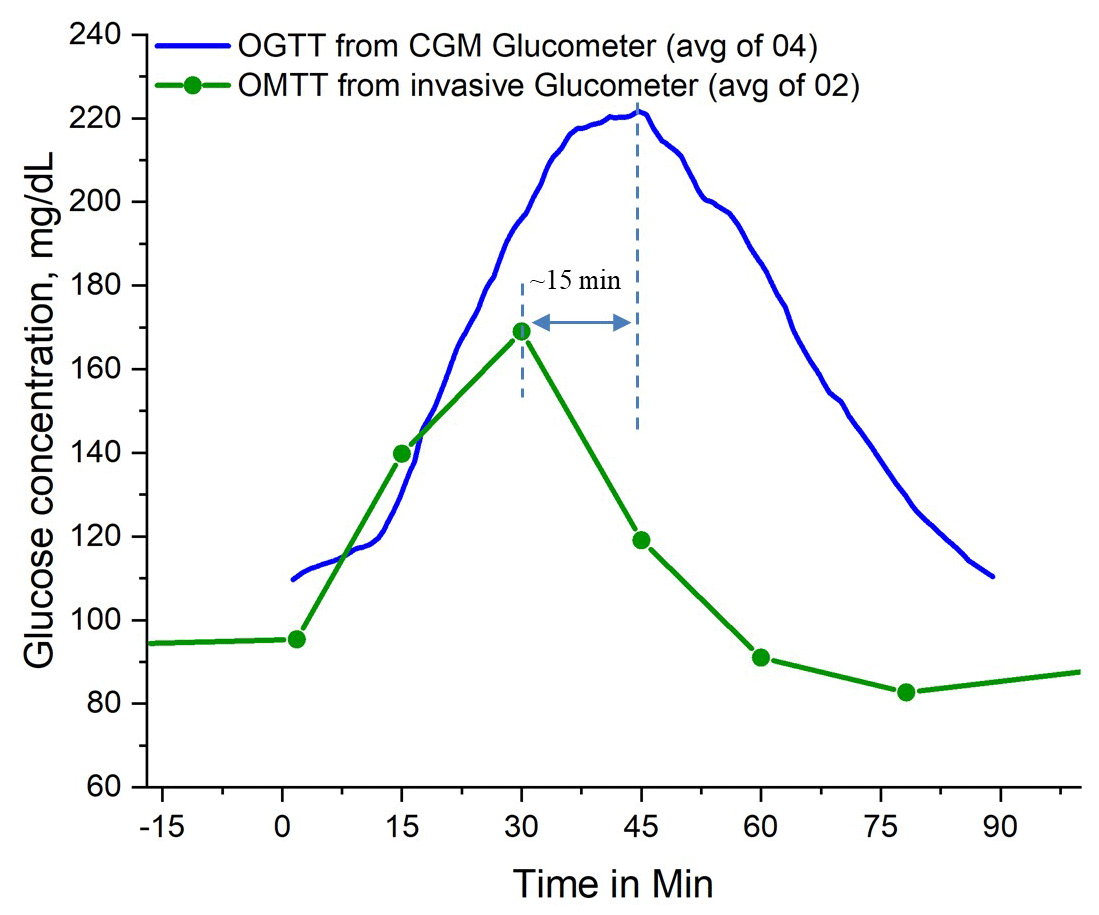
Figure 6Comparison of glucose measurement from the commercial semi-invasive Free Style Libre continuous glucose monitoring (CGM) sensor and the commercial invasive glucometer reading. The CGM sensor was attached to the upper arm and collected glucose information from interstitial fluids (ISFs) every few minutes. Glucose information from a glucometer was collected every 15 min by drawing blood by pricking fingertips.
We conducted another set of OMTTs by eating carbohydrate-rich food followed by drinking a 330 mL of Coke (35 g sugar) and compared the data from capacitance spectroscopy with commercial CGM information in Fig. 7. The red plot in Fig. 7 represents the average of four OMTT results taken on 4 different days, the green plot represents the capacitance spectroscopy during 1 OMTT, and blue plots represent the instances when no food was taken. We can see from our results that capacitance spectroscopy follows the results of the commercial CGM glucometer with minimum delay time. Note that the length of the needle of the CGM sensor was approximately 5 mm long and was placed at the back of the upper-hand position. This length of the needle could reach deep down to the skin tissue to reach the deeper ISF where the travel time of glucose could be less compared to the case of capacitance spectroscopy where we collected information from the thin skin surface of the index and middle fingers. We believe that if we can place the CGM and capacitance sensor in the same place, the lag time that we observed in Fig. 5 will be minimum.
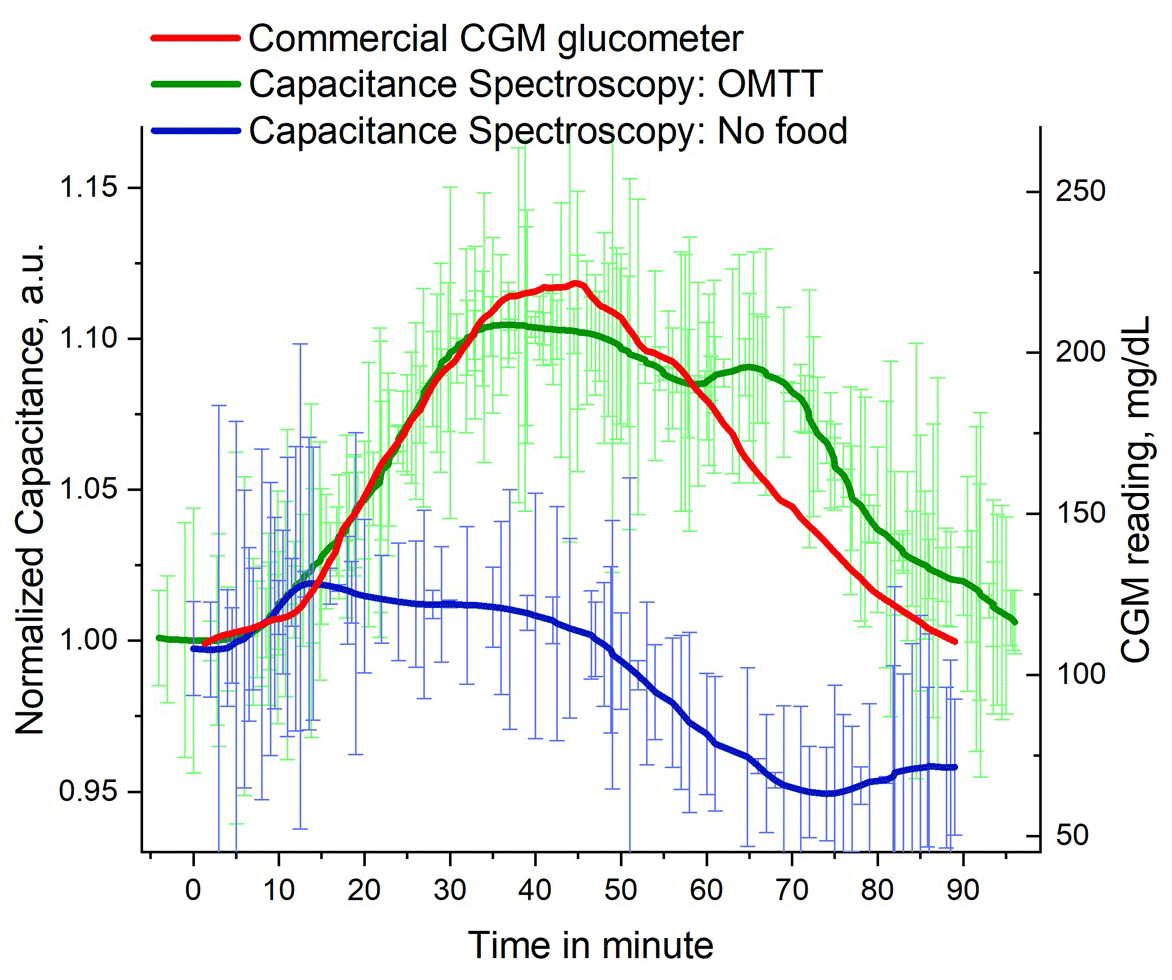
Figure 7Capacitance spectroscopy of human finger in OMTT along with control reference and commercial CMG meter reading.
Low frequency of 1–100 kHz range was selected for conducting capacitance spectroscopy on human fingers. Commonly, when an alternating electric field is applied to human tissues, the ions in bio-cells become polarized and contribute to the overall electrical capacitance. At low-frequency range, electrical charges at cell membranes find enough time to build up and become polarized. On the other hand, at high frequencies, cell membranes can hardly cope with the direction change of an alternating field to be polarized. However, there is no specific choice of frequency found in the literature for conducting capacitance or dielectric spectroscopy, indeed, low frequencies are used to get the benefit of deep penetration inside the tissue (Yilmaz et al., 2019). In addition, low-frequency range is advantageous due to the presence of β dispersion below 1 MHz frequency range which originates from the charging of the cell membrane and eventually contributes to the overall cell membrane capacitance (Desouky, 2009; Sabuncu et al., 2021).
The normal range of the common interfering agents present in adult healthy human blood are as follows (Martin et al., 2002).
Table 2Typical range of important interfering blood components for capacitance spectroscopy of glucose.
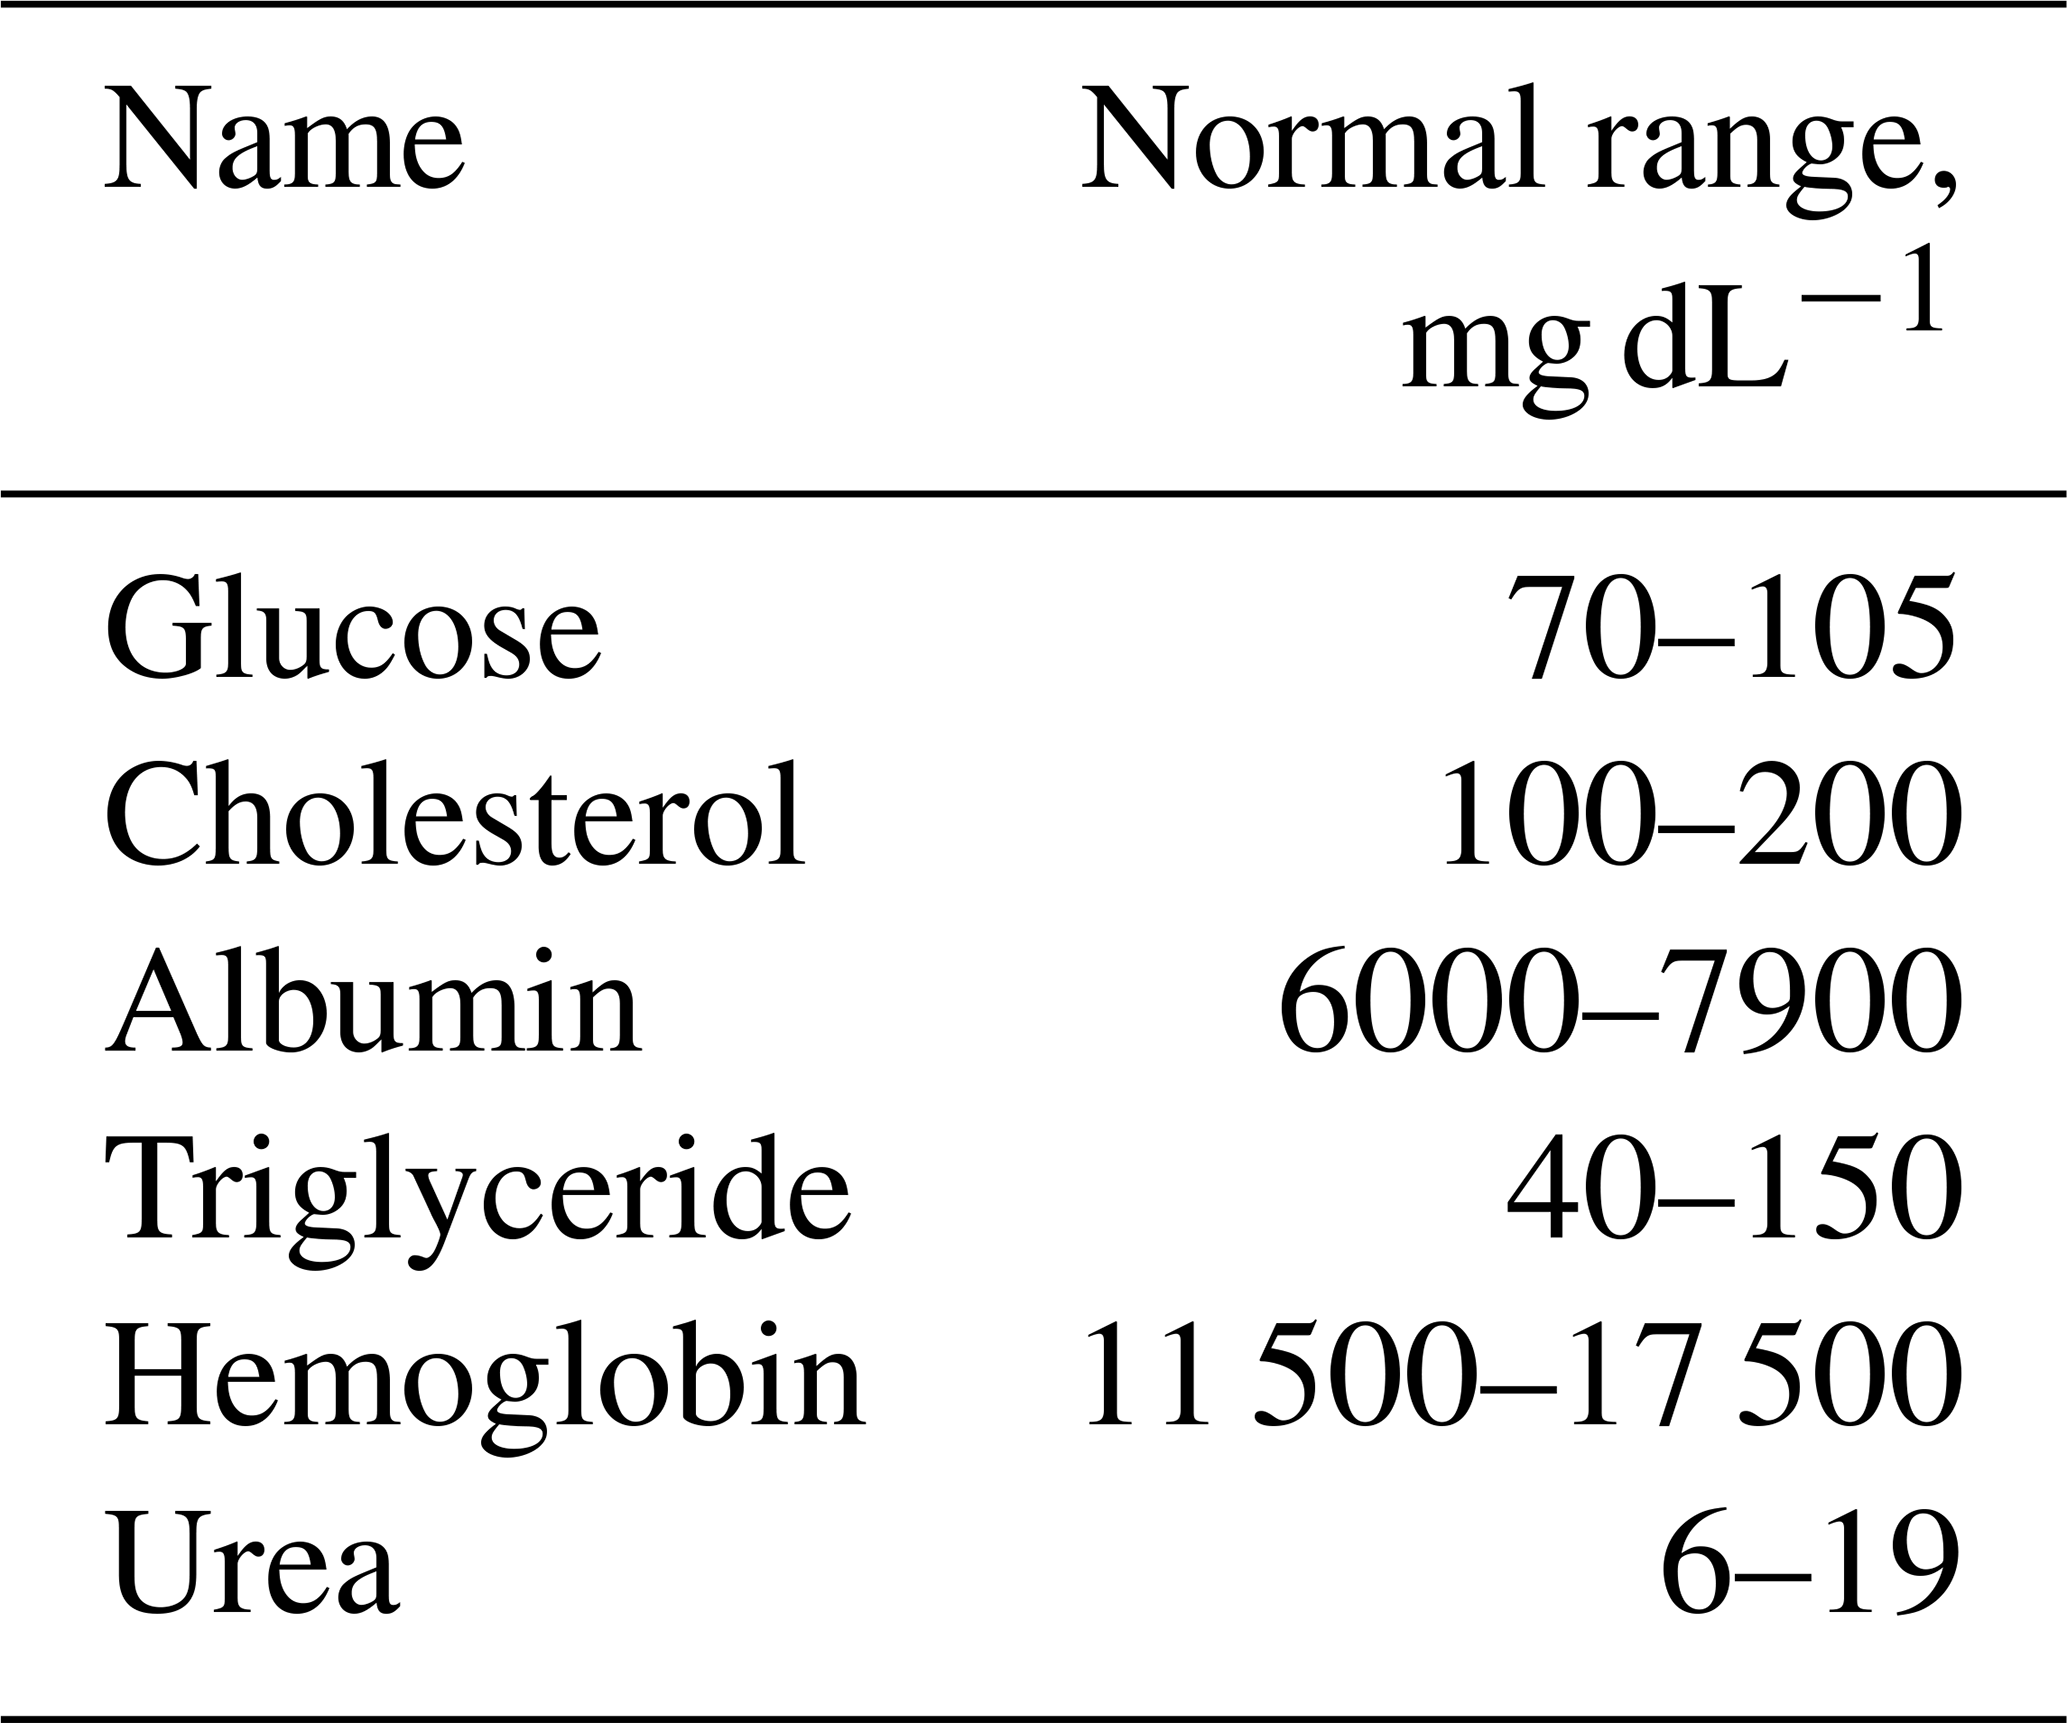
Among the blood components shown in Table 2, only cholesterol and triglyceride can change after taking meals, therefore doctors usually suggest conducting any associated blood works on an empty stomach (Everything You Need to Know About Fasting Before a Blood Test, 2022). However, the interfering effect of cholesterol for dielectric or capacitance spectroscopy is minimum. For example, the total capacitance of the hydrophobic region of egg phosphatidylcholine bilayers in a KCL solution is only affected marginally for the addition of cholesterol at a 2:1 mole ratio (Ashcroft et al., 1983). The cell membrane capacitance of cells taken from the heart of mice did not change when cholesterol was depleted (Gadeberg et al., 2017). The capacitance measured by a novel capacitance biosensor based on imprinting technology-detected cholesterol from human serum with a detection limit of 16 mg dL−1 and relative capacitance decreased by approximately 7 % for a 0.6 mg dL−1 increase in cholesterol level. In their interference test, glucose, uric acid, and ascorbic acid did not interfere with the overall measured capacitance due to cholesterol level change (Aghaei et al., 2010). Besides cholesterol, albumin is present in a large quantity in human blood. However, albumin changed only minimally for fasting and non-fasting cases of human subjects, irrespective of age and sex, for a whole day and was not affected by daily food intake (Langsted et al., 2008). An increase in urea in human blood can cause a decrease in dielectric constant too, however it is strongly related to the patient who has specific health issues such as renal failure (Altaf et al., 2019). So, cholesterol, triglyceride, albumin, and urea are not strong interfering agents for detecting glucose using capacitance spectroscopy. On the other hand, the blood sugar level of a healthy person can increase more than 200 % (100 to 300 mg dL−1) when an OGTT or OMTT is carried out which causes a significant change in cell membrane capacitance.
3.5 System optimization
We optimized the response of the system by investigating different sizes of pads, materials, and insulating layers placed on top of pads, and the best configuration was selected for subsequent experiments.
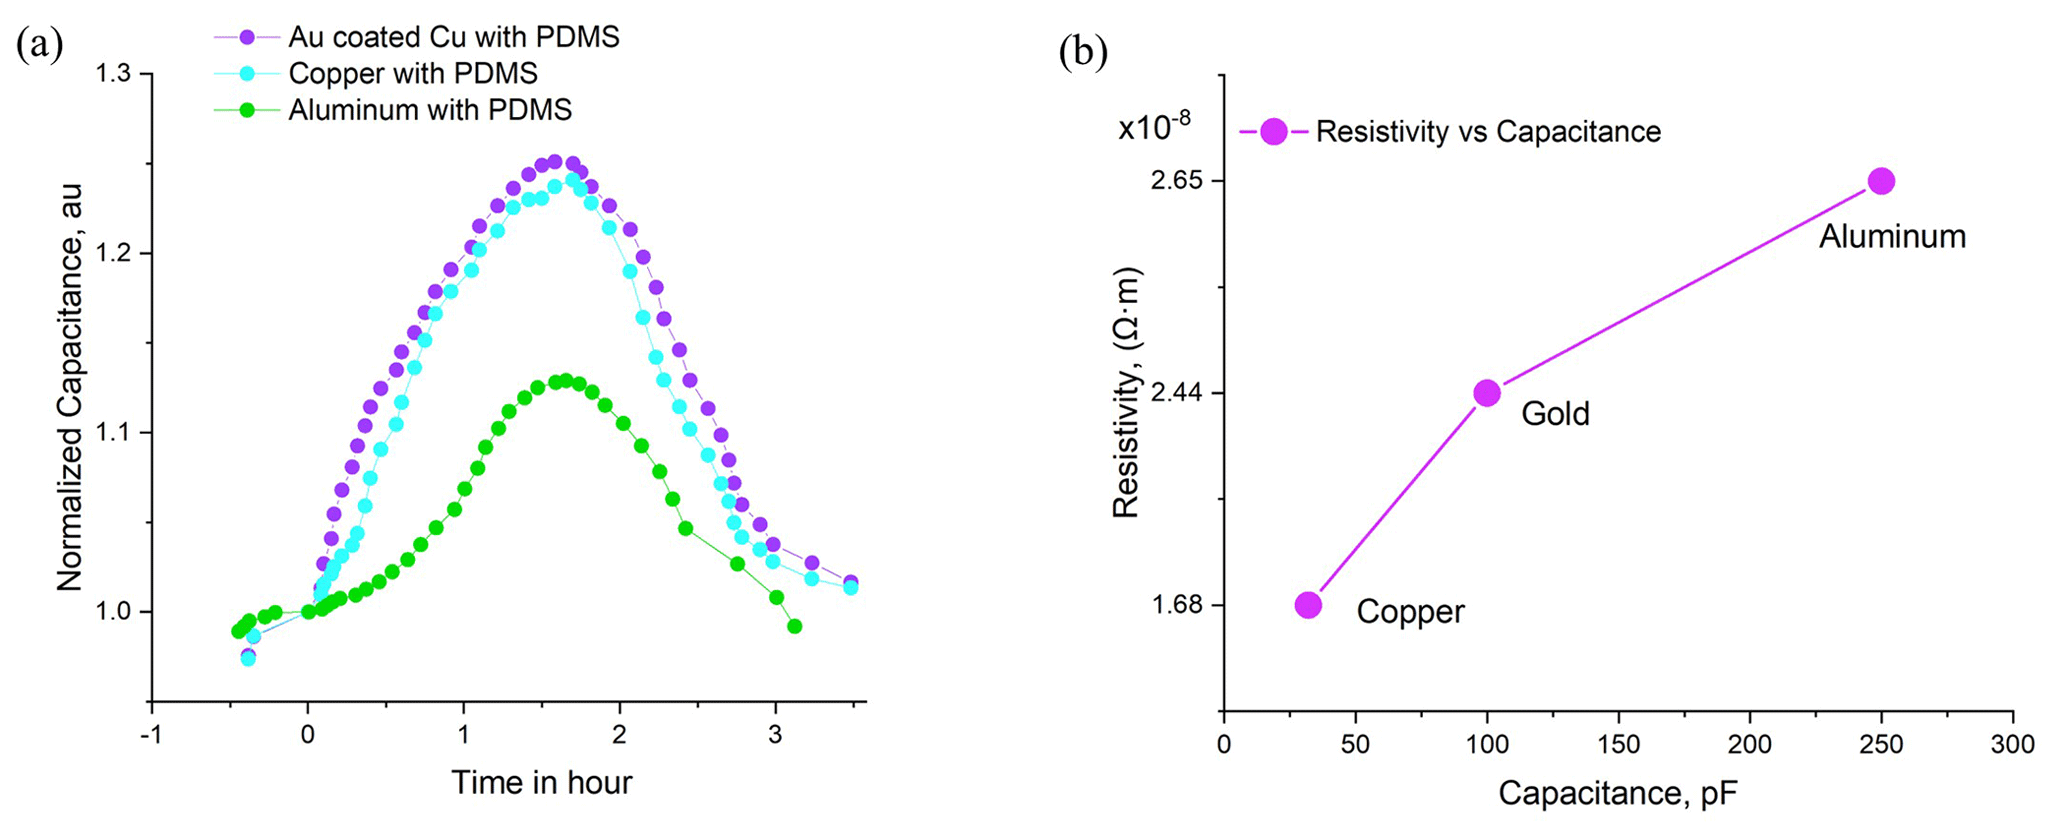
Figure 8(a) Effect of different types of metal pads on blood sugar measurement by capacitance spectroscopy and (b) relation of capacitance to resistivity value of the metals.
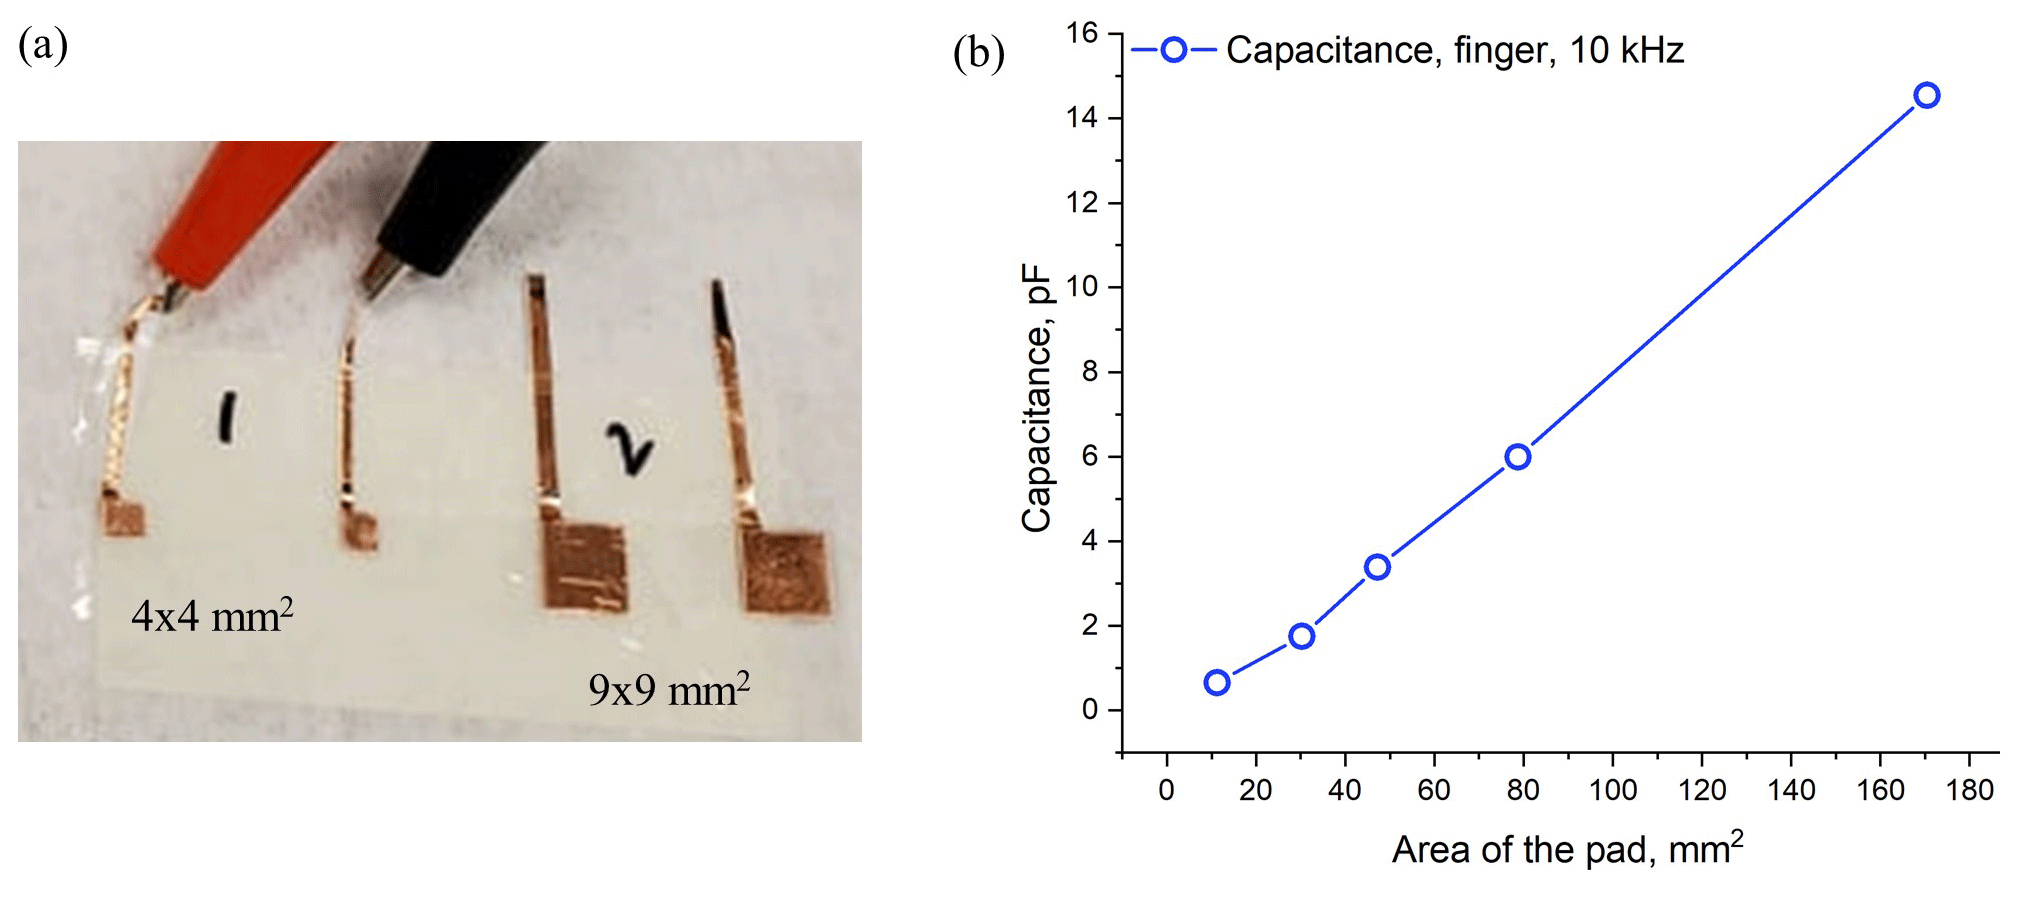
Figure 9(a) Picture of different sizes of metal pads covered with plastic and (b) capacitance vs. area of the pads.
Three metal pads were examined: copper, gold-coated copper, and aluminum for in vitro and in vivo measurements. For the in vitro setup, capacitance was measured by putting the same phantom sample on interdigital electrodes fabricated from three materials. The measured capacitance and the resistivity of these metals are plotted in Fig. 8b where capacitance increases linearly with the resistivity of metals. Among them, aluminum pads exhibited relatively higher capacitance compared to copper and gold because of its high resistivity. For the in vivo setup, the capacitance was measured by putting two fingers of the same hand on copper, gold-coated copper, and aluminum pads, respectively, and the OMTT was conducted as shown in Fig. 8a. Unlike the in vitro result, the capacitive response of aluminum pads was comparatively poor, although all pads exhibited similar shapes and trends. Based on repeatability, stability, and fluctuations, gold-plated copper pads performed better in both the in vitro and in vivo setups and hence were selected for all experiments.
The attachment of the bare metal pad to skin is capacitively coupled. As a result, there is a parasitic contact capacitance that can change based on the attachment pressure of the pad (Talary et al., 2006). To avoid this parasitic capacitance, a thin layer of PDMS coating was deposited on all metal pads by the drop-casting method (Kaliyaraj SK et al., 2020). In particular, PDMS is advantageous for having natural stickiness to a metal surface with an easy deposition process. In addition, the spongy and semi-sticky surface of PDMS can firmly hold human fingers on the pad surface and prevent it from slipping off the pad. Cover glasses, scotch tapes, and plastic wraps could have been used as an alternative, however, it will introduce air pockets and glues in the interface (Huang et al., 2020).
To integrate the possibility of this capacitance spectroscopy setup into a small prototype, the size of metal pads on measured capacitance was investigated. Copper metal pads of different sizes, as shown in Fig. 9a, were prepared and capacitance was measured by putting the same phantom on a parallel plate configuration. Figure 9b shows that the capacitance increases monotonically with pad area as expected from the capacitor equation , where C is the capacitance, εr is the relative permittivity of the phantom, and d is the distance between two parallel plates. As a result, any size of the pad can be chosen to integrate the capacitance spectroscopy into any miniature prototype.
The structure of human skin is complex and varies at different human body locations. Therefore, we need to find a suitable location that is easily accessible yet provides a reasonable correlation to glucose. In an experiment for glucose detection by using photothermal and photoacoustic spectroscopy, four human body locations were investigated, namely the hypothenar, arm, index finger, and thumb (Bauer et al., 2018). Among these four sites, the thumb and index finger exhibited the best results compared to other locations. Considering their best result from fingers and easy accessibility, we selected index and middle fingers for our capacitance spectroscopy.
Impedance spectroscopy has application in many fields such as heart rate monitoring, fake finger detection in security systems, dermatological research, and so on (Lu et al., 2018; Gonzalez-Landaeta et al., 2008; Martinsen et al., 2007; Weitzen et al., 2007). However, many factors influence their performance. Humidity greatly affects skin impedance because it changes the skin hydration state (Jayaraman et al., 2007). The thickness difference in stratum corneum, the outer layer of the skin, varies individually (Kalia et al., 1996). Beside thickness difference, the impedance of the skin behaves non-linearly under alternating current conditions (Lackermeier et al., 1996). Even though there are complexities and challenges in measuring skin impedances, Pendragon Medical introduced a wrist glucose monitoring system based on skin impedance spectroscopy in 2003. However, this continuous glucose monitoring wrist watch suffered from poor glucose correlation of only 35.1 % and the company went bankrupt in 2005 (Wentholt et al., 2005). Based on this famous failure, the poor performance of impedance spectroscopy for detecting blood sugar hardly motivates us to proceed further. However, we tried to measure the skin impedance by using interdigital electrode capacitor with human finger and observed that the interdigital electrode was very sensitive to the moisture level of the finger with poor repeatability.
3.6 Stability
Stability is an important parameter to measure the performance degradation of any biological sensor over time. It plays an important role in our experiment because phantom samples that mimicked human skin and human fingers both secrete oil, water, and moisture that can interact with electrode metals and cause metal erosion. We paid extra attention to prevent any kind of electrode oxidation and metal erosion. In our capacitance spectroscopy, we used metal pads having an area of approximately 1 square inch in size to place human fingers and phantom samples. These metal pads were made especially from oxygen-free copper followed by electroplating a thin layer of gold coating for protecting it from exposure to external environmental conditions such as humidity, oxidation, and chemical corrosion. In addition, we deposited a thin layer of PDMS film on top of the electroplated gold layer to further protect it from the outside environment. This PDMS layer can also protect these pads from getting oxidized by the moisture secreted from human finger skin. We found that capacitance varied considerably over time if bare copper was used for collecting capacitance values from the human finger. We also noticed that a dark gray-colored spot was generated over time in the middle of the bare copper pads where fingers were placed. This dark spot was produced due to the formation of a thin layer of copper oxide over time which came from the moisture and oil secretion from human skin and phantom samples. After we electroplated the copper pads with gold and encapsulated them with PDMS, the measured capacitance from the human finger did not degrade during the period (more than a month) of this experiment. In addition, we did not see any gray spots or color change on the contact surface of the pads even after 4–5 months. So, it is reasonable to conclude that these electroplated copper pads should have long-term stability with minimum degradation.
3.7 Sources of error: skin sweating and temperature
Skin sweating and temperature can significantly impact the result of capacitance spectroscopy. The top skin layer, the stratum corneum, is considered to be a dielectric medium and its capacitance may change with the distribution of water in the skin (Schiavoni et al., 2020). Hence, sweating can significantly affect the dielectric property of the skin (Edelberg, 1977). When the water content of the skin increases, the conductivity and the dielectric permittivity of the skin also increase, eventually contributing to the overall capacitance. After 100 s of measurement, sweating becomes acute and changes the resistance of the skin and sensor (Periyasamy and Anand, 2016). To avoid the effect of skin moisture build-up, data were collected by putting fingers on metal pads for less than 10 s; however, we waited 5–10 s until the signal became stable. Besides skin sweating, skin temperature can be another source of error. The imaginary part of a complex relative permittivity decreases with the temperature of an aqueous glucose solution (Bababjanyan et al., 2010; Ma et al., 2021). However, we performed all our experiments at room temperature.
3.8 Conclusion
In this paper, we studied the capacitance of tissue-mimicking phantoms and human body, in vitro and in vivo, for detecting blood sugar non-invasively by a simple and cost-effective setup. Phantoms were prepared by a simple recipe with only gelatine, sugar, and formalin. The purity and the mechanical hardness of phantoms were verified by FTIR and d33 meter, respectively. The capacitance spectroscopy setup was established by using on-the-shelf gold-coated metal pads and a commercially available LCR meter. The whole measurement unit is very simple and cost-effective compared to contemporary non-invasive electrical or optical spectroscopies.
The measured capacitance from tissue-mimicking phantoms by parallel plate and interdigital electrodes demonstrated a promising correlation coefficient of R2=0.96. In the in vivo setup, the measured body capacitance obtained by putting two fingers on metal pads in the oral meal tolerance test followed the invasive reference value with a 25–45 min delay and semi-invasive reference with a nominal time delay. This lag time of blood sugar which appeared late in capacitance spectroscopy is associated with the food digestion time and the diffusion time of glucose for traveling from blood vessels to interstitial fluid. Body capacitance was measured for multiple days through an oral meal tolerance test by eating a heavy lunch or dinner. For all days, less than a 9 % increase in body capacitance is observed for a 50 % increase in blood sugar level. This capacitive behavior of the human body due to the variation of blood sugar level can easily be calibrated. Different types of metal pads made of copper, gold- coated copper, and aluminum with different sizes and shapes were studied for system optimization.
In the future, we will optimize and automate our system by including corrective factors from skin temperature and hydration. More trials will be conducted with healthy, pre-diabetic, and diabetic patients. Nonetheless, our capacitor sensor is a unique approach for detecting non-invasive blood sugar detection from the perspective of simple operating principle, miniature shape, and very low cost compared to other complex and bulky spectroscopic techniques.
No data sets were used in this article. Raw data of the presented measurements are available upon request to the author.
SR designed the experiment, collected, and analyzed the data. SR and MDRK prepared the manuscript. AA helped with software-related part and gave feedback on the manuscript writing. DB mentored the overall project and helped to build the framework of this paper.
The contact author has declared that none of the authors has any competing interests.
Publisher's note: Copernicus Publications remains neutral with regard to jurisdictional claims in published maps and institutional affiliations.
We want to acknowledge our supervisor Dayan Ban for all his inspiration, direction, mentorship, and support. We also want to acknowledge all our lab-members who worked with us in this project. Finally, we want to acknowledge AIH Technology and NSERC for the financial support.
This research has been supported by the Mitacs (grant no. IT17122).
This paper was edited by Bernhard Jakoby and reviewed by three anonymous referees.
Abdalla, S., Al-Ameer, S. S., and Al-Magaishi, S. H.: Electrical properties with relaxation through human blood, Biomicrofluidics, 4, 34101, https://doi.org/10.1063/1.3458908, 2010.
Aghaei, A., Milani Hosseini, M. R., and Najafi, M.: A novel capacitive biosensor for cholesterol assay that uses an electropolymerized molecularly imprinted polymer, Electrochim. Acta, 55, 1503–1508, https://doi.org/10.1016/j.electacta.2009.09.033, 2010.
Altaf, M. I., Reddy, M., and Ahmad, A.: Dielectric properties of human blood of patients suffering from renal failure, AIP Conf. Proc., 2200, 020036, https://doi.org/10.1063/1.5141206, 2019.
Amaral, C. E. F. and Wolf, B.: Effects of glucose in blood and skin impedance spectroscopy, in: AFRICON 2007, 26–28 September 2007, 1–7, Windhoek, South Africa, https://doi.org/10.1109/AFRCON.2007.4401489, 2007.
Arpita, G.: Change in Blood Cell Capacitance with Diseases, Sensors & Transducers, 202, 72–75, 2016.
Ashcroft, R. G., Coster, H. G. L., Laver, D. R., and Smith, J. R.: The effects of cholesterol inclusion on the molecular organisation of bimolecular lipid membranes, Biochim. Biophys. Ac., 730, 231–238, https://doi.org/10.1016/0005-2736(83)90338-3, 1983.
Azadbakht, M., Mahmoodi, M. J., Vahedi Torshizi, M., and Kashi, P.: Relationship of pears' dielectric properties and rates of pears' bruise, Agr. Eng. Int., 22, 169-179, 2020.
Bababjanyan, A., Melikyan, H., Kim, S., Kim, J., Lee, K., and Friedman, B.: Real-Time Noninvasive Measurement of Glucose Concentration Using a Microwave Biosensor, J. Sensors, 2010, 452163, https://doi.org/10.1155/2010/452163, 2010.
Bauer, A., Hertzberg, O., Küderle, A., Strobel, D., Pleitez, M. A., and Mäntele, W.: IR-spectroscopy of skin in vivo: Optimal skin sites and properties for non-invasive glucose measurement by photoacoustic and photothermal spectroscopy, J. Biophoton., 11, e201600261, https://doi.org/10.1002/jbio.201600261, 2018.
Beving, H. and Eriksson, G.: Dielectric spectroscopy of human blood, Eur. J. Surg. Suppl., 87–89, 1994.
Beving, H., Eriksson, L. E., Davey, C. L., and Kell, D. B.: Dielectric properties of human blood and erythrocytes at radio frequencies (0.2–10 MHz); dependence on cell volume fraction and medium composition, Eur. Biophys. J., 23, 207–215, https://doi.org/10.1007/bf01007612, 1994.
Bhosale, A. A. and Sundaram, K. K.: Nondestructive Method for Ripening Prediction of Papaya, Proced. Technol., 19, 623–630, https://doi.org/10.1016/j.protcy.2015.02.088, 2015.
Blood Sugar Levels: https://www.edify.net.au/low_carb_science_blood_sugar_levels.php, last access: January 2020.
Brodovicz, K. G., Girman, C. J., Simonis-Bik, A. M. C., Rijkelijkhuizen, J. M., Zelis, M., Bunck, M. C., Mari, A., Nijpels, G., Eekhoff, E. M. W., and Dekker, J. M.: Postprandial metabolic responses to mixed versus liquid meal tests in healthy men and men with type 2 diabetes, Diabet. Res. Clin. Pract., 94, 449–455, https://doi.org/10.1016/j.diabres.2011.09.002, 2011.
Caduff, A., Ben Ishai, P., and Feldman, Y.: Continuous noninvasive glucose monitoring; water as a relevant marker of glucose uptake in vivo, Biophys. Rev., 11, 1017–1035, https://doi.org/10.1007/s12551-019-00601-7, 2019.
Caduff, A., Livshits, L., Hayashi, Y., and Feldman, Y.: Cell Membrane Response on d-Glucose Studied by Dielectric Spectroscopy. Erythrocyte and Ghost Suspensions, J. Phys. Chem. B, 108, 13827–13830, https://doi.org/10.1021/jp049923x, 2004.
Cai, Y., Yang, D., Yin, R., Gao, Y., Zhang, H., and Zhang, W.: An enzyme-free capacitive glucose sensor based on dual-network glucose-responsive hydrogel and coplanar electrode, Analyst, 146, 213–221, https://doi.org/10.1039/D0AN01672A, 2021.
Castle, P.: What Does k=2 Mean in Accuracy and Uncertainty Specifications?, https://blog.mensor.com/blog/what-does-k2-mean-in-accuracy-specification (last access: 30 August 2022), 2020.
Cengiz, E. and Tamborlane, W. V.: A tale of two compartments: interstitial versus blood glucose monitoring, Diabet. Technol. Therapeut., 11, S11–S16, https://doi.org/10.1089/dia.2009.0002, 2009.
Dalla Man, C., Campioni, M., Polonsky, K. S., Basu, R., Rizza, R. A., Toffolo, G., and Cobelli, C.: Two-Hour Seven-Sample Oral Glucose Tolerance Test and Meal Protocol: Minimal Model Assessment of β-Cell Responsivity and Insulin Sensitivity in Nondiabetic Individuals, Diabetes, 54, 3265–3273, https://doi.org/10.2337/diabetes.54.11.3265, 2005.
Das, M., R, S., Prasad, K., Jv, V., and M, R.: Extraction and characterization of gelatin: a finctional bipolymer, Int. J. Pharm. Pharmaceut. Sci., 9, 239, https://doi.org/10.22159/ijpps.2017v9i9.17618, 2017.
den Otter, M. W.: Approximate expressions for the capacitance and electrostatic potential of interdigitated electrodes, Sensors Actuat. A, 96, 140–144, https://doi.org/10.1016/S0924-4247(01)00783-X, 2002.
Desouky, O.: Rheological and electrical behavior of erythrocytes in patients with diabetes mellitus, August, Roman. J. Biophys., 19, 239–250, 2009.
Diabetes in Canada: Highlights from the Canadian Chronic Disease Surveillance System, https://www.canada.ca/en/public-health/services/publications/diseases-conditions/diabetes-canada-highlights-chronic-disease-surveillance-system.html, last access: November 2019.
d33 PiezoMeter Systems: https://www.piezotest.com/d33piezometer.php, last access: January 2018.
Dutta, A., Chandra Bera, S., and Das, K.: A non-invasive microcontroller based estimation of blood glucose concentration by using a modified capacitive sensor at low frequency, AIP Adv., 9, 105027, https://doi.org/10.1063/1.5116059, 2019.
Edelberg, R.: Relation Of Electrical Properties Of Skin To Structure And Physiologic State, J. Investigat. Dermatol., 69, 324–327, https://doi.org/10.1111/1523-1747.ep12507771, 1977.
Esenaliev, R. O., Larin, K. V., Larina, I. V., and Motamedi, M.: Noninvasive monitoring of glucose concentration with optical coherence tomography, Opt. Lett., 26, 992–994, https://doi.org/10.1364/OL.26.000992, 2001.
Everything You Need to Know About Fasting Before a Blood Test: https://www.healthline.com/health/fasting-before-blood-test#qampa, last access: 26 August 2022.
Færch, K., Amadid, H., Bruhn, L., Clemmensen, K. K. B., Hulman, A., Ried-Larsen, M., Blond, M. B., Jørgensen, M. E., and Vistisen, D.: Discordance Between Glucose Levels Measured in Interstitial Fluid vs in Venous Plasma After Oral Glucose Administration: A Post-Hoc Analysis From the Randomised Controlled PRE-D Trial, Front. Endocrinol., 12, ISSN 1664-2392, https://doi.org/10.3389/fendo.2021.753810, 2021.
Feldman, Y., Andrianov, A., Polygalov, E., Ermolina, I., Romanychev, G., Zuev, Y., and Milgotin, B.: Time domain dielectric spectroscopy: An advanced measuring system, Rev. Sci. Instrum., 67, 3208–3216, https://doi.org/10.1063/1.1147444, 1996.
Gadeberg, H. C., Kong, C. H. T., Bryant, S. M., James, A. F., and Orchard, C. H.: Cholesterol depletion does not alter the capacitance or Ca handling of the surface or t-tubule membranes in mouse ventricular myocytes, Physiol. Rep., 5, e13500, https://doi.org/10.14814/phy2.13500, 2017.
Gemanam, S. and Suardi, N.: Frequency characterization of dielectric parameters and impedance of irradiated diabetic blood using He-Ne laser and non-diabetic human blood samples, J. Phys.: Conf. Ser., 1892, 012024, https://doi.org/10.1088/1742-6596/1892/1/012024, 2021.
Gemanam, S., Suardi, N., Shahrim, I., and Mat Jafri, M. Z.: Dielectric spectroscopy of in-vitro human blood of diabetic and non-diabetic patients through low level laser therapy, J. Phys.: Conf. Ser., 1497, 012016, https://doi.org/10.1088/1742-6596/1497/1/012016, 2020.
Gonzalez-Landaeta, R., Casas, O., and Pallas-Areny, R.: Heart Rate Detection From Plantar Bioimpedance Measurements, IEEE T. Biomed. Eng., 55, 1163–1167, https://doi.org/10.1109/TBME.2007.906516, 2008.
Hayashi, Y., Livshits, L., Caduff, A., and Feldman, Y.: Dielectric spectroscopy study of specific glucose influence on human erythrocyte membranes, J. Phys. D, 36, 369, https://doi.org/10.1088/0022-3727/36/4/307, 2003.
Heller, A. and Feldman, B.: Electrochemistry in diabetes management, Acc. Chem. Res., 43, 963–973, https://doi.org/10.1021/ar9002015, 2010.
Hillier, T. A., Abbott, R. D., and Barrett, E. J.: Hyponatremia: evaluating the correction factor for hyperglycemia, Am. J. Med., 106, 399–403, https://doi.org/10.1016/s0002-9343(99)00055-8, 1999.
Huang, J., Zhang, Y., and Wu, J.: Review of non-invasive continuous glucose monitoring based on impedance spectroscopy, Sensors Actuat. A, 311, 112103, https://doi.org/10.1016/j.sna.2020.112103, 2020.
Huang, Y. B., Fang, J. Y., Wu, P. C., Chen, T. H., Tsai, M. J., and Tsai, Y. H.: Noninvasive glucose monitoring by back diffusion via skin: chemical and physical enhancements, Biol. Pharm. Bull., 26, 983–987, https://doi.org/10.1248/bpb.26.983, 2003.
Igreja, R. and Dias, C. J.: Analytical evaluation of the interdigital electrodes capacitance for a multi-layered structure, Sensors Actuat. A, 112, 291–301, https://doi.org/10.1016/j.sna.2004.01.040, 2004.
Jang, C., Park, J.-K., Lee, H.-J., Yun, G.-H., and Yook, J.-G.: Temperature-Corrected Fluidic Glucose Sensor Based on Microwave Resonator, Sensors, 18, 3850, https://doi.org/10.3390/s18113850, 2018.
Jayaraman, A., Kaczmarek, K. A., Tyler, M. E., and Okpara, U. O.: Effect of localized ambient humidity on electrotactile skin resistance, in: 2007 IEEE 33rd Annual Northeast Bioengineering Conference, 10–11 March 2007, Stony Brook, NY, USA, 110–111, https://doi.org/10.1109/NEBC.2007.4413303, 2007.
Juansah, J. and Yulianti, W.: Studies on Electrical behavior of Glucose using Impedance Spectroscopy, IOP Conf. Ser.: Earth Environ. Sci., 31, 012039, https://doi.org/10.1088/1755-1315/31/1/012039, 2016.
Kalia, Y. N., Pirot, F., and Guy, R. H.: Homogeneous transport in a heterogeneous membrane: water diffusion across human stratum corneum in vivo, Biophys. J., 71, 2692–2700, https://doi.org/10.1016/S0006-3495(96)79460-2, 1996.
Kaliyaraj SK, A., Zhang, Y., Li, D., and Compton, R.: A mini-review: How reliable is the drop casting technique?, Electrochem. Commun., 121, 106867, https://doi.org/10.1016/j.elecom.2020.106867, 2020.
Kamat, D. K., Bagul, D., and Patil, P. M.: Blood Glucose Measurement Using Bioimpedance Technique, Adv. Electron., 2014, 1–5, https://doi.org/10.1155/2014/406257, 2014.
Karacolak, T., Moreland, E. C., and Topsakal, E.: Cole–cole model for glucose-dependent dielectric properties of blood plasma for continuous glucose monitoring, Microwave Opt. Technol. Lett., 55, 1160–1164, https://doi.org/10.1002/mop.27515, 2013.
Katz, M. A.: Hyperglycemia-Induced Hyponatremia – Calculation of Expected Serum Sodium Depression, N. Engl. J. Med., 289, 843–844, https://doi.org/10.1056/nejm197310182891607, 1973.
Khan, M. R., Khalilian, A., and Kang, S. W.: Fast, Highly-Sensitive, and Wide-Dynamic-Range Interdigitated Capacitor Glucose Biosensor Using Solvatochromic Dye-Containing Sensing Membrane, Sensors, 16, 265, https://doi.org/10.3390/s16020265, 2016.
Kidner, N. J., Homrighaus, Z. J., Mason, T. O., and Garboczi, E. J.: Modeling interdigital electrode structures for the dielectric characterization of electroceramic thin films, Thin Solid Films, 496, 539–545, https://doi.org/10.1016/j.tsf.2005.08.350, 2006.
Kottmann, J., Rey, J. M., and Sigrist, M. W.: Mid-Infrared Photoacoustic Detection of Glucose in Human Skin: Towards Non-Invasive Diagnostics, Sensors, 16, 1663, https://doi.org/10.3390/s16101663, 2016.
Kuranov, R. V., Sapozhnikova, V. V., Prough, D. S., Cicenaite, I., and Esenaliev, R. O.: Prediction capability of optical coherence tomography for blood glucose concentration monitoring, J. Diabet. Sci. Technol., 1, 470–477, https://doi.org/10.1177/193229680700100404, 2007.
Lackermeier, A., Pirke, A., McAdams, E. T., and Jossinet, J.: Non-linearity of the skin's AC impedance, in: vol. 1945, Proceedings of 18th Annual International Conference of the IEEE Engineering in Medicine and Biology Society, 31 October–3 November 1996, Amsterdam, Netherlands, 1945–1946, https://doi.org/10.1109/IEMBS.1996.646332, 1996.
Langsted, A., Freiberg, J. J., and Nordestgaard, B. G.: Fasting and Nonfasting Lipid Levels, Circulation, 118, 2047–2056, https://doi.org/10.1161/CIRCULATIONAHA.108.804146, 2008.
Li, J., Igbe, T., Liu, Y., Nie, Z., Qin, W., Wang, L., and Hao, Y.: An Approach for Noninvasive Blood Glucose Monitoring Based on Bioimpedance Difference Considering Blood Volume Pulsation, IEEE Access, 6, 51119–51129, https://doi.org/10.1109/ACCESS.2018.2866601, 2018.
Liakat, S., Bors, K. A., Xu, L., Woods, C. M., Doyle, J., and Gmachl, C. F.: Noninvasive in vivo glucose sensing on human subjects using mid-infrared light, Biomed. Opt. Express, 5, 2397–2404, https://doi.org/10.1364/BOE.5.002397, 2014.
Lindmark, K. and Engström, K. G.: D-Glucose additive protects against osmotic-induced decrease in erythrocyte filterability, Scandinav. J. Clin. Lab. Investig., 60, 473–482, 2000.
Livshits, L., Caduff, A., Talary, M. S., and Feldman, Y.: Dielectric response of biconcave erythrocyte membranes to D- and L-Glucose, J. Phys. D, 40, 15–19, https://doi.org/10.1088/0022-3727/40/1/s03, 2006.
Lu, F., Wang, C., Zhao, R., Du, L., Fang, Z., Guo, X., and Zhao, Z.: Review of Stratum Corneum Impedance Measurement in Non-Invasive Penetration Application, Biosensors, 8, 31, https://doi.org/10.3390/bios8020031, 2018.
Ma, Y., Qiang, T., Gao, M., Liang, J., and Jiang, Y.: Quantitative, Temperature-Calibrated and Real-Time Glucose Biosensor Based on Symmetrical-Meandering-Type Resistor and Intertwined Capacitor Structure, Biosensors, 11, 484, https://doi.org/10.3390/bios11120484, 2021.
Man, M., Singh, D., Siddiqui, M., and Khan, A. B.: Comparative Characterization of Human Blood along with Viscosity Measurement, International Conference on Microelectronics, Communication and Renewable Energy (ICMiCR -2013), India, June 2013, https://doi.org/10.13140/2.1.4478.8808, 2013.
Martin, W., Mirov, S., and Venugopalan, R.: Using two discrete frequencies within the middle infrared to quantitatively determine glucose in serum, J. Biomed. Opt., 7, 613–7, https://doi.org/10.1117/1.1501893, 2002.
Martinsen, O. G., Clausen, S., Nysaether, J. B., and Grimnes, S.: Utilizing Characteristic Electrical Properties of the Epidermal Skin Layers to Detect Fake Fingers in Biometric Fingerprint Systems – A Pilot Study, IEEE T. Biomed. Eng., 54, 891–894, https://doi.org/10.1109/TBME.2007.893472, 2007.
Maruo, K., Tsurugi, M., Jakusei, C., Ota, T., Arimoto, H., Yamada, Y., Tamura, M., Ishii, M., and Ozaki, Y.: Noninvasive blood glucose assay using a newly developed near-infrared system, IEEE J. Select. Top. Quant. Electron., 9, 322–330, https://doi.org/10.1109/jstqe.2003.811283, 2003.
Mohapatra, A., Shanmugasundaram, S., and Malmathanraj, R.: Grading of ripening stages of red banana using dielectric properties changes and image processing approach, Comput. Electron. Agricult., 143, 100–110, https://doi.org/10.1016/j.compag.2017.10.010, 2017.
Numao, S., Kawano, H., Endo, N., Yamada, Y., Takahashi, M., Konishi, M., and Sakamoto, S.: Short-term high-fat diet alters postprandial glucose metabolism and circulating vascular cell adhesion molecule-1 in healthy males, Appl. Physiol. Nutrit. Metabol., 41, 895–902, https://doi.org/10.1139/apnm-2015-0702, 2016.
Obrosova, I. G., Huysen, C. V., Fathallah, L., Cao, X., Greene, D. A., and Stevens, M. J.: An aldose reductase inhibitor reverses early diabetes-induced changes in peripheral nerve function, metabolism, and antioxidative defense, FASEB J., 16, 1–26, https://doi.org/10.1096/fj.01-0603fje, 2002.
Ollmar, S., Nicander, I., Åberg, P., and Bolinder, J.: Facts and artefacts regarding correlation between skin electrical impedance spectroscopy (EIS) and blood glucose, J. Phys.: Conf. Ser., 434, 012071, https://doi.org/10.1088/1742-6596/434/1/012071, 2013.
Ozana, N., Beiderman, Y., Anand, A., Javidi, B., Polani, S., Schwarz, A., Shemer, A., García-Monreal, J., and Zalevsky, Z.: Noncontact speckle-based optical sensor for detection of glucose concentration using magneto-optic effect, J. Biomed. Opt., 21, 065001, https://doi.org/10.1117/1.JBO.21.6.065001, 2016.
Park, J. H., Kim, C. S., Choi, B. C., and Ham, K. Y.: The correlation of the complex dielectric constant and blood glucose at low frequency, Biosens. Bioelectron., 19, 321–324, https://doi.org/10.1016/S0956-5663(03)00188-X, 2003.
Periyasamy, R. and Anand, S.: A study on non-invasive blood glucose estimation — An approach using capacitance measurement technique, in: 2016 International Conference on Signal Processing, Communication, Power and Embedded System (SCOPES), 3–5 October 2016, Paralakhemundi, India, 847–850, https://doi.org/10.1109/SCOPES.2016.7955561, 2016.
Pleitez, M. A., Lieblein, T., Bauer, A., Hertzberg, O., von Lilienfeld-Toal, H., and Mäntele, W.: In vivo noninvasive monitoring of glucose concentration in human epidermis by mid-infrared pulsed photoacoustic spectroscopy, Anal. Chem., 85, 1013–1020, https://doi.org/10.1021/ac302841f, 2013.
Pockevicius, V., Markevicius, V., Cepenas, M., Andriukaitis, D., and Navikas, D.: Blood Glucose Level Estimation Using Interdigital Electrodes, Elektronika ir Elektrotechnika, 19, 71–74, https://doi.org/10.5755/j01.eee.19.6.4566, 2013.
Rachim, V. P. and Chung, W.-Y.: Wearable-band type visible-near infrared optical biosensor for non-invasive blood glucose monitoring, Sensors Actuat. B, 286, 173–180, https://doi.org/10.1016/j.snb.2019.01.121, 2019.
Raja, V. and Shanmugasundaram, S.: Development of capacitance based nondestructive ripening indices measurement system for sapota (Manilkara zapota), J. Food Proc. Eng., 43, e13307, https://doi.org/10.1111/jfpe.13307, 2020.
Rassel, S., Xu, C., Zhang, S., and Ban, D.: Noninvasive blood glucose detection using a quantum cascade laser, Analyst, 145, 2441–2456, https://doi.org/10.1039/C9AN02354B, 2020.
Sabuncu, A. C., Muldur, S., Cetin, B., Usta, O. B., and Aubry, N.: β-Dispersion of blood during sedimentation, Scient. Rep., 11, 2642–2642, https://doi.org/10.1038/s41598-021-82171-x, 2021.
Schiavoni, R., Monti, G., Piuzzi, E., Tarricone, L., Tedesco, A., De Benedetto, E., and Cataldo, A.: Feasibility of a Wearable Reflectometric System for Sensing Skin Hydration, Sensors, 20, 2833, https://doi.org/10.3390/s20102833, 2020.
Schwan, H. P.: Analysis of Dielectric Data: Experience Gained with Biological Materials, IEEE T. Elect. Insulat., EI-20, 913–922, https://doi.org/10.1109/TEI.1985.348727, 1985.
Shih, W.-C., Bechtel, K., and Rebec, M.: Noninvasive glucose sensing by transcutaneous Raman spectroscopy, J. Biomed. Opt., 20, 051036, https://doi.org/10.1117/1.JBO.20.5.051036, 2015.
Shimokawa, Y., Hayakawa, E., Takahashi, K., Okai, K., Hattori, Y., and Otsuka, M.: Pharmaceutical formulation analysis of a gelatin-based soft capsule film sheet containing phytic acid using near-infrared spectroscopy, J. Drug Deliv. Sci. Technol., 53, 101126, https://doi.org/10.1016/j.jddst.2019.101126, 2019.
Soares dos Santos, M. P., Coutinho, J., Marote, A., Sousa, B., Ramos, A., Ferreira, J. A. F., Bernardo, R., Rodrigues, A., Marques, A. T., Cruz e Silva, O. A. B. D., Furlani, E. P., Simões, J. A. O., and Vieira, S. I.: Capacitive technologies for highly controlled and personalized electrical stimulation by implantable biomedical systems, Sci. Rep., 9, 5001, https://doi.org/10.1038/s41598-019-41540-3, 2019.
Soltani, M.: Prediction of banana quality during ripening stage using capacitance sensing system, Aust. J. Crop Sci., 4, 443–447, 2010.
Soltani Firouz, M., Alimardani, R., and Omid, M.: Evaluating banana ripening status from measuring dielectric properties, J. Food Eng., 105, 625–631, https://doi.org/10.1016/j.jfoodeng.2011.03.032, 2011.
Sun, P.-X., Han, X.-J., Chen, L.-J., Chen, Z.-J., Pan, W.-J., Zhang, Q., Wang, J., and Yang, C.: Determination of Glucose by a Molecular Capacitor Array Based Using a 3-(Acrylamido) Phenylboronic Acid Prepared Molecularly Imprinted Polyacrylamide Cryogel, Analyt. Lett., 54, 2789–2800, https://doi.org/10.1080/00032719.2021.1890757, 2021.
Talary, M. S., Dewarrat, F., Caduff, A., Puzenko, A., Ryabov, Y., and Feldman, Y.: An RCL sensor for measuring dielectrically lossy materials in the MHz frequency range 1. Comparison of hydrogel model simulation with actual hydrogel impedance measurements, IEEE T. Dielect. Elect. Insulat., 13, 247–256, https://doi.org/10.1109/TDEI.2006.1624269, 2006.
The cost of diabetes in Canada over 10 years: Applying attributable health care costs to a diabetes incidence prediction model, https://www.ncbi.nlm.nih.gov/pmc/articles/PMC5607525/, last access: November 2019.
Topsakal, E., Karacolak, T., and Moreland, E. C.: Glucose-dependent dielectric properties of blood plasma, in: 2011 XXXth URSI General Assembly and Scientific Symposium, 13–20 August 2011, Istanbul, Turkey, 1–4, https://doi.org/10.1109/URSIGASS.2011.6051324, 2011.
Turgul, V. and Kale, I.: Characterization of the complex permittivity of glucose/water solutions for noninvasive RF/Microwave blood glucose sensing, in: 2016 IEEE International Instrumentation and Measurement Technology Conference Proceedings, 23–26 May 2016, Taipei, Taiwan, 1–5, https://doi.org/10.1109/I2MTC.2016.7520546, 2016.
Venkataraman, J. and Freer, B.: Feasibility of non-invasive blood glucose monitoring: In-vitro measurements and phantom models, 2011 IEEE International Symposium on Antennas and Propagation (APSURSI), 3-8 July 2011, 603-606, 10.1109/APS.2011.5996782,
Vitkova, V., Yordanova, V., Staneva, G., Petkov, O., Stoyanova-Ivanova, A., Antonova, K., and Popkirov, G.: Dielectric Properties of Phosphatidylcholine Membranes and the Effect of Sugars, Membranes, 11, 847, https://doi.org/10.3390/membranes11110847, 2021.
Weitzen, R., Epstein, N., Shoenfeld, Y., and Zimlichman, E.: Diagnosing Diseases by Measurement of Electrical Skin Impedance, Ann. NY Acad. Sci., 1109, 185–192, https://doi.org/10.1196/annals.1398.022, 2007.
Wentholt, I. M. E., Hoekstra, J. B. L., Zwart, A., and DeVries, J. H.: Pendra goes Dutch: lessons for the CE mark in Europe, Diabetologia, 48, 1055–1058, https://doi.org/10.1007/s00125-005-1754-y, 2005.
Why CGM?: https://www.freestyle.abbott/us-en/home.html, last access: 23 August 2022.
Wikipedia: Extracellular fluid, https://en.wikipedia.org/w/index.php?title=Extracellular_fluid&direction=next&oldid=923951516, last access: 20 January 2019.
Wild, S., Roglic, G., Green, A., Sicree, R., and King, H.: Global Prevalence of Diabetes, Diabetes Care, 27, 1047, https://doi.org/10.2337/diacare.27.5.1047, 2004.
World Health Organization: Global Report on Diabetes, Geneva, Switzerland, https://apps.who.int/iris/bitstream/handle/10665/204871/9789241565257_eng.pdf;jsessionid=CA462223510EC06B030B3827B601A61B?sequence=1 (last access: 1 February 2022), 2016.
Xu, C., Rassel, S., Zhang, S., Aloraynan, A., and Ban, D.: Single-wavelength water muted photoacoustic system for detecting physiological concentrations of endogenous molecules, Biomed. Opt. Express, 12, 666–675, https://doi.org/10.1364/BOE.413086, 2021.
Yilmaz, T. and Hao, Y.: Sensing of dielectric property alterations in biological tissues at microwave frequencies, in: 2011 Loughborough Antennas & Propagation Conference, 14–15 November 2011, Loughborough, UK, 1–4, https://doi.org/10.1109/LAPC.2011.6114108, 2011.
Yilmaz, T., Foster, R., and Hao, Y.: Towards Accurate Dielectric Property Retrieval of Biological Tissues for Blood Glucose Monitoring, IEEE T. Microw. Theory Tech., 62, 3193–3204, https://doi.org/10.1109/TMTT.2014.2365019, 2014a.
Yilmaz, T., Foster, R., and Hao, Y.: Broadband Tissue Mimicking Phantoms and a Patch Resonator for Evaluating Noninvasive Monitoring of Blood Glucose Levels, IEEE T. Antenn. Propag., 62, 3064–3075, https://doi.org/10.1109/TAP.2014.2313139, 2014b.
Yilmaz, T., Foster, R., and Hao, Y.: Radio-Frequency and Microwave Techniques for Non-Invasive Measurement of Blood Glucose Levels, Diagnostics, 9, 6, https://doi.org/10.3390/diagnostics9010006, 2019.
Yin, H., Du, M., Chen, X., and Yin, T.: Non-invasive Blood Glucose Measurement based on Impedance Spectrum, J. Robot. Netw. Artific. Life, 6, 246–249, https://doi.org/10.2991/jrnal.k.200221.001, 2020.
Zeng, N., Li, J., Igbe, T., Liu, Y., Yan, C., and Nie, Z.: Investigation on Dielectric Properties of Glucose Aqueous Solutions at 500 KHz–5 MHz for Noninvasive Blood Glucose Monitoring, in: 2018 IEEE 20th International Conference on e-Health Networking, Applications and Services (Healthcom), 17–20 September 2018, Ostrava, Czech Republic, 1–5, https://doi.org/10.1109/HealthCom.2018.8531182, 2018.