the Creative Commons Attribution 4.0 License.
the Creative Commons Attribution 4.0 License.
 | 05 Oct 2023
Monitoring ammonia slip from large-scale selective catalytic reduction (SCR) systems in combined heat and power generation applications with field effect gas sensors
Lida Khajavizadeh
Mike Andersson
Following tightened regulations, selective catalytic reduction (SCR) of nitrogen oxides (NOx) by ammonia (NH3) has over the last couple of decades found wider adoption as a means of reducing NOx emissions from e.g. power production and district heating plants. As in the SCR process NH3 injected into the flue gas reacts with and reduces NOx to nitrogen (N2) and water (H2O) on the surface of a specific catalyst, the NH3 injection has to be dynamically adjusted to match both instant and long-term variations in flue gas nitrogen oxide concentration in order to minimize NOx and NH3 emissions. One possibility of realizing such NH3 dosing control would be the real-time monitoring and feedback of downstream flue gas NOx and NH3 concentrations to the NH3 injection control unit. In this study the sensing characteristics and performance of SiC-based Metal Oxide Semiconductor Field Effect Transistor (MOSFET) sensors with a structurally tailored gas-sensitive gate contact of iridium (Ir) for in situ NH3 monitoring downstream from the SCR catalyst in a combined heat and power (CHP) plant have therefore been investigated and evaluated.
The sensor's NH3 sensitivity and selectivity as well as the cross-sensitivity to common flue gas components – oxygen (O2), water vapour (H2O), nitric oxide (NO), nitrogen dioxide (NO2), carbon monoxide (CO), and a model hydrocarbon, ethene (C2H4) – were thereby investigated for relevant concentration ranges under controlled conditions in the laboratory. While, at the prescribed sensor operation temperature of 300 ∘C, the influence of H2O, CO, and C2H4 on the sensor's NH3 concentration reading could be regarded as practically insignificant, a moderate cross-sensitivity was observed between NH3 and NO2 and, to a lesser extent, between NH3 NO and NH3 O2. As the NOx concentration downstream from the SCR catalyst under normal SCR and power plant operation is expected to be considerably smaller than the NH3 concentration whenever any appreciable ammonia slip occurs, the observed NH3 NOx cross-sensitivities may, however, be of less practical significance for ammonia monitoring in real flue gases downstream from the SCR catalyst. Furthermore, if required, the small influence of O2 concentration variations on the sensor reading may also be compensated for by utilizing the signal from a commercially available oxygen sensor. Judging from in situ measurements performed in a combined heat and power plant, the structurally tailored Ir gate field effect sensors also exhibit good NH3 sensitivity over the relevant 0–40 ppm range when directly exposed to real flue gases, offering an accuracy of ±3 ppm as well as low sensor signal drift, the latter most likely to further improve with regular zero-point calibration and thereby make the Ir gate MOSFET ammonia sensor a promising alternative for cost-efficient real-time ammonia slip monitoring or SCR system control in heat and/or power production plants.
- Article
(6915 KB) - Full-text XML
- BibTeX
- EndNote


Outdoor air pollution is estimated by the World Health Organization (WHO) to have caused 4.2 million premature deaths worldwide in the year 2016 (WHO, 2022), the pollutants mainly considered to affect air quality being particulate matter (PM), ozone (O3), nitrogen oxides (NOx), and sulfur oxides (SOx). In addition to itself affecting human health, NO2 also acts as a main precursor in the formation of nitrate aerosols (which make up a significant portion of atmospheric fine particles – PM2.5 – i.e. particles with a diameter of less than 2.5 µm), and in the photochemical generation of ozone (Atkinson, 2000), both of which can cause respiratory problems and other adverse health effects (WHO, 2022; Brunekreef and Holgate, 2002).
Even though the air quality in Europe has generally improved over the last decade (Shaddick et al., 2020), many regions still experience pollutant levels in excess of the limits defined by the European Union (EU) air quality directives (Guerreiro et al., 2018). The European Environmental Agency (EEA) has estimated that 4 % of the European population is exposed to levels exceeding the EU limits for NO2 (40 µg m−3) and PM2.5 (25 µg m−3), respectively, the former mainly originating from high-temperature combustion processes in the transportation, power production, and industrial sectors. In relation to the recently adopted WHO air quality guideline (AQG) limits of 10 (NOx) and 5 µg m−3 (PM2.5), 94 % and 97 % of Europeans would however be exposed to NOx and PM2.5 levels exceeding these limits (EEA, 2021), and for much of the world outside Europe and North America, PM2.5 exposure levels continued to increase at least up to 2016 (Shaddick et al., 2020).
While in Europe transportation constitutes the largest source of NOx emissions, followed by the energy and industrial sectors, in China and many other countries energy production is the main contributor to atmospheric NOx levels (Jiang et al., 2020; Shahbazi et al., 2021), the emissions almost exclusively emanating from coal- and natural-gas-fired power plants. While China, following the 2014 adoption of stringent ultra-low emissions standards for coal-fired power plants (Tang et al., 2019) and increasing passenger car sales, is experiencing an increase in the share of automotive NOx emissions (Jiang et al., 2020), Europe has lately seen a more rapid NOx reduction from the transport as compared to the power production and industrial sectors. It is, however, expected that the ongoing revision of the EU Industrial Emissions Directive (IED) (Karamfilova, 2022), with its increased emphasis on the application of best available technologies (BATs) to reduce emissions from e.g. energy production, will also lead to a further increase in flue gas after-treatment system adoption and a future significant decrease in NOx emissions from local and district heat and/or power plants (Pronobis, 2015).
Selective catalytic reduction (SCR) of nitrogen oxides by ammonia (NH3) is thereby considered one of the best available flue gas after-treatment technologies to reduce NOx emissions from coal-fuelled, natural-gas-fuelled, and biomass-fuelled power plants (Lai and Wachs, 2018; Sun et al., 2016). In the SCR process, NH3 is injected into the flue gas upstream from a specific SCR catalyst and at temperatures in the range of 300–400 ∘C (with 325 ∘C often considered the optimum temperature), and NOx and NH3 molecules adsorb to and react with each other on the catalyst surface, in the ideal case reducing all of the nitrogen oxides to nitrogen and water. Whenever an insufficient amount of ammonia is injected, compared to what is required for full reduction of the flue gas nitrogen oxides, unreacted NOx may appear downstream from the catalyst and thereby be emitted to the ambient atmosphere. If, instead, over a period of time more NH3 is injected than necessary for complete NOx reduction, the extra ammonia may subsequently break through the catalyst and be released into the air, which is usually referred to as ammonia slip. More details on the SCR process and its implementation in flue gas NOx reduction can be found in Nova et al. (2005).
With the introduction of strict NOx emission limits in the Chinese power generation sector, the fulfilment of which has seen the number of SCR systems significantly increase over the last years, concerns about increasing NH3 slip from energy production have arisen (Jiang et al., 2020), especially as NH3 also has a significant effect on air quality through its role in the formation of fine particulate matter (Qi et al., 2020). Even though agriculture is the overall dominating source of atmospheric NH3 in most countries around the globe, ammonia emissions from the power production and process industry sectors have been shown to be of particular concern during wintertime (Clappier et al., 2021). As the release of NH3 from agricultural activities is low while NOx emissions from e.g. residential heating and transportation are higher than in summer, over the winter months NH3 becomes the limiting factor in the generation of ammonium nitrate (NH4NO3) and ammonium sulfate ([NH4]2SO4), both of which are important for the nucleation and further growth of airborne fine particles (Qi et al., 2020; Clappier et al., 2021).
The ammonia dosing should therefore be dynamically controlled so as to continuously match the flue gas NOx concentration and thereby reduce both NOx and NH3 emissions to a minimum. In consideration of the flue gas NOx concentration varying with variations in load, fuel composition, and fuel quality, monitoring of the NOx level upstream and/or downstream from the catalyst is generally considered a requirement for controlling the ammonia dosing (Song et al., 2022). One NOx monitoring option commonly used in the energy production and industry sectors is the chemiluminescence detection (CLD) analyser, another being direct absorption spectroscopy as in the Quantum Cascade Laser (QCL) instruments (Kamphus and Williams, 2020). An advantage of the QCL is its ability to simultaneously also monitor the flue gas NH3 concentration, which is why it could be utilized to fine-tune the SCR process in providing feedback on both NOx and NH3 levels downstream from the catalyst to the ammonia dosing control unit. Tuneable diode laser absorption spectroscopy (TDLAS) is another related technology which is sometimes used in exhaust or flue gas NH3 monitoring (Kamphus and Williams, 2020).
As NOx and NH3 monitoring with the CLD, QCL, and TDLAS instrumentation commonly requires sampling and pre-analysis conditioning of the flue gas to increase the measurement accuracy and long-term performance of the instruments, e.g. by filtering of particles and condensation of water vapour, NOx and NH3 sensors able to be mounted directly in the flue gas channel could offer a cost-efficient alternative to the advanced analytical instruments. Furthermore, since in situ positioned sensors are generally able to provide NOx and NH3 concentration data with less time delay and better temporal resolution than any instrumentation requiring sampling and gas conditioning, such sensors might facilitate improved real-time dosing control and thereby further reductions in NOx and NH3 emissions resulting from inaccuracies in the estimation of rapid NOx concentration variations (Song et al., 2022).
To date, the most viable sensor options for in situ flue gas NOx and NH3 monitoring have been based on the solid electrolyte-type sensing devices, albeit with somewhat different designs and modes of operation for the two different sensors and substances. While the commercially available exhaust and flue gas NOx sensors are of the amperometric type, the NH3 sensor(s) generally belong to the (so-called) mixed-potential device category. For more information on the amperometric NOx sensor and the mixed-potential sensor technology, see Kato et al. (1998), Liu et al. (2017), Garzon et al. (2000), and Ramaiyan and Mukundan (2020), respectively. Despite the common use of solid electrolyte-type sensors for O2 and NOx monitoring in the control of automotive exhaust after-treatment systems, and despite much effort to develop, e.g. the materials, device structures, and sensor array concepts for ammonia sensing (Schönauer et al., 2009, 2011; Javed et al., 2018), the available NH3 sensor(s) based on the mixed potential platform (Wang et al., 2006) have so far not reached any appreciable adoption, the two main challenges generally considered to be the sensitivity or cross-sensitivity to NO2 and long-term sensor performance issues (Liu et al., 2014).
Another possible alternative for in situ flue gas NH3 monitoring may be the employment of silicon-carbide-based Metal Oxide Semiconductor Field Effect Transistor (MOSFET) sensor devices. SiC MOSFET sensors with a thin iridium (Ir) film as the gas-sensitive gate contact have in previous investigations shown promising ammonia-sensing characteristics (Andersson et al., 2004, 2013a), not least in terms of the range of concentrations seemingly able to be monitored with good resolution. In combining the wide bandgap and chemical inertness of SiC with other high-temperature stable sensor materials (e.g. SiO2 and Ir), Ir gate SiC MOSFET-based sensors are also well suited for in situ high-temperature and harsh-environment applications.
The cross-sectional schematic of the MOSFET sensor is shown in Fig. 1 along with an overview of the general sensing mechanism. A current is generated between the drain and the source (the drain-to-source current, Ids) when a voltage is applied across the corresponding contacts. Analogously to ordinary MOSFET devices, this drain-to-source current (Ids) is dependent on the gate-to-substrate electric field (Egs), however, and thereby, just as in normal MOSFET devices, on the applied gate voltage.
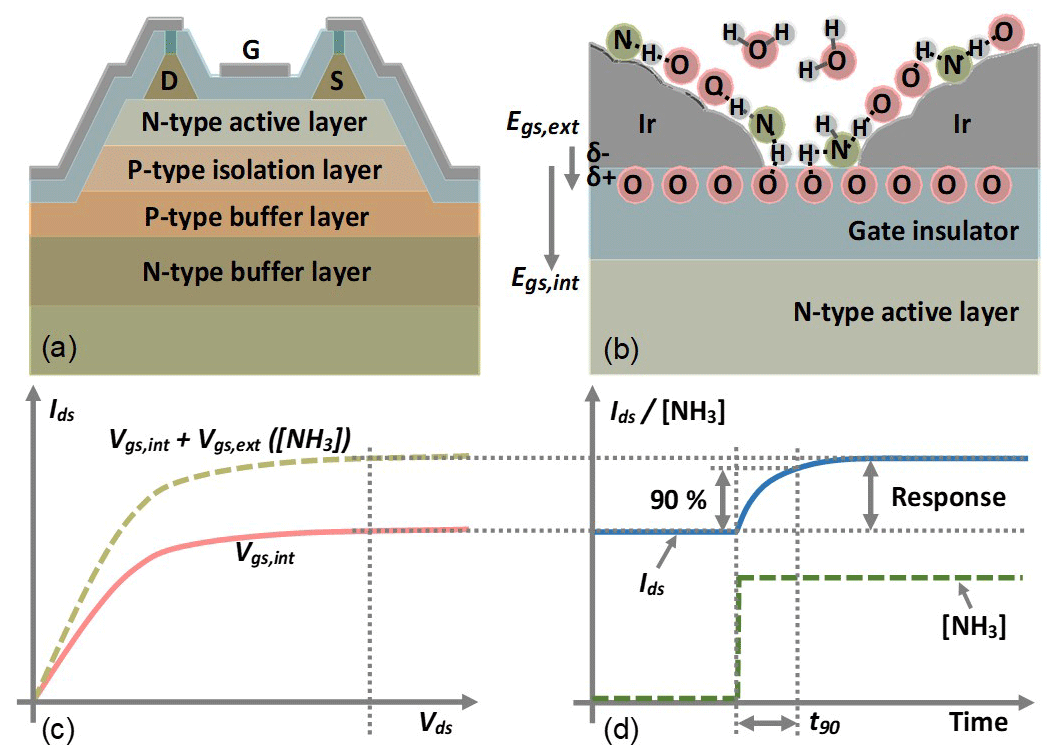
Figure 1This figure displays in panel (a) the cross-sectional layout of the Ir gate MOSFET sensor through the drain (D), gate (G), and source (S) areas and in panel (b) a schematic representation of the supposed NH3 sensing mechanism: NH3 molecule dissociation at the three-phase boundary between individual grains in the metal film, the gate insulator (SiO2), and the surrounding atmosphere leads to transfer of hydrogen atoms from ammonia to oxygen atoms in the insulator surface whereby a layer of polarized hydroxyl (-OH) groups is created at the gate's metal–insulator interface, the field of which (Egs,ext) adds to the internal gate-to-substrate electric field (Egs,int) in modulating the drain-to-source current (Ids) as pictured in panel (c). In operating the MOSFET sensor at a constant drain-to-source voltage (Vds), a change in the ambient ammonia concentration ([NH3]) can thereby be monitored through the induced change in the drain-to-source current, as shown in panel (d) and commonly referred to as the sensor response. The commonly used definition of the sensor's response time, the time to reach 90 % of the full response upon a change in NH3 concentration (t90), is also given in graphical form in panel (d).
Since the Ir gate contact, in contrast to ordinary MOSFETs, is exposed to ambient “air”, it can directly interact with gaseous substances from the surrounding atmosphere. With the Ir gate contact being catalytically active, some of these substances may moreover dissociate and react with other substances whilst interacting with the iridium surface. In the case of NH3 it is believed that the NH3 molecules at elevated temperatures dissociate into NHx (x = 0–2) species and H atoms upon adsorption to the Ir surface in the presence of oxygen (O2), with the latter subsequently being oxidized to water (H2O) (see Fig. 1b).
At the so-called three-phase (or triple-phase) boundaries, where the grains of the iridium film are in contact with both the gate insulator and the ambient atmosphere (see Fig. 1b), hydrogen atoms from the dissociating NH3 molecules may, however, directly interact with and be transferred to oxygen atoms on the surface of the silicon-oxide (gate insulator) layer. Since the resulting hydroxyl (-OH) groups are polar in nature, with a partial positive charge (δ+) on the hydrogen atom and a negative mirror charge (δ−) on the metal side of the gate–insulator interface, their creation modulates the gate-to-substrate electric field (Egs,ext) and thereby also the drain-to-source current (Ids). Considering that the number and density of hydroxyl groups are related to the ambient NH3 concentration ([NH3]), the measured drain current can be used to estimate the ammonia concentration in the surrounding atmosphere. More details on the field effect sensor platform and the sensing mechanism can be found in Andersson et al. (2013b).
From previous studies, the highest sensitivity to ammonia has been shown for Ir gate MOSFET sensors operated at temperatures around 300–325 ∘C, i.e. close to the flue gas temperatures corresponding to optimum SCR catalyst performance. Generally, the sensitivity and cross-sensitivity to the most common flue gas components besides nitrogen (N2), oxygen (O2), and carbon dioxide (CO2) – NOx and CO – were also shown to be low at such sensor operation temperatures (Andersson et al., 2004). For certain transient combustion situations resulting in simultaneous high CO (500–1000 ppm) and relatively low O2 concentrations (below 4 %), a significantly increased response or sensitivity to CO could however be observed (Andersson et al., 2013a).
With some indications that an iridium film of somewhat larger thickness, larger average grain size, and smaller exposed area of the underlying gate insulator may reduce the CO sensitivity of Ir gate MOSFET sensors under the above-mentioned conditions, the main focuses of this study are the characterization and evaluation of the accordingly tailored Ir gate sensors' performance related to NH3 slip monitoring from an SCR-equipped combined heat and power (CHP) plant. As part of this evaluation, the sensor's ammonia sensitivity and its cross-sensitivity to other gaseous substances which typically could be present in the flue gas have been characterized under controlled conditions in the laboratory, followed by evaluation of its performance when mounted in situ downstream from the SCR catalyst in the flue gas channel of a 40 MW biomass-fuelled power plant.
2.1 Sensor fabrication
The silicon carbide field effect transistor-based sensors were fabricated on 4 in. (100 mm) n-type (doping concentration ∼ 5 × 1018 cm−3) 4H-SiC wafer substrates with a 4∘ off-cut. An npn barrier structure to isolate the transistor from the substrate was processed through epitaxial growth of n-type and p-type (∼ 1 µm thickness and doping concentrations of the order of 1018 cm−3) buffer layers on the substrate followed by a ∼ 1 µm thick, p-doped isolation layer (doping concentration ∼ 1 × 1017 cm−3) and a 0.3 µm thick n-type active layer (doping concentration ∼ 3 × 1016 cm−3). The source and drain regions were formed by epitaxial growth of an n-type (∼ 0.3 µm thickness, doping concentration ∼ 1019 cm−3) contact layer and subsequent recess etching to define the drain and source contact areas. A second recess etching of the active and isolation layers was thereafter performed to electrically isolate individual devices from each other (see Fig. 1). A SiO2 Si3N4 SiOx gate insulator stack was realized from thermal growth of a 50 nm SiO2 film through dry oxidation at 1100 ∘C followed by plasma-enhanced chemical vapour deposition (PECVD) of a 25 nm Si3N4 layer and wet oxidation at 900 ∘C (∼ 10 min) to form a ∼ 5 nm thick surface oxide (SiOx).
In order to create high-temperature resilient Ohmic contacts with the source and drain terminals, the gate insulator stack was etched (buffered Hydrofluoric acid – HF) over the source and drain areas prior to the deposition of a 50 nm nickel film by thermal evaporation. The film was defined for the source and drain regions by standard pre-deposition photolithographic patterning and post-deposition lift-off procedures. Using rapid thermal annealing (950 ∘C, 10 min in an Ar atmosphere), a NiSix film was formed from the solid-state reaction between Ni and the SiC semi-conductor in the source and drain regions in order to minimize contact resistance between the semi-conductor, and the metallic electrical leads and contacts were subsequently deposited on top of the Ohmic contacts. All chip-integrated metal leads and contact pads were deposited through direct current (DC) magnetron sputtering and were comprised of titanium or platinum (10 and 400 nm thickness) films. To realize MOSFET-based ammonia sensors, a gas-sensitive iridium film of ∼ 150 nm thickness was deposited by DC magnetron sputtering at background and Ar pressures of 1 × 10⁻⁸ and 5 × 10⁻³ Torr, respectively, as a gate contact. Structuring of the gate as well as other metallic contacts and interconnects was achieved by pre-deposition photolithographic patterning (using SU1818 positive photoresist) and subsequent lift-off of deposited metal films.
After gate contact deposition, individual chips of ∼ 2.1 mm × 2.1 mm in size were diced from the 4 in. (100 mm wafer (see Fig. 2a). The chips were subsequently run through a three-step cleaning procedure using 5 min ultrasonic treatment in acetone followed by the same kind of 5 min treatments in first isopropanol and then ethanol to remove any contamination left from the lift-off and dicing processes. In order to realize sensor operation at an elevated and controlled temperature, individual chips were fixed to an external heater comprised of an alumina substrate and a screen-printed, thick-film platinum (Pt) resistor together with a Pt100 temperature sensor (both obtained from Heraeus Nexensos GmbH, Reinhard-Heraeus-Ring, Kleinostheim, Germany) using a high-temperature-resilient ceramic glue (Ceramabond 571, Aremco Products Inc.). The Pt heater resistor (total resistance of ∼ 7.5 Ω) and Pt100 temperature sensor connector wires were connected to two pairs of pins on a 16-pin TO8 header (Electrovac AG, Aufeldgasse 37–39, Klosterneuburg, Austria) by means of spot welding (see Fig. 2b). For biasing of the MOSFET-based sensor device and a readout of the ammonia-concentration-dependent drain-to-source current, the drain and source terminals were also electrically connected to the corresponding pins on the TO8 header (see Fig. 2b) through gold-wire bonding.
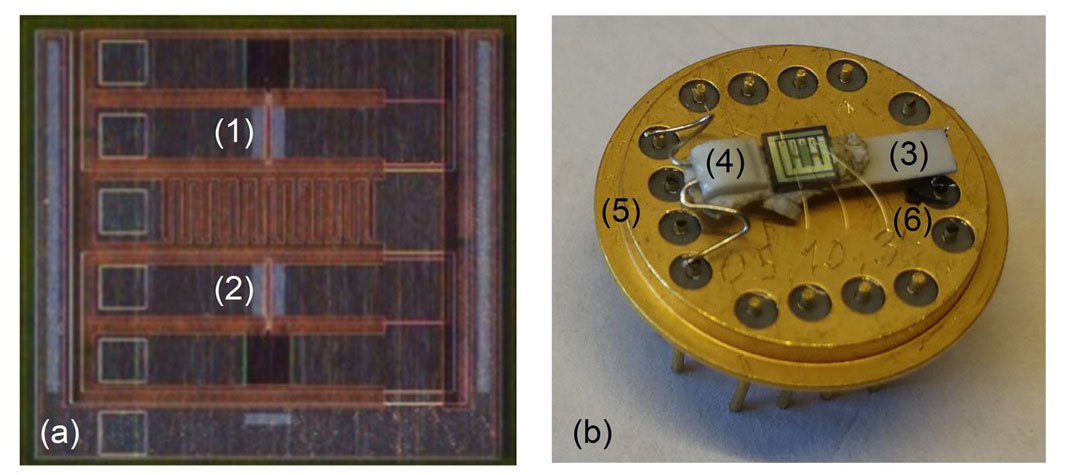
Figure 2The figure displays in panel (a) a diced sensor chip with two MOSFET sensors (1 and 2) and in panel (b) the sensor chip mounted on a heater substrate (3) together with a Pt100 temperature sensor (4), the heater substrate, and Pt100 subsequently connected to two pairs of pins of a TO8 header (5) by means of spot welding, while the drain and source terminals of the two MOSFET sensors are connected to some of the remaining TO8 header pins through gold-wire bonding (6).
2.2 Sensor characterization under controlled conditions
The fabricated Ir gate MOSFET sensors were first evaluated in relation to their gas-sensing characteristics under controlled conditions in a laboratory setup, allowing the concentrations of relevant gaseous substances to be varied independently of each other. To determine the sensors' sensitivity to NH3, NO, NO2, CO, and C2H4 (as a “general” hydrocarbon), four individual sensors were sequentially exposed to 10, 25, 50, and 100 ppm of NO, NO2, and NH3, 100–1000 ppm (in steps of 100 ppm) of CO, and 2, 5, 10, and 20 ppm of C2H4 in a background of 3 %, 5 %, 7 %, and 9 % O2 at 50 % relative humidity (RH) using N2 as the balance. In order to also evaluate the cross-sensitivity between NH3 and each of the other substances, the sensors were furthermore exposed to all combinations of each NH3 concentration (as given above) with each concentration of NO, NO2, CO, and C2H4 at 50 % RH in a background of 5 % O2 (also in this case using N2 as the balance). Each individual set of NH3 NO, NH3 NO2, etc., concentration combinations was thereby designed to include five repetitions of every combination and to be fully randomized (for a graphical example, see Fig. 5). Moreover, the influence of relative humidity on the sensor's response to NH3 was also investigated by exposing the sensors to 10, 25, 50, and 100 ppm NH3 in 5 % O2 N2 for RH levels of 30 %, 50 %, and 70 %.
All exposures to both individual and combinations of substances were maintained for 300 s. In the cases of single-substance exposure sequences, consecutive exposures were separated for another 300 s in time to allow for sensor recovery between exposures and the evaluation of sensor responses and recovery times. In between exposures, the sensors were subjected to the same O2 concentration as for the following gas exposure. The gases used for the characterization all had 99.9995 % purity or better and were supplied from individual gas bottles; in the cases of NH3, NO, and NO2, they were diluted to a concentration of 500 ppm in N2, the corresponding values for CO and C2H4 being 2500 and 50 ppm in N2. Mass flow controllers (Bronkhorst type F201CV, Bronkhorst, Ruurlo, the Netherlands) were used to generate the mixtures of different NOx, NH3, CO, C2H4, O2, and N2 concentrations, all with a total flow over the sensors of 100 mL min−1. Water vapour was added to the gas mixture by passing dry nitrogen through a water bubbler at room temperature, allowing this flow to properly mix with the other gases prior to entering the test chamber. To control the relative humidity at the desired level, a humidity and temperature probe (Humicap HMP110, Vaisala Oyj, Vantaa, Finland) was used to monitor the gas mixture humidity, adjusting the flow through the bubbler accordingly.
For the characterization measurements conducted in the laboratory setup, all sensor devices were operated at 300 ∘C with a drain-to-source voltage (Vds) of 4.0 V while maintaining the gate-to-source voltage (Vgs) at 0.0 V through a chip-internal connection between the gate and source terminals, reading out the drain-to-source current (Ids) as the sensor signal. Both single-substance and mixed-substance gas mixtures were supplied to the sensors at room temperature. The response to each NH3, NO, NO2, etc., concentration was determined as the change in the raw sensor signal (drain-to-source current) caused by the corresponding exposure compared to the sensor signal recorded in the absence of test gas substances (i.e. in the presence of only water vapour, oxygen, and nitrogen) – ΔIds. Sensor response times were evaluated as the time to reach 90 % of the full response after a step change in the concentration of the corresponding substance and are referred to as t90.
2.3 Field testing
Field experiments were conducted in a 40 MW biomass-fuelled CHP plant servicing the local community with both district heating and electricity generation. In order to protect the sensor from any mechanical damage during handling and to minimize the risk of electromagnetic interference (noise) affecting the sensor signal, the sensor was contained in stainless-steel housing (see Fig. 3). Being designed to “extract” a small part of the flue gas flow, and utilizing the pressure difference existing under laminar flow conditions between the perimeter and a position further towards the centre of the flue gas channel to create a gas flow over the sensor device, the possible impact of any rapid variations in flue gas flow on the sensor operation temperature was minimized.
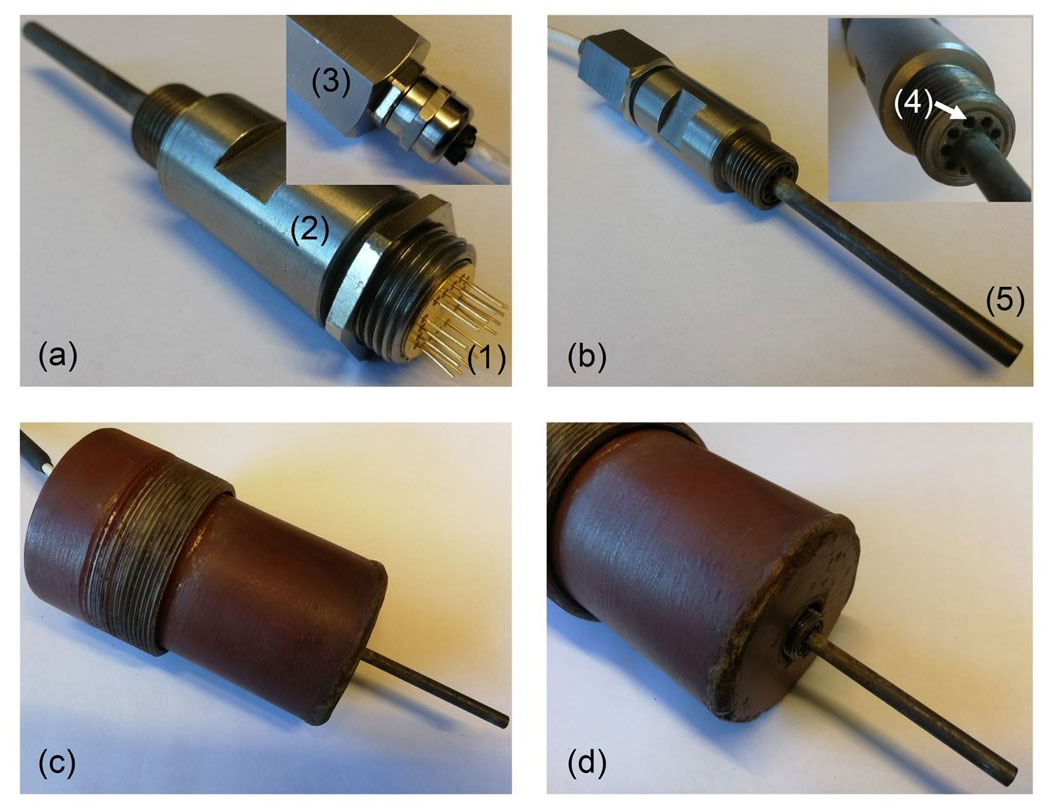
Figure 3This figure provides an overview of the sensor housing and flue gas channel mounting used for the field tests. In panel (a) the “semi-open” sensor housing is viewed from the rear, displaying the position of the TO8 header inside the housing (1), while in panel (b) a view of the housing part directly exposed to the flue gas is provided. Clamped between the tubular front part of the housing (2) and the rear “nut” (3), the TO8 header is directly connected to the cabling via gold-plated crimp connectors. Utilizing the pressure difference existing between the wall and centre parts of the flue gas channel, a small part of the flue gas flow enters the housing through the peripheral holes (4) in its front part, passes over the sensor chip, and exits through the centre pipe of the housing (5). In panels (c) and (d), an overview is given of the specially designed probe-mounting arrangement to allow direct mounting of the sensor housing in the flue gas flow despite a double-walled (and insulated) flue gas channel.
To be able to install the probe directly in the flue gas stream, a special probe-mounting arrangement was constructed, allowing the sensor probe to traverse the inner wall of the double-walled flue gas channel (basically the chimney) while leaving access to the probe from the outside for cable connections. Designed to provide an air gap of approximately 0.1 m between the rear end of the sensor probe and the parts in contact with the warm surfaces of the flue gas channel, direct cable connections to the sensor probe could be realized using an eight-lead PTFE-insulated and shielded cable (specified to an ambient temperature of about 270 ∘C).
With the general relation between sensor response (ΔIds) and NH3 concentration ([NH3]) given by the logarithmic expression in Eq. (1), a calibration curve for the estimation of ambient NH3 concentration from the sensor response was first established based on the responses recorded when exposing the sensors to different known NH3 concentrations. The two constants C1 and C2, both related to the nature of the interaction between NH3 (plus possible interfering substances) and the sensor surface as well as the transistor device characteristics, were thereby determined through linearization of the expression in Eq. (1) and the application of linear regression to the corresponding set of data points (ln ([NH3]+1); ΔIds). For all subsequent measurements or evaluations, this calibration curve, in its exponential form (Eq. 3), was then applied to relate the raw sensor signal to an estimation of ambient NH3 concentration. To evaluate the true effect of possible interfering gases on the NH3 measurement, the same calibration curve was also applied to sensor responses related to these gases or mixtures of gases.
In first considering the ammonia sensitivity of the Ir gate MOSFET sensors as measured under controlled conditions in the laboratory setup, it can be concluded that the calibrated sensor responds as expected to NH3, with the sensor readings levelling off close to the supplied concentrations (see Fig. 4a). The slight increase in the sensor readings for the consecutive periods when no ammonia is injected into the test chamber is expected and is due to ammonia residues still present in the system (mainly because of adsorption and desorption of NH3 to and from surfaces within the test system).
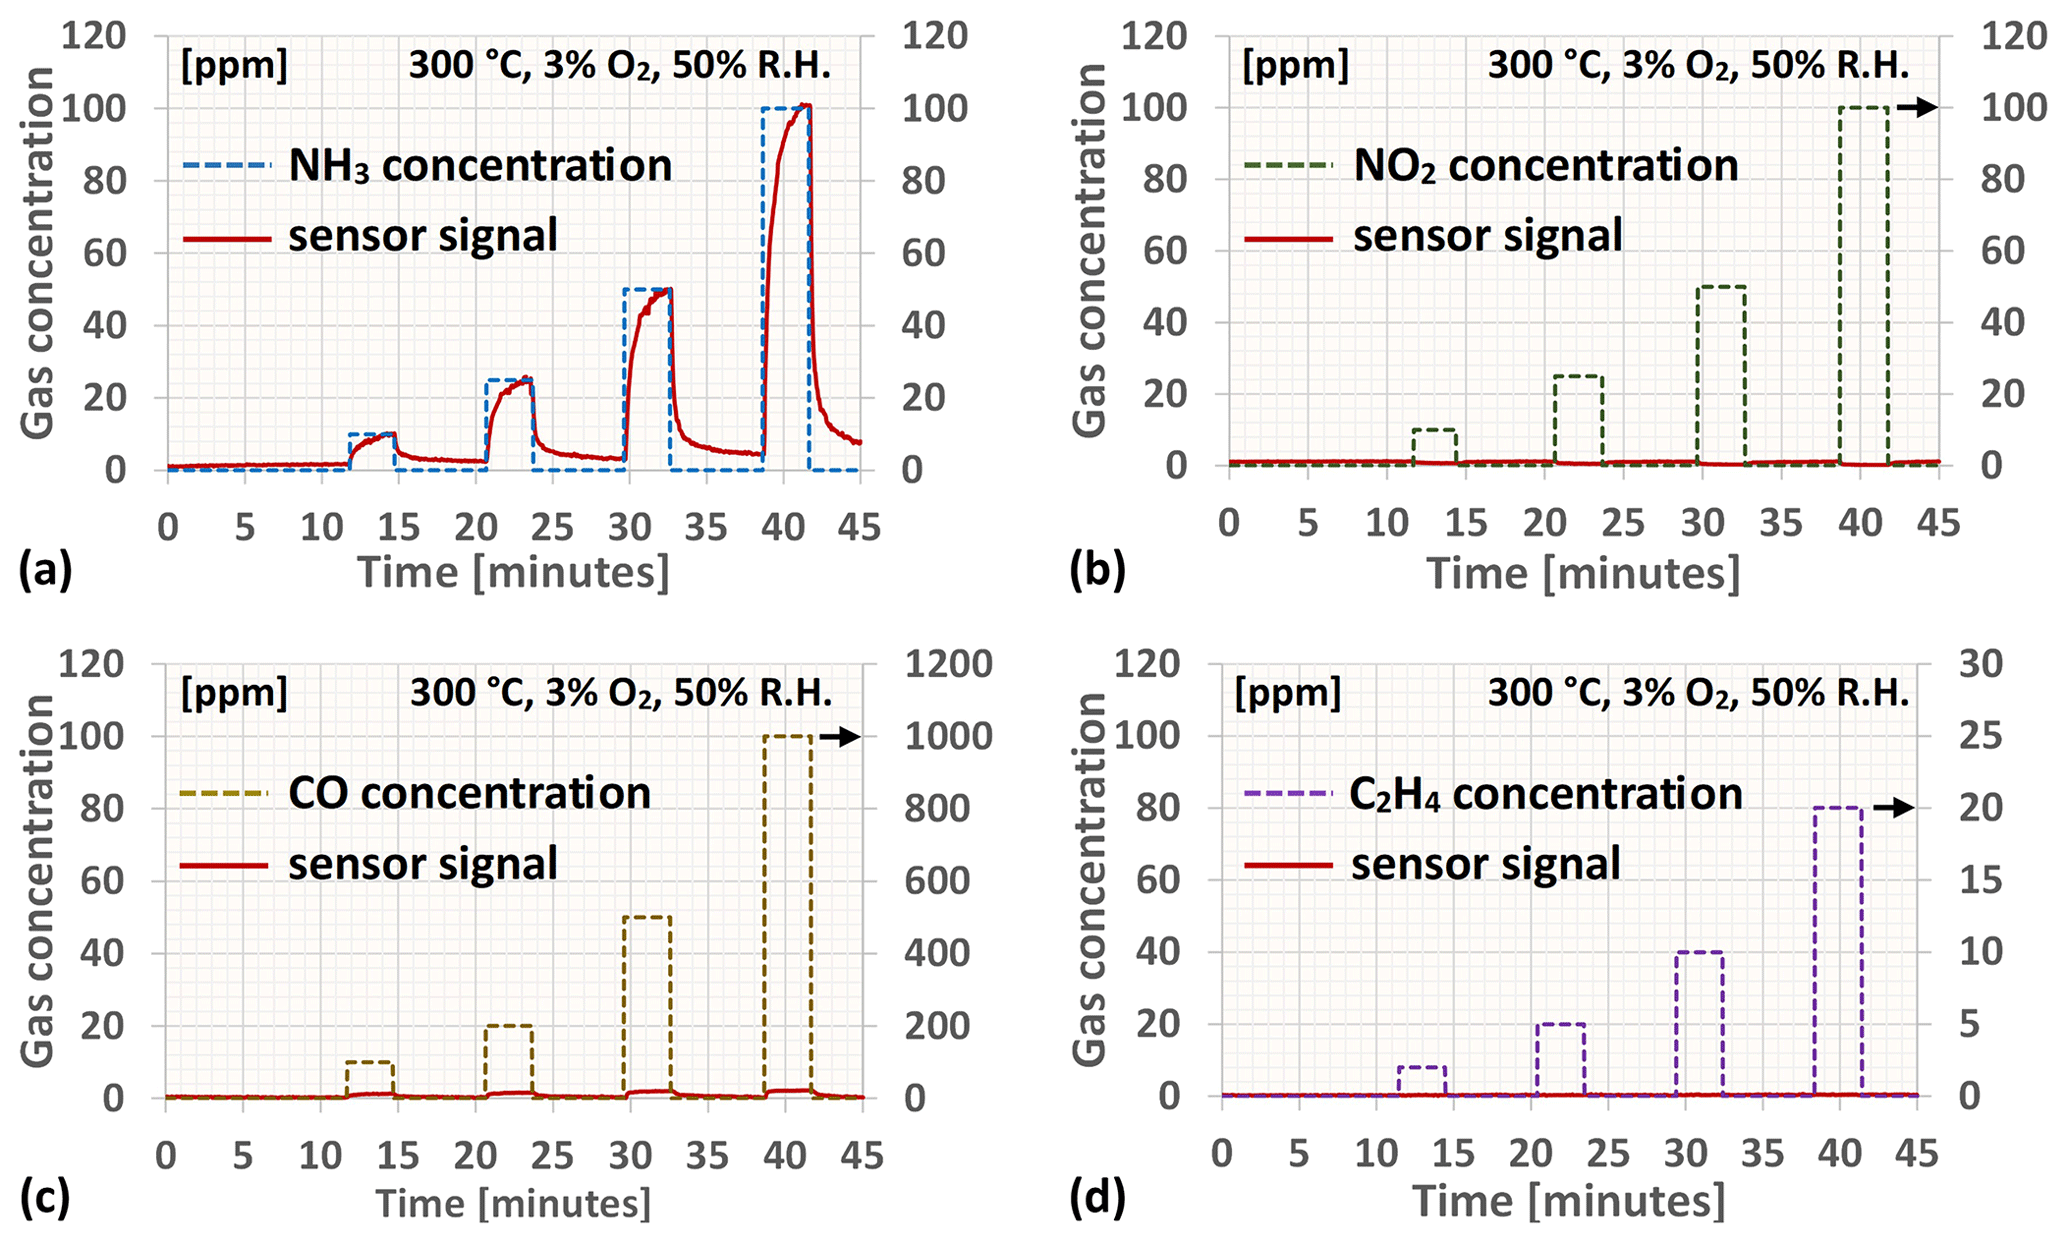
Figure 4This figure gives in panels (a)–(d) examples of the Ir gate MOSFET sensor's reading (response) when exposed to 3 min pulses of NH3, NO2, CO, and C2H4, respectively, at a background oxygen concentration of 3 % and a relative humidity of 50 % after being calibrated towards ammonia. The solid red curve corresponds in all the graphs to the sensor reading, whereas the dashed curves represent the concentration of each individual substance in each of the exposures.
Figure 4b–d, on the other hand, display the effects on the sensor's ammonia reading from exposure to relevant concentrations of interfering gases such as NO2, CO, and C2H4 (as a model hydrocarbon) at a background oxygen concentration of 3 % and a relative humidity of 50 %. For the latter two the effect is hardly discernible even at this low oxygen concentration and can in most practical cases be ignored. The CO sensitivity recorded at 500–1000 ppm and 3 % O2 for the tailored Ir gate sensors is thereby significantly reduced compared to what has been observed from earlier studies on Ir gate MOSFET sensors at even somewhat higher oxygen concentrations (Andersson et al., 2013a). NO2, on the other hand, causes the “ammonia reading” to slightly decrease. NO exposure (not displayed in the figure) has a similar though much smaller effect on the sensor reading to NO2. Since exposure to nitrogen oxides causes the drain-to-source current of the MOSFET sensor device to decrease, in the absence of ammonia the sensor reading will not be significantly affected (a decrease in the signal from the zero level will still be considered to be a reading of 0 ppm NH3). In generally exhibiting low sensitivity to CO and short-chained hydrocarbons, i.e. the two major constituents of unburned matter emissions from biomass combustion, and with the sensitivity to nitrogen oxides being practically insignificant in the absence of ammonia, the cross-sensitivity matrix becomes the more important characteristic determining the tailored sensor's NH3 sensing performance for the application in question.
As for the influence of relative humidity and oxygen concentration on the sensor's ammonia reading, both will introduce a small (but consistent) reduction into the sensor reading upon increasing humidity or oxygen concentration. While the cross-sensitivity between NH3 and humidity (water vapour) may be considered practically insignificant, the sensor's ammonia reading decreases by about 1 ppm (at 100 ppm NH3 exposure) when the relative humidity is increased from 30 % to 70 % (see Fig. 5a), and the corresponding reduction in the sensor reading when changing the O2 concentration from 3 % to 9 % is of the order of 10 ppm, as seen in Fig. 5b. Generally, however, the flue gas oxygen concentration exhibits low variability under normal operation of the power and/or district heating plant and is mostly limited to between 4 % and 5 %, thereby also limiting the influence on the sensor's NH3 concentration reading. Furthermore, for the cases when highly accurate NH3 measurements are required, the deviation in the sensor reading caused by flue gas oxygen concentration variations may also be compensated for by measurement of the O2 concentration, e.g. through employment of the already commercially available solid electrolyte-type oxygen sensor (Liu et al., 2014).
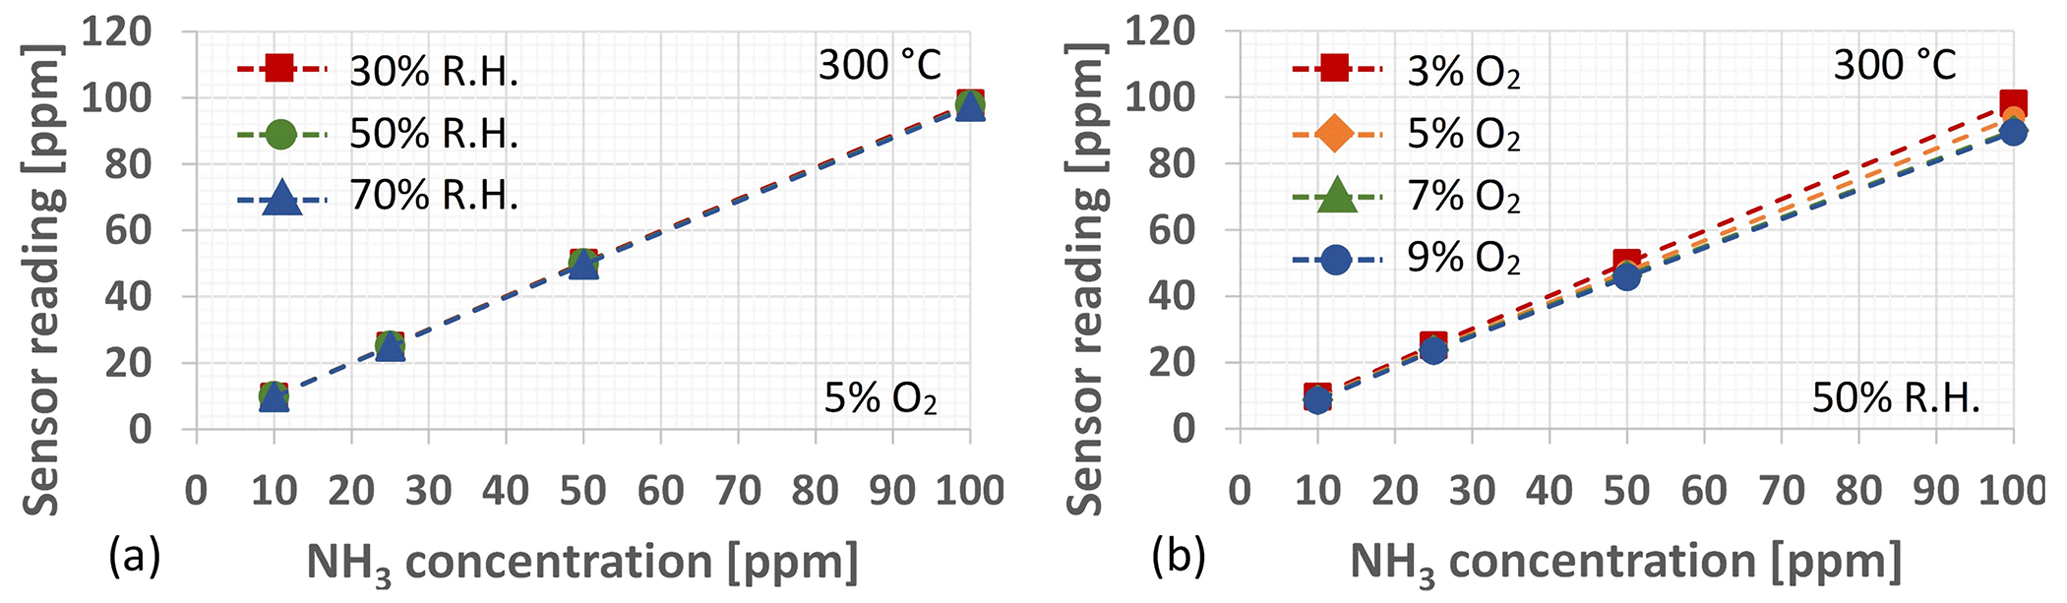
Figure 5(a) The influence of relative humidity on the Ir gate MOSFET sensor's NH3 concentration reading as measured at an O2 concentration of 5 % and a sensor operation temperature of 300 ∘C. (b) The change in the sensor's NH3 concentration reading when subjected to different O2 concentrations at a relative humidity of 50 % when calibrated for a background O2 concentration of 3 %.
Figure 6 provides data on the sensor's cross-sensitivity between NH3 and CO, between NH3 and C2H4, and between NH3 and NO2. In the case of CO, very little impact of its presence on the sensor's ammonia reading could be observed (at least within the range of CO and O2 concentrations investigated), while the highest C2H4 concentration was observed to slightly increase the reading from the sensor (see Fig. 6c). NO2 was, on the other hand, observed to significantly affect the sensor's ability to provide a correct measure of the supplied NH3 concentration, the reading from the sensor differing by as much as 30 % compared to the added NH3 concentration in the presence of the highest supplied NO2 concentration (100 ppm).
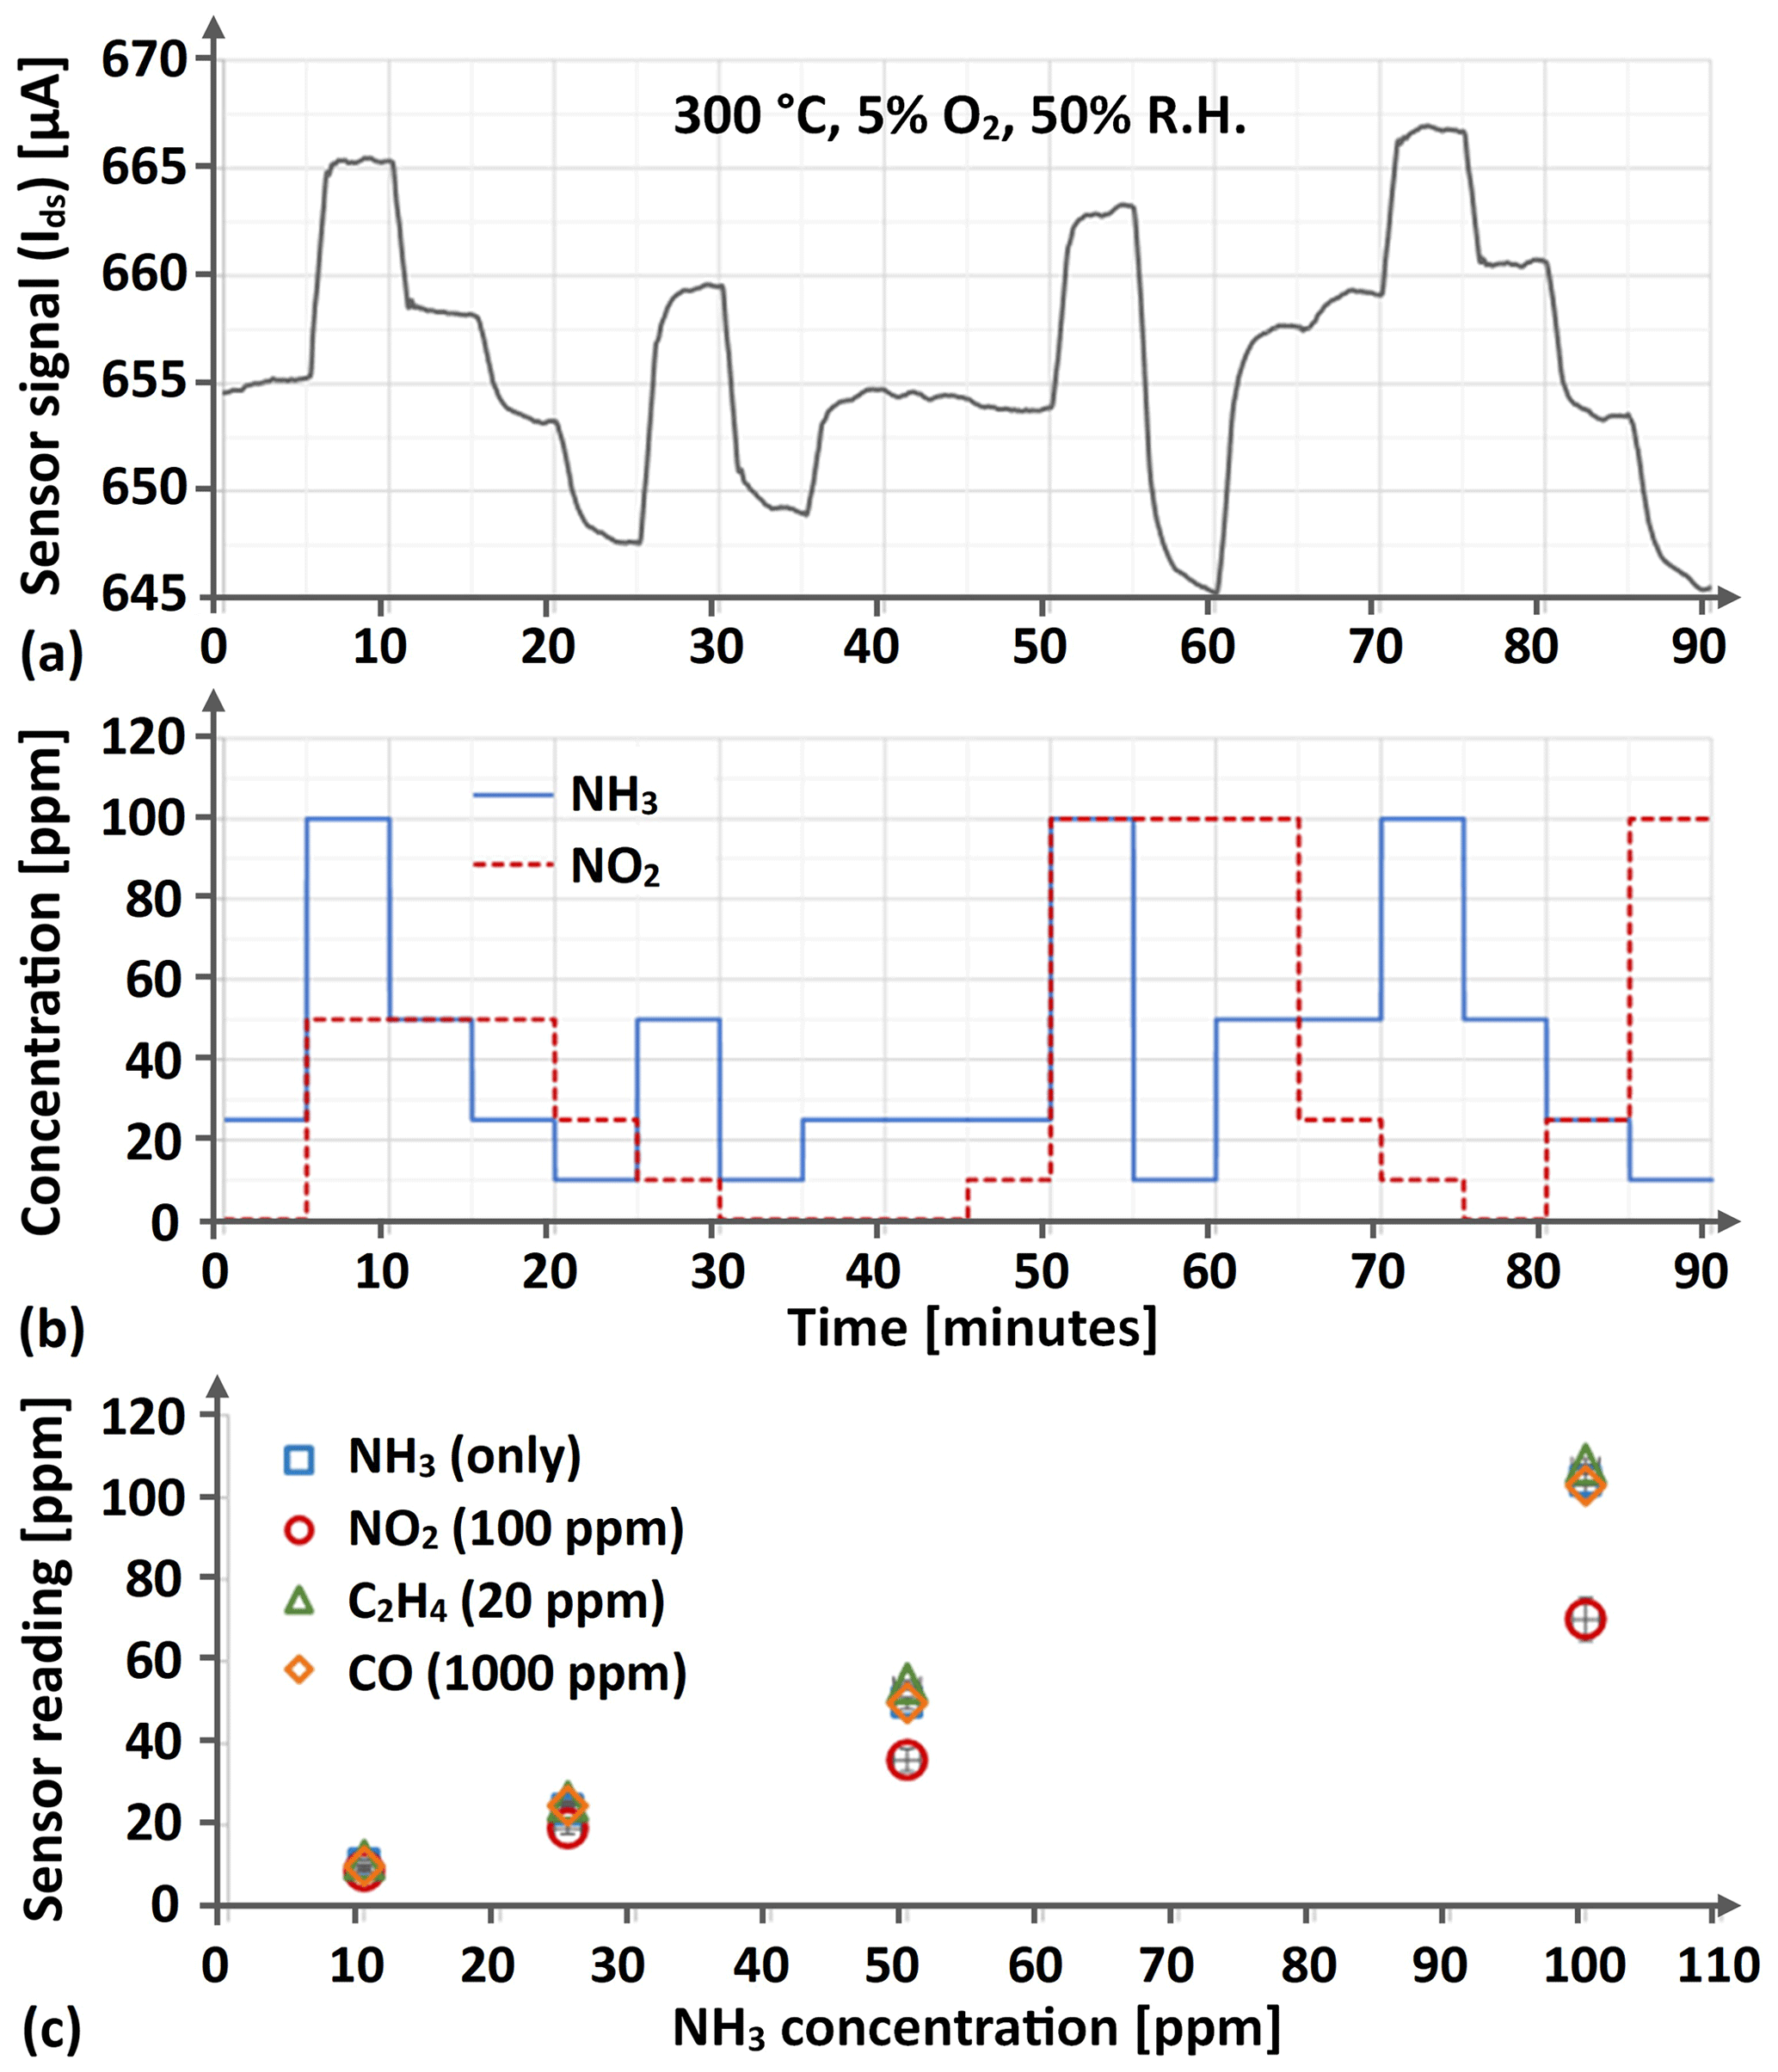
Figure 6This figure provides in panel (a) an excerpt from the resulting Ir gate MOSFET sensor signal when exposing the sensor to a randomized sequence of all 0, 10, 25, 50, and 100 ppm NH3 and NO2 concentration combinations, and the corresponding concentrations are given in panel (b). In panel (c) the separate effects of 100 ppm NO2, 20 ppm C2H4, and 1000 ppm CO exposure on the sensor reading when simultaneously subjected to 10, 25, 50, and 100 ppm NH3 at a background oxygen concentration of 5 % and a relative humidity of 50 % is illustrated for the average reading from four individual sensors and five separate (and in the sequence randomly positioned) exposures, with the standard deviation also provided as a measure of the signal spread between sensors and exposures.
Relating the observed cross-sensitivity between NH3 and NO2 to the application of NH3 slip monitoring and SCR control, it can however be noted that the NO2 concentration is expected to be smaller than (or possibly of the same order as) the NH3 concentration downstream from the SCR catalyst whenever any significant NH3 slip occurs, at least under normal operation of the SCR system. As the sensor's NH3 reading is decreased by no more than 30 % for even the highest NO2 concentrations investigated, a correct assessment of practical NH3 slip situations would thereby still be likely albeit with a non-linear relationship between the monitored ammonia slip and the ammonia dosing rate adjustment.
Furthermore, it should also be kept in mind that the apparent cross-sensitivity observed when mixing and supplying two different substances in a laboratory setup may not correspond to the true cross-sensitivity of the sensor, as processes taking place upstream from the sensor location may also contribute to the measured cross-sensitivity. In the particular case of NH3 and NO2, these substances may for example adsorb to and partially react with each other on hot (or even cold) surfaces other than the sensor in contact with the gas mixture, before reaching the sensor position, which is why the concentrations of both NH3 and NO2 at the sensor could be smaller than what was originally supplied (hence the reduced NH3 reading from the sensor). To correctly assess cross-sensitivities, the concentrations of all the relevant substances should therefore ideally be measured at the sensor location rather than the evaluation being based on the supplied concentration values.
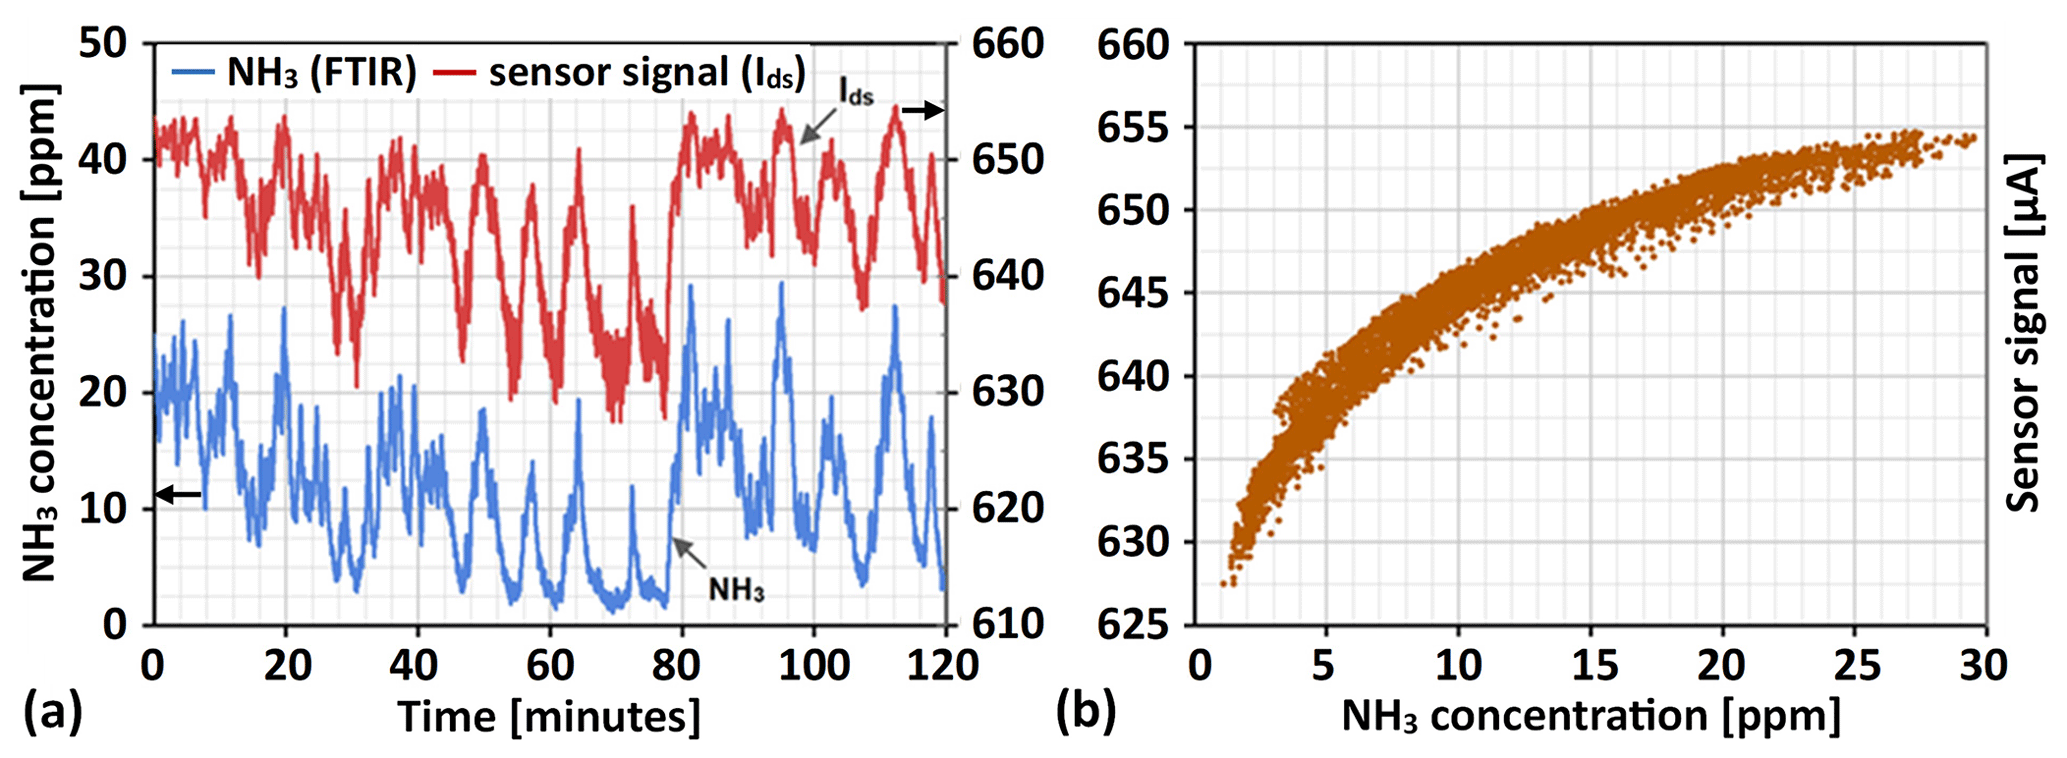
Figure 7This figure displays in panel (a) the obtained variations in raw sensor signal output (the drain-to-source current, Ids) for the sensor mounted in the flue gas channel downstream from the SCR catalyst bed during 2 h of normal boiler operation along the flue gas NH3 concentration as measured by the FTIR instrument. In panel (b) the raw sensor signal is plotted against the measured NH3 concentration to illustrate the logarithmic relationship between the change in flue gas ammonia concentration and the change in sensor signal output.
As for the measurements performed directly in the flue gas downstream from the SCR catalyst, Fig. 7a displays the raw sensor signal output (the drain-to-source current) over 2 h of measurements along with the NH3 concentration reading from the FTIR instrument. Both signals can be seen to follow similar trends, increasing and decreasing during the same intervals in time, with the sensor signal generally appearing somewhat noisier. What should be considered, however, is that while the sensor signal was sampled once every second, the integration time of the FTIR instrument was set to 20 s to obtain better accuracy of the NH3 reading, thereby reducing the temporal resolution and likely “averaging” out some true variations in ammonia concentration picked up by the sensor.
Another difference between the raw sensor signal and the FTIR reading can more clearly be seen from Fig. 7b. Due to the logarithmic relationship between the flue gas NH3 concentration and the sensor response, the change in sensor signal (drain-to-source current) is disproportionately larger for NH3 concentration variations at lower (e.g. 0–10 ppm) compared to somewhat higher (e.g. 20–30 ppm) ammonia levels. Thus, the sensor's raw signal may also appear noisier at low ammonia concentrations when comparing the sensor signal and FTIR readings, where small variations in concentration are “amplified” in the sensor signal. A clear example is found about 70 min into the measurement displayed in Fig. 7a.
Applying the calibration relation in Eq. (3) and displaying the sensor's calculated ammonia reading in the same format as for the FTIR ammonia reading in Fig. 7a, the sensor's ammonia signal can be directly compared to the measured NH3 concentration (see Fig. 8a). In addition to the sensor's NH3 reading reflecting the measured concentrations quite well, it can be seen that the “noisy” appearance of the sensor signal at low NH3 concentrations has largely disappeared upon converting the raw signal to the corresponding concentration values. In plotting the natural logarithm of the measured NH3 concentration vs. the sensor response (see Fig. 8b), a more direct comparison to the established calibration curve can also be made. As seen from Fig. 8b, the recorded sensor responses fairly closely follow the linear version of the calibration curve, with some tendency to slightly underestimate the flue gas ammonia concentration that is possibly due to the influence of interfering gases.
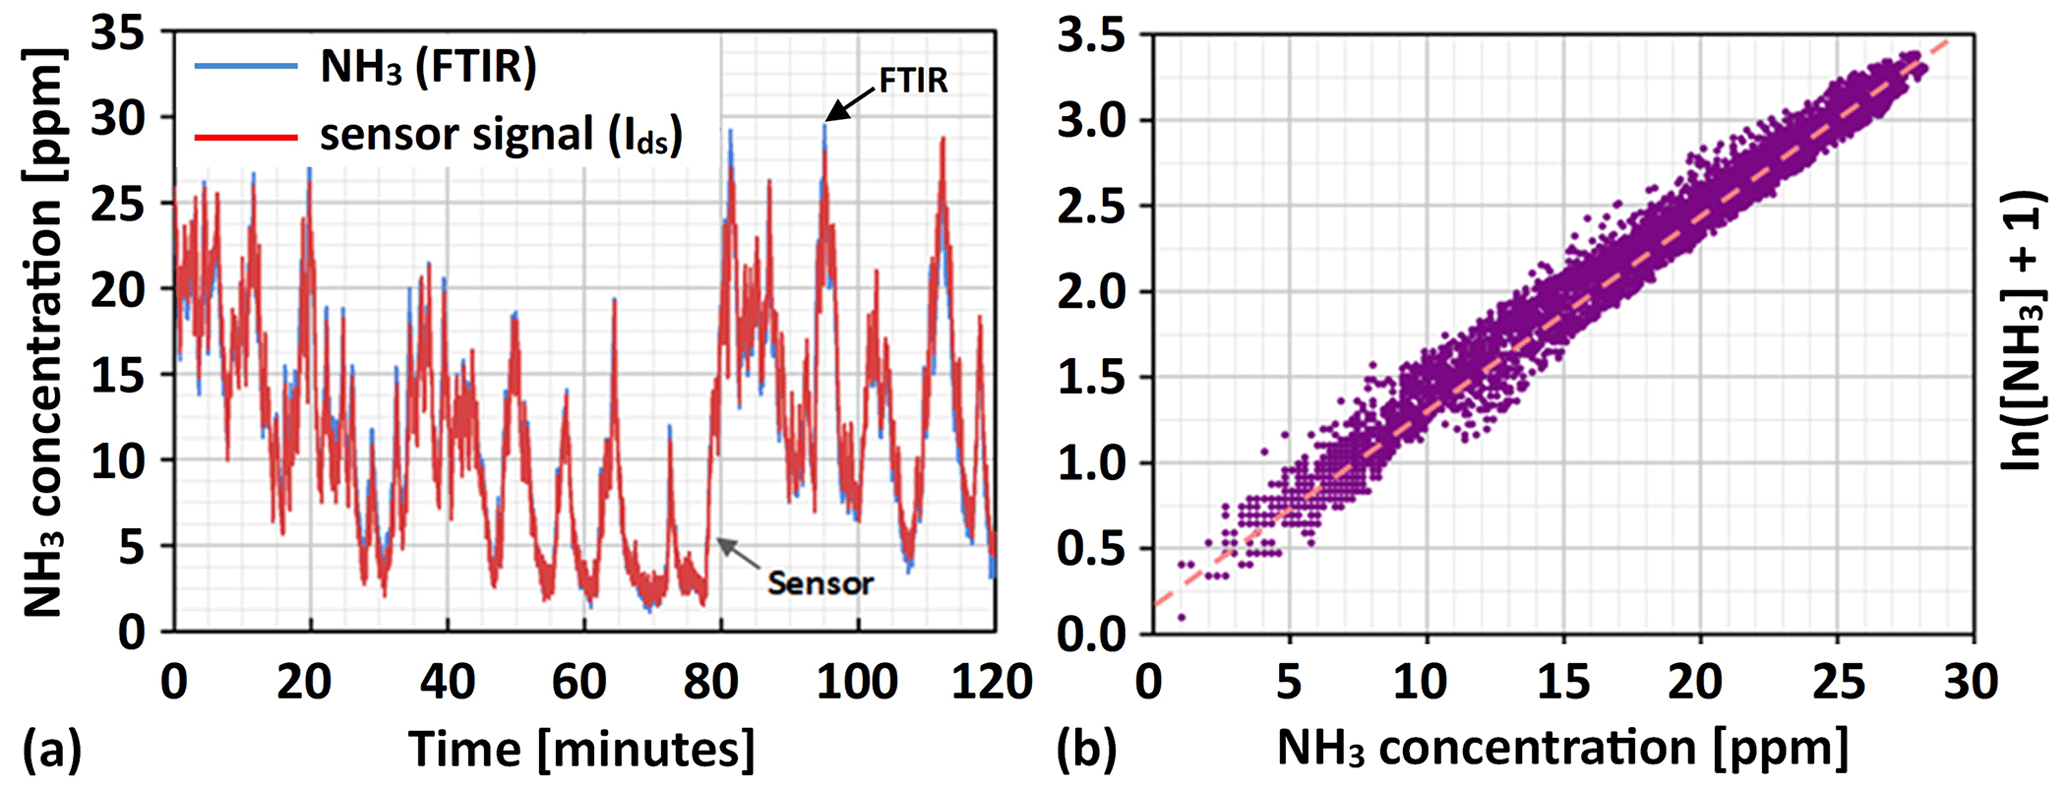
Figure 8In panel (a) the NH3 slip reading from the calibrated Ir gate MOSFET sensor during 2 h of normal boiler operation is displayed and compared to the corresponding NH3 concentrations measured by the FTIR reference instrument, and in panel (b) the natural logarithm of measured ammonia concentrations vs. the sensor response in relation to the linearized calibration curve is given.
However interesting the ability to follow changes in flue gas NH3 concentration over a couple of hours with the Ir gate MOSFET sensor may be, without long-term reliable sensor performance, the sensor will anyway find little use in real ammonia slip monitoring or SCR control applications. Figure 9 displays the sensor and FTIR ammonia readings recorded over a 2 h period approximately 2 months after sensor installation and 53 d after the measurements displayed in Figs. 7 and 8. As seen from Fig. 9a, the sensor readings still follow the trends in flue gas ammonia concentration changes quite well. It can, however, also be observed that the sensor reading at the start of the 2 h measurement indicates slightly higher ammonia concentrations than measured by the FTIR instrument, while towards the end of the measurement this relation is to some extent reversed. Since some slight build-up of ammonia over time inside the sampling tubes and measurement cell of the FTIR instrument is not unlikely (the instrument should according to the instructions be flushed regularly with clean air), a higher NH3 reading from the FTIR instrument towards the end of the measurement could be reasonable. The apparent lack of such a trend for the first-week measurement, displayed in Figs. 7 and 8, might be due to it already being masked by the fairly high ammonia concentrations at the start of the measurement.
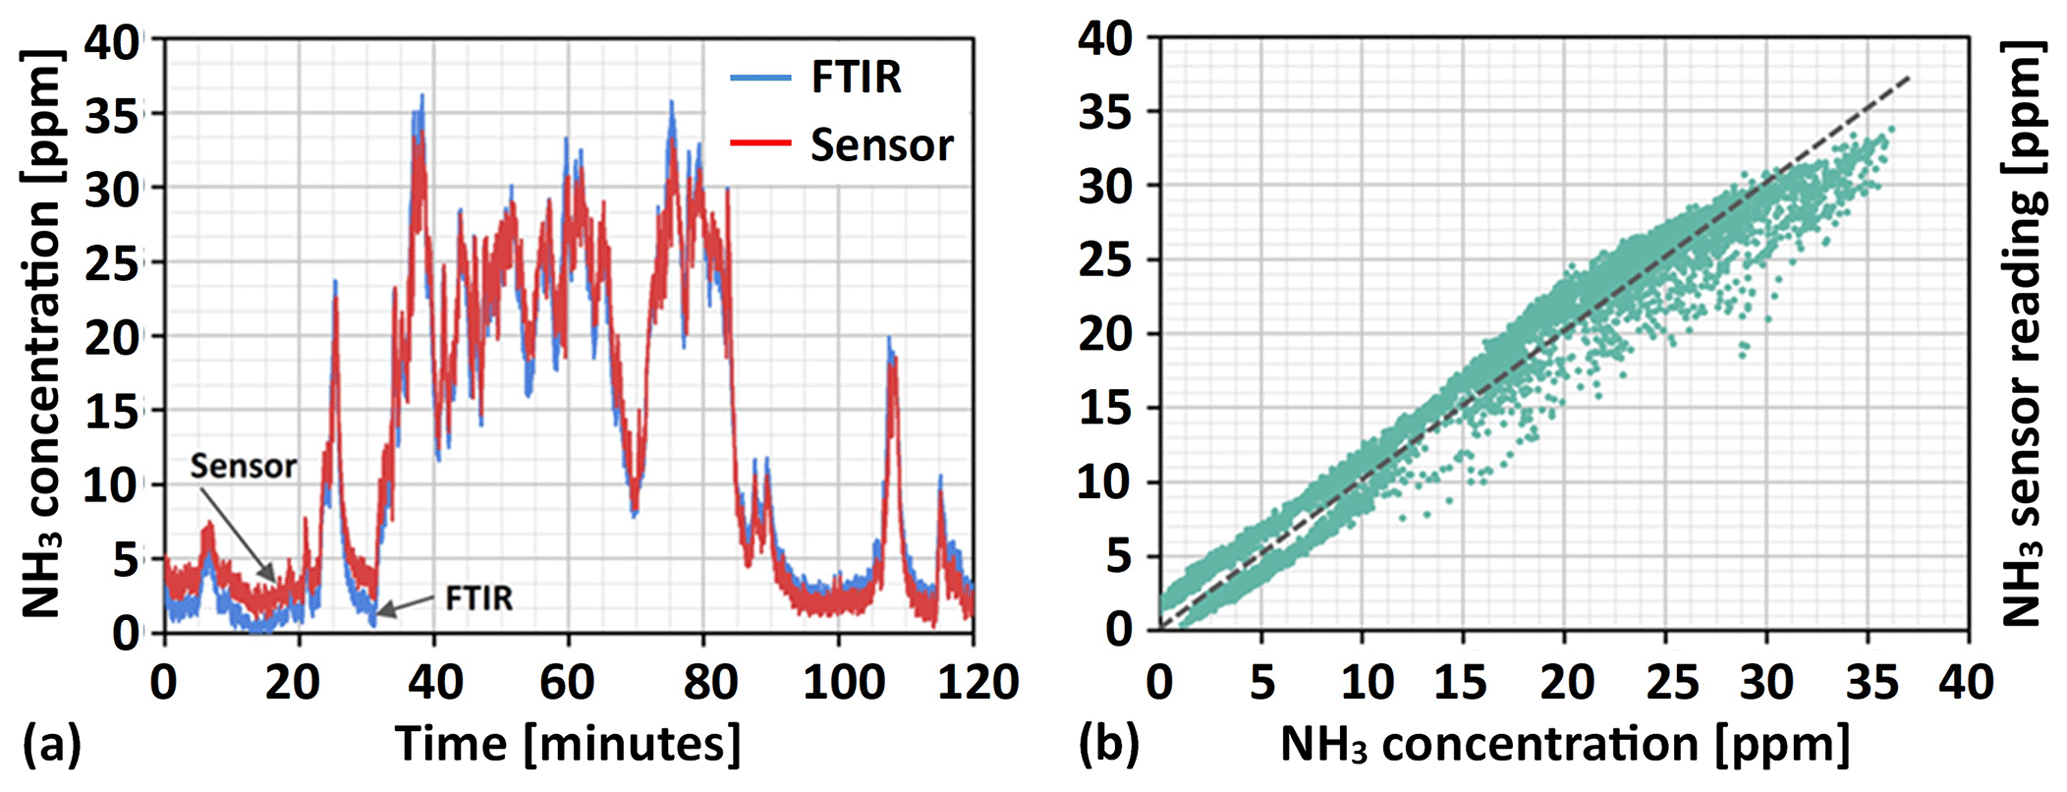
Figure 9In panel (a), 2 h of NH3 concentration readings (red line) from the Ir gate MOSFET sensor, obtained 53 d after its in situ calibration, are compared to the flue gas NH3 concentration measured by the FTIR instrument (blue line). From the plot of sensor- vs. FTIR-measured ammonia concentrations given in panel (b), both the sensor's overestimation and underestimation of flue gas NH3 concentration at the beginning and end of the 2 h measurement, respectively, and its underestimation of the highest NH3 concentrations can be clearly observed.
Assuming the initial ammonia readings from the FTIR instrument are correct, the Ir gate field effect sensor will overestimate the flue gas NH3 concentration by a few parts per million (2–3 ppm on average), at least towards the lower end of the scale. Such an overestimation could be indicative of a general change in the signal level towards higher values (the so-called baseline-signal drift), but this is not reflected in concentrations at the high end of the scale. Examining the sensor vs. FTIR data points displayed in Fig. 9b, rather the opposite trend can be observed, analogous to what was indicated for the complete range of measured concentrations during the first 2 h period of FTIR measurements. For the highest ammonia readings from the FTIR instrument, the sensor readings tend to underestimate the flue gas NH3 concentration by a few parts per million on average. Disregarding the slight uncertainty related to ammonia readings from the FTIR instrument (the readings possibly increasing by a couple of parts per million over the 2 h measurement), this may indicate a small decrease in sensor sensitivity during the 2 months over which the test was conducted, i.e. a smaller change in the drain-to-source current per change in ammonia concentration than at the start of the test. Despite the possible sensor signal drift and a slight reduction in sensitivity, the sensor is able to monitor the downstream ammonia slip with an error margin of about ±3 ppm over the range of concentrations that is also interesting to measure after 2 months of sensor operation and without any recalibration.
In order to thoroughly evaluate long-term sensor performance, a somewhat larger number of comparative sensor or FTIR measurements spread over a longer period of time would however be desirable, especially to assess the further evolution of the possible slight decrease in NH3 sensitivity observed over the first 2 months of sensor operation. In the case of the sensitivity stabilizing at the level recorded for the second reference measurement, the small error in NH3 concentration determination introduced by the initial reduction in sensitivity may in many cases be of less practical significance, whereas for a continued decrease in sensitivity the rate at which it occurs largely determines the sensor's usefulness and/or the feasibility of different possible remedies, e.g. sensor recalibration or replacement, to handle the change in sensor readings over time. When briefly also considering any possible long-term baseline-signal drift, zero-point calibration might be an option to reduce the impact of such a change in sensor reading over time, even in the case of continuous power plant operation if the NOx emissions released when shortly interrupting NH3 injection to create the zero-level condition can be accepted.
The structurally tailored Ir gate MOSFET sensors, designed to employ a somewhat thicker iridium film and leave a little less of the underlying gate insulator surface directly exposed to the ambient, as compared to previously investigated Ir gate sensors, have been shown to retain a good sensitivity to NH3 while simultaneously exhibiting practically insignificant sensitivity or cross-sensitivity to water vapour (relative humidity), CO, and C2H4 (a model hydrocarbon) over the CO, hydrocarbon, and O2 concentration ranges likely to be encountered in flue gases from heat and/or power plants. Furthermore, the observed sensitivity or cross-sensitivity to NO2, and to some extent also NO and O2, may not necessarily have much of an impact on the ability to realize sensor-based SCR control in the practical case. Firstly, neither NO nor NO2 has any effect on the sensor reading in the absence of NH3 (as this would correspond to a reading below 0 ppm, which is not possible). Secondly, the NOx concentrations downstream from the catalyst are expected to be lower than (or possibly of the same order as) the corresponding NH3 concentrations for any ammonia slip events, which is why detection of all such events by the sensor seems plausible as the related cross-sensitivity only would result in a limited reduction in the sensor reading, albeit with some uncertainty regarding the exact flue gas NH3 concentration. As for the influence of flue gas oxygen concentration on the sensor's NH3 concentration reading, in addition to the O2 concentration being expected to exhibit quite limited variations during normal power and/or heating plant operation, the related deviation in NH3 concentration measured by the sensor may also be compensated for through simultaneous measurement of the flue gas O2 concentration, e.g. from the employment of a commercially available O2 sensor.
From the 2-month sensor evaluation conducted in a combined heat and power plant, it could also be concluded that the tailored Ir gate field effect sensors also exhibit good NH3 sensitivity over the concentration range (approximately 0–40 ppm) relevant to the intended SCR control application when directly exposed to real flue gases, offering an accuracy of ±3 ppm and a seemingly low sensor signal drift. Given that similar (or reduced) trends regarding the slight changes in sensor sensitivity over time, as indicated by the NH3 reference measurements, and any possible baseline shift can be extrapolated to longer timescales, the Ir gate MOSFET ammonia sensor may offer an option for long-term reliable, online ammonia slip monitoring and SCR system control in heat and/or power production plants, especially if regular zero-point calibration can be performed.
Data may be provided upon request.
LK: methodology, formal analysis, validation, investigation, data curation, visualization, writing – original draft. MA: methodology, writing – review and editing, project administration.
Mike Andersson has received research funding from SenSiC AB, a company focusing on the development and commercialization of SiC-based gas sensors for process control or automation applications.
Publisher’s note: Copernicus Publications remains neutral with regard to jurisdictional claims in published maps and institutional affiliations.
Our research has been supported by the Knut and Alice Wallenberg Foundation through the Working on Venus project. The MOSFET devices have been processed in collaboration with RISE Acreo AB, Kista, Sweden.
This research has been supported by the Knut och Alice Wallenbergs Stiftelse (Working on Venus).
This paper was edited by Bernhard Jakoby and reviewed by two anonymous referees.
Andersson, M., Ljung, P., Mattsson, M., Löfdahl, M., and Lloyd Spetz, A.: Investigations on the possibilities of a MISiCFET sensor system for OBD and combustion control utilizing different catalytic gate materials, Top. Catal., 30/31, 365–368, https://doi.org/10.1023/B:TOCA.0000029776.18603.74, 2004.
Andersson, M., Pearce, R., and Lloyd Spetz, A.: New generation SiC based field effect transistor gas sensors, Sensor Actuat. B-Chem., 179, 95–106, https://doi.org/10.1016/j.snb.2012.12.059, 2013a.
Andersson, M., Lloyd Spetz, A., and Pearce, R.: Recent trends in silicon carbide (SiC) and graphene-based gas sensors, in: Semiconductor gas sensors, edited by: Jaaniso, R. and Tan, O. K., Woodhead Publishing Series in Electronic and Optical Materials, Woodhead Publishing, 117–158, https://doi.org/10.1533/9780857098665.2.117, 2013b.
Atkinson, R.: Atmospheric Chemistry of VOCs and NOx, Atmos. Environ., 34, 2063–2101, https://doi.org/10.1016/S1352-2310(99)00460-4, 2000.
Brunekreef, B. and Holgate, S. T., Air pollution and health, Lancet, 360, 1233–1242, https://doi.org/10.1016/S0140-6736(02)11274-8, 2002.
Clappier, A., Thunis, P., Beekmann, M., Putaud, T. P., and de Meij, A.: Impact of SOx, NOx, and NH3 emission reductions on PM2.5 concentrations across Europe: Hints for future measure development, Environ. Int., 156, 106699, https://doi.org/10.1016/j.envint.2021.106699, 2021.
European Environment Agency (EEA): Europe's air quality status 2021 – update, in: Air quality in Europe 2021, Environment Agency Report No. 15/2021, ISBN 978-92-9480-403-7, 2021.
Garzon, F. H., Mukundan, R., and Brosha, E. L.: Solid-state mixed potential gas sensors: theory, experiments and challenges, Solid State Ionics, 136–137, 633–638, https://doi.org/10.1016/S0167-2738(00)00348-9, 2000.
Guerreiro, C., Ortiz, A., de Leeuw, F., Viana, M., and Colette, A.: Air quality in Europe, European Environment Agency Report No. 12/2018, ISBN 978-92-9213-989-6, https://doi.org/10.2800/777411, 2018.
Javed, U., Ramaiyan, K. P., Kreller, C. R., Brosha, E. L., Mukundan, R., and Morozov, A. V.: Using sensor arrays to decode NOx/NH3/C3H8 gas mixtures for automotive exhaust monitoring, Sensor Actuat. B-Chem., 264, 110–118, https://doi.org/10.1016/j.snb.2022.131589, 2018.
Jiang, L., Chen, Y., Zhou, H., and He, S.: NOx emissions in China: Temporal variations, spatial patterns and reduction potentials, Atmos. Pollut. Res., 11, 1473–1480, https://doi.org/10.1016/j.apr.2020.06.003, 2020.
Kamphus, M. and Williams, K.: Selecting the right gas analyzer to optimize monitoring of NOx and other emissions, Hydrocarbon Processing, May 2020, 63–66, https://www.hydrocarbonprocessing.com/magazine/2020/may-2020/process-controls-instrumentation-and-automation/selecting-the-right-gas-analyzer-to-optimize-monitoring-of-nox-and-other-emissions (last access: 21 December 2022), 2020.
Karamfilova, E.: Revision of the Industrial Emissions Directive and update of the European Pollutant Release and Transfer Register (E-PRTR), European Parliamentary Research Service Briefing, March 2022, European Parliament, https://www.europarl.europa.eu/RegData/etudes/BRIE/2022/699497/EPRS_BRI(2022)699497_EN.pdf (last access: 22 December 2022), 2022.
Kato, N., Kurachi, H., and Hamada, Y.: Thick Film ZrO2 NOx Sensor for the Measurement of Low NOx Concentration, SAE Technical Paper 980170, https://doi.org/10.4271/980170, 1998.
Lai, J.-K. and Wachs, I. E.: A Perspective on the Selective Catalytic Reduction (SCR) of NO with NH3 by Supported V2O5–WO3/TiO2 Catalysts, ACS Catal., 8, 6537–6551, https://doi.org/10.1021/acscatal.8b01357, 2018.
Liu, Y., Parisi, J., Sun, X., and Lei, Y.: Solid-state gas sensors for high temperature applications – a review, J. Mater. Chem. A, 2, 9919–9943, https://doi.org/10.1039/C3TA15008A, 2014.
Liu, T., Wang, X., Li, L., and Yu, J.: Review – Electrochemical NOx Gas Sensors Based on Stabilized Zirconia, J. Electrochem. Soc., 164, B610–B619, https://doi.org/10.1149/2.0501713jes, 2017.
Nova, I., Beretta, A., Groppi, G., Lietti, L., Tronconi, E., and Forzatti, P.: Monolithic catalysts for NOx removal from stationary sources, in: Structured catalysts and reactors, 2nd edn., edited by: Cybulski, A. and Moulijn, J. A., CRC Press, Boca Raton, USA, 171–214, https://doi.org/10.1201/9781420028003, 2005.
Pronobis, M.: Reduction of nitrogen oxide emissions, in: Environmentally oriented modernization of power boilers, 1st edn., Elsevier, 79–133, https://doi.org/10.1016/B978-0-12-819921-3.00004-2, 2015.
Qi, X., Zhu, S., Zhu, C., Hu, J., Lou, S., Xu, L., Dong, J., and Cheng, P.: Smog chamber study of the effects of NOx and NH3 on the formation of secondary organic aerosols and optical properties from photo-oxidation of toluene, Sci. Total Environ., 727, 138632, https://doi.org/10.1016/j.scitotenv.2020.138632, 2020.
Ramaiyan, K. P. and Mukundan, R.: Editor's choice – Review – Recent advances in mixed potential sensors, J. Electrochem. Soc., 167, 037547, https://doi.org/10.1149/1945-7111/ab67ab, 2020.
Schönauer, D., Wiesner, K., Fleischer, M., and Moos, R.: Selective mixed potential ammonia exhaust gas sensor, Sensor Actuat. B-Chem., 140, 585–590, https://doi.org/10.1016/j.snb.2009.04.064, 2009.
Schönauer, D., Nieder, T., Wiesner, K., Fleischer, M., and Moos, R.: Investigation of the electrode effects in mixed potential type ammonia exhaust gas sensors, Solid State Ionics, 192, 38–41, https://doi.org/10.1016/j.ssi.2010.03.028, 2011.
Shaddick, G., Thomas, M. L., Mudu, P., Ruggeri, G., and Gumy, S.: Half the world's population are exposed to increasing air pollution, npj Climate and Atmospheric Science, 3, 23, https://doi.org/10.1038/s41612-020-0124-2, 2020.
Shahbazi, H., Mostafazade Abolmaali, A., Alizadeh, H., Salavati, H., Zokaei, H., Zandavi, R., Torbatian, S., Yazgi, D., and Hosseini, V.: Development of high-resolution emission inventory to study the relative contribution of a local power plant to criteria air pollutants and greenhouse gases, Urban Climate, 38, 100897, https://doi.org/10.1016/j.uclim.2021.100897, 2021.
Song, M., Xue, J., Gao, S., Cheng, G., Chen, J., Lu, H., and Dong, Z.: Prediction of NOx concentration at SCR inlet based on BMIFS-LSTM, Atmosphere, 13, 686, https://doi.org/10.3390/atmos13050686, 2022.
Sun, Y., Zwolińska, E., and Chmielewski, A. G.: Abatement technologies for high concentrations of NOx and SO2 removal from exhaust gases: A review, Crit. Rev. Env. Sci. Tec., 46, 119–142, https://doi.org/10.1080/10643389.2015.1063334, 2016.
Tang, L., Qu, J., Mi, Z., Bo, X., Chang, X., Anadon, L. D., Wang, S., Xue, X., Li, S., Wang, X., and Zhao, X.: Substantial emission reductions from Chinese power plants after the introduction of ultra-low emissions standards, Nature Energy, 4, 929–938, https://doi.org/10.1038/s41560-019-0468-1, 2019.
Wang, D. Y., Robert, R. J., Valdes, C. A., Briggs, E. M., Polikarpus, K. K., Kupe, J., and Symons, W. T.: Ammonia gas sensors, U.S. Patent 7 (074) (2006) 319, 2006.
World Health Organization (WHO): Fact Sheet, Ambient (outdoor) air pollution, World Health Organization, https://www.who.int/news-room/fact-sheets/detail/ambient-(outdoor)-air-quality-and-health, last access: 11 June 2022.