the Creative Commons Attribution 4.0 License.
the Creative Commons Attribution 4.0 License.
 | 12 Jul 2024
Rapid characterisation of mixtures of hydrogen and natural gas by means of ultrasonic time-delay estimation
Jorge M. Monsalve
Uwe Völz
Marcel Jongmanns
Björn Betz
Sergiu Langa
Christine Ruffert
Jörg Amelung
Marcus Wiersig
The implementation of the “power-to-gas” concept, where hydrogen and natural gas are blended and transported in the existing network, requires a quick, on-site method to monitor the content of hydrogen in the mixture. We evaluate a rapid characterisation of this mixture based on the measurement of the speed of sound, using micromachined ultrasonic transducers (MUTs). Two MUT-based prototypes were implemented to analyse a mixture of natural gas and hydrogen under controlled conditions. Changes in the hydrogen content below 2 mol % (in a mixture that was adjusted between 6 mol % and 16 mol %) were discriminated by both devices, including the uncertainty due to the temperature compensation and the time-delay estimation. The obtained values of the speed of sound were consistent with those calculated from independent, non-acoustic measurements performed with a gas chromatograph and a density sensor. An MUT-based flow meter is thus capable of reporting both gas intake and the molar fraction of hydrogen, provided that the source of natural gas is kept constant.
- Article
(1046 KB) - Full-text XML
- BibTeX
- EndNote


The production of hydrogen from electrolysis and its introduction into the existing pipelines as a blend with natural gas (NG) offers an interesting possibility for coupling the electrical and the gas grid – a concept termed “power-to-gas” (Melaina et al., 2013; Liu et al., 2017). In such a case, monitoring the hydrogen content in the mixture at different stages of the distribution network becomes necessary because of billing purposes and safety concerns; its price for the end-user should be adjusted, given that hydrogen reduces the calorific value per unit volume, and the failure of different components of the gas infrastructure (e.g. pipes, compressors, turbines) becomes a risk if a certain concentration threshold is passed, which may range from 5 mol % to 20 mol % (Müller-Syring and Henel, 2014; Melaina et al., 2013; Slim et al., 2006). Although the composition of such mixtures can be accurately measured in process gas chromatographs (PGCs), a fast, on-site, and low-cost method – even if less accurate – would offer a significant advantage for monitoring hydrogen in households and factories. Resolving concentration differences of 1 mol % is a desirable quality for such a system, given an order-of-magnitude estimation of the safety limit of 10 mol %. This could be achieved by measuring a physical variable that varies significantly with the addition of hydrogen, such as thermal conductivity, density, or speed of sound.
In this work, we explore the feasibility of performing a quick, on-site detection of composition changes in natural gas blends by a measurement of the speed of sound. We envision that a flow meter based on ultrasonic transducers could be used both to quantify the gas consumption and to estimate the hydrogen content, given that it requires no additional sensors to report the speed of sound. Assuming an operation in end-devices (e.g. in households), such that the differential pressure is in the range of tens of millibars, an ideal gas behaviour can be safely assumed, and the relationship between the speed of sound and composition can be obtained by Laplace's equation (Eq. 1a). The speed of sound (c) of the mixture depends on three variables: the molar isobaric specific heat (Cp), the molar isochoric specific heat (Cv), and the molar mass (M). These properties are in turn given by a linear combination of the molar fractions (xi) of each component in the mixture, as shown in Eqs. (1b)–(1d) (Dixon and Greenwood, 1925). If the analysed mixture were binary (e.g. a hypothetical case of H2 in CH4), then the speed of sound would offer a direct measurement of the hydrogen content, provided that the temperature of the mixture is known. Vyas et al. (2006) demonstrate an application of this acoustic principle for characterising “binary mixtures”, such as hydrogen in air, helium in air, and CO2 in air – whereby air, being itself a mixture, is treated as a pure gas with certain effective properties. Likewise, natural gas is itself a mixture that, besides methane, also includes ethane, propane, nitrogen, and other gases (Cerbe and Lendt, 2017). Depending on the geographical source and the extraction method, the content of CH4 in natural gas can vary from 98 vol % to around 80 vol % (Cerbe and Lendt, 2017). If, however, the source of the natural gas is kept constant, its composition varies only very slightly, and the concentration of hydrogen can be calibrated with a series of measurements of the speed of sound (or with the knowledge of the composition of the respective sort of natural gas). This is due to the linear character of Eqs. (1b)–(1d), which enables grouping all the components pertaining to natural gas with an effective value of MNG, Cp,NG, and Cv,NG. This simplification is only possible in the ideal gas regime, where particle–particle interactions are neglected. For high pressures, roughly above 10 bar (Cézar de Almeida et al., 2014), Eqs. (1a)–(1d) would need to be adjusted, and new terms for every pairwise interaction between molecules in the mixture would need to be considered (Trusler, 1991).
Other on-site sensing methods for blends of hydrogen and natural gas reported in the literature include the platinum-based sensor of Blokland et al. (2021) and the infrared spectroscopy approach of Bolwien (2022). The platinum-based sensor alters an electric capacitance based on the adsorption of hydrogen and was proven to measure concentrations from 0.1 vol % to 30 vol %, regardless of the carrier gas, without hysteresis, and in real time. The calibration of its capacitance curve requires a series of measurements under different temperatures and hydrogen partial pressures to obtain a set of five constants that are susceptible to the readout frequency of the circuitry. An acoustic measurement, instead, is not dependent on the properties of the sensors, is not limited to a concentration of 30 vol %, and requires only the calibration of the sound path. The spectroscopy analysis reported by Bolwien (2022) makes a robust detection of the main components in natural gas and measures the amount of hydrogen based on a thermal conductivity measurement. This approach is not limited to ideal gases and is therefore very suitable for pipelines and applications where the composition of natural gas varies. An acoustic measurement offers a simpler, low-cost alternative for low pressures and it also reports the flow velocity without additional sensors. Among the variety of available ultrasonic transducers (UTs), the use of micromachined ones (MUTs) is of particular interest, given that they are of a smaller size than their classical “bulk” piezoelectric counterparts. We have previously developed and tested two kinds of electrostatic, air-coupled MUTs for purposes other than gas analysis (Koch et al., 2021; Monsalve et al., 2022); therefore, it is our aim in this study to evaluate whether these devices can be used to detect changes near 1 mol % in the molar fraction of hydrogen in an actual blend with natural gas.
2.1 Measurement of the speed of sound
We have constructed two prototypes to measure the speed of sound via the estimation of the travelling time of ultrasound waves in both flow directions (upstream and downstream). Based on both time delays (t1, t2), the flow velocity (v) and the speed of sound (c) can be determined according to Eqs. (2) and (3), respectively, if the length of the sound path (L) is known (See Fig. 1). These well-known expressions follow from a system of two equations and two unknowns for the transit times of the upstream and downstream directions (Köchner et al., 1996). The sound path can be calibrated for a gas whose thermodynamic properties can be retrieved from the literature. The measurement time of such a system is only limited by the sound path – with a speed of sound near 400 m s−1, a measurement may last 1 ms (40 cm path) down to tens of microseconds (4 mm path).
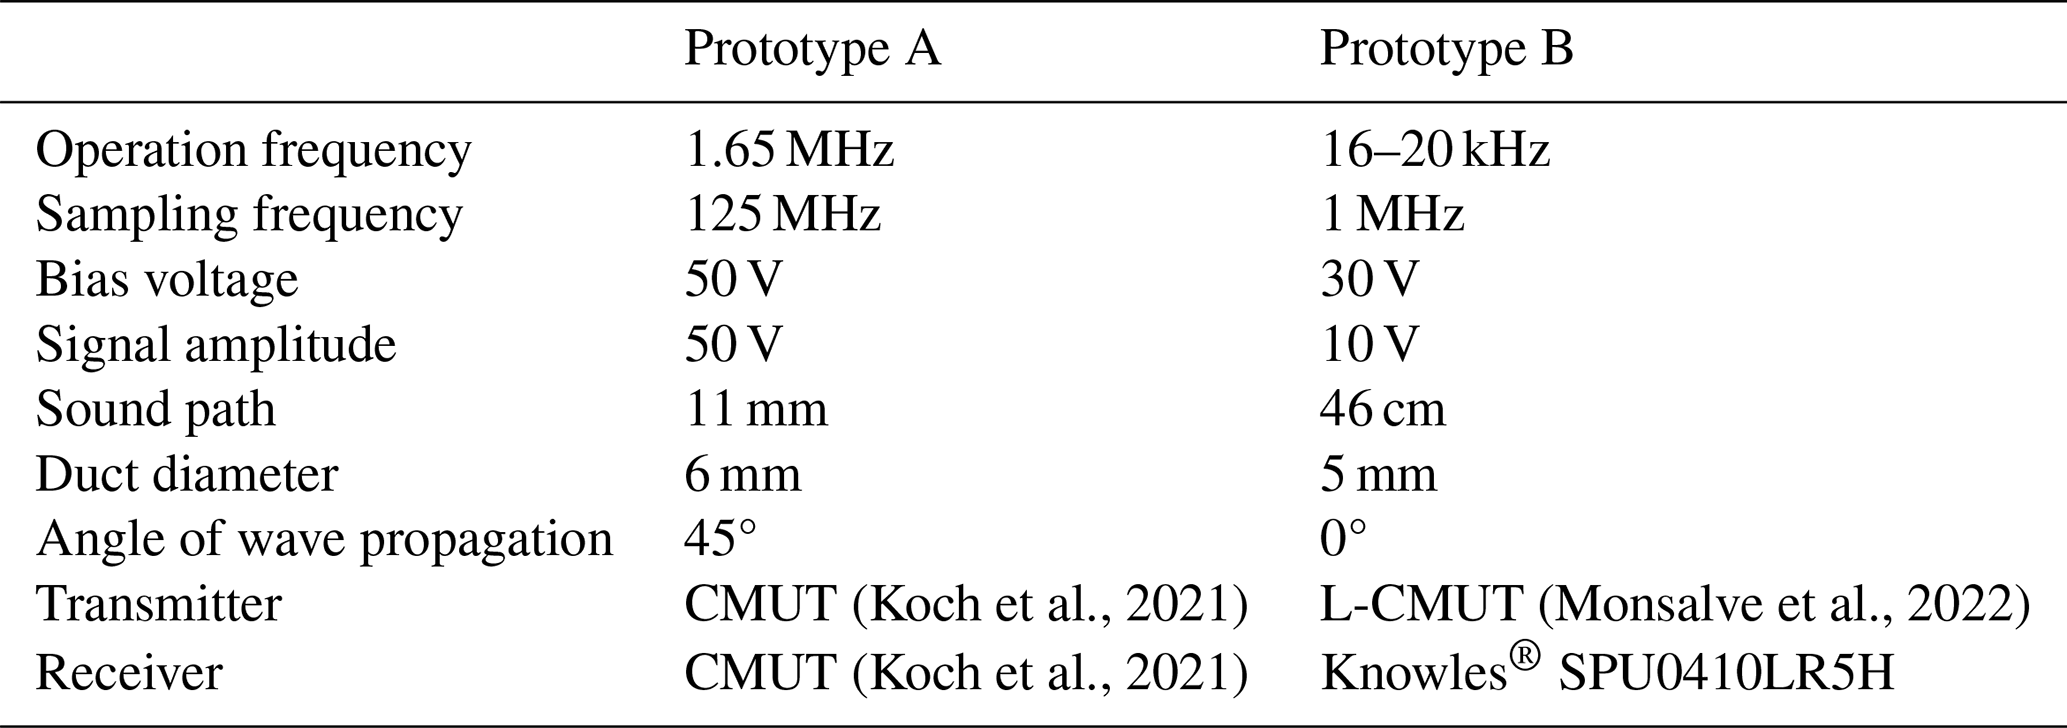
The geometrical arrangement of the transducers in each prototype varies considerably, given that they operate in very different frequency regimes. The first prototype, “A”, is based on capacitive MUTs (CMUTs) operating at 1.65 MHz (Koch et al., 2021). The high operation frequency enables a very fine resolution in the measurement of time delays. Given the high absorption coefficient that is expected at these frequencies, the sound path needs to be kept around the centimetre range. Even at such close distances, the correspondingly small wavelength (sub-millimetre range) indicates that waves within the duct (6 mm diameter) are propagated as in an open space. The pitch–catch measurement in this prototype is performed in the classical diagonal arrangement illustrated in Fig. 1a, and the time delay is calculated by the phase shift between the sent and received signal. The second prototype, “B”, is based on “in-plane” or “lateral” CMUTs (L-CMUTs), whose natural frequency is close to 54 kHz, and it can be operated in a wide frequency range because of the transducer's relatively high damping coefficient (Monsalve et al., 2022). At such a significantly lower frequency, one would expect a considerable loss in the achievable resolution; however, the correspondingly lower absorption coefficient enables a construction that uses a much longer sound path in order to increase the sensitivity of the time of flight to slight changes in the speed of sound. This was achieved by utilising the duct (5 mm diameter), not only as a means to transport the fluid but also as a waveguide (Fig. 1b). As long as the ratio between the diameter and wavelength is less than ∼ 0.586, waves are forced to propagate with a constant pressure profile, therefore excluding the possibility of reflections within the duct (Trusler, 1991). If an excitation at a higher frequency occurs, multiple propagation modes are activated, and the pressure signal becomes distorted. Taking this into account, a linear chirp signal sweeping between 16–20 kHz was chosen for the excitation of the transducers. The time delay is then calculated by the peak of the cross-correlation integral between the sent and received signals (Silvia, 1987). The main features of these prototypes are summarised in Table 1.
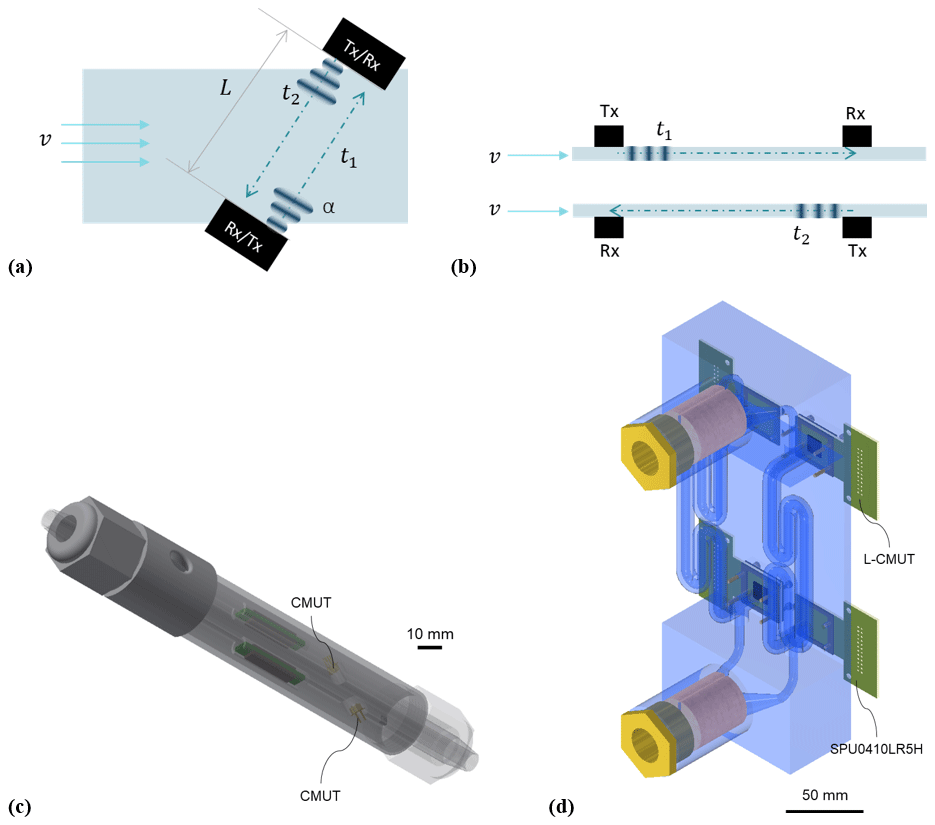
Figure 1(a) Scheme of the arrangement and (c) rendering of the assembled prototype A, based on CMUT. (b) Scheme of the arrangement and (d) rendering of the assembled prototype B, based on L-CMUT and a commercial MEMS microphone. The gas enters the corresponding duct with a velocity “v”, and the ultrasound pulses travel from the transmitter “Tx” to the receiver “Rx” through a sound path of length “L”, requiring a transit time of “t1” or “t2”.
Table 1Overview of the main features of the prototypes used for the measurement of the speed of sound.
2.2 Preparation of the gas mixture
The aforementioned prototypes were exposed to a series of mixtures of natural gas with hydrogen, following the scheme described in Fig. 2. The mixture was regulated by a mass flow controller (Brooks® 5851S), and a sample was extracted for analysis in a PGC (Thermo Scientific® TRACE 1310) each time that the hydrogen content was adjusted. The gas flow was monitored by a gas counter (Ritter® TG 5/1), regulating it to nearly 6 L min−1 during the whole measurement. The gas was directed then to the CMUT prototype and subsequently to the L-CMUT prototype to which a density sensor (TrueDyne® DGF-I1) was coupled at the inlet. This density sensor provides accurate pressure and temperature measurements required for the calculation of the molar mass of the mixture. Table 2 shows the composition of the natural gas mixture without hydrogen enrichment.
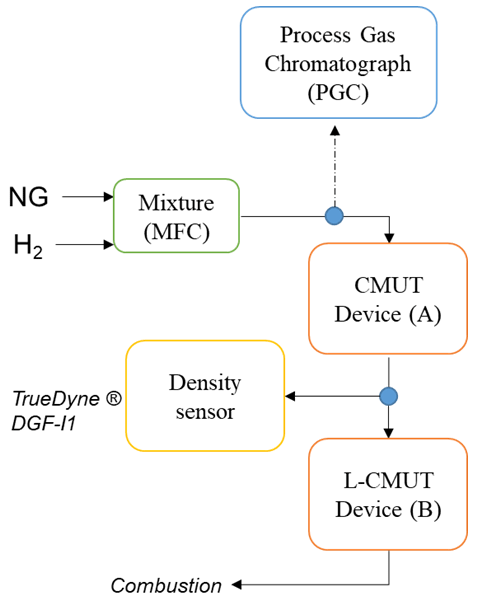
Figure 2Measurement set-up for the preparation of the mixture and its characterisation with a process gas chromatograph, the MUT-based prototypes, and a density sensor.
Table 2Measurement of the composition of the reference natural gas performed by a PGC.

The measurement of the molar mass of the characterised mixtures, shown in Fig. 3, exhibits a good agreement between the sample taken to the gas chromatograph and the on-site measurement of the density. As expected, the inclusion of hydrogen reduces the molar mass in an approximately linear fashion. A theoretical curve based on the composition of the reference natural gas sample (Table 2) was added as a reference. The composition measurements for these samples reveal that the molar fractions of the individual components did not diminish exactly in proportion to the added content of hydrogen, causing slight deviations from the theoretical curve. Although the reported values of density do yield different values for the analysed mixtures, the error bars due to the propagated uncertainty coming from the measurement of absolute pressure (±500 Pa) and temperature (±0.06 °C) overlapped for consecutive measurements. The concentration reported by the gas chromatograph is subject to the uncertainty in the readings of its thermal conductivity detector, which results in the horizontal error bars of the figure, as well as in a propagated uncertainty in the molar mass.
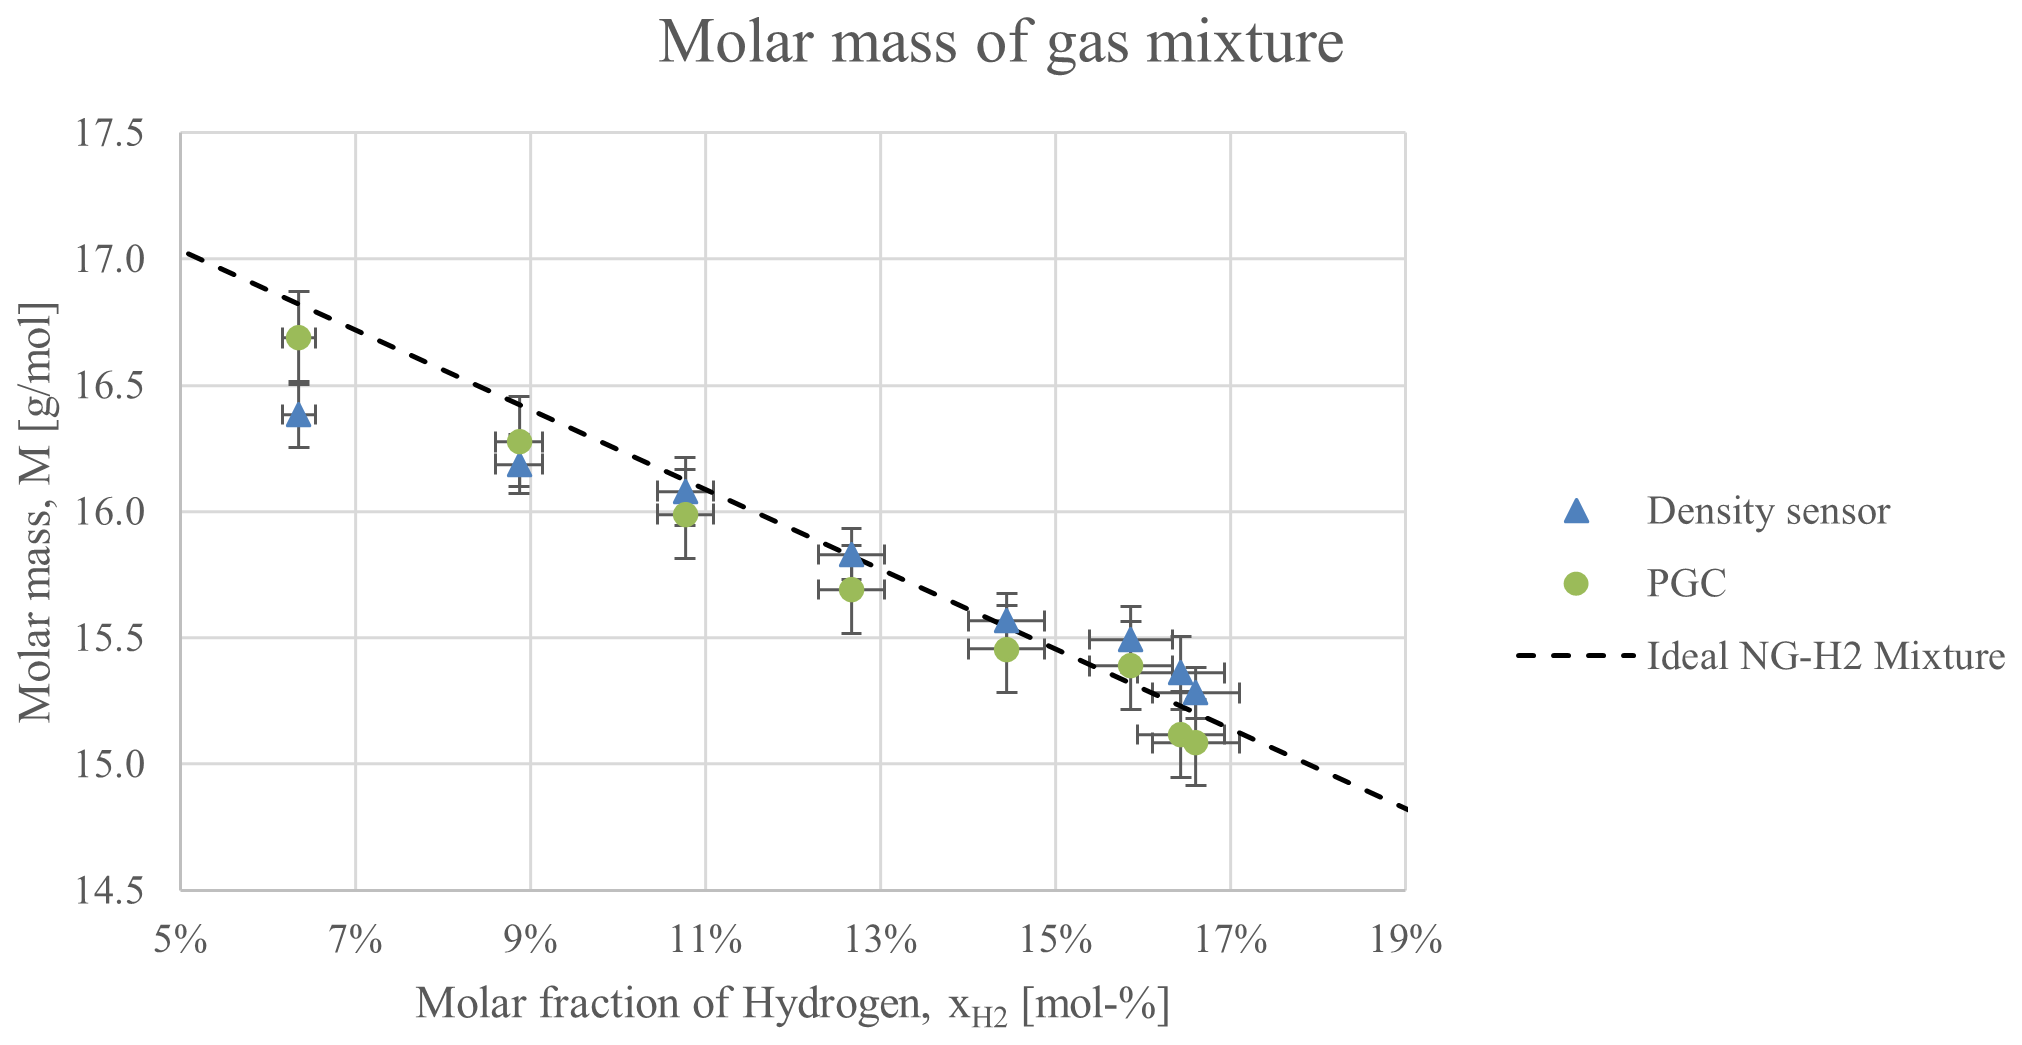
Figure 3Calculation of the molar mass of the mixtures of hydrogen and natural gas reported by the gas chromatograph and the density sensor. A calculation based on the composition of the natural gas sample in Table 2 is provided as a reference.
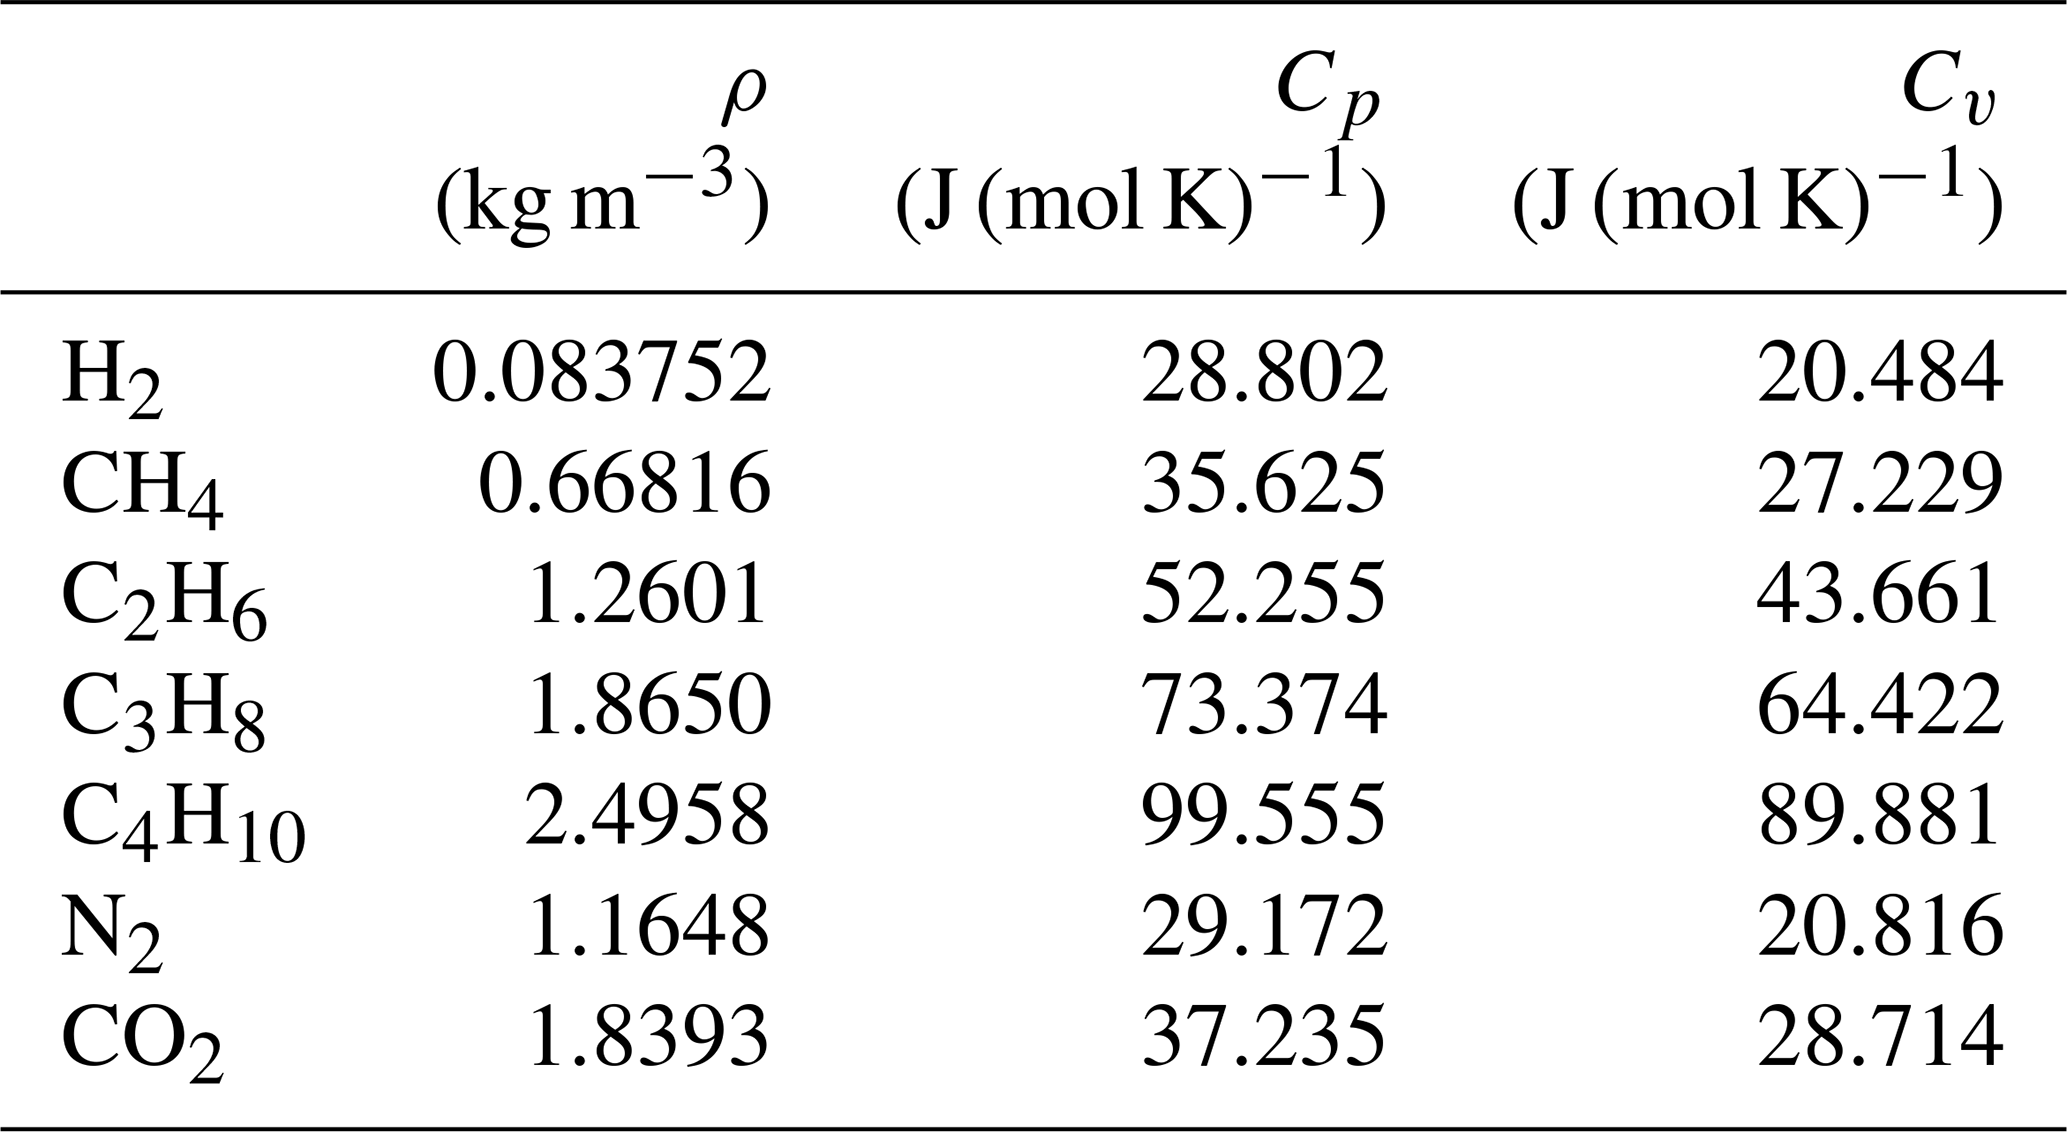
The previous results can be used to calculate the expected speed of sound based on Eq. (1a). The molar fractions of each component, as reported by the gas chromatograph, enable us to determine not only the molar mass of the mixture but also its specific heats (isochoric and isobaric) and, with them, the adiabatic constant (γ). This requires the knowledge of the thermodynamic properties of each component in the mixture, which can be consulted from the literature (Lemmon et al., 2023). These properties are listed in Table 3. The calculation of the speed of sound based on the gas chromatograph, then, is based on the obtained adiabatic constant and molar mass. In the case of the density sensor, it suffices to take the adiabatic constant, since it measures the pressure and density directly. The sample with the lowest hydrogen content (6 %) was used to calibrate the sound path – L in Eq. (3) – for the MUT-based prototypes, taking the calculated speed of sound from the composition report of the gas chromatograph; hence, no difference in the speed of sound, as reported by the MUT prototypes and by the gas chromatograph, is expected for this first data point.
Table 3Thermodynamic properties of the main components in the gas mixture obtained from Lemmon et al. (2023) for a temperature of 293.15 K and a pressure of 101.3 kPa.
The values of the speed of sound, as measured with both the acoustic and non-acoustic measurements, are presented in Fig. 4. All results were compensated to 20 °C, based on the measured temperature (which varied between 19 and 22 °C). Despite operating at different frequencies, under different sound propagation conditions, and with different numerical procedures to determine the time delay, the results from both MUT-based prototypes are consistent, save for one measurement where the error bars do not overlap. The error in the acoustic measurements is given by a combination of the statistic fluctuation in the time-delay estimation (10 measurements at least) and the propagated error from the temperature compensation. All changes in concentration (most of which were below 2 %) were discriminated by the transducers with non-overlapping uncertainties. These results are also in agreement with the non-acoustic measurements. Hence, the measurement of the speed of sound is sensitive enough to detect the changes in the composition of the mixture.
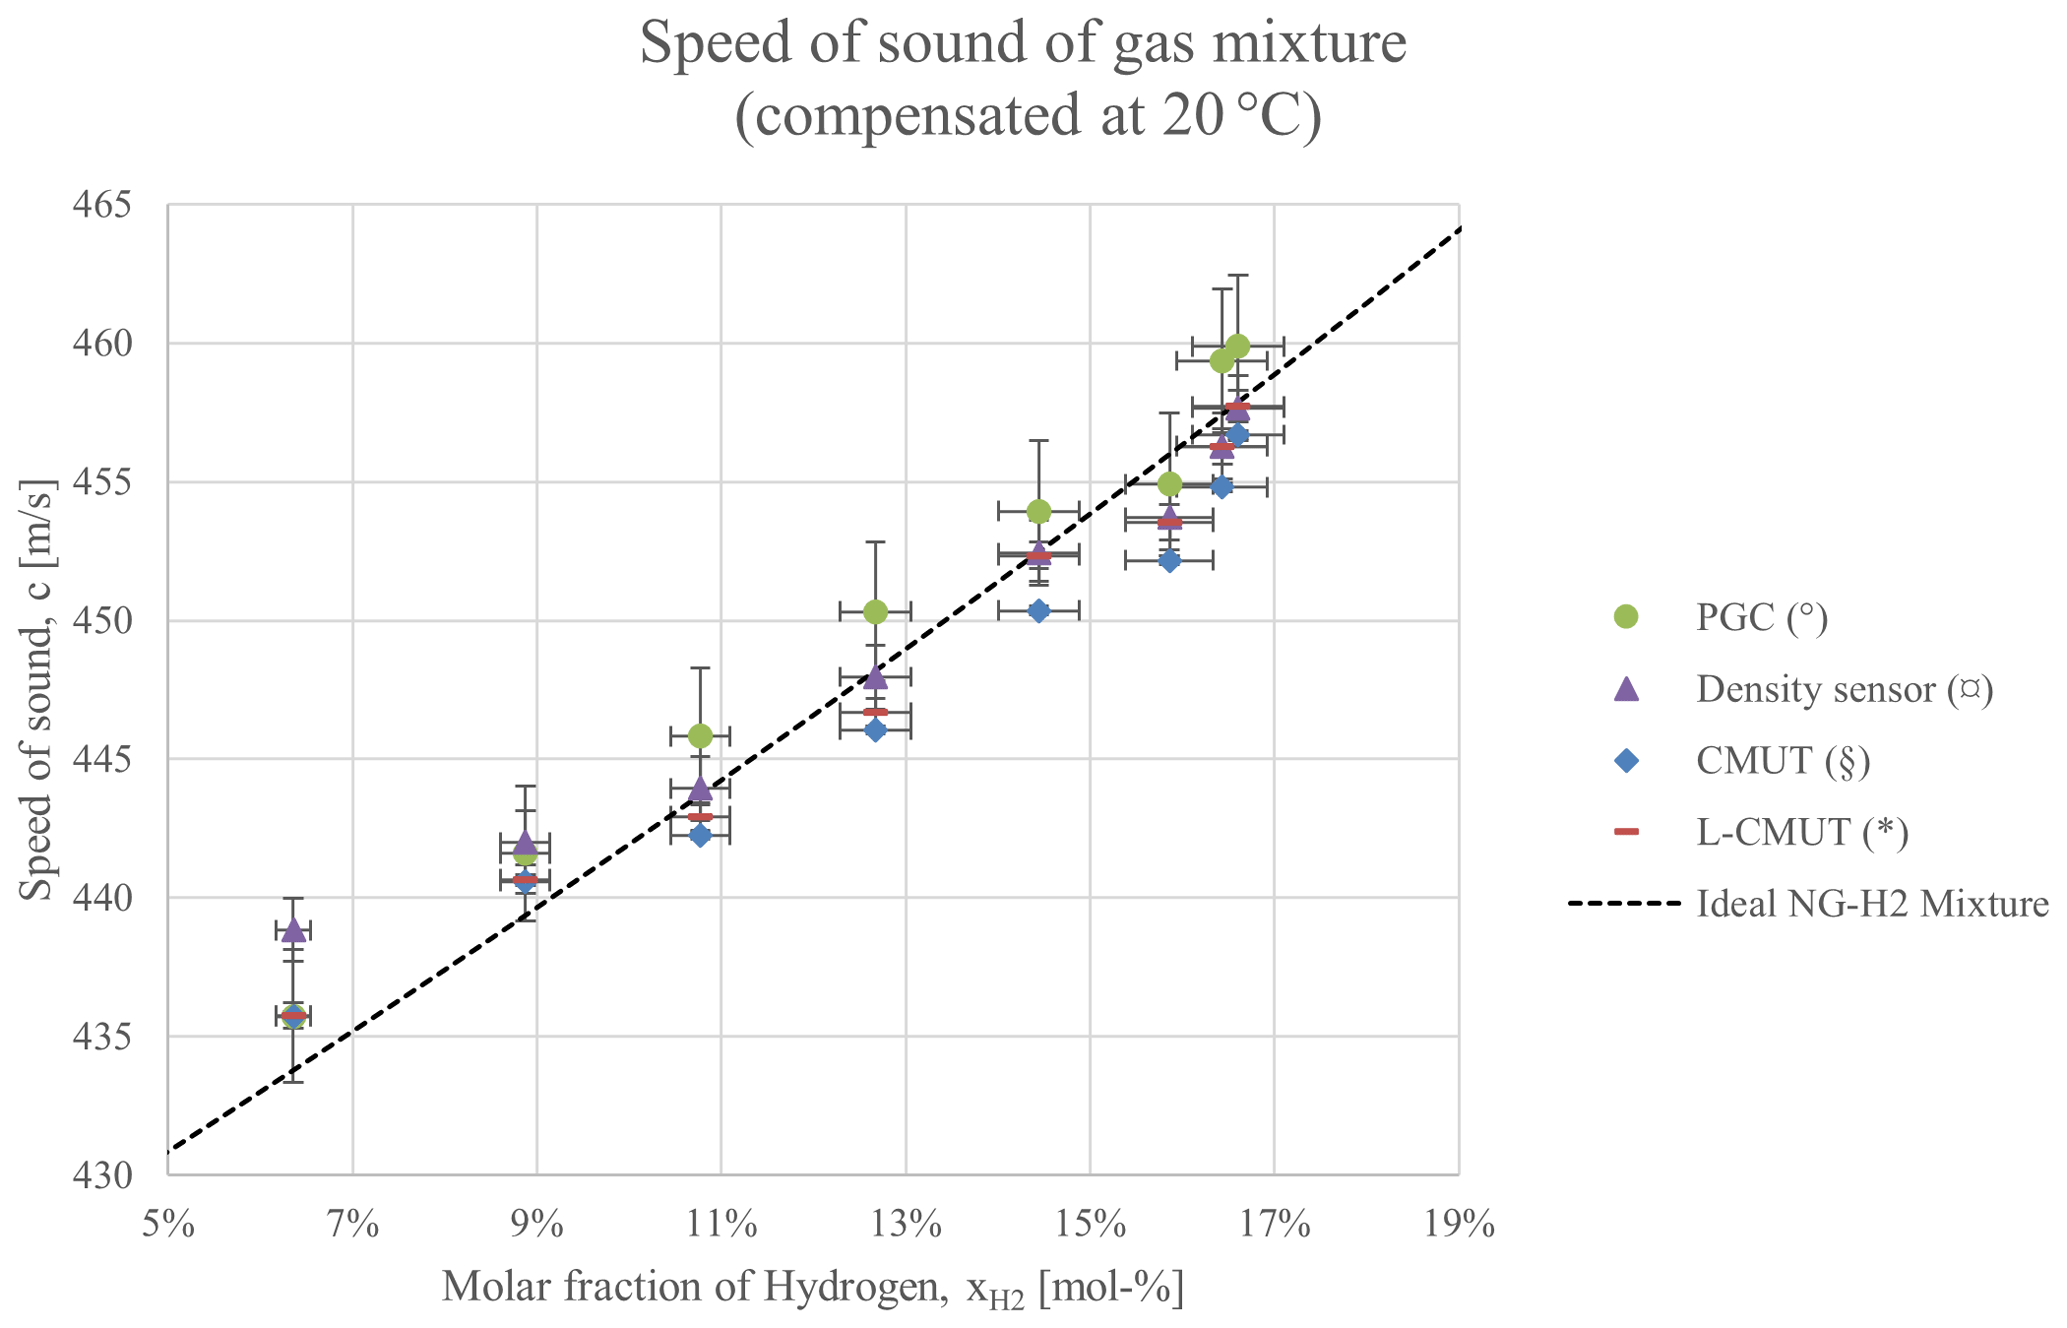
Figure 4Values of the speed of sound based on the measurements of the gas chromatograph and density sensor, as well as the direct measurement performed by the two MUT-based prototypes. A theoretical calculation based on the composition of the natural gas sample in Table 2 is provided as a reference.
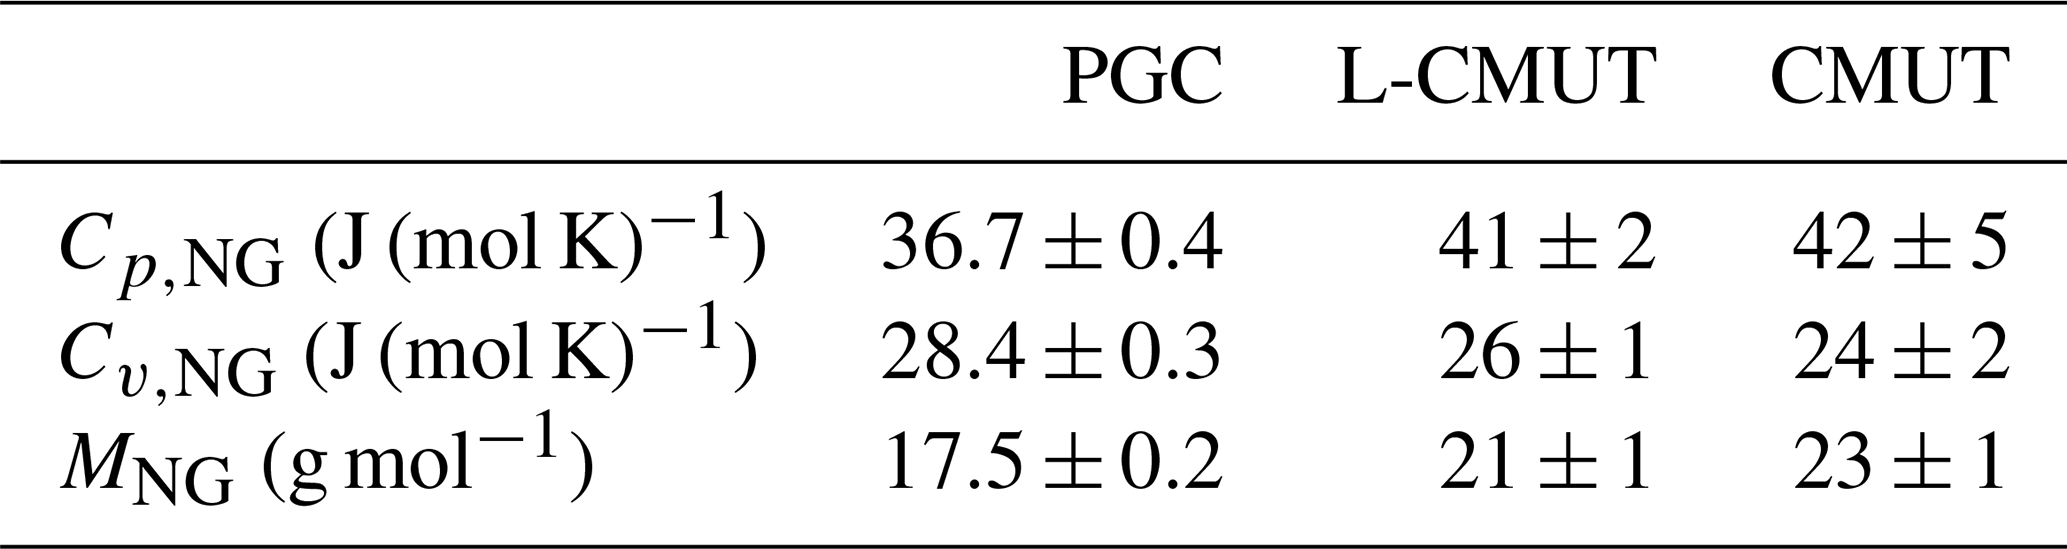
The measured values of the speed of sound at the given compositions were used to estimate the thermodynamic properties of the natural gas sample (MNG, Cp,NG, and Cv,NG) with a least squares regression based on Eqs. (1a)–(1d); the results are presented in Table 4. These values differ from the calculation following from the composition report of the PGC and the standard tabulated values (Table 3), but they are consistent for both MUT prototypes. The calculation of these three variables from a least squares regression is very sensitive to uncertainties in the data points from which the uncertainty in the concentration axis played an important role. Note, however, that the purpose of these prototypes is not the determination of the thermodynamic properties but the identification of concentration changes, which are the variable of interest in the targeted application.
Table 4Estimated thermodynamic properties of the natural gas sample according to the composition measurement (PGC) and according to a least squares regression of the speed of sound measurement with both prototypes.
The characterisation of the gas mixture with two physical variables, density, and speed of sound, begs the question as to which one could be more effective or if they could be combined. Under the present conditions, where the source of natural gas was kept constant, any of these variables could be used to detect the molar fraction of hydrogen. The measurement of density would be, at first glace, more appealing due to its linearity. The measurements reveal, nonetheless, that the error bars in the density measurement of consecutive values of hydrogen concentration oftentimes overlapped, whereas this was not the case in the measurement of the speed of sound. Among other reasons, this was related to the compensation of both the temperature and pressure that the density measurement requires, which increases the experimental uncertainty, whereas the estimation based on the speed of sound requires only a temperature compensation. Under different conditions, where small fluctuations on the composition of natural gas are expected to occur, it may become interesting to combine both measurements, not as a means of redundancy but as a strategy to compensate such fluctuations, taking into account that the variation in the adiabatic coefficient (though moderate) would make these two variables independent from each another. This implies that a system of two equations and two unknowns could be formulated to detect a further variable.
Changes in the concentration of a mixture of hydrogen and natural gas in the range between 6 mol %–16 mol % were detected by means of time-of-flight measurements with two kinds of micromachined ultrasonic transducers, CMUT and L-CMUT, using two alternative approaches for the emission of sound, resolving differences below 2 mol % (and near 1 mol % in the upper measurement range) with a potentially higher accuracy due to the low uncertainty in the time-delay estimation. The calculated speed of sound of the mixture is consistent with non-acoustic measurements performed with a gas chromatograph and a density sensor. An on-site measurement of either the density or of the speed of sound can provide a quick and reliable characterisation of a hydrogen-enriched blend of natural gas, as long as the composition of the latter remains constant; nonetheless, a lower experimental uncertainty was achieved with the ultrasonic transducers than with the density sensor because in the former case only the temperature needs to be compensated. For sections of the pipeline network where the geographical source of natural gas is kept constant, a gas counter based on MUTs can provide the end-user with accurate information about both volume flow and hydrogen concentration.
The raw data and code are the property of the Fraunhofer Society. They can be made available to enquirers upon request.
JMM designed the L-CMUT-based prototype and its signal-processing technique. UV was responsible for the electronics design and the software development of the CMUT-based prototype. MJ developed the readout circuitry for the L-CMUT-based prototype and its control interface. BB led this research project. SL coordinated the fabrication of the novel L-CMUT chips. CR performed research on the needs of the energy market. JA investigated the needs of the market and provided guidance on the development of the L-CMUT prototype. MW designed the experiment at the facilities of DBI Gas- und Umwellttechnik.
The contact author has declared that none of the authors has any competing interests.
Publisher’s note: Copernicus Publications remains neutral with regard to jurisdictional claims made in the text, published maps, institutional affiliations, or any other geographical representation in this paper. While Copernicus Publications makes every effort to include appropriate place names, the final responsibility lies with the authors.
This article is part of the special issue “Sensors and Measurement Science International SMSI 2023”. It is a result of the 2023 Sensor and Measurement Science International (SMSI) Conference, Nuremberg, Germany, 8–11 May 2023.
This research has been supported by the Fraunhofer Internal Programmes (grant no. SME 685 400).
This paper was edited by Marco Jose da Silva and reviewed by four anonymous referees.
Blokland, H., Sweelssen, J., Isaac, T., and Boersma, A.: Detecting hydrogen concentrations during admixing hydrogen in natural gas grids, Int. J. Hydrogen Energ., 46, 32318–32330, https://doi.org/10.1016/j.ijhydene.2021.06.221, 2021.
Bolwien, C.: Quantifying gas mixtures – Hydrogen and gaseous fuels, Fraunhofer Institute for Physical Measurement Techniques IPM, https://www.ipm.fraunhofer.de/content/dam/ipm/en/PDFs/product-information/GP/SPA/Quantifying-gas-mixtures-IR-spectroscopy.pdf (last access: 11 July 2024), 2022.
Cerbe, G. and Lendt, B.: Grundlagen der Gastechnik, 8th edn., Carl Hanser Verlag GmbH & Co. KG, ISBN 978-3-446-44965-7, 2017.
Cézar de Almeida, J., Velásquez, J. A., and Barbieri, R.: A Methodology for Calculating the Natural Gas Compressibility Factor for a Distribution Network, Pet. Sci. Technol., 32, 2616–2624, https://doi.org/10.1080/10916466.2012.755194, 2014.
Dixon, H. and Greenwood, G.: On the velocity of sound in mixtures of gases, Proc. R. Soc. A, 109, 561–569, https://doi.org/10.1098/rspa.1925.0145, 1925.
Koch, S., Völz, U., Lange, N., Köble, S., Schubert, F., Richter, C., Poongodan, P. K., Vanselow, F., and Urbahn, C.: Empowering robots for multimodal tactile gripping using Capacitive Micromachined Ultrasonic Transducers, 2021 Smart Systems Integration (SSI), 27–29 April 2021, Grenoble, France, IEEE, 20758128, https://doi.org/10.1109/SSI52265.2021.9467023, 2021.
Köchner, H., Meling, A., and Baumgärtner, M.: Optical flow field investigations for design improvements of an ultrasonic gas meter, Flow Meas. Instrum., 7, 133–140, https://doi.org/10.1016/S0955-5986(96)00019-2, 1996.
Lemmon, E. W., Bell, I. H., Huber, M. L., and McLinden, M. O.: Thermophysical properties of fluid systems, in: NIST Chemistry WebBook, NIST Standard Reference Database Number 69, edited by: Linstrom, P. J. and Mallard, W. G., National Institute of Standards and Technology, Gaithersburg MD, 20899, https://doi.org/10.18434/T4D303, 2023.
Liu, W., Wen, F., and Xue, Y.: Power-to-gas technology in energy systems: current status and prospects of potential operation strategies, J. Mod. Power Syst. Clean Energy, 5, 439–450, https://doi.org/10.1007/s40565-017-0285-0, 2017.
Melaina, M. W., Antonia, O., and Penev, M.: Blending hydrogen into natural gas pipeline networks: a review of key issues, NREL, NREL/TP-5600-51995, https://www.nrel.gov/docs/fy13osti/51995.pdf (last access: 11 July 2024), 2013.
Monsalve, J. M., Melnikov, A., Stolz, M., Mrosk, A., Jongmanns, M., Wall, F., Langa, S., Marica-Bercu, I., Brändel, T., Kircher, M., Kaiser, B., and Schenk, H.: Proof of concept of an air-coupled electrostatic ultrasonic transducer based on lateral motion, Sensor. Actuat. A-Phys., 345, 113813, https://doi.org/10.1016/j.sna.2022.113813, 2022.
Müller-Syring, G. and Henel, M.: Wasserstofftoleranz der Erdgasinfrastruktur inklusive aller assoziierten Anlagen, DVGW Forschung, G 1-0212, https://www.dvgw.de/medien/dvgw/forschung/berichte/g1_02_12.pdf (last access: 11 July 2024), 2014.
Silvia, M. T.: Time delay estimation, in: Handbook of digital signal processing, edited by: Eliott, D. F., Academic Press, Inc., 789–855, ISBN 0122370759, 1987.
Slim, B. K., Darmeveil, H., van Dijk, G. H. J., Last, D., Pieters, G. T., and Rotnik, M. H.: Should we add hydrogen to the natural gas grid to reduce CO2-emissions? (consequences for gas utilisation equipment), 23rd World Gas Conference, 5–9 June 2006, Amsterdam, the Netherlands, International Gas Union, http://members.igu.org/html/wgc2006/pdf/paper/add11558.pdf (last access: 11 July 2024), 2006.
Trusler, J. P. M.: Physical acoustics and metrology of fluids, Adam Hilger, ISBN 0-7503.0113-9, 1991.
Vyas, J. C., Katti, V. R., Gupta, S. K., and Yakhmi, J. V.: A non-invasive ultrasonic gas sensor for binary gas mixtures, Sensor. Actuat.-B Chem., 115, 28–32, https://doi.org/10.1016/j.snb.2005.08.016, 2006.