the Creative Commons Attribution 4.0 License.
the Creative Commons Attribution 4.0 License.
 | 29 Jul 2024
An airborne measurement system to detect, locate, and quantify methane emissions with attitude-based wind speed estimation
Lars Kistner
Robert Schmoll
Andreas Kroll
An airborne measurement system with an onboard computer for data processing and recording that does not require constant radio communication for inspection and maintenance is presented. It detects, locates, and quantifies methane leaks using a gimbal-mounted tunable diode laser absorption spectroscopy (TDLAS) sensor. A polynomial regression model that correlates wind speed with drone attitude is presented and compared to measurements made with a 3D anemometer at varying wind speeds. The quantification of methane emissions was evaluated with the system, both in a laboratory setup and at an open-area test site.
- Article
(4213 KB) - Full-text XML
- BibTeX
- EndNote


Reducing methane (CH4) emissions is important for environmental protection (Bastviken et al., 2022) and operational safety in the energy sector, as gas mixtures containing methane are potentially explosive. Methane is one of the main components of both natural gas and biogas. Regular inspections of gas-related facilities and infrastructure are therefore necessary, and more frequent inspections would serve both safety and environmental protection.
While Earth observation satellites attempt to detect emissions at the facility level with emission rates in the range of several kilograms to tons per hour (Cusworth et al., 2021), uncrewed aerial systems (UASs) can detect leaks at the component level at much lower rates, such as 43 g h−1 in our case, and provide maintenance personnel with a more comprehensive view of leaks than regular ground-based inspections.
Several UASs with in situ sensors were developed (Shaw et al., 2021) and successfully tested to determine the concentrations of methane in exhaust air shafts of highway tunnels (Chang et al., 2016) and the methane masses released from sludge deposits of sewage treatment plants (Gålfalk et al., 2021) to find leaks in underground gas pipelines (Iwaszenko et al., 2021) or to quantify artificial leaks (Shah et al., 2020).
Commercially available tunable diode laser absorption spectroscopy (TDLAS) sensors can remotely sense methane and measure the integral methane concentration in parts per million meter (ppmm). Typically, manufacturers quote measurement distances of 30 to 50 m. However, this is highly dependent on the backscattering surface. These values apply to typical surfaces like wood, paint, or concrete. Larger distances are possible for more reflective surfaces. These sensors were successfully tested with mobile robots (Barz et al., 2012; Bennetts et al., 2014). When lighter sensors became available, they were used with UASs to measure methane concentrations in landfills (Frish et al., 2013; Emran et al., 2017) and the distribution of methane on Arctic permafrost cliffs (Oberle et al., 2019). Most UASs use a fixed or downward-facing TDLAS sensor. Neumann et al. (2017) were the first to use a three-axis gimbal to aim for methane-filled cubes and perform concentration measurements for different distances and backscattering surfaces. In Neumann et al. (2019), the same system was used to reconstruct the gas distribution of released methane plumes.
Based on the experience with a ground-based portable system for detection and quantification (Dierks and Kroll, 2021) and a mobile robot system for localization of methane leaks (Baetz et al., 2009; Bonow and Kroll, 2013), a UAS was developed. The main contribution of this paper is a system that is capable of remotely detecting, localizing, and quantifying methane leaks. The TDLAS uses a gimbal. This allows multiple measurement positions for the same inspection area. The position can be optimized so that rotor downwash does not affect the measurements and good backscattering surfaces are available. In this work, a scanning TDLAS on a UAS is used for the first time to find the release location and to quantify the methane flow. The quantification is done once with the wind speed measured near the leakage and once with the wind speed estimated by the drone based on its attitude.
The airborne inspection system consists of a measurement module, an onboard computer (DJI Manifold 2-C), a support box, and a quadcopter drone (DJI M300) (see Fig. 1). The measurement module consists of a TDLAS sensor (ici TDLAS), two visual cameras (iDS UI-1007XS-C and UI-3590LE-C-HQ Rev.2), and a laser rangefinder (LightWare LiDAR LW20), all mounted on a gimbal (HD Air Studio Infinity MR PRO). The support box safely houses a USB hub, a wireless local-area network (LAN) adapter, a USB-to-serial adapter, and the power distribution system. The TDLAS sensor has a measuring range of 0–40 000 ppmm for distances up to 50 m. The eye-safe laser operates at a wavelength of 1.65 µm.
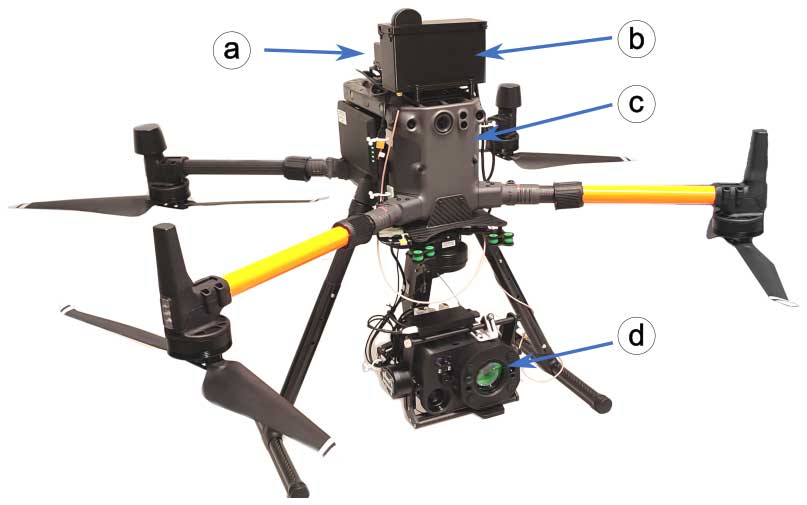
Figure 1Measurement system with (a) an onboard computer, (b) a support box, (c) a quadcopter drone, and (d) a measurement module.
The drone's onboard PC and the ground station laptop both use the Robot Operating System (ROS). The ROS is an established software framework for robotic applications organized into microservices. The onboard PC and the laptop are connected via a wireless local-area network (WLAN). All the data are simultaneously available in real time at a ground station, but only requested data are transmitted. All sensor and actuator inputs are also recorded on the computer processing the data. Because of the data-processing and data-recording capabilities of the UAS, there is no need for constant radio communication during a mission. If communication is lost during a mission, all the measurements in the visualization are updated as soon as communication is restored.

Figure 2Visualization on the ground station laptop showing the (a) overview camera and (b) detail camera feed, (c) 3D viewport with (d) drone and gimbal poses, (e) methane concentration point cloud and (f) grid, (g) custom visualization panel, and (h) custom function panel.
The drone allows measurements from different poses. In combination with the scanning gimbal, a complete inspection of complex structures is possible. The position information is determined by the drone's real-time kinematic (RTK) system, which uses a local differential global positioning system (DGPS) reference station or connects to a ground-based augmentation system (GBAS) via the Internet. The system locates each measurement point in a 3D coordinate system referenced to the GPS by knowing the drone's pose, gimbal orientation, and measured distance. All the measurements are visualized live in a 3D viewport (Fig. 2) and can be exported as a point cloud file with extended information (measurement point, methane concentration, drone pose, measured and estimated wind speeds, etc.) for postprocessing tasks such as emission rate quantification, documentation, and environmental reporting.
A sensor for measuring wind speed is not available on the UAS. Therefore, as suggested by Neumann et al. (2012), the wind speed is estimated from the attitude of the drone. This avoids the complicated installation of an anemometer, which would be subject to the effects of the drone's own turbulence. In Neumann et al. (2012), the training data for the relationship between airspeed vair and tilt angle ϕ were obtained in a wind tunnel. Due to the larger size of our drone, a different approach was taken. Our training data were generated by flying rectangular trajectories at different ground speeds vground. The airspeed vair was calculated from the ground speed of the drone vground determined by the RTK position and the wind speed vwind measured by a 3D ultrasonic anemometer placed in the middle of the flight path:
Only the data where the ground speed of the drone is close to its steady state were used as training data. Due to the distance between the anemometer and the drone, there are deviations between the true and calculated airspeeds, as can be seen in the widely scattered training data in Fig. 3. Another source of error is the difference between the flight altitude and the anemometer's measuring altitude of approximately 1.6 m. Due to the flat open-area test site and the low flight altitudes of 7 to 10 m, the effect is considered negligible. Due to the simple approach of the model, the effects of overfitting are expected to be minimal. Figure 3 shows the training data and the graph of the second-order polynomial function obtained by regression. The determined function is given by

Figure 3Relationship between airspeed and inclination angle ϕ for the observations used for training and for the fitted function.
This function was chosen because Neumann et al. (2012) and Wang et al. (2018) also used second-order polynomial approaches. First- and third-order polynomial functions were tested and gave similar results. The fitted function was validated on three data sets (see Fig. 4). Each of the validation data sets is 120 s long and covers a different range of wind speeds. The root mean squared error (RMSE) for validation data set A is 0.38 m s−1, for B it is 0.70 m s−1, and for C it is 0.82 m s−1. The distance between the anemometer and the drone was less than 15 m for all three validation data sets. A cross-correlation was performed, but no time-base shift was found that would better explain the data.
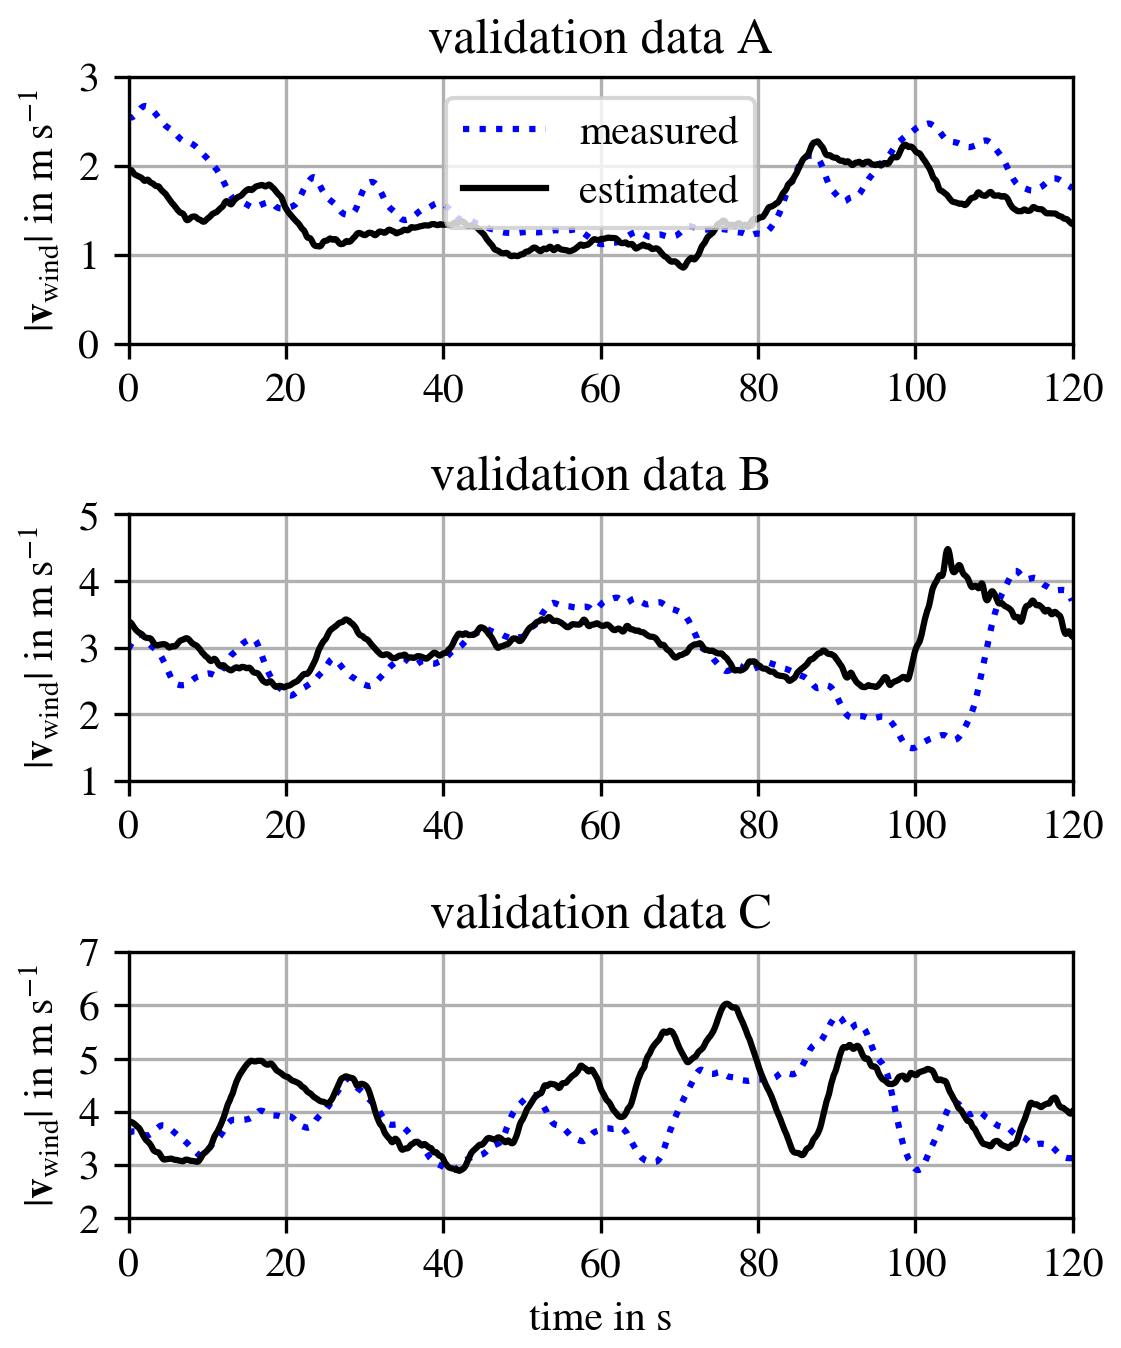
Figure 4Evaluation for three different validation data sets, each with a length of 120 s, for different ranges of wind speeds.
The amount of methane emitted can be estimated from the methane concentration, flow-through area, wind speed, gas pressure, and gas temperature (Dierks and Kroll, 2021). The average methane concentration is given by the formula
where Cppmm is the integral methane concentration measured by the TDLAS sensor (ppmm) and d is the measuring distance (m). The flow-through area of the measuring cone is given by
where α is the aperture angle of the laser (see Fig. 5). Under the assumption that the methane is moving at wind speed, the volume flow of the gas can be calculated with
where is the wind speed (m s−1). The amount of methane emitted is calculated as the volume flow of methane at standard temperature TN = 273.15 K = 0 °C and standard pressure pN = 101 325 Pa = 1.01325 bar:

Figure 5Relationship between the physical variables in the measurement model, where α is the laser's aperture angle, A is the flow-through area of the measuring cone, v is the wind speed, and d is the measuring distance.
Assuming that the methane has the same pressure and temperature as the surrounding air, the ambient temperature and pressure are used for TU and pU.
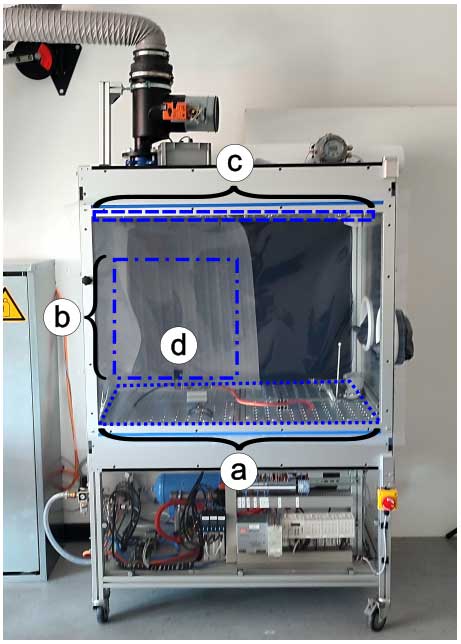
Figure 6Gas test bench for controlled release of methane with (a) an extraction air inlet, (b) a scanned area, (c) an extraction air outlet, and (d) a nozzle for mass-flow-controlled release of methane.
The measurement module was evaluated by using Eq. (7) to quantify an artificial mass-flow-controlled methane leak using the gas test bench shown in Fig. 6. The measuring distance was approximately 2 m. There is no wind effect on the gas test bench, but the methane will rise due to the lower density of methane compared to air, a constant flow of air through an exhaust system, and the initial flow speed out of the nozzle (see Fig. 6a, c). The speed of these effects is difficult to measure, so the parameter vwind was estimated to be 0.088 m s−1 for the data set with qv=1.65 Ln min−1 and then used for all the evaluations. In addition, images from an optical gas imaging camera were used to estimate the mean gas velocity using an approach proposed by Brox (Shen et al., 2023). The mean gas velocity was estimated to be 0.117 m s−1, with a minimum of 0.072 m s−1 and a maximum of 0.196 m s−1. Considering that the sensor was not calibrated for measurements below 1000 ppmm and that the true aperture angle is unknown, the estimated value seems reasonable. Figure 6b shows the scanned area, and Fig. 6d shows the nozzle releasing the mass-flow-controlled methane. Figure 7 shows the results for volume flows of Ln min−1. The point cloud of the measurements is shown on the left. In the middle of the figure, the histogram of quantifications by Eq. (7) is shown for each point from the point cloud. Under the assumption that measurements where the measurement spot captures all of the leaked methane provide the highest quantifications and best describe the amount of leaked methane, the 11 highest quantifications are shown in a box plot to express the estimated leak rate and its uncertainty. The box plot is shown on the right. Table 1 lists the mean and standard deviation of these 11 points. As can be seen, there is a correlation between the estimated volume flow of methane and the mass flow of methane released by the mass flow controller.
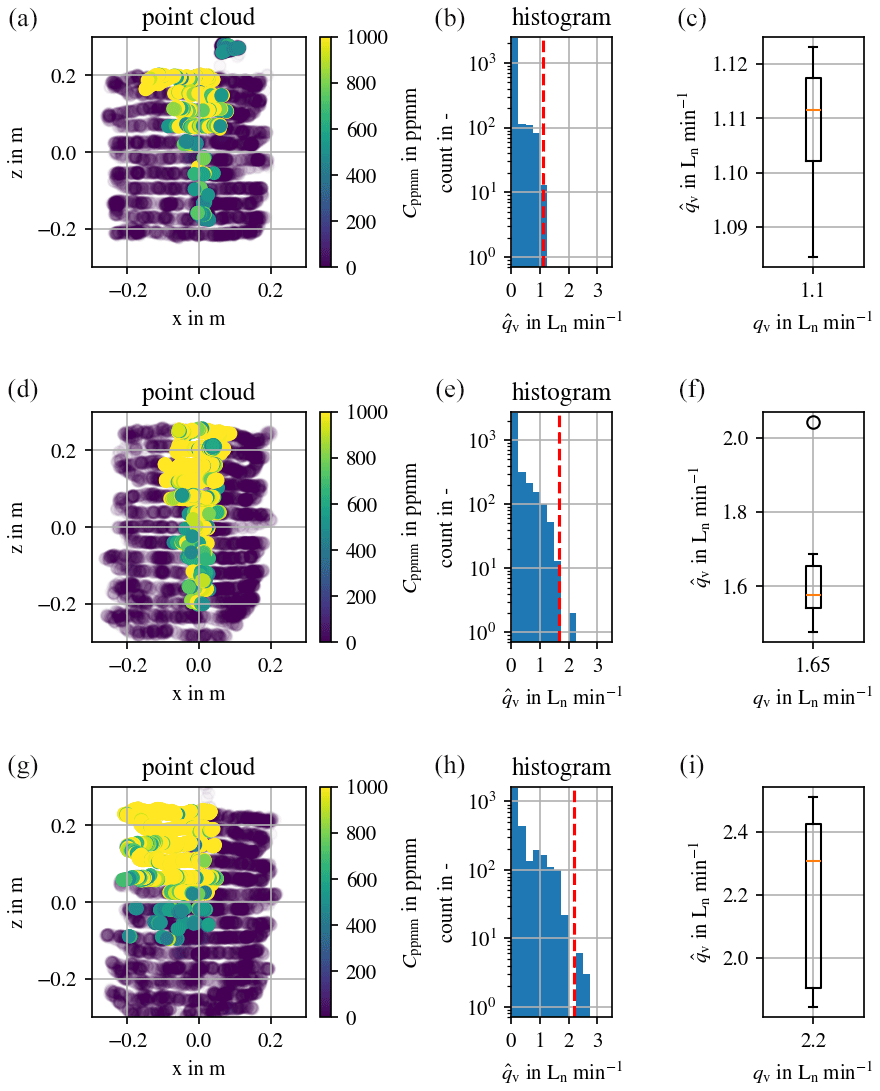
Figure 7Mass-flow-controlled release of methane in a gas test chamber with volume flow rates of qv=1.1 Ln min−1 (a–c), qv=1.65 Ln min−1 (d–f), and qv=2.2 Ln min−1 (g–i); (a, d, g) point clouds of the scan; (b, e, h) histograms of quantified points according to Eq. (7); and (c, f ,i) the box plots of the 11 points with the largest values.
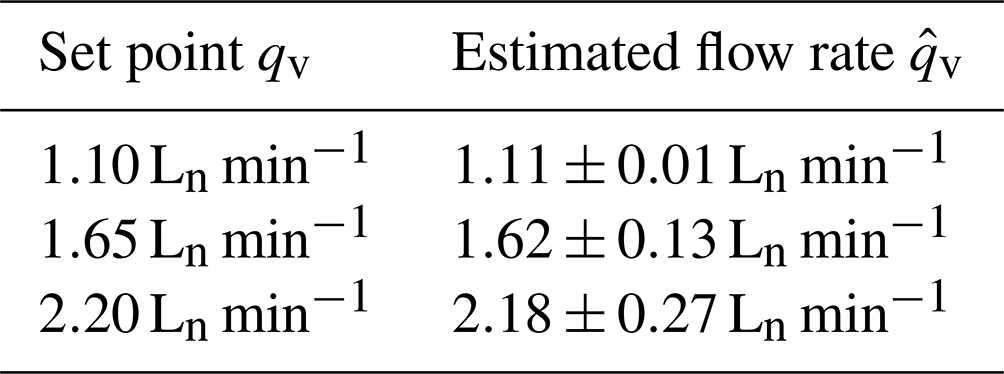
Table 1Estimated flow rate expressed by the mean and standard deviation based on the 11 largest estimates for the evaluated flow rates qv in the gas test bench experiments.
The UAS was evaluated in several field tests using methane-filled sample containers and artificial free-flow emissions. The tests were conducted under a variety of weather conditions. The results show that, at wind speeds of at least 4 m s−1, the drone can reliably maintain its position and take measurements. At a distance of 20 m, a sample container with a diameter of 0.2 m can be detected. At a scan distance of about 10 m, an area of 9.6 m2 min−1 can be scanned and can find methane leaks with an emission rate of 43 g h−1 (approximately 60 L h−1 at standard temperature TN and standard pressure pN). Figure 2 shows the result obtained at such a scanning speed, visualized at the ground station, for a plastic tube filled with a mixture similar to biogas with 60 % CH4 and 40 % CO2.
Table 2Estimated flow rate (Ln min−1) expressed by the mean and standard deviation based on the 11 largest estimates for the flow rates qv (Ln min−1) in the open-area test site experiments.

The system was also tested to quantify methane under realistic conditions at this open-air test site. A 3D ultrasonic anemometer was used to measure wind speed near the leak, and a leak simulator was used to create an artificial point leak. A mass flow controller and a laptop were used to record and control the methane leak rates. Figure 8 shows the setup. The UAS was positioned at an altitude of approximately 7 m, with measured path lengths ranging from 10 to 15 m. Volume flows qv of 1.1 and 2.2 Ln min−1 were released. Figure 9 shows the results. As in the laboratory tests, the volume flows were estimated for every measurement point from the point cloud according to Eq. (7) and are shown in the histogram in the middle. In the outdoor experiments, the measurements from the 3D anemometer were taken as vwind. As before, the 11 highest quantifications are shown in a box plot on the right to express the estimated leak rate and its uncertainty. Table 2 lists the mean and standard deviation for these 11 points. The determination of was carried out once with the anemometer-measured values and once with the estimated wind speeds based on the drone attitude. The gimbal allows the drone to be positioned so that the rotor downwash does not significantly affect the gas distribution as the drone can be positioned downwind relative to the leak. Since the same amount of methane is released in the laboratory and in the open-area test site experiments, the measured methane concentrations are significantly lower outside due to the greater distances. This does not affect the estimated methane volume flows because the lower concentration values are multiplied by larger flow areas and higher wind speeds. In the real-world test, there is also a correlation between the amount of methane released and the estimated volume flows. Quantification using the estimated wind speed is possible, but even for the flat open-area test site the results are already inferior. Further tests under different environmental conditions and volume flows are required to make a conclusive statement.
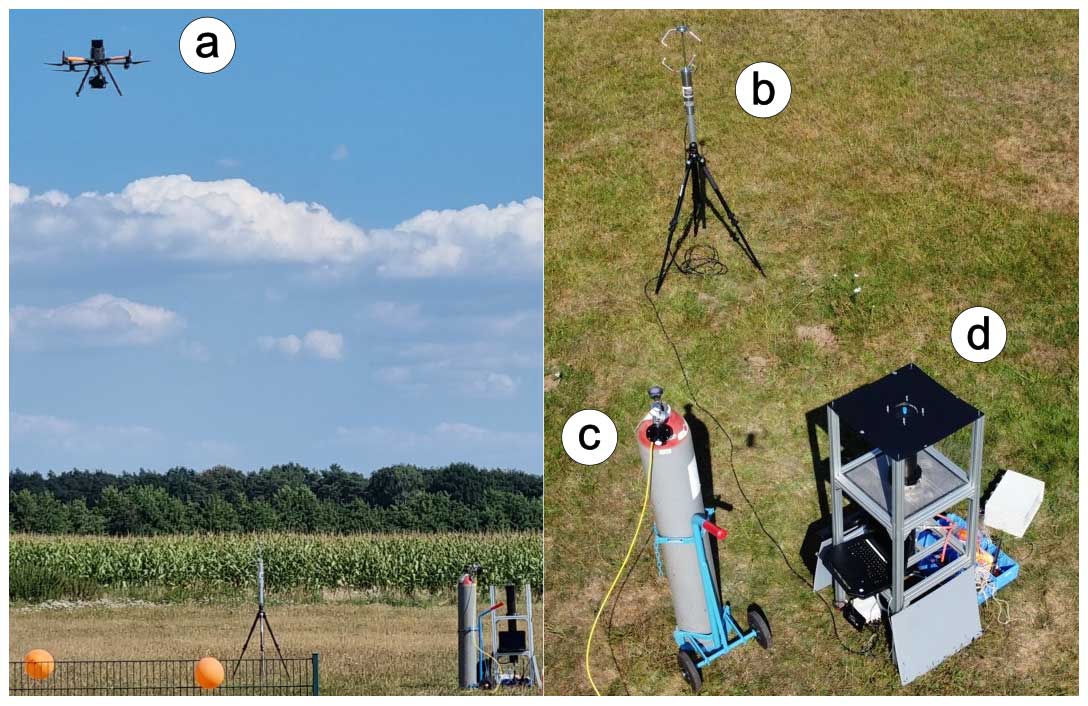
Figure 8Experimental setup at the open-area test site with (a) the UAS, (b) the 3D ultrasonic anemometer positioned near the (c) gas cylinder filled with methane, and (d) the artificial leak test rig.

Figure 9Mass-flow-controlled release of methane at the open-area test site with volume flow rates of qv=0.0 Ln min−1 (a–c), qv=1.1 Ln min−1 (d–f), and qv=2.2 Ln min−1 (g–i). (a, d, g) Point clouds of the scan. (b, e, h) Histograms of quantified points according to Eq. (7). (c, f ,i) Box plots of the 11 points with the largest values.
The presented UAS was evaluated in a series of tests using methane-filled sample containers and mass-flow-controlled methane release under a variety of weather conditions. In open-area tests, a methane-filled sample container with a diameter of 0.2 m can be located, and methane emissions of 43 g h−1 (approximately 60 Ln h−1 at standard temperature and pressure) can be detected at distances of over 10 m and wind speeds of at least 3 m s−1. The results show that a wind speed estimate from the drone's attitude can be a substitute for an anemometer. The results also show that the approach of a scanning TDLAS on a UAS can be used to find and estimate the leak rates, from a technical standpoint, of small methane leaks. Quantification based on measured and estimated wind speeds gives similar results. A conclusion about the quantification accuracy and lower detection limits is not yet possible. The correct value for the aperture angle of the TDLAS sensor is unknown. Besides, the assumption of a discrete aperture angle may be too simplistic. Also, the reliability of TDLAS readings for concentrations below 100 ppmm, which occur at leaks of approximately 60 Ln h−1 at distances of 7 to 15 m, is unknown. Further validation and uncertainty analysis is planned.
Nevertheless, even for wind speeds of 5 m s−1, the system is a stable measurement platform for remotely locating methane leaks and fusing the measurement data with 3D point clouds. The system also has the advantage of being able to inspect components and parts that are inaccessible to ground inspection. Recording of all sensor data and inputs allows for extensive postprocessing analysis and for reliable reporting of the detected methane emissions.
Code and data can be found at https://doi.org/10.5281/zenodo.12799205 (Kistner, 2024).
LK implemented the system, planned the experiments, analyzed the data, and wrote the paper. RS and AK supervised the work and revised the paper.
The contact author has declared that none of the authors has any competing interests.
Publisher’s note: Copernicus Publications remains neutral with regard to jurisdictional claims made in the text, published maps, institutional affiliations, or any other geographical representation in this paper. While Copernicus Publications makes every effort to include appropriate place names, the final responsibility lies with the authors.
This article is part of the special issue “Sensors and Measurement Science International SMSI 2023”. It is a result of the 2023 Sensor and Measurement Science International (SMSI) Conference, Nuremberg, Germany, 8–11 May 2023.
The authors would like to thank the German Environmental Foundation (Deutsche Bundesstiftung Umwelt – DBU) for the funding (grant no. 35407/01) and the project partners of Hermann Sewerin GmbH for their support. The authors would also like to thank Emre Öztürk for planning and conducting the experiments for the “wind velocity estimation from attitude” data sets, as well as the anonymous reviewers for their valuable feedback.
This research has been supported by the Deutsche Bundesstiftung Umwelt (grant no. 35407/01).
This paper was edited by Andreas Schütze and reviewed by two anonymous referees.
Baetz, W., Kroll, A., and Bonow, G.: Mobile Robots with Active IR-Optical Sensing for Remote Gas Detection and Source Localization, in: IEEE International Conference on Robotics and Automation (ICRA 2009), 12–17 May 2009, Kobe, Japan, edited by: Kazuhiro Kosuge, K. I., IEEE, 2773–2778, https://doi.org/10.1109/ROBOT.2009.5152338, ISBN 978-1-4244-2789-5, 2009. a
Barz, T., Bonow, G., Hegenberg, J., Habib, K., Cramar, L., Welle, J., Schulz, D., Kroll, A., and Schmidt, L.: Unmanned Inspection of Large Industrial Environments – Insights into Research Project RoboGasInspector, in: Future Security, edited by: Aschenbruck, N., Martini, P., Meier, M., and Tölle, J., vol. 318 of Communications in Computer and Information Science, Springer Berlin Heidelberg, Bonn, 216–219, https://doi.org/10.1007/978-3-642-33161-9_32, 2012. a
Bastviken, D., Wilk, J., Duc, N. T., Gålfalk, M., Karlson, M., Neset, T.-S., Opach, T., Enrich-Prast, A., and Sundgren, I.: Critical method needs in measuring greenhouse gas fluxes, Environ. Res. Lett., 17, 104009, https://doi.org/10.1088/1748-9326/ac8fa9, 2022. a
Bennetts, V. H., Schaffernicht, E., Stoyanov, T., Lilienthal, A. J., and Trincavelli, M.: Robot assisted gas tomography – Localizing methane leaks in outdoor environments, in: 2014 IEEE International Conference on Robotics and Automation (ICRA), 31 May–7 June 2014, Hong Kong, China, IEEE, 6362–6367, https://doi.org/10.1109/icra.2014.6907798, 2014. a
Bonow, G. and Kroll, A.: Gas leak localization in industrial environments using a TDLAS-based remote gas sensor and autonomous mobile robot with the Tri-Max method, in: IEEE International Conference on Robotics and Automation (ICRA), 6–10 May 2013, Karlsruhe, Germany, IEEE, 987–992, https://doi.org/10.1109/ICRA.2013.6630693, 2013. a
Chang, C.-C., Wang, J.-L., Chang, C.-Y., Liang, M.-C., and Lin, M.-R.: Development of a multicopter-carried whole air sampling apparatus and its applications in environmental studies, Chemosphere, 144, 484–492, https://doi.org/10.1016/j.chemosphere.2015.08.028, 2016. a
Cusworth, D. H., Duren, R. M., Thorpe, A. K., Pandey, S., Maasakkers, J. D., Aben, I., Jervis, D., Varon, D. J., Jacob, D. J., Randles, C. A., Gautam, R., Omara, M., Schade, G. W., Dennison, P. E., Frankenberg, C., Gordon, D., Lopinto, E., and Miller, C. E.: Multisatellite Imaging of a Gas Well Blowout Enables Quantification of Total Methane Emissions, Geophys. Res. Lett., 48, e2020GL090864, https://doi.org/10.1029/2020gl090864, 2021. a
Dierks, S. and Kroll, A.: Remote quantification of methane leaks in the laboratory and in biogas plants, Int. J. Remote Sens., 42, 7978–8003, https://doi.org/10.1080/01431161.2021.1959956, 2021. a, b
Emran, B., Tannant, D., and Najjaran, H.: Low-Altitude Aerial Methane Concentration Mapping, Remote Sens., 9, 823, https://doi.org/10.3390/rs9080823, 2017. a
Frish, M. B., Wainner, R. T., Laderer, M. C., Allen, M. G., Rutherford, J., Wehnert, P., Dey, S., Gilchrist, J., Corbi, R., Picciaia, D., Andreussi, P., and Furry, D.: Low-cost lightweight airborne laser-based sensors for pipeline leak detection and reporting, in: Next-Generation Spectroscopic Technologies VI, edited by: Druy, M. A. and Crocombe, R. A., SPIE, https://doi.org/10.1117/12.2015813, 2013. a
Gålfalk, M., Påledal, S. N., and Bastviken, D.: Sensitive Drone Mapping of Methane Emissions without the Need for Supplementary Ground-Based Measurements, ACS Earth Space Chem., 5, 2668–2676, https://doi.org/10.1021/acsearthspacechem.1c00106, 2021. a
Iwaszenko, S., Kalisz, P., Słota, M., and Rudzki, A.: Detection of Natural Gas Leakages Using a Laser-Based Methane Sensor and UAV, Remote Sens., 13, 510, https://doi.org/10.3390/rs13030510, 2021. a
Kistner, L.: MT-MRT/JSSS-drone-based-ch4-quantification: update (v1.1), Zenodo [data set and code], https://doi.org/10.5281/zenodo.12799205, 2024. a
Kistner, L., Kroll, A., and Schmoll, R.: P67 – An Airborne Measurement System to Detect, Locate and Quantify Methane Emissions, in: Sensor and Measurement Science International (SMSI), 8–11 May 2023, Nürnberg, Germany, AMA Science, https://doi.org/10.5162/smsi2023/p67, 2023.
Neumann, P., Asadi, S., Lilienthal, A., Bartholmai, M., and Schiller, J.: Autonomous Gas-Sensitive Microdrone: Wind Vector Estimation and Gas Distribution Mapping, IEEE Robot. Autom. Mag., 19, 50–61, https://doi.org/10.1109/mra.2012.2184671, 2012. a, b, c
Neumann, P. P., Kohlhoff, H., Hüllmann, D., Lilienthal, A. J., and Kluge, M.: Bringing Mobile Robot Olfaction to the next dimension – UAV-based remote sensing of gas clouds and source localization, in: 2017 IEEE International Conference on Robotics and Automation (ICRA), 29 May–3 June 2017, Singapore, IEEE, https://doi.org/10.1109/icra.2017.7989450, 2017. a
Neumann, P. P., Kohlhoff, H., Hüllmann, D., Krentel, D., Kluge, M., Dzierliński, M., Lilienthal, A. J., and Bartholmai, M.: Aerial-based gas tomography – from single beams to complex gas distributions, Eur. J. Remote Sens., 52, 2–16, https://doi.org/10.1080/22797254.2019.1640078, 2019. a
Oberle, F. K. J., Gibbs, A. E., Richmond, B. M., Erikson, L. H., Waldrop, M. P., and Swarzenski, P. W.: Towards determining spatial methane distribution on Arctic permafrost bluffs with an unmanned aerial system, in: SN Applied Sciences, vol. 1, Springer Science and Business Media, https://doi.org/10.1007/s42452-019-0242-9, 2019. a
Shah, A., Pitt, J. R., Ricketts, H., Leen, J. B., Williams, P. I., Kabbabe, K., Gallagher, M. W., and Allen, G.: Testing the near-field Gaussian plume inversion flux quantification technique using unmanned aerial vehicle sampling, Atmos. Meas. Tech., 13, 1467–1484, https://doi.org/10.5194/amt-13-1467-2020, 2020. a
Shaw, J. T., Shah, A., Yong, H., and Allen, G.: Methods for quantifying methane emissions using unmanned aerial vehicles: a review, Philos. T. Roy. Soc. A, 379, 20200450, https://doi.org/10.1098/rsta.2020.0450, 2021. a
Shen, Z., Schmoll, R., and Kroll, A.: Measurement of Fluid Flow Velocity by Using Infrared and Visual Cameras Comparison and Evaluation of Optical Flow Estimation Algorithms, in: IEEE Sensors 2023, 29 October–1 November 2023, Vienna, Austria, IEEE, https://doi.org/10.1109/SENSORS56945.2023.10324883, 2023. a
Wang, J.-Y., Luo, B., Zeng, M., and Meng, Q.-H.: A Wind Estimation Method with an Unmanned Rotorcraft for Environmental Monitoring Tasks, Sensors, 18, 4504, https://doi.org/10.3390/s18124504, 2018. a
- Abstract
- Introduction
- Related work
- Measurement system
- Wind velocity estimation from attitude
- Measurement model for emission quantification
- Evaluation using the gas test bench
- Experimental evaluation at the open-area test site
- Conclusions and outlook
- Code and data availability
- Author contributions
- Competing interests
- Disclaimer
- Special issue statement
- Acknowledgements
- Financial support
- Review statement
- References