the Creative Commons Attribution 4.0 License.
the Creative Commons Attribution 4.0 License.
Soft sensor system for in-process eddy current microstructure characterization
Sebastian Hütter
Yury Simonin
Gerhard Mook
Thorsten Halle
Non-destructive testing methods can be used for material characterization and quality control during manufacturing processes. For process control applications, a fast transformation of the measured signal to a small set of characteristic quantities is required. In this work, a soft sensor system based on digital data processing of an eddy current sensor system is developed and implemented. The analytical model for the voltage transfer function is based on an equivalent circuit for the sensor system. The data processing is implemented in software, and the resulting soft sensor is tested in experiments to show that it is possible to obtain useful material data for metals using comparatively simple sensor hardware in quasi real time.
- Article
(3930 KB) - Full-text XML
- BibTeX
- EndNote
In advanced manufacturing processes, often not only the shape but also some microstructural properties of a workpiece are critical quality targets. For in-process control of such properties (Stebner et al., 2024), they must be measured in real time and often under adverse conditions, such as proximity to tools, hot workpieces or cooling media. The use of eddy current (EC)-based measurement for non-destructive evaluation of material properties such as hardness or deformation is a relatively new application of established EC technologies commonly used for fault detection (Uchimoto et al., 2003; Konoplyuk et al., 2005).
At a high level, EC equipment uses two coils, one of which is used to transmit an alternating magnetic field into an electrically conductive workpiece, where the changing magnetic field induces eddy currents. These produce a magnetic field of their own, resulting in a different signal being picked up by the second coil. The interpretation of these response signals is usually done in application-specific ways, e.g., by using pass and fail selection or calibration curves if some correlation with physical quantities is required. For integration into production systems, a measurement system that directly relates the response to microstructural properties is desirable (Homberg et al., 2023). A model-based soft sensor that merges data acquisition and processing implementing this is presented in this work.
Unlike in non-destructive testing (NDT) applications, non-destructive evaluation (NDE) requires interpretation of the response signal in direct relation to the intended use of the workpiece (Altpeter et al., 2002). Some previous work includes measurement of microhardness (Zergoug et al., 2004), microstructure characteristics of cast iron (Mook et al., 2011) or magnetic anisotropy on difficult surfaces (Wendler et al., 2023, 2021). The authors have previously shown applications in offline characterization of even minor grain size differences of rolled parts (Hütter et al., 2021).
Additional information can be gained by using multifrequency techniques instead of a single-frequency excitation signal, as different frequencies have differing penetration depths (Mook et al., 2007). Pulsed-current methods with square or pulse-shaped excitation obtain results at many points in the frequency domain, corresponding to different depths excited at the same time (Tian et al., 2009). Using a continuous broad-spectrum excitation signal allows the transfer spectrum of the whole measurement arrangement to be obtained, including the material and the sensor itself. Commonly, the impedance spectrum is obtained and modeled with varying complexity. One of the first descriptions was that of Dodd and Deeds (1968), resulting in analytical solutions for plates. In Libby (1971), a lumped-element model was developed by considering the sensor and material to be a transmission line and calculating its total impedance. From this information, the inductance of the coil can be calculated, which can then be used to identify material parameters (Wendler et al., 2024). By extending the transmission line model to multiple segments, this formulation can also explicitly include defects (Sabbagh et al., 2021). Beyond the transmission line model, two-coil sensors have also often been modeled as a transformer, such as in Bihan (2003). Besides lumped-element models, it is also possible to describe the electromagnetic interactions completely using the field equations and to formulate a finite element problem. This results in two types of interactions, namely those between the sensor coils themselves as well as those caused by the eddy currents in the material (Desjardins et al., 2014). While computationally expensive, this results in a very accurate representation of the physical effects and the measured impedance.
Generally, the lumped-element models as described above are formulated in terms of impedance. Using these directly in measurements however requires equipment capable of carrying out what is effectively impedance spectroscopy. If a description of the voltage transfer function is available, much simpler and less expensive hardware could be used to obtain the measurements. Accurate description of the signal transfer, including the effects of the eddy currents themselves, requires an equivalent circuit model based on lossy transformer elements. A new model fulfilling these requirements will first be described and its voltage transfer function derived. An implementation suitable for real-time parameter identification will then be shown. The sensor and signal processing will then be evaluated in an application for monitoring a tangential profile ring rolling process which is described in greater detail elsewhere (Brosius et al., 2019; Lafarge et al., 2022, 2023).
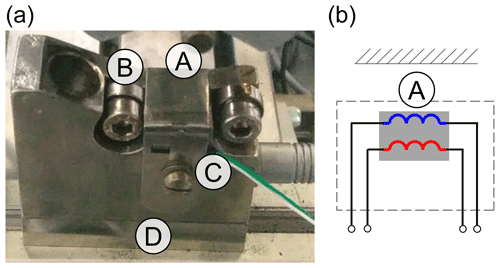
Eddy current measurements were carried out using a custom-built sensor head using the analog front end of an EddyCation (Mook and Simonin, 2008) testing system coupled with custom signal processing software. A two-coil probe with separate transmitter and receiver coils was used in a conventional transformatoric setup. Both coils were housed in a 10 mm diameter cup ferrite core as a field guide, which was then mounted in the mechanical support structure machined from austenitic steel (Fig. 1). Two small rollers allow contact during the ring rolling process while keeping the sensor coils between 0.4 mm and 1.5 mm away from the part's surface during forming. This setup is similar to the one presented previously (Hütter et al., 2021) but omits the temperature drift compensation probe. Instead, temperature is monitored by way of a thermocouple placed in close proximity to the sensor. An otherwise identical second probe without the mounting parts was used for testing and evaluation.
In the present setup, the sensor system simplifies to a set of two coils for excitation (primary coil) and reception (secondary coil), with the material acting as an additional coupling. The excitation is provided by an arbitrary waveform digital–analog converter (DAC), and the received voltage is sampled using an analog–digital converter (ADC). No currents are measured, and therefore no impedance information is available. A detailed description of the resulting model for the voltage transfer function can be found in Hütter et al. (2024). Due to some differences with the more common impedance spectroscopy methods, it is summarized here. The starting point is a two-port model for the sensor, as shown in Fig. 2b.

Figure 2Electrical (a) and two-port network view (b) of a transformatoric eddy current sensor. Note that the transformer is not ideal.
Interpreting this two-port network as a black box, the forward voltage transfer function can be found from the complex excitation signal UE and the complex measured voltage UM by employing the Laplace transform ℒ:
In the discrete frequency domain, the same relation holds, e.g., using the fast Fourier transform (FFT) operator:
Descriptions of the electrical behavior of such sensors have historically focused on inductor impedance, e.g., Libby (1971), not the voltage ratio of the transformer. The system forms a lossy transformer with significant eddy currents, which is more difficult to describe. A formulation using the electromagnetic field equations for the real coupling effects as done by Desjardins et al. (2015) is still computationally expensive, as it requires inverse finite element simulations for parameter identification. Instead, a lumped-element model of all the effects was developed in which direct coupling between the primary and secondary coils is modeled as an ideal transformer with a coupling coefficient ktr, while the eddy current coupling is modeled as two separate ideal transformers with the coupling coefficient kec and an equivalent ring current inductance in the material representing the eddy currents. This concept is shown in Fig. 3.
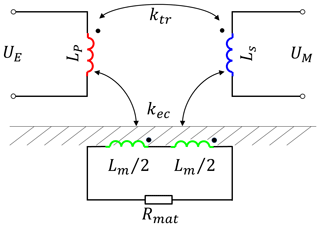
Figure 3Proposed equivalent lumped-element model for the electromagnetic interactions. UE: transmitted voltage. UM: response voltage. Lp, Ls: probe inductances. ktr, kec: ideal transformer coupling factors. Lm: equivalent ring current inductance. Rmat: material loss resistance.
The transfer function H for this system can be identified by first noting that the two couplings could also be seen as a linear superposition of two different independent magnetic fields. This can be verified by observing the transfer functions of materials with varying degrees of eddy current losses and ferromagnetic characteristics (Hütter et al., 2024). Because of this, the total transfer function can be treated as the sum of two simpler transfer functions. The same approach was also taken by Desjardins et al. (2015) for wideband transient responses. They noted that there is direct coupling and superposition of material coupling and self-inductance. By including self-inductance implicitly in the T-equivalent circuits for transformers, the result is a combination of the eddy current (Hec) and transformer (Htr) transfer functions:
The two-component transfer functions can then be found as the transfer functions of the two separate two-port networks shown in Fig. 4.

Figure 4Separated equivalent circuits for the direct transformatoric coupling (a) and the eddy current coupling (b). Series resistances of the secondary or receiver coils (indicated as shaded) can be neglected due to the high-impedance measurement of UM.
In both component circuits, the same values for the primary and secondary coils are used. In the eddy current model, the current loop is modeled with a material loss resistance Rmat and a material inductance represented as two halves of Lm. Expanding all transformers to their T-equivalent circuits with mutual inductance using ab from p (transmitter), s (receiver), 1 and 2 (halves of the equivalent eddy current inductance) and reduced inductances gives circuits that can be solved for the voltage ratio using symbolic manipulation software to handle the large equation systems. Coupling coefficients are fixed so that kps=ktr, and . The resulting parts of the transfer function from Eq. (3) are as follows: for the transformer,
For the eddy current part, one obtains the more complex relation
using the expressions
Due to the assumption of a high-impedance ADC, the receiver coil resistance shown in Fig. 4 is comparatively small and can be neglected. The receiver inductance is only present implicitly in the definitions of Mps and M2s. As will be shown below, the value of Lm can be fixed to a constant value and the coupling equally represented by the choice of Rmat.
Substitution of the reduced inductances and mutual inductances yields the following more instructive form for the transformer part:
Notably, Eq. (6) rearranges to the expected transfer function of a transformer: the term reflects the winding ratio , whereas the ratio (corresponding to the angle between resistance and reactance) yields the phase delay. For the ideal transformer with ktr→1 and Rp→0, the voltage ratio simplifies to the winding ratio without any delay, as expected. This serves as a test for the automatic derivation of the lumped model equations.
The eddy current part from Eq. (5) can also be written as
Again, this equation can be rearranged into a series of ratios between the resistance and inductance of the various components. The nominator mostly defines the total energy transfer, as dominated by the winding ratio and the coupling coefficient. The denominator then forms the second-order time delay caused by the various elements. Interestingly, the coupling factor kec occurs twice, corresponding to its role in energy transfer into and out of the material: first (phase-)inverted in the nominator and then in the denominator as , a form also known as Blondel's leakage coefficient. This again relates the model to its physical equivalent as a real lossy transformer. It can also be pointed out that Lm only occurs together with Rmat, further confirming that its value does not have to be taken as a degree of freedom and can instead be reflected in the choice of another parameter.
These equations now contain a set of three material-dependent parameters ktr, kec and Rmat to be identified during operation and three static device properties Rp, Lp and Ls which can be determined by direct measurement of the components of the physical sensor assembly and are independent of the material under test.
After data acquisition, all further processing occurs as digital signal processing (DSP) using custom software specifically optimized to achieve low-latency signal evaluation and identification of model parameters. The output of this software forms the actual measurement value of the soft sensor. For application in a forming process controller, the total latency between a physical change in the material and a change in the software output should be as low as possible while also being roughly constant so that it can be taken into account accordingly as a dead time. Figure 5 gives an overview of the system architecture for the combined soft sensor. The resulting signal timing is partly determined by buffering done on the side of the USB connection and additional buffering required due to the software running on a non-real-time operating system. Closer hardware integration is likely to improve this situation. The latency for the model fit itself is configurable (see below), with 100 ms identified as a reasonable default for the present implementation.
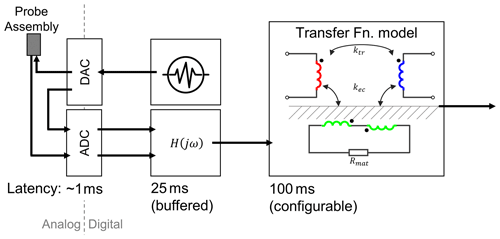
Figure 5System architecture for data acquisition and processing. The dashed line indicates the separation between the analog and digital domains. The latency values given for each stage are approximated from the design properties.
The transmission coil was excited using wideband pseudorandom white noise fed to the coil and directly back to the receiver. The received signals from the receiver coil and the feedback are evaluated in the range from 1 to 20 kHz, which is slightly narrower than the pass-band of the analog front-end filters. Signal levels were monitored to ensure that a sufficient dynamic range exists for strong response signals from ferromagnetic and weak responses from paramagnetic workpieces, which enables measurement even across phase transformations. As long as the measured and feedback signals are within the dynamic range of the ADC and preamplifier linearity is maintained, the resulting transfer function is independent of absolute signal levels, as only the frequency–domain ratio is considered. The present front end has a usable dynamic range of approximately 35 dB, which was found to be enough to ensure that no overflows occur while also not dropping the response signal to below the noise floor.
Further signal processing is carried out in the in-phase and quadrature (IQ) format, with fast Fourier transform implemented by the fttw3 library (Frigo and Johnson, 2005). By complex division, the forward transfer function H is obtained directly.
The device parameters (coil inductivances and series resistance) were measured directly on the sensor head and entered into the software. The material parameters ktr, kec and Rmat are identified by minimizing the sum of the absolute differences between the measured and predicted transfer functions in the frequency domain. This is done using continuous random descent search. This optimization heuristic (Nesterov and Spokoiny, 2015) is used as a compromise for real-time application: a method without the need for an explicit Jacobian is better suited to the structure of the model equations, and a continuous refinement of a previous solution yields results more quickly in the case of only small changes while still being capable of following any jumps with low response times. This implementation is also interruptible and hence can be run asynchronously until the next data acquisition is completed. In the present implementation, the maximum allowed time spent on this optimization can be configured and the allowed search steps are automatically controlled, so that this limit is ensured. As all other latencies are given by the computing hardware, this ensures that the total latency is limited and known, so that it can be considered a dead time in the external process controller.
The presented sensor system was evaluated in both offline and inline applications. Using the present model approach and its implementation as described above, it is possible to characterize both ferromagnetic and non-ferromagnetic materials as well as materials that exhibit a phase transformation without adjustments to device settings such as signal amplification. One such example is given in Fig. 6. It can be seen that both materials can be represented reasonably well, with only minor deviations. For the ferritic steel, the expected zero transfer at DC and the increase towards the real-valued maximum at high frequencies are visible, but due to eddy current losses there is some deviation from the transfer function of an ideal transformer. For the austenitic steel, only a very small transformatoric part exists, and most of the return signal is defined by the eddy current coupling with a large imaginary component and a sign inversion in the real part, corresponding to a phase delay in excess of 90°. This good fit quality confirms the initial concept: with just three material-dependent parameters, the measurement obtained from a given material state across the observed frequency range can be modeled with reasonable accuracy. As a next step, the effect of changing the material state on the identified parameters was investigated.
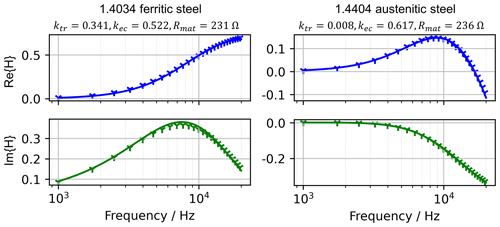
Figure 6Comparison of the real and imaginary parts of the complex as-measured transfer function (symbols) and fitted values (solid lines) for ferritic (median absolute error: 0.011) and austenitic (median absolute error: 0.002) steel. Both were acquired with identical device settings using a sensor with Rp=56.4 Ω, Lp=0.86 mH, Rs=98.2 Ω and Ls=1.67 mH.
In the fully integrated application described in Sect. 2, ring rolling experiments were carried out and data from the present measurement system as well as information on the process conditions (tool path, forces and part temperature) were recorded. Micrographs were prepared using 3 % nital etchant, final hardness was measured using a Buehler VH3300 microhardness tester and grain size was evaluated according to ASTM E112 using the line intercept method.
The results will be discussed based on two representative experiments. Figure 7 shows the results using conventional process parameters. The resulting microstructure is perlite–ferrite. It was found that the loss resistance parameter Rmat correlates well with the total accumulated strain, which in addition to the strain induced by the forming process can also decrease due to recovery and recrystallization occurring while the workpiece is still at a high enough temperature. The transformatoric parameter ktr relates mostly to the permeability, which in turn relates to the magnetic domain size (Zhou et al., 2021; Hütter et al., 2024). In this example, the metadynamic recrystallization at the end of the phase marked “I” results in a rapid decrease in the average grain size, leading to a decrease in the value of ktr. On the other hand, recovery occurring after the main forming process has finished (the phase marked “III”) allows for an increase in ktr. The eddy current losses included in kec and Rmat are influenced by the production of defects during forming and their later recovery as well. Counterintuitively, the material loss resistance Rmat first appears to decrease, as the coupling itself first decreases due to decreasing grain size, which means that less field energy has to be dissipated. When the rate of forming is strongly reduced during the calibration step (the phase marked “II”), both values can increase in tandem by a small amount.
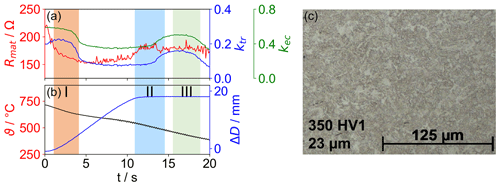
Figure 7Model parameters recorded during the forming process (a). Surface temperature ϑ and change in the part diameter ΔD (b). Large deformation at the start of the process (I), lower deformation during calibration (II) and recovery of the microstructure (III) are highlighted. (c) Optical micrograph, microhardness and average grain size. Light: ferrite; dark: perlite.
By changing the process conditions, a different result can be reached. Figure 8 shows the measurements from such an experiment. Metadynamic recrystallization was avoided, allowing for a bainitic transformation once the workpiece temperature is in the relevant temperature range. This leads to higher microhardness and a smaller average grain size. The later transformation can be observed in the consistently high value of ktr. Instead, only at the end of the process does a significant change happen when the material undergoes bainitic transformation, which results in considerably smaller magnetic domains than those found in the ferrite–perlite microstructure after recovery.
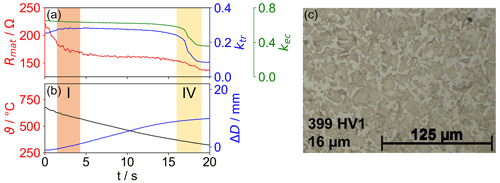
Figure 8Data recorded during forming with different process settings. Model parameters (a). Surface temperature ϑ and change in the part diameter ΔD (b). A large deformation at the start of the process (I) remains, but recovery is not present. Instead, a phase transformation is observed (IV). Optical micrograph, microhardness and average grain size (c). Light: ferrite; dark: bainite.
This application therefore demonstrates sensitivity to the material changes required for control of the workpiece properties during the property-controlled forming process and the qualitative relations between the model output measurements and changes in the material. The two partial transfer characteristics are sufficiently independent of each other to allow for low-latency parameter identification. In the specific application, the influence of the lift-off distance between the sensor and the workpiece was found to be noticeable but not dominant. This was expected, as all the measurements occurred at a lift-off between 0.4 and 1.5 mm, with the strongest deviations occurring in near-contact measurements. The effect of the workpiece temperature was reduced somewhat by the use of austenitic shielding material which reduced the radiative heat transfer, but after many hot-rolling experiments, the sensor coil assembly reached a steady-state temperature of about 60 °C. For this reason, future work will have to implement either active cooling of the sensor assembly or the model-based temperature correction already discussed in Hütter et al. (2024).
This work presented a model-based soft sensor system for application in non-destructive evaluation, primarily for in-process characterization of metallic materials. This sensor is based on a simplified model for the transfer function of an eddy current device using separate transmitter and receiver coils. This was done by reducing the real system to two separate transformer arrangements, whose transfer functions can be found analytically. The recombined transfer function can describe the measured response signal of a given sensor with only three material-dependent parameters.
A software implementation enabling low-latency identification of the parameters of this model was then developed and integrated with an existing analog front end. The DAC–ADC combination was found to have a sufficient dynamic range to process ferromagnetic and non-ferromagnetic materials with the same amplifier settings. The software focus was placed specifically on achieving low-latency and constant (known) dead times so that it can be used in a control loop without introducing fundamental stability issues.
Compared to similar setups, the present sensor system requires less complex hardware, as only voltage and not impedance is measured. The small number of model degrees of freedom enables fast parameter identification: the present model can be fully identified on commodity computers on the order of 100 ms, making it suitable for inline applications where finite element field models would require prohibitive computation time. Nonetheless, the model is sufficient to describe as-measured transfer functions of the sensor with reasonable accuracy.
The sensor system was then integrated into a ring rolling machine, and experiments with inline measurement were carried out. From the results, the physical correlation with material properties like magnetic grain size or accumulated strain can be identified qualitatively by both correlation of various measurements and investigation of the resulting microstructure in the finished product. In further work, known relations between permeability, grain size, defect density and metallurgical effects in the material can be used to conclusively develop the transfer of the model output parameters to these physical quantities. This will then enable the integration of the measurement system for process control, specifically targeting a certain microstructure using techniques previously described in Lafarge et al. (2021).
All the measurement data and codes are not publicly available but can be made available upon request to the corresponding author.
SH: conceptualization, investigation, software, writing – original draft. YS: resources. GM: methodology, software. TH: supervision, writing – review and editing.
The contact author has declared that none of the authors has any competing interests.
Publisher's note: Copernicus Publications remains neutral with regard to jurisdictional claims made in the text, published maps, institutional affiliations, or any other geographical representation in this paper. While Copernicus Publications makes every effort to include appropriate place names, the final responsibility lies with the authors.
This article is part of the special issue “Sensors and Measurement Science International SMSI 2023”. It is a result of the 2023 Sensor and Measurement Science International (SMSI) Conference, Nuremberg, Germany, 8–11 May 2023.
This research has been supported by the Deutsche Forschungsgemeinschaft (program SPP2183, grant no. HA 5209/11-2).
This paper was edited by Gabriele Schrag and reviewed by two anonymous referees.
Altpeter, I., Becker, R., Dobmann, G., Kern, R., Theiner, W., and Yashan, A.: Robust solutions of inverse problems in electromagnetic non-destructive evaluation, Inverse Probl., 18, 1907–1921, https://doi.org/10.1088/0266-5611/18/6/328, 2002.
Bihan, Y. L.: Study on the transformer equivalent circuit of eddy current nondestructive evaluation, NDT&E Int., 36, 297–302, https://doi.org/10.1016/s0963-8695(03)00003-3, 2003.
Brosius, A., Tulke, M., and Guilleaume, C.: Non-linear model-predictive-control for thermomechanical ring rolling, in: Proceedings of the XV International Conference on Computational Plasticity: fundamentals and applications (COMPLAS 2019), 3–5 September 2019, Barcelona, Spain, ISBN 978-84-949194-7-3, http://hdl.handle.net/2117/181968 (last access: 4 December 2024), 2019.
Desjardins, D., Krause, T. W., and Clapham, L.: Transient response of a driver-pickup coil probe in transient eddy current testing, NDT&E Int., 75, 8–14, https://doi.org/10.1016/j.ndteint.2015.04.008, 2015.
Desjardins, D. R., Krause, T. W., Tetervak, A., and Clapham, L.: Concerning the derivation of exact solutions to inductive circuit problems for eddy current testing, NDT&E Int., 68, 128–135, https://doi.org/10.1016/j.ndteint.2014.07.008, 2014.
Dodd, C. V. and Deeds, W. E.: Analytical Solutions to Eddy-Current Probe-Coil Problems, J. Appl. Phys., 39, 2829–2838, https://doi.org/10.1063/1.1656680, 1968.
Frigo, M. and Johnson, S. G.: The Design and Implementation of FFTW3, P. IEEE, 93, 216–231, https://doi.org/10.1109/jproc.2004.840301, 2005.
Homberg, W., Arian, B., Arne, V., Borgert, T., Brosius, A., Groche, P., Hartmann, C., Kersting, L., Laue, R., Martschin, J., Meurer, T., Spies, D., Tekkaya, A. E., Trächtler, A., Volk, W., Wendler, F., and Wrobel, M.: Softsensors: key component of property control in forming technology, Prod. Engineer., 18, 603–614, https://doi.org/10.1007/s11740-023-01227-1, 2023.
Hütter, S., Lafarge, R., Simonin, J., Mook, G., Brosius, A., and Halle, T.: Determination of Microstructure Changes by Eddy-Current Methods for Cold and Warm Forming Applications, Advances in Industrial and Manufacturing Engineering, 2, 100042, https://doi.org/10.1016/j.aime.2021.100042, 2021.
Hütter, S., Simonin, J., Mook, G., and Halle, T.: Equivalent network modeling of eddy-current transfer functions, Measurement, 235, 114943, https://doi.org/10.1016/j.measurement.2024.114943, 2024.
Konoplyuk, S., Abe, T., Uchimoto, T., Takagi, T., and Kurosawa, M.: Characterization of ductile cast iron by eddy current method, NDT&E Int., 38, 623–626, https://doi.org/10.1016/j.ndteint.2005.02.008, 2005.
Lafarge, R., Hütter, S., Tulke, M., Halle, T., and Brosius, A.: Data Based Model Predictive Control for Ring Rolling, Prod. Engineer., 15, 821–831, https://doi.org/10.1007/s11740-021-01063-1, 2021.
Lafarge, R., Hütter, S., Michael, O., Halle, T., and Brosius, A.: Property controlled thermomechanical ring rolling: process implementation and window, in: 36. Aachener Stahlkolloquium – Umformtechnik “Ideen Form geben”, 26–27 October 2022, Aachen, Germany, ISBN 978-3-95886-460-3, 2022.
Lafarge, R., Hütter, S., Halle, T., and Brosius, A.: Process Window and Repeatability of Thermomechanical Tangential Ring Rolling, J. Manuf. Mater. Process., 7, 98, https://doi.org/10.3390/jmmp7030098, 2023.
Libby, H. L.: Introduction to electromagnetic nondestructive test methods, Wiley-Interscience, New York, ISBN 978-0471534105, 1971.
Mook, G. and Simonin, J.: EddyCation – the All-Digital Eddy Current Tool for Education and Innovation, in: Emerging Technologies in Non-Destructive Testing, edited by: Busse, G., Van Hemelrijck, D., Solodov, I., and Anastasopoulos, A., Taylor & Francis, London, Leiden, New York, Philadelphia, Singapore, 289–293, ISBN 978-0415464765, 2008.
Mook, G., Hesse, O., and Uchanin, V.: Deep Penetrating Eddy Currents and Probes, Mater. Test., 49, 258–264, https://doi.org/10.3139/120.100810, 2007.
Mook, G., Michel, F., and Simonin, J.: Zerstörungsfreie Prüfung von ADI-Guss, in: ZfP in Forschung, Entwicklung und Anwendung, DGZfP, Bremen, Germany, ISBN 9783940283337, 2011.
Nesterov, Y. and Spokoiny, V.: Random Gradient-Free Minimization of Convex Functions, Found. Comput. Math., 17, 527–566, https://doi.org/10.1007/s10208-015-9296-2, 2015.
Sabbagh, H. A., Murphy, R. K., Sabbagh, E. H., Zhou, L., and Wincheski, R.: Advanced Electromagnetic Models for Materials Characterization and Nondestructive Evaluation, Springer International Publishing, https://doi.org/10.1007/978-3-030-67956-9, 2021.
Stebner, S. C., Martschin, J., Arian, B., Dietrich, S., Feistle, M., Hütter, S., Lafarge, R., Laue, R., Li, X., Schulte, C., Spies, D., Thein, F., Wendler, F., Wrobel, M., Vasquez, J. R., Dölz, M., and Münstermann, S.: Monitoring the evolution of dimensional accuracy and product properties in property-controlled forming processes, Advances in Industrial and Manufacturing Engineering, 8, 100133, https://doi.org/10.1016/j.aime.2023.100133, 2024.
Tian, G. Y., Li, Y., and Mandache, C.: Study of Lift-Off Invariance for Pulsed Eddy-Current Signals, IEEE T. Magn., 45, 184–191, https://doi.org/10.1109/tmag.2008.2006246, 2009.
Uchimoto, T., Takagi, T., Konoplyuk, S., Abe, T., Huang, H., and Kurosawa, M.: Eddy current evaluation of cast irons for material characterization, J. Magn. Magn. Mater., 258–259, 493–496, https://doi.org/10.1016/s0304-8853(02)01068-5, 2003.
Wendler, F., Munjal, R., Waqas, M., Laue, R., Härtel, S., Awiszus, B., and Kanoun, O.: Eddy Current Sensor System for Tilting Independent In-Process Measurement of Magnetic Anisotropy, Sensors, 21, 2652, https://doi.org/10.3390/s21082652, 2021.
Wendler, F., Awiszus, B., Kanoun, O., Laue, R., and Härtel, S.: Multifrequency Multichannel Eddy Current Sensor System for the Analysis of Mechanical States in Ferromagnetic Materials, in: Lectures, AMA Service GmbH, Wunstorf, Germany, https://doi.org/10.5162/smsi2023/d1.4, 2023.
Wendler, F., Laue, R., Härtel, S., Awiszus, B., and Kanoun, O.: Design of a multi-modal sensor for the in-process measurement of material properties based on inductive spectroscopy, Measurement, 227, 114187, https://doi.org/10.1016/j.measurement.2024.114187, 2024.
Zergoug, M., Lebaili, S., Boudjellal, H., and Benchaala, A.: Relation between mechanical microhardness and impedance variations in eddy current testing, NDT&E Int., 37, 65–72, https://doi.org/10.1016/j.ndteint.2003.09.002, 2004.
Zhou, L., Davis, C., and Kok, P.: Steel microstructure – Magnetic permeability modelling: The effect of ferrite grain size and phase fraction, J. Magn. Magn. Mater., 519, 167439, https://doi.org/10.1016/j.jmmm.2020.167439, 2021.


