the Creative Commons Attribution 4.0 License.
the Creative Commons Attribution 4.0 License.
 | 14 Feb 2024
Laboratory robustness validation of a humidity sensor system for the condition monitoring of grease-lubricated components for railway applications
Christoph Schneidhofer
Nicole Dörr
Ulrich Schmid
The condition monitoring of the health status of lubricating greases used in axle box bearings can be realized by applying well-established electrical or optical measurement principles. Furthermore, some novel methods have been reported that make use of humidity sensors or of dielectric thermoscopy. One of the most important grease condition parameters is the water content of the lubricating grease, as water can degrade grease to the point that it is no longer able to provide suitable lubrication and can also damage the bearing due to corrosion and cavitation. In this study, a new approach for water detection in lubricated wagon components is presented that is based on commercially available humidity sensors. The core element of this sensor system is a robust humidity sensor mounted in the immediate atmosphere of the grease-lubricated wagon axle bearing. In the case of water intake, the humidity of the gaseous atmosphere above the grease increases and can be detected by the customized sensor concept Humidity Sensor in Axle Bearings (HSAB). As this sensor system has to be sufficiently robust, it must be able to withstand environmental impact factors. The most important of these factors are temperature, relative humidity, and mechanical load, like vibrations and shocks, depending on the relevant railway application. To mimic these field effects under controlled laboratory conditions, the “lab-to-field” approach was set up and employed. Of the utmost importance was the installation of a development environment for the sensors that enabled the transfer of laboratory results to the respective rail field application. As a result, the HSAB system shows promise with respect to enhancing the reliability of railway wagons and decreasing maintenance costs, thereby reducing the downtime of railway wagons significantly.
- Article
(3866 KB) - Full-text XML
- BibTeX
- EndNote


In recent decades, the condition monitoring of lubricating oils has gained much attention in different industrial applications, such as aeronautic hydraulic systems, combustion engines, and the rail industry, as well as in research applying diverse sensor concepts (Liu et al., 2021; Rao et al., 2022; Zhu et al., 2017). Many methods exist to monitor the condition of lubricating oils (Dalgaç et al., 2021; Nicholas et al., 2021; Patocka et al., 2020; Zhu et al., 2017); however, there is a comparative gap in knowledge concerning real-time condition monitoring techniques of lubricating greases that has to be filled via the development of novel methods. As a consequence, few relevant published results exist regarding the condition monitoring of lubricating grease – especially of its water content – even though there has been considerable research on the condition monitoring of grease-lubricated bearings with respect to grease parameters such as grease temperature and relative grease deterioration, which is a combination of turbidity, softening, and ageing (Dittes, 2013; Schaeffler Technologies, 2013). Continuous in situ monitoring is also important for grease-lubricated systems, as maintenance costs can represent up to 60 % of the total production costs for grease-lubricated components (e.g. bearings) from iron, steel, and other heavy industrial applications (Mobley, 2002). Therefore, knowing when to carry out maintenance will reduce costs and downtime and possibly increase lubricant change intervals.
The water content of a lubricating grease is one of its most important parameters, as water is the most common liquid source of lubricant contamination and has a destructive effect on the performance of both the lubricated components and the lubricating grease (Karl and Bots, 2011). For example, as little as 1 % water contamination in the lubricant can cause a significant (90 %) reduction in the life of a journal bearing (Dittes, 2016); this is due to the fact that water changes the lubricant physical properties, such as the viscosity, load-carrying, and the power transfer characteristics, and the chemical properties, such as the thermo-oxidative degradation, deposition, and additive-depletion characteristics. Water ingression into lubricating greases can originate from a variety of sources, depending on the application, such as worn seals and condensation from air due to temperature fluctuations (Day and Bauer, 2007). Water contamination can cause rust, corrosion, water etching, erosion, and cavitation. Water also degrades the base oil of lubricating greases, resulting in the formation of acids. Water etching can result from the formation of hydrogen sulfide and sulfuric acid due to lubricant degradation (Dittes et al., 2020). Basically, water contamination can be divided into three main categories depending on the form of water, namely, dissolved, emulsified, and free water (Ametek Brookfield, 2015). In the case of dissolved water, water molecules are individually dispersed between the lubricant molecules and are not visible to the naked eye. It primarily originates from the ambient air humidity slowly interacting with the lubricant and causing the degradation of metal surfaces and the depletion of additives. With increasing water contamination, the lubricants reach a saturation point at which any added water will precipitate and become emulsified. Under this condition, the potential for damage is substantially enhanced, as rust, clogged filters, and increased oil acidity in lubricating greases can occur. Free water will cause the most damage, as (at some point) a quantity of water can completely displace the lubricant, which is supposed to protect components. This form of water remains in a separate aqueous liquid phase and will never be incorporated into the lubricant. It originates from condensation or leaks and can lead to more significant rusting (Ametek Brookfield, 2015).
There are a variety of methods to determine the presence and amount of water in lubricants. Traditional condition monitoring techniques include Fourier transform infrared (FTIR) spectroscopy and Karl Fischer titration (Rowe and Biamonte, 2016). FTIR is based on the interaction between various wavelengths of infrared light and the grease sample. The transmitted light is collected by a detector, and the spectrum of the transmitted or absorbed light as a function of the wavelength of the incident beam is typically analysed (Spectro Scientific, 2015). By comparing the spectrum of the used and fresh grease, the water content of the used grease sample can be determined based on the Beer–Lambert law. FTIR can be effective for screening samples containing above 1000 ppm of water (Karl and Bots, 2011). However, problems may arise if other particulates (e.g. dust and soot) are present that may cause interference, giving a false positive (Ametek Brookfield, 2015). The most widely accepted method for detecting the amount of all forms of water contamination in lubricants is Karl Fischer titration, which is usually taken as reference. The most commonly used Karl Fischer methods are (1) volumetric titration, following ASTM D1744-13 (ASTM, 2016a), to analyse free and emulsified water and (2) coulometric titration, described in ASTM D6304-20 (ASTM, 2021b), to quantify dissolved water. As a result, water concentrations down to 10 ppm can be detected (Noria Corporation, 2015). One disadvantage of all Karl Fischer methods is that they require a laboratory environment and skilled operators. Furthermore, they use hazardous chemical reagents and fragile glass vessels. Beyond conventional grease-water content determination methods, there are also some novel approaches that have not yet been widely exploited, such as dielectric thermoscopy (Dittes et al., 2018). This method applies the temperature dependence of the dielectric properties of water-contaminated grease inside a test cell to estimate its water content by quantifying the change in the dielectric constant over a temperature change within a certain frequency range. As the dielectric constant of water rises rapidly with decreasing measurement frequency and because low-frequency investigations are typically cheaper and easier to implement, typical frequency spectra are below 100 Hz (Dittes et al., 2018). An advantage of this method is that the quantity of the grease inside the test cell does not have as much influence on the result, as known from other dielectric investigations under constant test conditions. This is due to the fact that the overall capacitance at a given test temperature is completely proportional to the amount of grease in the test cell, where the dielectric thermoscopy calculates the change in properties that correlates to the water content. However, typical capacitance or dielectric measurements in grease applications (e.g. in bearings) often run into several problems, mainly because grease does not flow easily into test cells due to its limited movement capability during operation owing to its semi-solid structure (Dittes, 2016).
As described above, there are still only a few novel methods to determine the water content of lubricating greases without laboratory instruments; correspondingly, there are still few ready-made products available for this purpose on the market. Most of these methods make use of water sensors, which are primarily used in oil circulation and tanks, and are based on humidity measurement or monitoring available electrical properties, such as electrical conductivity or permittivity, as described in the corresponding patents (Maeda and Takahashi, 2004; Takehara and Wakabayashi, 2005). There are only a limited number of commercial products for grease applications and grease condition monitoring available. One approach is the grease sensor for rolling bearings, based on optical infrared reflection technology, that can be used to monitor the grease condition in terms of lubricant opacity, wear, water content, and temperature (Fraunhofer ENAS, 2011). Accordingly, it is possible to detect changes in the grease condition long before any damage to the observed bearing occurs. Another solvent-free moisture-specific instrument to quantify the grease-water content based on polymer-based capacitive humidity sensor technology is the Computrac Vapor Pro XL moisture analyser (Ametek Brookfield, 2018). This device utilizes a cylindrically shaped bottle heater for the septum bottle filled with the grease sample and a dry-air carrier gas flow system according to standard ASTM D7546-15 (ASTM, 2016b). Volatiles emitted from the sample are then carried by the gas flow through the sensor block containing a polymer-based capacitive relative humidity sensor for moisture detection (Pall et al., 2009; Rowe, 2016). The main advantages of this concept are that it does not consume hazardous chemical reagents, is easy to use, does not need fragile and high-cost glassware, and requires far fewer interferences than other water detection methods. Compared to the Karl Fischer method as a benchmark, this method can also deliver excellent precision over a wide range of water content levels down to 10 ppm. As a result, such a device is ideal for testing lubricants for water contamination (Rowe and Biamonte, 2016).
As any sensor system used for grease condition monitoring is subjected to various environmental factors in real field applications, it is of the utmost importance that the sensors are capable of withstanding these stress conditions. Robustness means, in this sense, that the sensor consists of robust components and that the implemented algorithms to evaluate sensor signals must also have a high level of robustness (Dubek et al., 2023).
Accelerated ageing allows the development and optimization of sensor systems in several, short iteration steps. During these iterations, the sensor functionality and, hence, the resulting robustness will be validated, always becoming one step closer to reality, starting from laboratory conditions (Schneidhofer et al., 2018). The validation in the relevant environment is reached by mimicking the relevant environment in a laboratory, as proposed, for example, for wind turbine gearboxes (Coronado and Kupferschmidt, 2014), but including adaptations to the conditions present in the considered railway application. Thus, a high development level is rapidly achieved before the final field test takes place (Schneidhofer et al., 2022). The step change out of research laboratory validation into field demonstration is the most important one. In this work, this is realized by the so-called “lab-to-field” approach, which bridges the gap between laboratory investigations and the field test to transfer laboratory results to the related field application. The essential element here is the sensor development environment, which is used to mimic the field conditions in the laboratory and, as a result, to experimentally examine components and devices. Such a test bench provides the platform for close-to-reality training, which contains more different elements depending on the real conditions that must be simulated. As a rule, the environmental simulation tests for simulating temperature and humidity stresses take place as part of the safety test. Here, the relevant standards decide which properties the product must have. With regard to the test methods, reference is usually made to the IEC 60068 series (BS EN 60068, 2023). There are also many standards concerning mechanical loads. In the railway application field, the most decisive standards, which are also utilized in laboratory tests, are IEC 61373 (BSI, 2010) and BS EN 50155 (BSI, 2017), as they encompass the most severe conditions with respect to mechanical loads, such as vibrations and shocks.
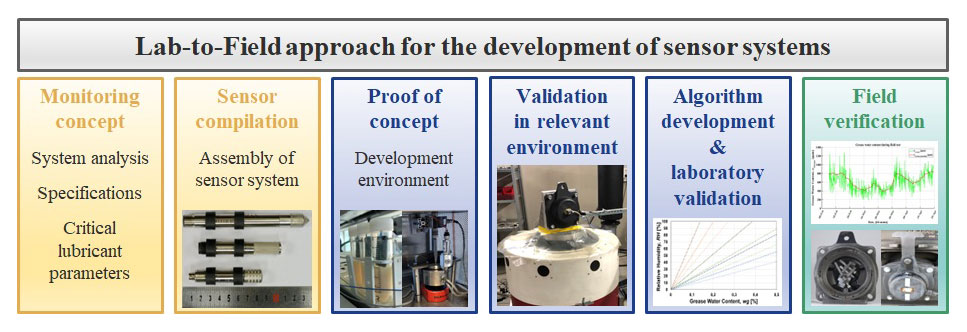
Figure 1Schematic representation of the lab-to-field approach for sensors with a stepwise increase in the development level. Those reported in this publication are highlighted in blue.
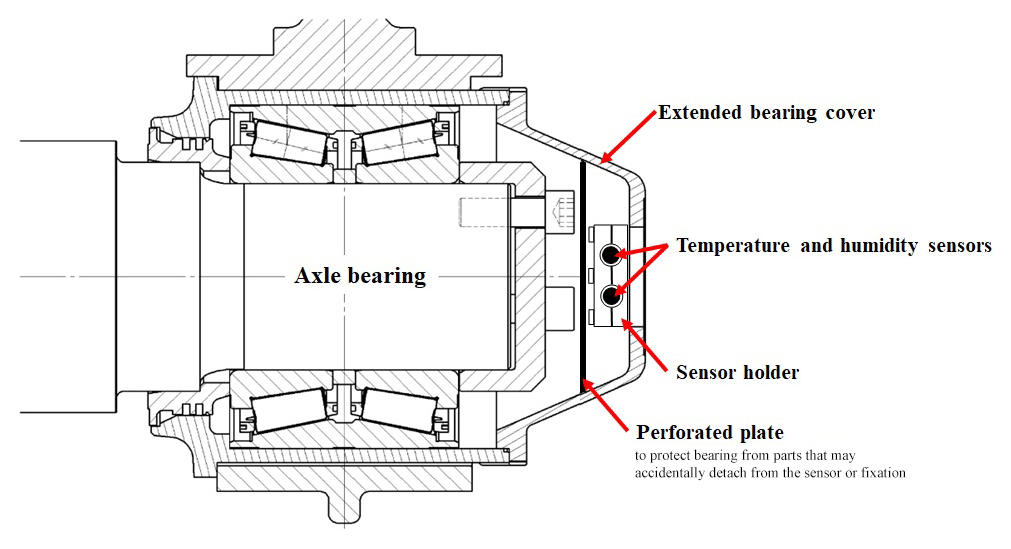
Figure 2Schematic concept of the Humidity Sensor in Axle Bearings (HSAB) system inside an axle bearing, showing an example for railway applications, adapted from DIN EN 12082 (DIN, 2017).
Table 1Specification of the candidate humidity sensors selected for performance tests.
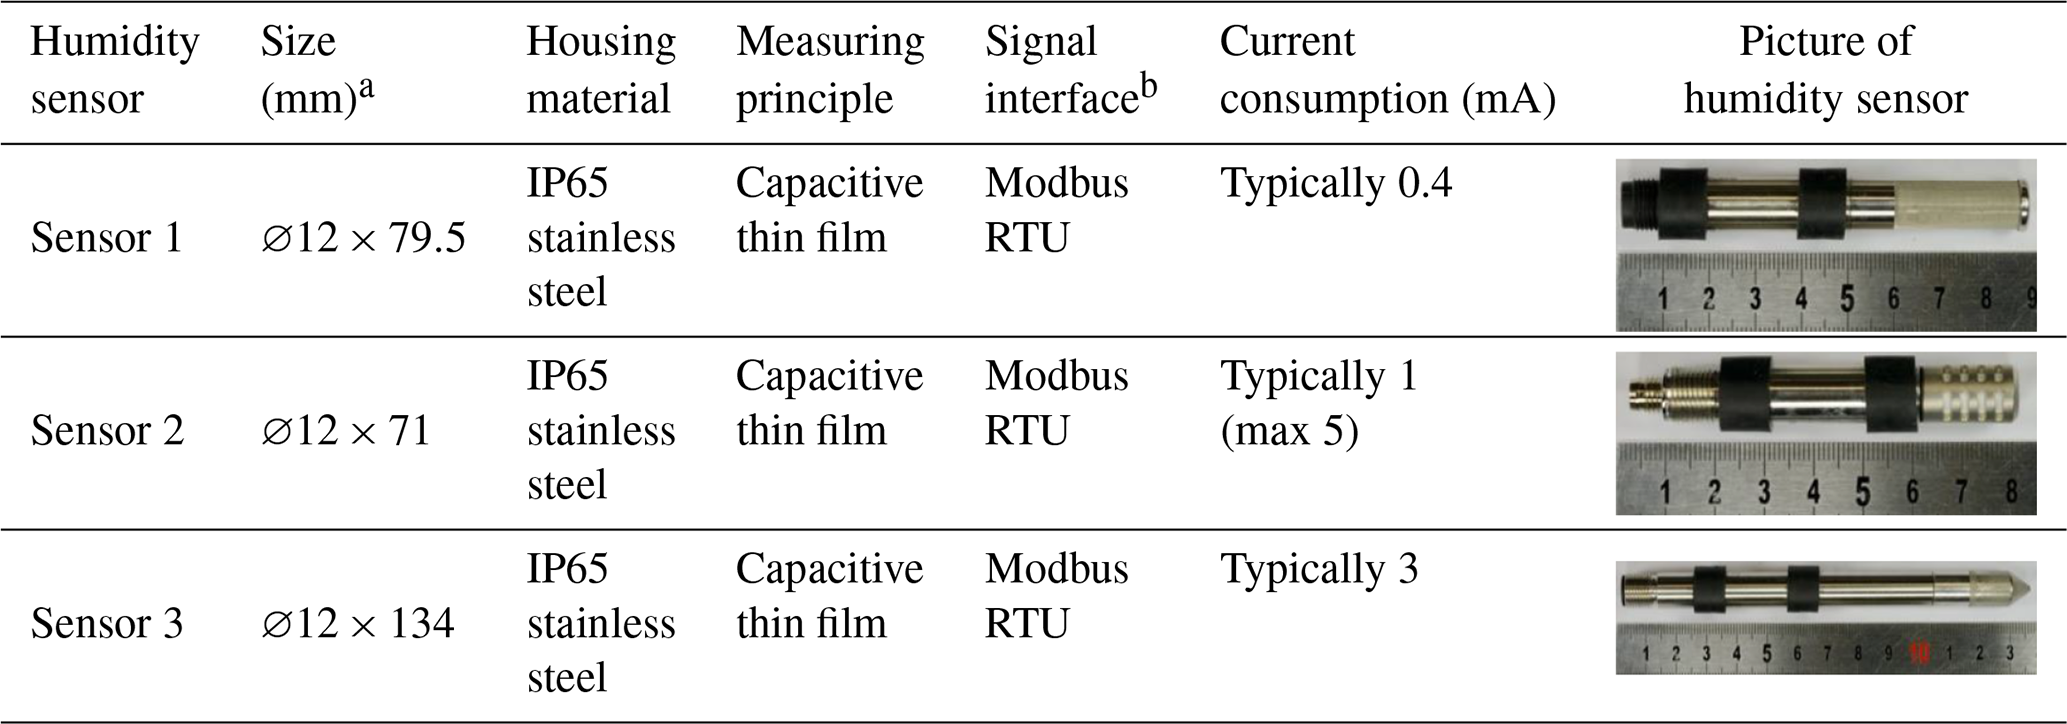
a ∅: diameter. b RTU: remote terminal unit.
In this study, a new concept for the condition monitoring of lubricant grease in rail applications is presented based on commercially available humidity sensors. The core element of the developed sensor system is a robust humidity sensor mounted in the atmosphere above the grease within the lubricated axle bearing of the wagon. Previous concepts for grease condition monitoring have had several unsolved challenges arising due to the following reasons: the immobility of the grease, correct sensor positioning, the existing bearing housings that had to be specially designed to accommodate a sensor, and the high safety requirements of the railway sector, in which changes have to be approved via costly processes. To solve these problems, our concept offers several advantages, such as a simple sensor system architecture, existing and proven technology, no intervention in the actual bearing structure, and holistic consideration of the grease-water content via coupling through its atmosphere instead of measurements of the grease at one position in the bearing. In the following, the robustness of the selected sensors under various mechanical and environmental conditions is first examined. Next, different test methods for the investigation of the grease-water content will be discussed, as this work focuses on the quantification of water in grease-lubricated axle bearings.
2.1 Test bed for sensor robustness analysis under various conditions
The lab-to-field approach was used to establish a sensor development environment tailored to application in railway vehicles, thereby enabling the targeted development of both the sensor and algorithm using laboratory experiments simulating realistic single and mixed stresses, such as temperature, humidity, and mechanical loads (vibrations and shocks). As illustrated in Fig. 1, the lab-to-field approach comprises a number of steps before verification in the field (Schneidhofer et al., 2022; Dubek et al., 2023). This publication specifically addresses the following steps:
-
proof of concept for the basic suitability of the Humidity Sensor in Axle Bearings (HSAB) system (see Sect. 2.5 for methods and Sect. 3.2 for results);
-
validation of the robustness of the HSAB system in the relevant environment via the execution of a test programme that simulates the specific operating conditions of axle box bearings in rail vehicles (see Sects. 2.4 for methods and Sect. 3.1 for results);
-
algorithm development based on close-to-reality training to elaborate correlations between the sensor signal and the lubricant property as well as interference, in particular temperature (see Sect. 3.3).
2.2 The concept of the HSAB system
The purpose of the HSAB system is to determine the condition of grease by means of the water content in the axle bearing used in rail applications. In the case of water uptake by grease, the air humidity will increase, which is detected by the sensor. Critical amounts of water cause reduced lubrication or, even worse, may lead to bearing failure, which is signalled in advance by the HSAB.
As previously introduced, humidity sensors were integrated into the space representing the air atmosphere of the bearing cover of the HSAB system. An advantage of this is that this sensor integration concept is noninvasive with respect to the bearing structure, apart from moderate modifications to the bearing cover. The integration location is illustrated in the schematic adapted from DIN EN 12082 (DIN, 2017) in Fig. 2. As the sensors are placed inside the bearing cover, they are protected from the strong airflow experienced by the moving rail vehicle.
Regarding maintenance issues, the proposed systems are intended to be maintenance-free, at least with respect to the regular maintenance intervals of the axle bearing. However, regular maintenance of the sensor system at regular service intervals is recommended.
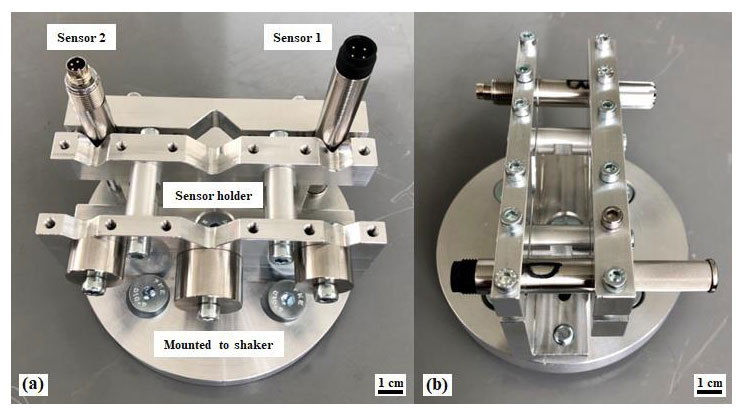
Figure 3Sensor holder with the applied sensors mounted onto the shaker for (a) vertical and (b) horizontal vibration tests.
2.3 Sensor selection
Table 1 shows the selected commercial temperature and humidity sensors for the construction of the HSAB system, including their most important features, that were exposed to diverse performance tests to confirm their measurement sensitivity and robustness. The main aspects considered with respect to the selection of sensors were commercial availability, size, electrical output, and reported robustness according to the railway standard IEC 61373 (BSI, 2010), if available.
According to the data sheets of the sensors used, the measurement accuracy for temperature is ± 0.4 °C for all sensors, while the relative humidity measurement accuracy is ± 1.3 RH % for sensor 3, ± 1.5 RH % for sensor 2, and ± 2 RH % for sensor 1 in the employed temperature (from −10 to +70 °C) and humidity (from 0 RH % to 90 RH %) ranges. Outside of these temperature and humidity ranges, higher errors are expected for the sensors. The selected sensors have been calibrated by their manufacturers, and their functionality has been confirmed with corresponding calibration certificates. The transducer elements of these sensors are protected against dust and dirt by a tailored coating. Furthermore, all soldering points are sealed against corrosion by the manufacturer. In addition, the sensors could also provide information on other physical parameters, such as the dew point, mixing ratio, or absolute humidity. Different reference sensors were utilized to verify the test sensors in order to check the proper functionality of the sensors used during test runs, as discussed in the following.
2.4 Robustness tests
2.4.1 Mechanical robustness
The mechanical robustness of the HSAB system is one of most critical factors, as such sensors would be subjected to high mechanical loads in railway vehicles when directly mounted to the axle. Part of the development environment for testing resistance against vibration and mechanical shock is based on a shaker mimicking close-to-reality vibrational loading scenarios. The shaker was extended by a self-designed sensor holder mounted on the shaker's interface plate to enable vibration tests in both the horizontal and vertical directions, as can be seen in Fig. 3.
The vibration and shock tests were executed on sensors 1 and 2 (see Table 1). A shaker system (LDS HPA-K v2 CE, serial no. S6896-004/1) was used for the vibration tests, and a mechanical free-fall system (LAB/SD-10-42-30, serial no. 5520171) was used for the shock tests. All of these investigations were done according to railway applications standard IEC 61373:2010, Category 3, axle mounted, vertical orientation severity (BSI, 2010). Regarding the vibration tests, two types of experiments were performed: (1) the functional random vibration tests (time period: 5 min; root-mean-square, RMS, acceleration: 38 m s−2) along all three axes and (2) the subsequent simulated long-life tests (time period: 5 h; RMS acceleration: 144 m s−2) along each axis. These tests were aimed at verifying the operational capability and demonstrating that the device would perform appropriately under field test conditions. Finally, the shock tests (nominal duration: 6 ms; peak acceleration: 1000 m s−2; three positive and three negative shocks) along each axis were carried out.
During all tests, sensor data were continuously saved to log files for subsequent evaluation and comparison to reference data. Reference values were logged with a data logger (Testo, 2021) to monitor ambient conditions (laboratory temperature and relative humidity) during testing. The reference data logger was not exposed to any of the vibration nor shock stresses. After the vibration tests, the humidity sensor was inspected for loose parts as well as for functionality.
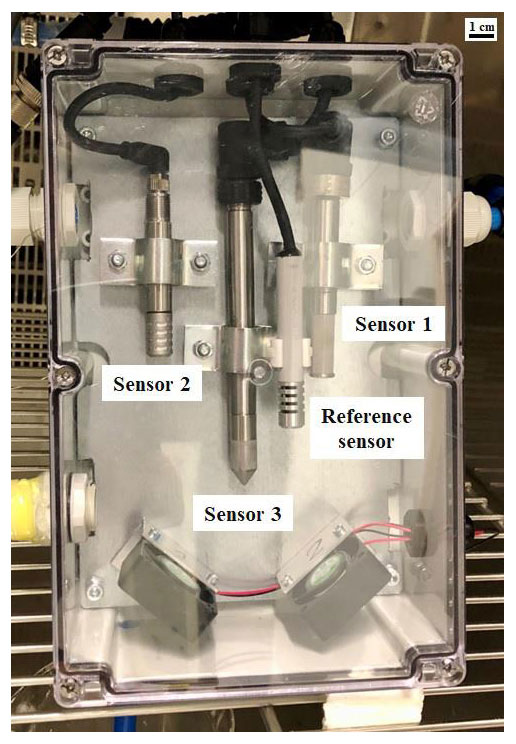
Figure 4Sensors encapsulated into a test box for measurement, according to standard IEC 60068-2-38, and the reference sensor (humidity control sensor).
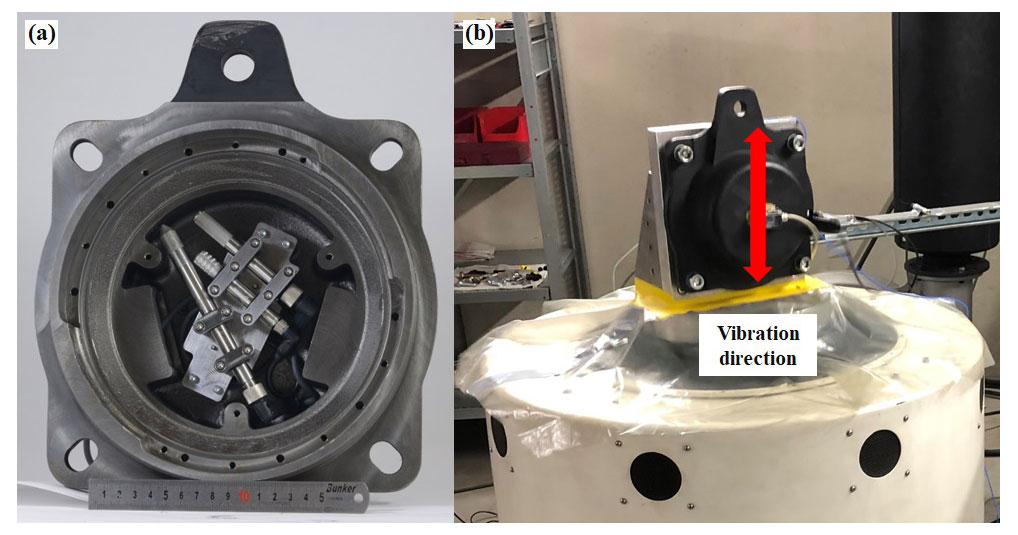
Figure 5Test set-up for sensor robustness investigations under combined conditions: (a) sensors integrated into the PJ Messtechnik GmbH axle bearing cover; (b) sensor system mounted on a shaker to simulate relevant environments well beyond the standard IEC 61373, Category 3, axle mounted.
2.4.2 Robustness under environmental loads
Getting closer to realistic conditions in the sense of the lab-to-field approach, the sensors were integrated into a plastic box (see Fig. 4) inside a climatic chamber to create and guarantee homogeneous climatic conditions. To investigate the resistance of the sensor against temperature and humidity, the sensors have been tested according to standard IEC 60068-2-38 (DIN, 2009), which demands that tested objects are subjected to enhanced and varying temperature and humidity. This standard differs from other cyclic heat tests because it stipulates more severe conditions with respect to temperature and humidity, namely, a larger number of temperature changes in a given time, a larger temperature range within a cycle, a higher rate of temperature changes, and inserted loading sections with temperatures below 0 °C to simulate winter conditions in the laboratory. During the stress test, sensor signals were monitored and saved continuously for subsequent evaluation. Moreover, a reference sensor in close vicinity to the device under test was integrated and was used as a humidity control sensor (TE Connectivity, 2019) in the box.
2.4.3 Robustness under combined conditions
The robustness of the selected sensors (see Table 1) under mixed conditions in the real bearing cover (relevant environment) was tested in order to move one step closer to field conditions. For this reason, an extended bearing cover from PJ Messtechnik GmbH was used in which the sensors were mounted via a customized sensor holder along with the cables for energy supply and communication and the clamping box (as can be seen in Fig. 5a). This arrangement made it possible for the sensor system to have a contact with the grease atmosphere in the bearing units under field conditions. The bearing cover including the sensors was installed using the same orientation as that in the real application, and the entire system was then mounted on a shaker (see Fig. 5b) to provide a mechanical load well beyond the standard IEC 61373:2010, Category 3, axle mounted (BSI, 2010). During this laboratory evaluation, the HSAB system, as well as the described integrated components, was not encapsulated, i.e. embedded into a soft polymer; hence, this resulted in a higher mechanical stress on all of the components in the bearing cover. Vibration and shocks were applied in the vertical direction, as impacts and shocks mainly occur in this direction in the field application. Beyond the standard, extended simulated long-life tests (RMS acceleration up to 250 m s−2) and shock tests with a time period of 6 ms with an increased peak load of up to 1200 m s−2 (in total 117 shocks) were carried out.
Additionally, the entire system was simultaneously exposed to environmental stresses such as temperature and humidity; to realize the aforementioned respective conditions, a hot-air dryer (Steinel HG 2310 LCD) and an ultrasonic humidifier (Dragon MAGIC-FOG ultrasonic nebulizer) were used. For this purpose, a test matrix with the following climatic states was set up to simulate the relevant conditions for the rail application: “Normal” – an ambient temperature and humidity of around 25 °C and 30 RH %; “Hot” – temperature increased to around 60 °C under dry conditions with a humidity level below 10 RH %; “Wet” – an ambient temperature of 25 °C and a humidity level close to 100 RH %; and “Hot + wet” – an increased temperature of around 60 °C and a humidity level close to 100 RH %. Consequently, tests for validation in the relevant environment were executed under more severe conditions than those expected in the field in order to accelerate failure due to mechanical stress.
2.5 Measurement arrangements for the investigation of the grease-water content
In the following, the methods for the static and dynamic measurement arrangements, which were used as part of the development environment to prove the HSAB sensor concept (see first blue field in Fig. 1), are discussed. Furthermore, the data were used for subsequent algorithm development.
2.5.1 Static grease tests
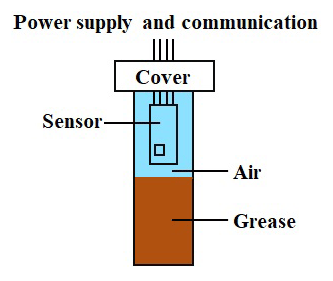
A static test, in this context, means that no movement was applied to the grease nor the examined sensor. For these tests, the sensor was integrated into a sealed recipient that was half-filled with a grease sample. Corresponding to the HSAB concept, the humidity sensor protruded into the air phase while contact with grease was excluded (see Fig. 6). Investigations were carried out with different grease-water contents at different temperatures.
The set-up was placed in an oven. During testing, temperature and humidity were recorded by the sensor. Commercially available grease for railway applications was used, and it was thoroughly mixed with a certain amount of water. The investigations were executed at ambient temperature (25 °C) as well as at 40 °C using the original grease with 0 wt %, 1 wt %, and 2 wt % of added water.
2.5.2 Dynamic grease tests in the modified grease worker
The evaluation of dynamic effects (i.e. movement and load in the grease) took place in a so-called grease worker (see Fig. 7a), as described in the standard ASTM D217-19 (ASTM, 2021a). Tests were carried out with a commercially available grease in this test set-up using three different water contents at different grease temperatures (25, 40, and 60 °C) and sensor temperatures (25, 50, and 70 °C). The grease sample was filled into a steel crucible (see Fig. 7b) wherein a plate perforated with holes (see Fig. 7c and d) was moved up and down via a piston with a speed of 1 stroke per second for a total of 30 000 strokes. The sensor was placed in an extra tubing with contact with the grease atmosphere in the test cell. The temperature of the test cell was first set to room temperature (25 °C) and then to 40 and 60 °C, respectively. Furthermore, the temperature of the atmosphere at the sensor integration position was also adjusted, first to ambient temperature (25 °C) and later to 50 and 70 °C, respectively. During operation, the sensor temperature is usually lower than the grease temperature, although the grease temperature could also be lower than that at the sensor position during specific events, such as under strong-sunlight at low-load conditions and during low-velocity movement of the rail vehicle. Therefore, the experiments were selected to cover all scenarios in which the sensor temperature is higher than, equal to, or lower than the grease temperature. The experiments were performed at three different grease-water contents between 0.05 wt % and 0.3 wt % as well as at three sensor and grease temperatures, resulting in a total of 27 measuring points. After each experiment, a sample of the grease was taken to determine the water content using Karl Fischer titration as a benchmark. An error of ±10 wt % according to DIN 51777-2 (DIN, 1974) also had to be taken into account.
2.5.3 Dynamic grease evaluation in the bearing test rig
The second type of dynamic measurements were carried out in a bearing test rig modified from DIN 51350-6 (DIN, 1996). Two grease-lubricated tapered roller bearings were forced together at a load of 5 kN and rotated at a defined speed of 1500 rpm (see Fig. 8a and b). The humidity sensor was integrated into tubing that was connected to the atmosphere of the bearing test rig (see Fig. 8c). A sample of commercially available grease in its original condition and a sample of the same grease mixed with 1 wt % water were used for the measurements at test cell temperatures of 25, 40, and 53 °C. After each experiment, a sample of the grease was taken to determine its water content by Karl Fischer titration, similar to the investigations in the grease worker.
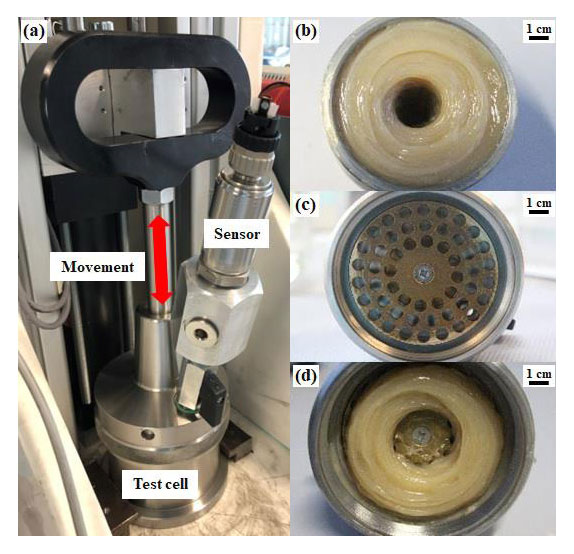
Figure 7Test set-up for dynamic grease evaluation with the grease worker: (a) structure of the grease worker modified from ASTM D217-19 with a mounted sensor and test cell; (b) lower part of the grease worker with a steel crucible filled with grease after operation; (c) upper part of the grease worker with a perforated plate; (d) upper part of the grease worker filled with grease after operation.
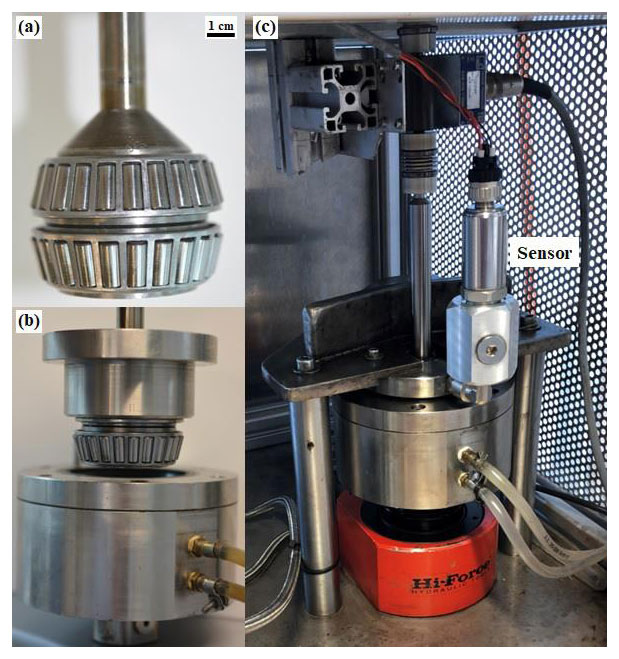
Figure 8Test set-up for the dynamic grease evaluation with the bearing test rig: (a) upper and lower tapered roller bearings face-to-face with each other; (b) components of the test rig cell with the bearing; (c) measuring arrangement with the integrated sensor.
3.1 Robustness validation of the sensor system
3.1.1 Validation of the mechanical robustness with the shaker
Typical measurement results of both the functional random vibration test and the simulated long-life test for the horizontal-1 direction for sensor 2 are given in Fig. 9a and b, respectively. Signals of the reference sensor (data logger) are also shown in Fig. 9 for comparison. As can be seen, sensor 2 provided similar output signals to the reference sensor during all tests, and there was no evidence that it failed. The slight differences between the sensor signals and the signal of the reference can be explained by the different sensor locations, as the reference sensor was placed about 1 m away from the shaker. The same behaviour is also observed for the other sensors and along other axes (horizontal-2 and vertical) involved in these tests.
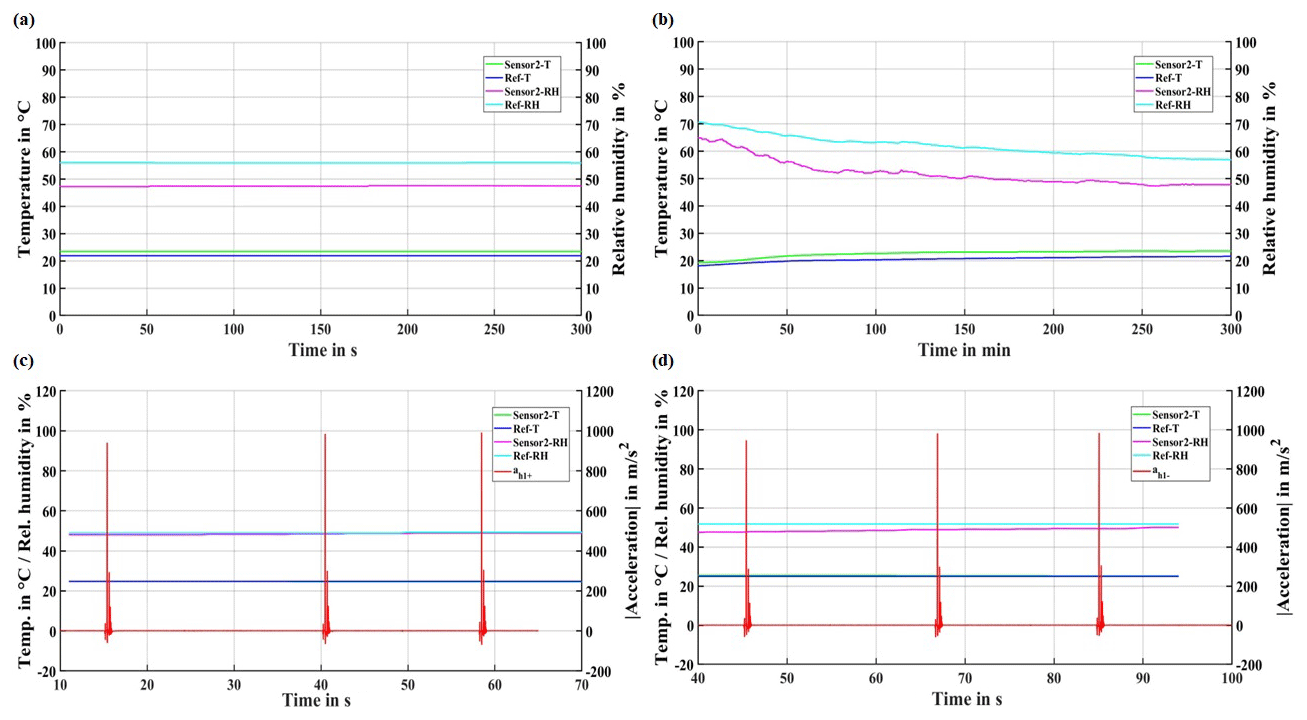
Figure 9Results from the vibration tests with the shaker: (a) functional random vibration test result for the horizontal-1 direction; (b) simulated long-life test results for the horizontal-1 direction; (c) shock test results for the positive horizontal-1 direction (acceleration given in absolute values); (d) shock test results for the negative horizontal-1 direction (acceleration given in absolute values).
Furthermore, during the shock tests for both the positive and negative horizontal-1 directions for the same sensor, the corresponding acceleration data (shock peaks) were recorded to confirm the stress uniformity and shock amplitudes, as depicted in Fig. 9c and d, respectively. During all shock tests, sensor 2 delivered constant signals. In this case, there is no offset between the sensor signals and the data logger signal. Similar to vibration tests, all sensors provided reliable data, and the sensor signals show no evidence of failures during the investigations.
The results clearly show that the sensors have always yielded reliable data, and there was no deviation caused by vibration or shock in the measurement results. Function and mechanical integrity remained unchanged; thus, the test result is “passed”. Accordingly, it can be expected that the selected sensors can withstand the conditions required by IEC 61373:2010, Category 3, axle mounted (BSI, 2010), which makes them suitable for rail applications. In conclusion, based on mechanical stability, the selected sensors can be used in the HSAB system.
3.1.2 Validation of the robustness in a climatic chamber
Results for sensor temperature and relative humidity following the standard IEC 60068-2-38 (DIN, 2009) for sensor 2 are shown in Fig. 10a and b, respectively. The test according to this standard began with a thermal pretreatment in which the sensors were exposed to a temperature of 55 °C and a relative humidity of 10 RH % for a time period of 24 h. This was required for the sensors to achieve temperature equilibration and for the measurement to start from a well-defined state. In the next step, the initial measurement took place: the temperature was reduced to 25 °C and the relative humidity was increased to 60 RH %. Thereafter, a total of 10 cycles with a cycle duration of 24 h were carried out, 5 of which were normal and 5 of which were cold cycles; cold cycles were used to simulate winter conditions, as mentioned above. The order of the cycles was chosen arbitrarily; however, the last cycle was a normal cycle according to the standard. Water with an electrical conductivity of σ<20 µS cm−1 (DIN, 2009) was used to humidify the sensors, and the humidity control system was switched off during cold cycles to prevent freezing. At the end of the test, the final measurement involved keeping the sensors at the initial measurement conditions (25 °C and 60 RH %) for 24 h to compare the functionality of the sensors before and after the cycling.
Results confirmed that the temperature could have been kept within the prescribed tolerances of ±2 K. The relative humidity had moderate undershoots in the case of temperature changes from +25 to −10 °C; however, apart from that, the relative humidity also remained stable within the tolerance limits of ±3 RH % (DIN, 2009). As all of the sensors remained functional after the validation under enhanced climatic conditions, the test result was “passed”.
3.1.3 Validation of the robustness of the mounted HSAB under combined conditions
As an example, the sensor signals recorded during the extended simulated long-life test under climatic conditions and the corresponding acceleration signal in the Hot state for sensor 2 are shown in Fig. 11a. The applied acceleration values during the extended simulated long-life test show that the effective amplitude (RMS) of 208 m s−2 was significantly higher than that required (144 m s−2) in the standard IEC 61373 (BSI, 2010). Acceleration values with these or higher amplitudes can cause a strong wear on railway infrastructure, especially railway frogs, in the long term, which can lead to a significant increase in maintenance costs (Sysyn et al., 2019; Kou et al., 2020). As can be seen, sensor 2 provided reliable data, and there was no evidence that the device failed during the tests. Consequently, its functionality and mechanical integrity remained unchanged. The same can also be stated about the other sensors and at further investigated climatic states, Normal, Wet, and Hot + wet, respectively. Therefore, the test result “passed” was approved for all of the sensors and all of the investigated climatic conditions.
Besides the extended simulated long-life test programme, shock tests were also applied to the sensors. Figure 11b shows the acceleration values of the applied shocks in both the positive and negative directions in the Hot climatic state for sensor 2. In total, 117 shocks were executed – significantly more than requested in the standard IEC 61373 (BSI, 2010) – with three positive and three negative shocks in each axis direction (18 shocks in total). Moreover, during the shock tests, all of the sensors delivered quasi-identical signals. Thus, the sensors again provided reliable data, and there was no evidence that they failed during the tests.
3.2 Determination of the grease-water content
3.2.1 Results of the static grease tests
The sensor signals (temperature and relative humidity) from sensor 2 recorded under static conditions were analysed for correlation with the grease-water content. They were extracted after humidity equilibrium was reached in the gaseous space above the grease, and measured humidity values were correlated as a function of the water content (see Fig. 12a). As expected, the higher the grease-water content, the higher the relative humidity. Furthermore, it was concluded that temperature only had a minor effect on the test results under these conditions, as the differences in the relative humidity of less than 3 RH % were in the range of the measurement error of the sensors. As the relative humidity is strongly dependent on temperature, the absolute humidity as a function of the grease-water content for the investigated temperature ranges was also plotted (see Fig. 12b). It is concluded that a higher grease temperature is correlated with a higher absolute humidity at the sensor position, as more water is driven out of the grease into the surrounding atmosphere. The performed static experiments confirmed the proof of concept and, consequently, the usability of the HSAB for indirect measurements of the grease-water content based on the humidity of the immediate atmosphere of the grease.
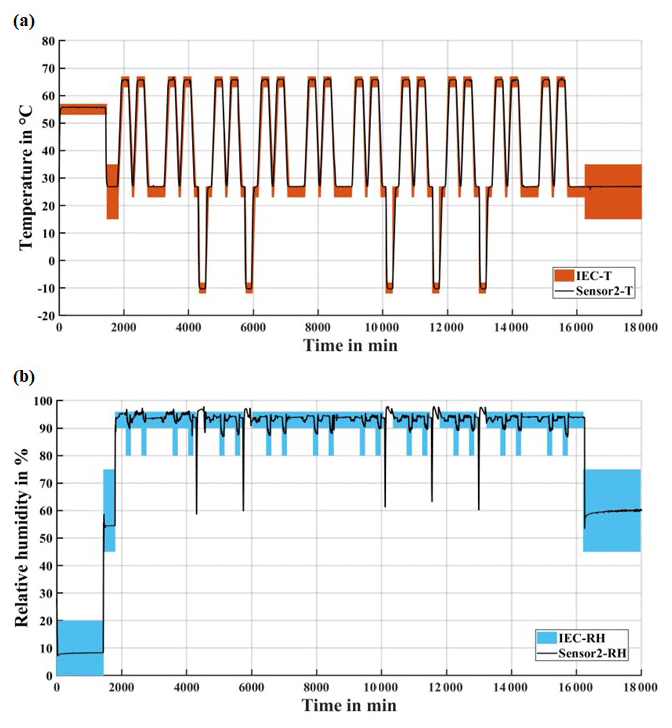
Figure 10Test results for sensor 2 according to standard IEC 60068-2-38: (a) temperature tolerance ranges according to the standard with the sensor temperature signal during the test; (b) relative humidity tolerance ranges according to the standard with the sensor relative humidity signal during the test.
3.2.2 Results under dynamic grease loading in the modified grease worker
As presented in Sect. 2.5.2, humidity sensors were further evaluated using dynamic tests, in which grease movement was introduced in the grease worker. In accordance with the static measurements, humidity sensor signals were investigated after humidity equilibrium was reached in the gaseous space. Good grease mixing was established via the movement of the piston in the crucible during the test. Therefore, a better interaction between the grease water and the humidity in the atmosphere could be expected. As a result, a good correlation between the relative humidity measured by sensor 2 and the water content of the grease was obtained (see Fig. 13). As can be seen, the temperature exerted a significant effect on the humidity measurement: the higher the grease temperature, the higher the humidity of the atmosphere, assuming a constant grease-water content and sensor temperature. Furthermore, the higher the temperature at the sensor position, the lower the relative humidity at a constant grease-water content and grease temperature. Different behaviour, compared with the results obtained from the static measurements, could be explained by the movement of the grease and, therefore, higher exchange between the water in the grease and the atmosphere at the sensor position. Furthermore, the sensor and grease temperatures experienced were individually changed to investigate their effects, contrary to the static measurements (see Sect. 3.2.1) during which the sensor and grease temperatures had the same value. Based on the obtained results, the uncertainties (see trend lines in Fig. 13) came from (1) the sensor (temperature and humidity) and the grease-water content measurement and (2) the fact that local differences in the grease composition with respect to the contaminant (water) can have an influence on the water content of the grease sample taken out of the experimental set-up in comparison with the overall water content of the grease within the experimental set-up, which can lead to further misinterpretation of the measurement results. As the relative humidity is a function of the temperature and the absolute humidity (Zürcher and Frank, 1998), the correlation between the grease-water content and the absolute humidity is obvious and was identified in the present data.
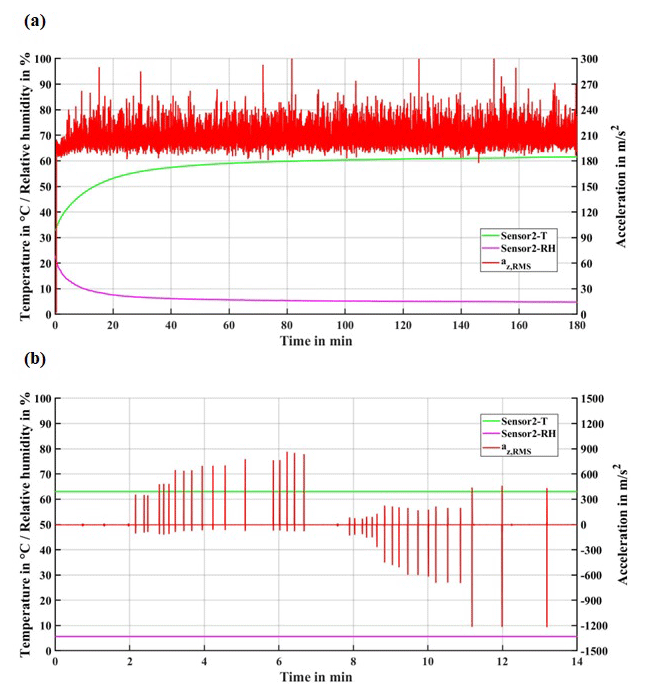
Figure 11Sensor signals (temperature and relative humidity) and the corresponding acceleration data, using the Hot climatic condition for sensor 2 as an example: (a) extended simulated long-life tests; (b) shock tests.
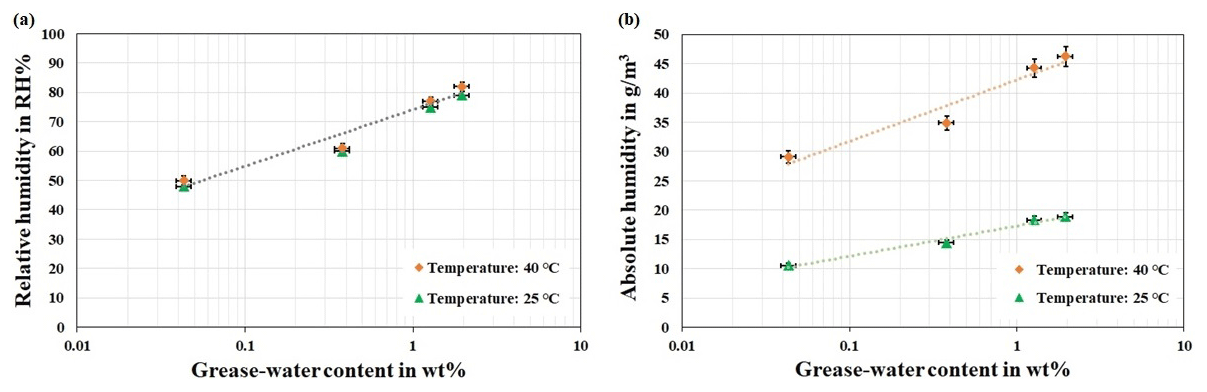
Figure 12Correlation between the grease-water content and the humidity sensor signals determined by static measurements at 25 and 40 °C: (a) correlation between the grease-water content and the relative humidity sensor signal; (b) correlation between the grease-water content and the absolute humidity sensor signal. The dotted lines are used to guide the eyes.
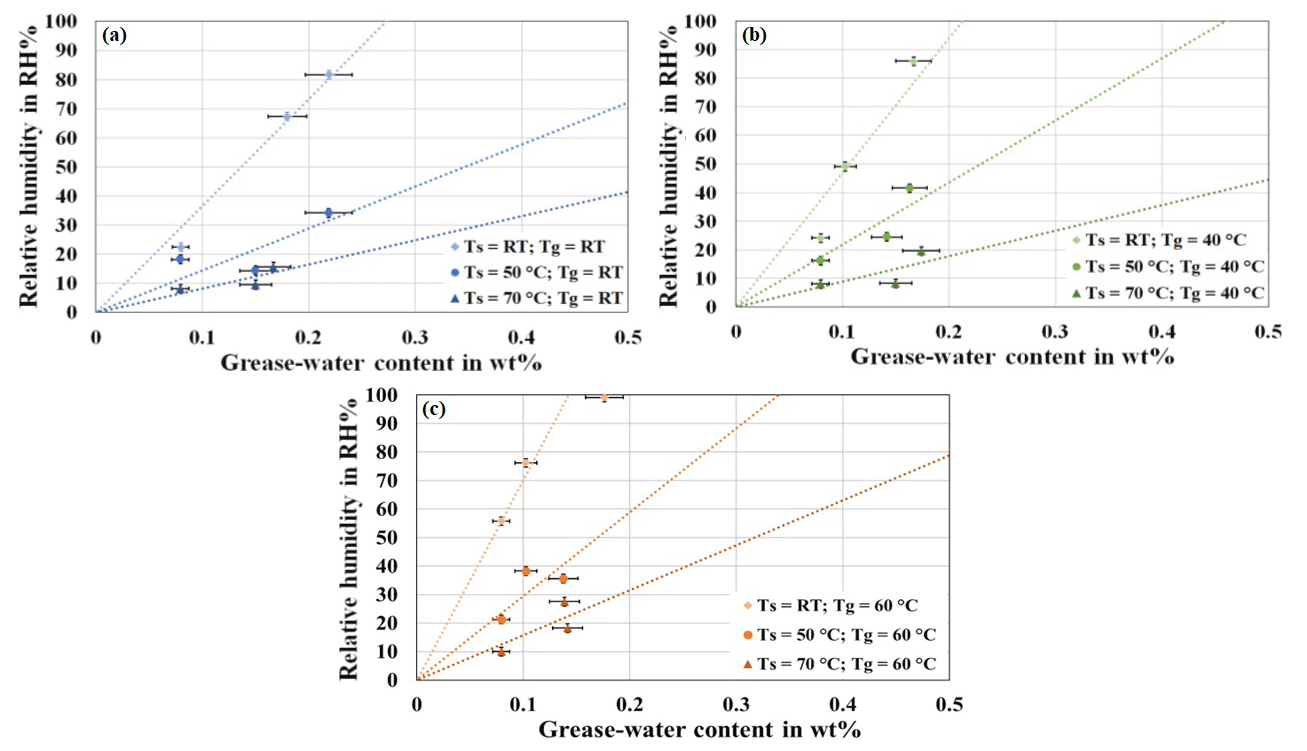
Figure 13Correlation between the grease-water content and the humidity sensor signal determined by dynamic measurements in the modified grease worker at a grease temperature (Tg) of (a) 25 °C (room temperature ) for sensor temperature (Ts) values of 25, 50, and 70 °C; (b) a Tg of 40 °C for Ts of 25, 50, and 70 °C; and (c) a Tg of 60 °C for Ts of 25, 50, and 70 °C. Dotted lines are used to guide the eyes.
3.2.3 Results of the complementary dynamic measurements using the bearing test rig
Complementary dynamic measurements were carried out in the bearing test rig with sensor 2 to account for a realistic operating environment (i.e. at the axle bearing of a railway wagon considered for HSAB). Figure 14a shows the correlation between the measured relative humidity and the grease-water content for the three investigated temperatures (see Sect. 2.5.3) of the test cell. For each measurement, two points are depicted for analysis using the Karl Fischer method: a grease sample from both the lower and upper bearing (see Fig. 8a). For the test cell temperature of 53 °C, only the first data point (at 0.2 wt %) was taken into account, as the second one (greater than 0.5 wt %) was already above the saturation point of the air at the sensor position. Consequently, the sensor showed nearly 100 RH %. The test at the bearing test rig confirmed the findings of the experiments at the grease worker: the temperature had a major effect on the humidity measurement. According to these findings, a robust procedure was established considering both the sensor and the grease temperature and grease circulation based on the measured trends (see the following). Like the consideration mentioned above, the correlation between the grease-water content and the absolute humidity could also be seen in the obtained results (see Fig. 14b).
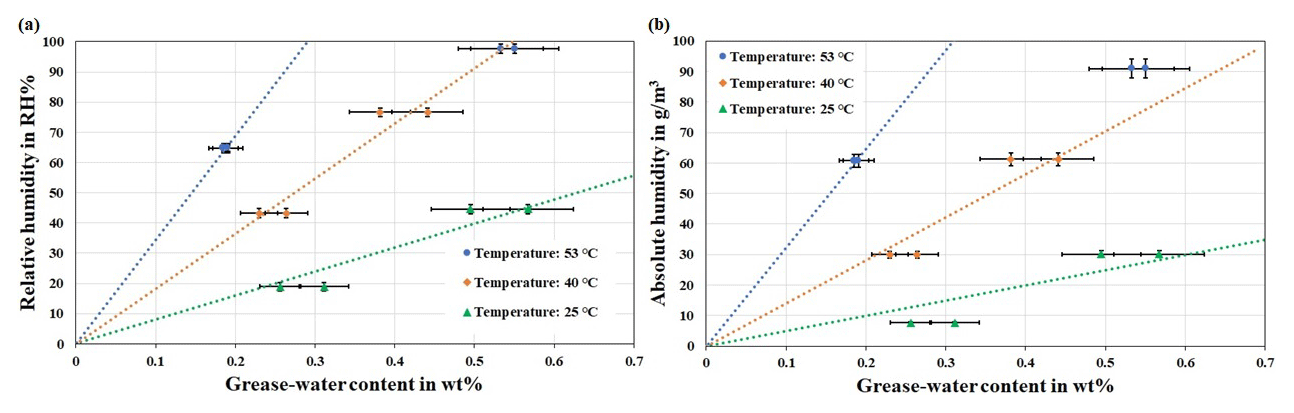
Figure 14Correlation between the grease-water content and the humidity sensor signals determined by dynamic measurements in the bearing test rig for test cell temperatures of 25, 40, and 53 °C: (a) correlation between the grease-water content and the relative humidity sensor signal; (b) correlation between the grease-water content and the absolute humidity sensor signal. Dotted lines are used to guide the eyes.
3.3 Methodology to calculate the grease-water content
As can be seen, both the static and dynamic measurements provided reliable data based on which a good correlation between the humidity measured by the sensor and the actual water content in the grease could be determined. The dynamic measurements revealed a sensor signal temperature dependence, which made it necessary to log temperatures (for both the sensor and the grease) simultaneously with humidity. Data from these experiments were used to create a robust empiric formula to correlate the water content in grease (wt %) and the relative humidity (RH %) measured by the sensor based on a multiple linear data regression model taking both the temperature of the grease (Tg in °C) and of the atmosphere at sensor position (Ts in °C) into account as follows:
The coefficients in Eq. (1) are characteristic shape (K) and scale (b and c) parameters that indicate the weight of the measured temperature and humidity data. The robustness of our regression model was checked using the cross-validation method. Therefore, the standard error of prediction (SEP) was calculated and considered to be adequate (Ojala and Garriga, 2010; Varmuza and Filzmoser, 2009), as the SEP amounts to 0.026. Figure 15 shows the correlation between the grease-water content and the relative humidity at different combinations of grease temperature (Tg) and temperature at the sensor (Ts) as calculated using the equation introduced above. The higher the grease temperature, the higher the relative humidity at the sensor position at a constant grease-water content and sensor temperature, as more water is evaporated from the grease to the atmosphere at the sensor position. Otherwise, the higher the temperature at the sensor, the lower the humidity at a constant grease-water content and grease temperature, as the relative humidity decreases at higher temperatures at the sensor position. In conclusion, for the determination of the grease-water content, the sensor signal of the relative humidity, the temperature of the atmosphere at the sensor, and the temperature of the grease are necessary.
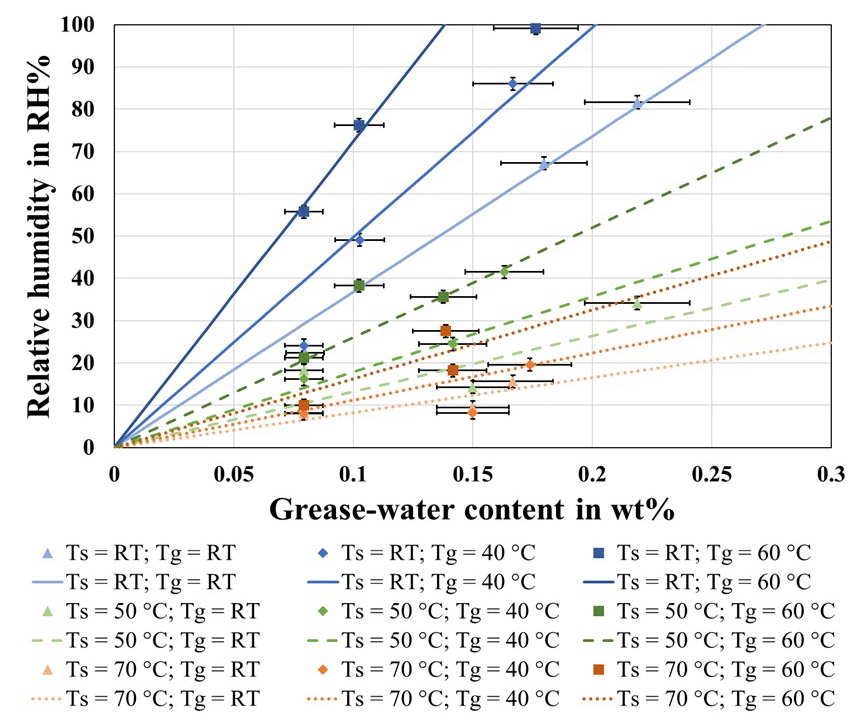
Figure 15Correlation between the grease-water content and the relative humidity at different grease temperature (Tg) and sensor temperature (Ts) values. Continuous and dotted lines are calculated based on the model (see Eq. 1).
In the present work, a concept for determining the grease-water content based on commercially available robust humidity sensors, considering the sensor and grease temperature, under rail vehicle operation conditions was presented. As the sensor elements are exposed to various types of loads (e.g. mechanical, thermal, and water/humidity loads) under field conditions, their robustness had to first be confirmed. Based on the lab-to-field approach, rapid development of the HSAB system up to the validation step in the relevant environment in the laboratory was reached, making it possible to move the robust sensor design to a higher development level while keeping the need for field demonstration at a lower level. As a result of the validation process in the laboratory, all of the investigated sensors passed the robustness tests, thereby confirming their suitability for rail applications.
Simultaneously, static and dynamic grease tests were performed in the laboratory to set up a relationship between the sensor relative humidity signal and the grease-water content at different grease and sensor temperatures. The clear correlations that could be established between the grease-water content and the sensor relative humidity confirmed the applicability of the HSAB system. These measurements have resulted in a robust methodology that can be used to properly determined the grease-water content under railway operation conditions. The presented approach can also be used for any other application in which a grease-lubricated component is used in a closed space, thereby offering the possibility to integrate a humidity sensor into the air-filled atmosphere above a grease-lubricated component so that direct contact with the grease is avoided. As the interaction between grease and water is strongly dependent on the grease composition, it is expected that the coefficients of the developed algorithm will have to be adapted for each grease type.
All in all, the reported methodology based on the lab-to-field approach provided relevant findings with respect to the robustness of both the hardware (i.e. HSAB system) and the software (i.e. algorithm), thereby enabling the comprehensive development of sensor systems. The next step is a field test on a railway wagon to demonstrate the functionality of the sensor-based monitoring of water in grease-lubricated axle box bearings on wheelsets for railway application. Besides the experiments for algorithm development, an extended temperature range experiment could also be carried out, including temperatures below 0 °C for both the grease and the sensor position, to validate the algorithm over a wider temperature range. For the future, there are two essential aspects to be achieved. First, the improvement of the methodology for the determination of the grease-water content established in the laboratory by using a temperature sensor to measure the grease temperature or to improve the temperature model to determine the grease temperature. Second, the implementation of trend analysis to move from condition-based maintenance (CBM) to predictive maintenance (PM) of lubricated components in rail vehicles.
The underlying measurement data may be requested from the authors if required.
KD: conceptualization; KD and CS: methodology; KD: experiments; KD and CS: data analysis; KD: writing; CS, ND, and US: critical reading and revision of the manuscript.
At least one of the (co-)authors is a member of the editorial board of Journal of Sensors and Sensor Systems. The peer-review process was guided by an independent editor, and the authors also have no other competing interests to declare.
The article reflects only the authors’ views and the Joint Undertaking is not responsible for any use that may be made of the information it contains.
Publisher’s note: Copernicus Publications remains neutral with regard to jurisdictional claims made in the text, published maps, institutional affiliations, or any other geographical representation in this paper. While Copernicus Publications makes every effort to include appropriate place names, the final responsibility lies with the authors.
This article is part of the special issue “Sensors and Measurement Science International SMSI 2023”. It is a result of the 2023 Sensor and Measurement Science International (SMSI) Conference, Nuremberg, Germany, 8–11 May 2023.
This work has received funding from the Shift2Rail Joint Undertaking (JU) under grant agreement nos. 826206, 881778, and 101004051. The JU receives support from the European Union's Horizon 2020 Research and Innovation programme and the Shift2Rail JU members other than the Union. Parts of the presented results (simulation of lubricant degradation) were acquired due to funding from the Austrian “COMET” programme (InTribology1, project no. 872176) via the Austrian Research Promotion Agency (FFG) and the federal states of Niederösterreich and Vorarlberg and due to work carried out at the Excellence Centre for Tribology (AC2T research GmbH). The authors thank PJ Messtechnik GmbH for their cooperation with respect to the system design and mechanical testing. Furthermore, the cooperation of Etteplan Embedded Finland Oy and TU Graz, Institut für Betriebsfestigkeit und Schienenfahrzeugtechnik, regarding the mechanical tests is acknowledged.
This research has been supported by the Österreichische Forschungsförderungsgesellschaft (grant no. 872176) and Horizon 2020 (grant nos. 826206, 881778, and 101004051).
This paper was edited by Michele Penza and reviewed by two anonymous referees.
Ametek Brookfield: Moisture in Oils: The Three-Headed Beast, https://www.brookfieldengineering.com/blogs/2015/april/moisture-in-oils-the-three-headed-beast (last access: 31 July 2023), 2015.
Ametek Brookfield: Computrac Vapor Pro XL Moisture Analyzer, https://www.brookfieldengineering.com/-/media/ametekbrookfield/azic/productsdownloads/moisture-testers/computrac-vapor-pro-xl/700-0133-c_manual-vapor-pro-xl.pdf?la=en&revision=9c2371c7-31f3-4c88-8088-4146dccd3ac6 (last access: 31 July 2023), 2018.
ASTM: D1744-13: Standard Test Method for Determination of Water in Liquid Petroleum Products by Karl Fischer Reagent, ASTM International, Philadelphia, United States, https://doi.org/10.1520/D1744-13, 2016a.
ASTM: D7546-15: Standard Test Method for Determination of Moisture in New and In-Service Lubricating Oils and Additives by Relative Humidity Sensor, ASTM International, Philadelphia, United States, https://doi.org/10.1520/D7546-09, 2016b.
ASTM: D217-21: Standard Test Methods for Cone Penetration of Lubricating Grease, ASTM International, Philadelphia, United States, https://doi.org/10.1520/D0217-21A, 2021a.
ASTM: D6304-20: Standard Test Method for Determination of Water in Petroleum Products, Lubricating Oils, and Additives by Coulometric Karl Fischer Titration, ASTM International, Philadelphia, United States, https://doi.org/10.1520/D6304-07, 2021b.
BSI: IEC 61373:2010: Railway applications – Rolling stock equipment – Shock and vibration tests, British Standards Institution (BSI), London, United Kingdom, ISBN 9780580, 2010.
BSI: BS EN 50155:2017: Railway applications – Rolling stock – Electronic equipment, British Standards Institution (BSI), London, United Kingdom, ISBN 9780580829116, 2017.
BSI: BS EN 60068 – Environmental testing, British Standards Institution (BSI), London, United Kingdom, https://doi.org/10.3403/BSEN60068, 2023.
Coronado, D. and Kupferschmidt, C.: Assessment and Validation of Oil Sensor Systems for On-line Oil Condition Monitoring of Wind Turbine Gearboxes, Proc. Tech., 15, 747–754, https://doi.org/10.1016/j.protcy.2014.09.047, 2014.
Dalgaç, Ş., Karadağ, F., Bakır, M., Akgöl, O., Ünal, E., and Karaaslan, M.: Chiral metamaterial-based sensor applications to determine quality of car lubrication oil, T. I. Meas. Control, 43, 1640–1649, https://doi.org/10.1177/0142331220976104, 2021.
Day, M. and Bauer, Ch.: Water Contamination in Hydraulic and Lube Systems, Machinery Lubrication, https://www.machinerylubrication.com/Read/1084/water-contamination-lube (last access: 30 July 2023), 2007.
DIN: DIN 51777-2:1974-09: Prüfung von Mineralöl-Kohlenwasserstoffen und Lösungsmitteln; Bestimmung des Wassergehaltes, nach Karl Fischer, Indirektes Verfahren, Deutsches Institut für Normung (DIN), Berlin, Germany, https://doi.org/10.31030/1257512, 4 pp., 1974.
DIN: DIN 51350-6: Determination of shear stability of polymer-containing lubricating oils by the Shell four-ball tester, Deutsches Institut für Normung (DIN), Berlin, Germany, DIN 51350-6:1996-08, https://doi.org/10.31030/7197668, 3 pp., 1996.
DIN: IEC 60068-2-38:2009: Environmental testing – Part 2-38: Tests – Test Z/AD: Composite temperature/humidity cyclic test, Deutsches Institut für Normung (DIN), Berlin, Germany, https://doi.org/10.31030/9719807, 15 pp., 2009.
DIN: DIN EN 12082:2017-12: Bahnanwendungen - Radsatzlager - Prüfung des Leistungsvermögens; Deutsche Fassung EN 12082:2017, Deutsches Institut für Normung (DIN), Berlin, Germany, https://doi.org/10.31030/2629145, 54 pp., 2017.
Dittes, N.: Water in Grease Condition Monitoring Literature Review, Report, Lulea° University of Technology, Lulea°, Sweden, 1–18, 2013.
Dittes, N. J.: Condition monitoring of water contamination in lubricating grease for tribological contacts, Licentiate thesis, Lulea° University of Technology, Lulea°, Sweden, 113 pp., 2016.
Dittes, N., Pettersson, A., Marklund, P., Lang, D., and Lugt, P.: Dielectric Thermoscopy Characterization of Water Contaminated Grease, Tribol. T., 61, 393–402, https://doi.org/10.1080/10402004.2017.1333664, 2018.
Dittes, N., Sjödahl, M., Pettersson, A., and Lang, D.: Corrosion Sensor for Water-Contaminated Grease, Tribol. T., 63, 891-896, https://doi.org/10.1080/10402004.2020.1770389, 2020.
Dubek, K., Dörr, N., Schneidhofer, C., and Schmid, U.: Robust Sensor System for Condition Monitoring of Lubricated Rail Vehicle Components, in: Proceedings of SMSI 2023 Conference, Sensor and Measurement Science International, Nuremberg, Germany, 8–11 May 2023, 102–103, https://doi.org/10.5162/SMSI2023/B3.2, 2023.
Ojala, M. and Garriga, G. C.: Permutation Tests for Studying Classifier Performance, J. Mach. Learn. Res., 1833–1863, https://doi.org/10.1109/ICDM.2009.108, 2010.
Fraunhofer ENAS: Grease Sensor for Condition Monitoring in Rolling Bearings, https://www.enas.fraunhofer.de/content/dam/enas/Dokumente/English/Downloads/factsheets/technologynotes_2020/GreaseSensor_EN_web.pdf (last access: 6 August 2023), 2011.
Karl, H. and Bots, S.: Humidity Saturation Limits of Hydraulic and Lubrication Fluids, Machinery Lubrication, https://www.machinerylubrication.com/Read/28697/humidity-saturation-limits (last access: 1 August 2023), 2011.
Kou, L., Sysyn, M., and Liu, J.: Influence of crossing wear on rolling contact fatigue damage of frog rail, Facta Universitatis Series Mechanical Engineering, Serbia, Nis, ISSN: 0354-2025, 2020.
Liu, Z., Liu, Y., Zuo, H., Wang, H., and Fei, H.: A lubricating oil condition monitoring system based on wear particle kinematic analysis in microfluid for intelligent aeroengine, Micromachines (Basel), 12, 748, https://doi.org/10.3390/mi12070748, 2021.
Maeda, K. and Takahashi, T.: Bearing with internal condition detecting function, JP Patent JP2007198576A, https://patents.google.com/patent/JP2007198576A (last access: 18 August 2023), 2004.
Mobley, R. K.: An introduction to predictive maintenance, Elsevier Science, Woburn, United States, 1–22, https://doi.org/10.1016/B978-075067531-4/50001-4, 2002.
Nicholas, G., Clarke, B. P., and Dwyer-Joyce, R. S.: Detection of Lubrication State in a Field Operational Wind Turbine Gearbox Bearing Using Ultrasonic Reflectometry, Lubricants, 9, 1-6, https://doi.org/10.3390/lubricants9010006, 2021.
Noria Corporation: How to Measure Water In Oil, Machinery Lubrication, https://www.machinerylubrication.com/Read/327/water-oil-analysis (last access: 29 July 2023), 2015.
Pall, M., Vesala, M., and Colly, O.: Setting Control Limits for Water Contamination In Hydraulic and Lube Systems, in: The Tenth Scandinavian International Conference on Fluid Power, Tampere, Finland, 21–23 May 2007, 7 pp., 2007.
Patocka, F., Schneidhofer, C., Dörr, N., Schneider, M., and Schmid, U.: Novel resonant MEMS sensor for the detection of particles with dielectric properties in aged lubricating oils, Sens. Actuators A Phys., 315, 112290–112303, https://doi.org/10.1016/j.sna.2020.112290, 2020.
Rao, X., Sheng, C., Guo, Z., and Yuan, C.: A review of online condition monitoring and maintenance strategy for cylinder liner-piston rings of diesel engines, Mech. Syst. Signal Pr., 165, ISSN 0888-3270, https://doi.org/10.1016/j.ymssp.2021.108385, 2022.
Rowe, G.: Moisture Determination of Lyophilized Materials by Relative Humidity Sensor Analyzer, https://www.brookfieldengineering.com/-/media/ametekbrookfield/azic/blogs/documents/aaps-2016-azi-computrac-poster-final.pdf?la=en&revision=cd183aa2-f247-42bc-bdf4-fb63b5a74e67&hash=C4CCDF04EC206620B1F6906476390C64 (last access: 11 August 2023), 2016.
Rowe, G. and Biamonte, Q.: Moisture Contamination and its Effect on the Remaining Useful Life of Bearings, Arizona Instrument LLC, https://upisecke.za.net/Arizona_Instrument_relative_humidity_instrument.pdf (last access: 6 August 2023), 2016.
Schaeffler Technologies: Condition Monitoring of Greases in Rolling Bearings Demand-controlled relubrication by means of grease analysis during operation, https://www.schaeffler.de/remotemedien/media/_shared_media/08_media_library/01_publications/schaeffler_2/reprint/downloads_16/rp_ssd_21_de_en.pdf (last access: 10 August 2023), 2013.
Schneidhofer, C., Grafl, A., and Adam, K.: Online Zustandsüberwachung von Hydraulikölen in der Stahlindustrie, BHM Berg- und Hüttenmännische Monatshefte, 163, 193–198, https://doi.org/10.1007/s00501-018-0707-y, 2018.
Schneidhofer, C., Dörr, N., and Dubek, K.: Robust sensors enabling condition-based maintenance of lubricated components in locomotives and wagons, Transportation Research Procedia (TRA) Conference, 72, 3236–3243, https://doi.org/10.1016/j.trpro.2023.11.866, 2022.
Spectro Scientific: Guide to Measuring Water in Oil, https://www.spectrosci.com/-/media/project/ameteksxa/spectroscientific/ametekspectro/industries/e-guides/wp_measuring-water-in-oil_proof3.pdf?la=en&revision=e7eb3b7c-c639-4e1c-a1b7-fdcad0f54c00&hash=518253C8396869B6750E7FEE97CF2D97 (last access: 4 August 2023), 2015.
Sysyn, M., Kluge, F., Gruen, D., Kovalchuk, V., and Nabochenko, O.: Experimental Analysis of Rail Contact Fatigue Damage on Frog Rail of Fixed Common Crossing 1:12, J. Failure Anal. Prevent., 19, 1077–1092, https://doi.org/10.1007/s11668-019-00696-w, 2019.
Takehara, T. and Wakabayashi, T.: Rolling bearing and sensor for rolling bearing, JP Patent 2008121863A, https://patents.google.com/patent/JP2008121863A (last access: 18 August 2023), 2005.
TE Connectivity: HTM2500LF – Temperature and Relative Humidity Module, https://appliedmeasurement.com.au/product/temperature-humidity-module/ (last access: 7 August 2023), 2019.
Testo: Datasheet Testo 174 H mini data logger, https://static-int.testo.com/media/fd/45/c64e026040db/testo-174H-Data-sheet.pdf (last access: 5 August 2023), 2021.
Varmuza, K. and Filzmoser, P.: Introduction to multivariate statistical analysis in chemometrics, CRC Press, 321 pp., Florida, United States, ISBN 978-1-4200-5947-2, 2009.
Zhu, X., Zhong, C., and Zhe, J.: Lubricating oil conditioning sensors for online machine health monitoring – A review, Tribol. Int., 109, 473–484, https://doi.org/10.1016/j.triboint.2017.01.015, 2017.
Zürcher, C. and Frank, T.: Bauphysik: Leitfaden für Planung und Praxis, Vieweg+Teubner Verlag, Zürich, Switzerland, 55–56, ISBN 978-3-519-05051-3, 1998.