the Creative Commons Attribution 4.0 License.
the Creative Commons Attribution 4.0 License.
 | 21 Oct 2025
Development and analysis of microbridge resonators for reduced pull-in voltage and preserved resonant frequency
Haleh Nazemi
Michael Schembri
Youssef Elnemr
This study presents a novel design methodology for microbridge resonators aimed at reducing pull-in voltage while maintaining resonant frequency. Previous studies have primarily focused on adjusting resonator plate geometry, modifying anchor conditions, or altering material properties to control pull-in voltage. In contrast, this work introduces the ratio of the bottom electrode length to the microbridge length as a critical and tunable design parameter, which has remained unexplored in previous studies. An analytical model is developed to capture the effects of this ratio, and its predictions are validated through finite element analysis. To demonstrate the concept, two microbridges are designed and fabricated with bottom electrode lengths of 42 and 82 µm, corresponding to 35 % and 68 % of the microbridge length, respectively. All other design parameters, such as plate thickness, material properties and cavity height, are kept constant to enable a fair comparison. Electrical characterizations confirm that increasing the bottom electrode-to-microbridge length ratio effectively lowers the pull-in voltage without degrading resonator performance. Results show a 16 % reduction in pull-in voltage when the bottom electrode length is 68 % of the microbridge length, demonstrating the feasibility and advantages of the proposed methodology over existing techniques.
- Article
(3515 KB) - Full-text XML
- BibTeX
- EndNote


Capacitive resonators are potential candidates for applications requiring the detection of low-concentration masses due to their high mass sensitivity (Kumar et al., 2024; Nathani et al., 2020; Lee et al., 2010). This sensitivity originates from their ability to convert mass variations into detectable shifts in resonant frequency, facilitating quantification of small mass changes on a zeptogram scale (Lee et al., 2010). It has been well established that capacitive resonators operating at higher resonant frequencies exhibit enhanced mass sensitivity (Nathani et al., 2020; Park et al., 2018). However, despite their advantages, utilization of capacitive resonators is constrained by the requirement for high pull-in voltages, which limits their applications. Higher resonant frequencies are often attributed to smaller deflectable plate dimensions, which further increase the required voltage to operate. This challenge highlights the need for design approaches that reduce the pull-in voltage while maintaining the resonant frequency to preserve sensitivity. To address this limitation, previous studies have focused on strategies such as employing patterned top plates and bottom electrodes, particularly in circular resonator geometries or boundary effects (Yaşar et al., 2019; O'Mahony et al., 2003). However, other geometries, such as microbridge resonators, remain underexplored despite their applicability in the detection of low-concentration masses. The limited research in this area highlights a gap in the current knowledge regarding the impact of electrode size and pattern on the performance characteristics of these resonators.
In this study, an analytical model is developed to systematically investigate the ratio between the microbridge length and the bottom electrode length as a key design parameter. This ratio directly influences the electrostatic forces and stiffness characteristics of the resonator, thereby playing a crucial role in determining both the pull-in voltage and the resonant frequency (Lin and Ying, 2008). To demonstrate the impact of the ratio between the microbridge length and the bottom electrode length on the resonators performance, microbridge resonators are designed with a range of ratios from 10 % to 100 % and are further compared with the results obtained from the developed analytical model. To prove the idea, these microbridge resonators are fabricated and electrically characterized.
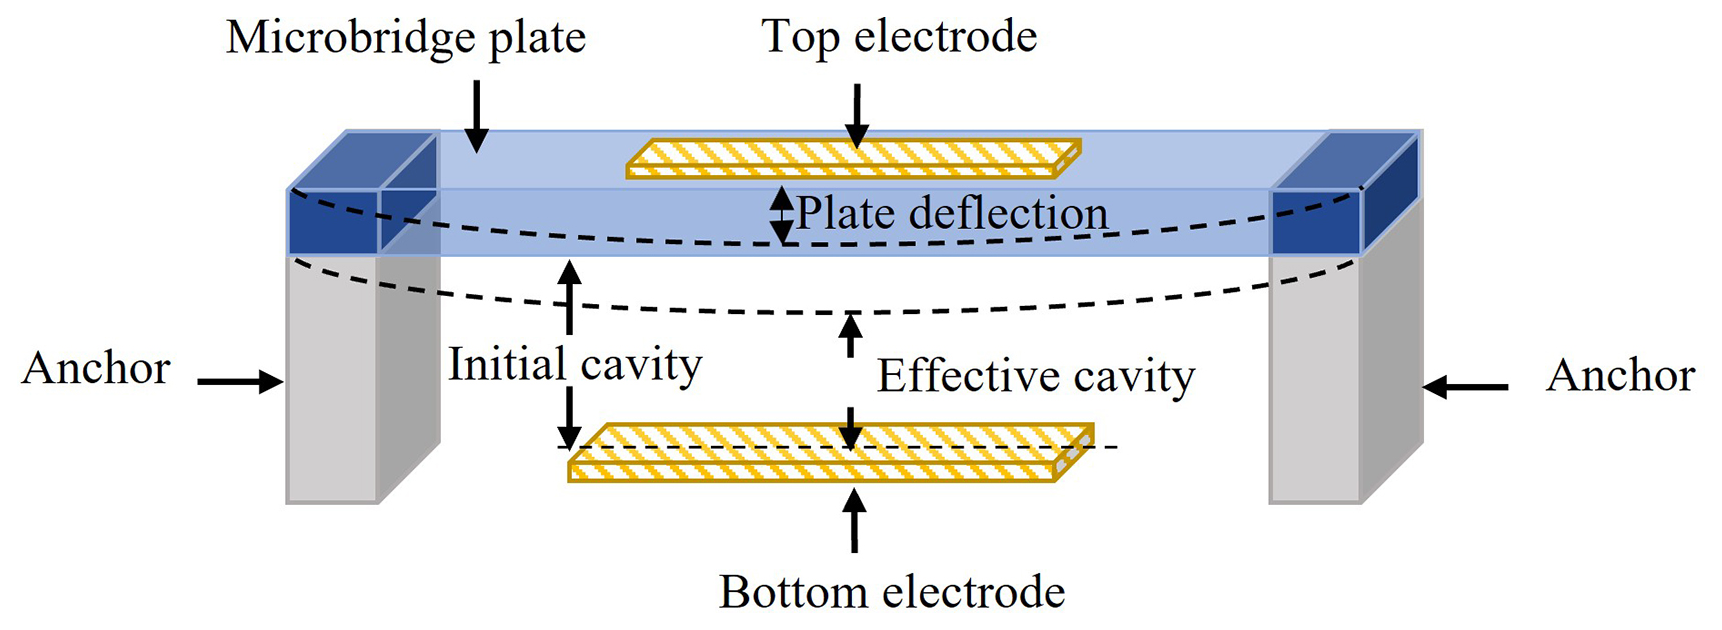
Microbridge resonators consist of a flexible plate anchored at both ends, suspended above a fixed bottom electrode with a cavity in between, as illustrated in Fig. 1. When a DC voltage is applied, the microbridge deflects toward the bottom electrode, resulting in a change in the device's capacitance. The resonant frequency of the microbridge is determined using Eq. (1) (Nathani et al., 2020).
where k and m represent stiffness and mass of the microbridge, respectively.
The applied DC voltage influences the effective stiffness of the microbridge through an electrostatic spring softening effect. As the voltage increases, the electrostatic attractive force between the bridge and the bottom electrode rises, effectively reducing the restoring mechanical stiffness of the structure (Abdel-Rahman et al., 2002; Nathani et al., 2020). This voltage-dependent reduction in stiffness can slightly affect the resonant frequency of the device. In addition, the applied voltage introduces an initial tensile stress, or pre-stress, in the microbridge due to static deflection, modifying its tension distribution and consequently influencing the microbridge behavior. This static deflection also imposes a change in the initial shape of the microbridge, altering its deformation profile, which further affects its dynamic characteristics and vibration response. The combined effects of electrostatic softening, voltage-induced pre-stress, and the change in initial shape should be considered when analyzing the voltage-dependent resonant response of microbridge resonators (Abdel-Rahman et al., 2002).
To maintain structural stability while operating in optimum conditions, the applied voltage must remain close to but below the resonator pull-in voltage (Nathani et al., 2020; Yaşar et al., 2019). Exceeding the pull-in voltage increases the electrostatic force, leading to a collapse of the microbridge onto the bottom electrode.
In the absence of an analytical model that explicitly captures the influence of electrode dimensions on both the resonant frequency and pull-in voltage of microbridges, this work introduces an analytical model that incorporates the ratio of the bottom electrode length to the microbridge length as a design parameter.
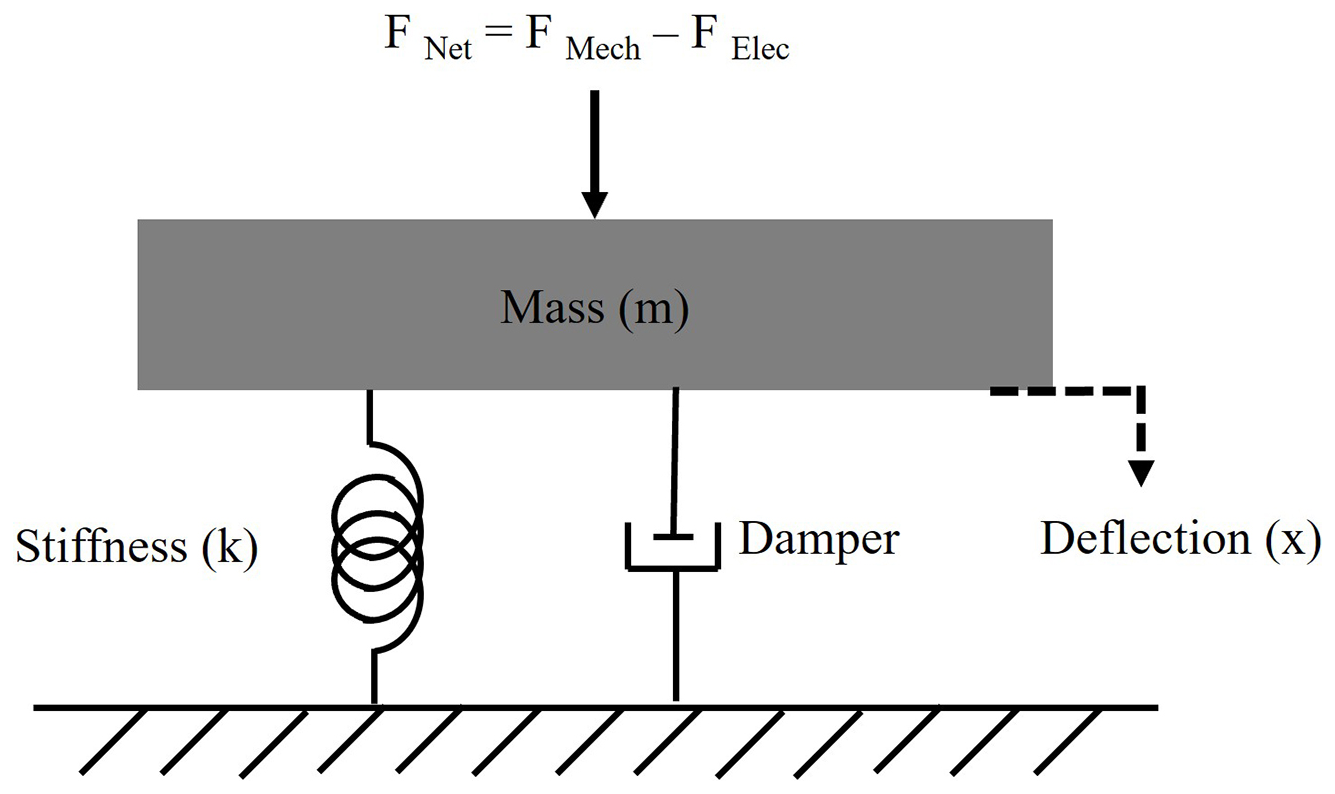
To characterize the behavior of the microbridge, a mass–spring–damper model is adopted, as depicted in Fig. 2. The microbridge is assumed to exhibit linear elastic deformation under small deflections (Bouchaala et al., 2017; Ventsel and Krauthammer, 2001), where a uniform electrostatic force acts on a homogeneous and isotropic top plate. The model parameters include the spring constant, k, which characterizes the stiffness of the microbridge; the mass of the plate, represented by m; and the damping term, which accounts for energy dissipation due to the surrounding medium. The relationship between the electrostatic force and the restoring mechanical force is governed by Hooke's law of elasticity (Batra et al., 2007; Hussein and Younis, 2020; Rebeiz, 2003), where the net force, FNet, is derived as the difference between these opposing forces.
The expression for the stiffness of a microbridge subjected to a distributed vertical load, shown in Fig. 3, can be derived by analyzing the deflection of the microbridge under static equilibrium.
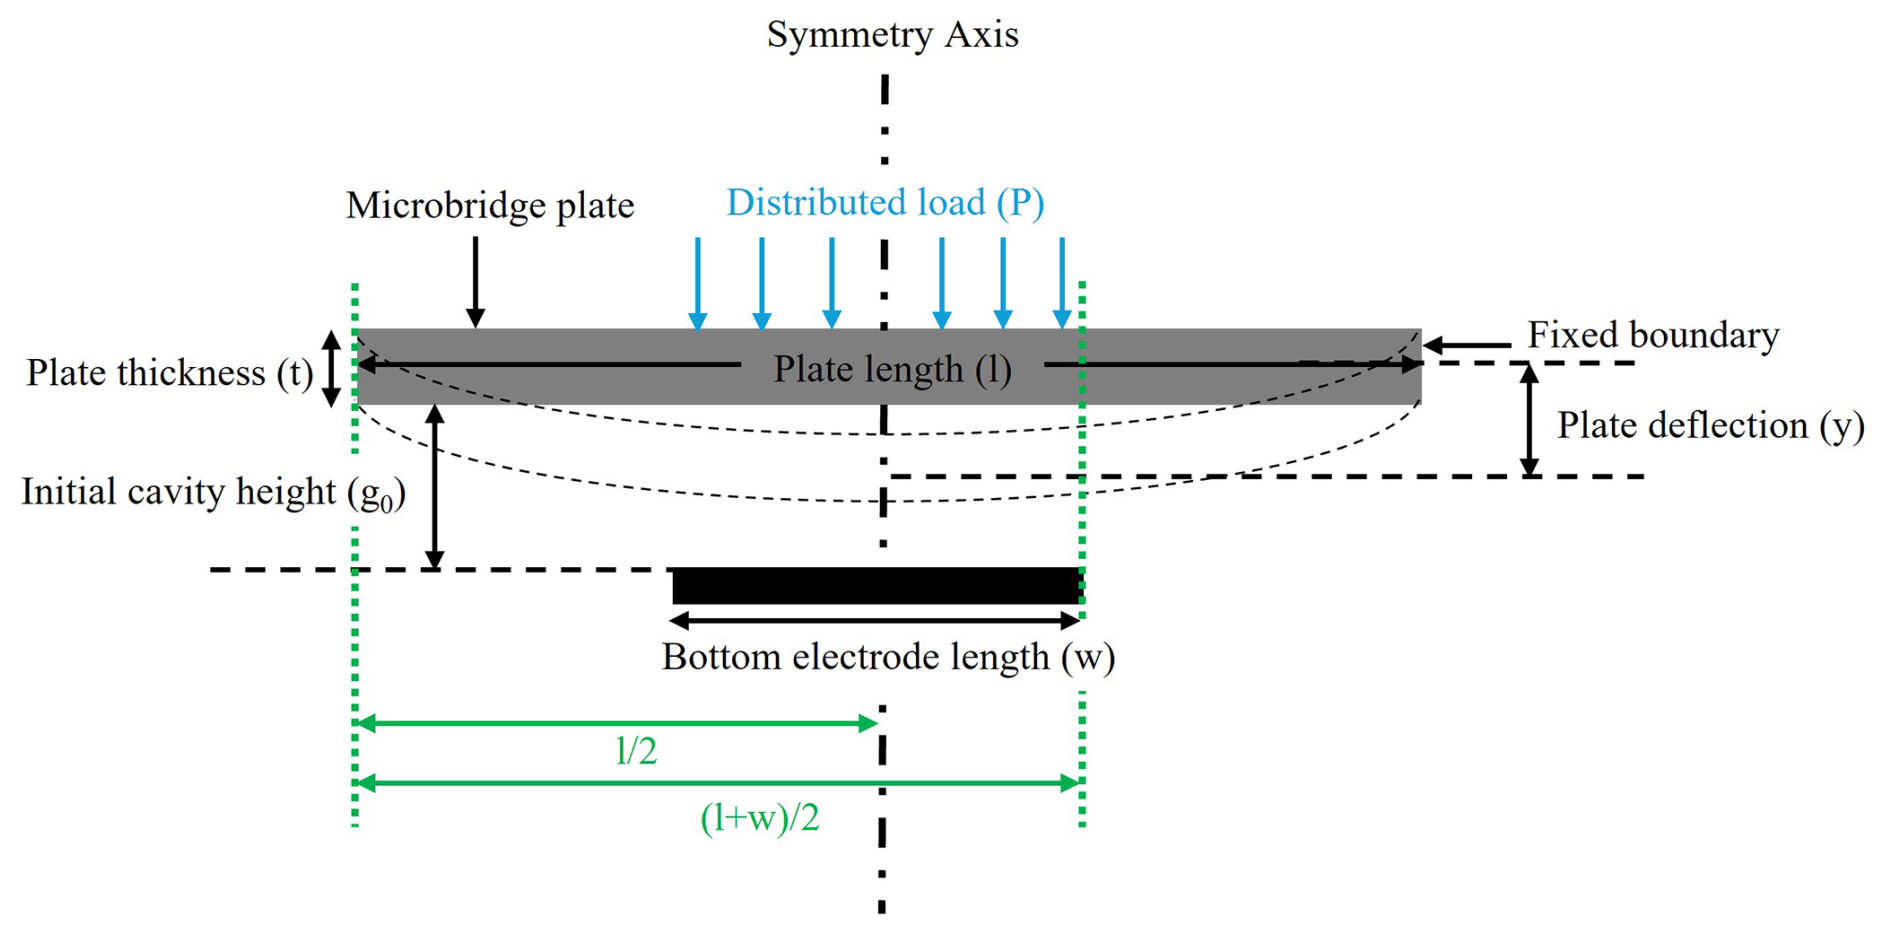
Figure 3Schematic side view of a microbridge plate showing the applied force between the plate and the bottom electrode.
Assuming the microbridge's plate and the bottom electrode share the same width, b, the model can be simplified to a two-dimensional case of a beam fixed at both ends with a distributed load acting where the bottom electrode is located. If the bottom electrode is placed symmetrically, the resulting beam deflection is also symmetrical, reaching its maximum at the midpoint.
M and R represent the internal reaction moment and force, respectively, at the fixed ends of the microbridge plate. These values are determined by the applied distributed load, P. Based on these parameters, the deflection profile of the beam can be described by the differential equation given in Eq. (2) (Rebeiz, 2003).
In Eq. (2), E is the Young's modulus, x is the position along the beam, and I is the second-moment inertia, which can be calculated using Eq. (3).
In this equation, b and t represent the microbridge's width and thickness, respectively.
The stiffness can then be defined as presented in Eq. (4).
where ymax is the maximum deflection and F is the equivalent force due to the distributed load, P, as shown in Fig. 3. The equivalent force can be calculated using Eq. (5).
where w represents bottom electrode's length.
The deflection profile is obtained by integrating the deflection profile equation, Eq. (2), over the range from to . The integration limits are selected to account for the electrostatic force distribution in the overlapped area between the microbridge plate and the bottom electrode. Since the structure is symmetrical, the integral is multiplied by 2, which yields Eq. (6).
Using Eq. (6), the maximum deflection at the midpoint of the microbridge's plate can be calculated and employed in Eq. (4) to derive the effective spring constant under the distributed load when the DC bias voltage is applied, shown in Eq. (7).
This model simplifies the analysis by neglecting parasitic capacitance and by assuming a constant height between the top plate and the bottom electrode, indicating no initial deflection resulting from fabrication or intrinsic stress. By incorporating the electrode length ratio, the model effectively captures the influence of electrode dimensions on the device's pull-in voltage and resonant frequency. This approach provides a more detailed representation of the geometric and electromechanical interactions governing microbridge performance while also accounting for the softening effect induced by the applied DC voltage. The proposed stiffness equation is shown in Eq. (7) (Nazemi et al., 2024).
The model consists of two terms: the first accounts for the microbridge's dimensions and material properties, while the second represents the softening effect arising from the electrostatic force generated across the cavity by the applied voltage.
In this equation, the microbridge's dimensions of width, thickness, length, and area are represented by b, t, l, and A, respectively. Material properties and geometric parameters include Young's modulus E, the permittivity of free space ε0, and the bottom electrode length w. The applied DC voltage is denoted VDC, while g0 represents the initial cavity height between the microbridge and the bottom electrode. Using Eq. (2), the electrostatic force distribution along the microbridge can be modified to effectively reduce the pull-in voltage while maintaining the resonant frequency.
COMSOL Multiphysics is employed to design the proposed microbridges with varying ratios of bottom electrode length to microbridge length. The effect of this ratio on the operating pull-in voltage of the microbridges is analyzed using the solid mechanics and electrostatics modules in COMSOL. For this study, polysilicon is selected as the material for the microbridge plate, with a Young's modulus of 160 GPa, a Poisson's ratio of 0.22, and a density of 2320 kg m−3. To ensure consistency and enable a fair comparison, the microbridge thickness, width, and the cavity height are set to 1.5 µm, 40 µm, and 750 nm, respectively, across all designs. To demonstrate the influence of the electrode length ratio on the pull-in voltage, the analysis is conducted over a range of ratios from 10 % to 100 %.
To evaluate the performance of the proposed microbridges, the electromechanical coupling coefficient, , is used as a key indicator. This coefficient quantifies the efficiency of energy conversion between electrical and mechanical domains within the device and can be calculated using Eq. (8) for a parallel-plate capacitor, where y represents deflection (Yaralioglu et al., 2003).
As described in Eq. (8), is directly influenced by the deflection of the resonator plate, increasing as the plate displacement grows. When the plate's deflection reaches the point of collapse onto the bottom electrode, reaches its theoretical upper limit of 1. The simulated for the proposed microbridges is presented in Fig. 4. The finite element simulations are performed assuming atmospheric air conditions at room temperature. Furthermore, a tetrahedral meshing grid is used, and a mesh independence study confirms that the resonant frequency remains stable with respect to the element size. The figure shows the relationship between and the voltage for various electrode length ratios with respect to the pull-in voltage at a 10 % ratio of the electrode length. As the electrode length ratio increases, the coupling coefficient becomes more sensitive to voltage changes, exhibiting a steeper rise. The curves indicate enhanced coupling efficiency with larger electrode length ratios, reaching a maximum at a 100 % ratio.
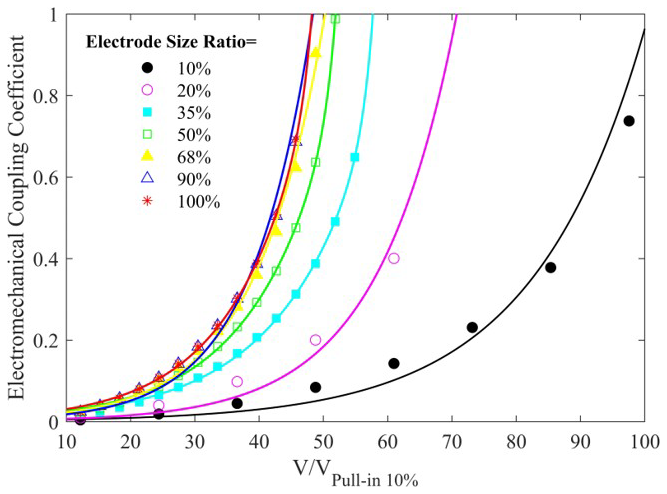
Figure 4Electromechanical coupling coefficient of microbridges with a bottom electrode-to-microbridge length ratio ranging from 10 % to 100 % versus pull-in voltage. The polysilicon microbridge plate has dimensions of 120 µm in length, 40 µm in width, and 1.5 µm in thickness, with the cavity height set to 750 nm.
To validate the concept, two proposed microbridges are fabricated using a commercially available sacrificial fabrication process. The fabricated microbridges have dimensions of 120 µm × 40 µm, with bottom electrode lengths of 42 and 82 µm, corresponding to 35 % and 68 % of the microbridge plate length. Similarly to the width of the microbridge plate, the bottom electrodes in both designs are set to 40 µm to enable a fair comparison. The fabrication process follows the PolyMUMPs multi-user fabrication protocol (Koester et al., 2003). These specific dimensions are selected in consideration of the constraints of the accessible PolyMUMPs fabrication process to demonstrate the concept; however, the proposed approach remains compatible with various fabrication technologies.
A schematic side view of the designed microbridge resonator, created using the L-Edit CAD tool, is presented in Fig. 5 and illustrates the layers involved in the PolyMUMPs process. The fabrication process begins with a doped silicon substrate insulated by a 60 nm silicon nitride layer. Low-pressure chemical vapor deposition (LPCVD) deposits three polysilicon layers (P0, P1, P2) with thicknesses of 500 nm, 2 µm, and 1.5 µm, respectively, separated by phosphosilicate glass (PSG) deposited via LPCVD (Koester et al., 2003).
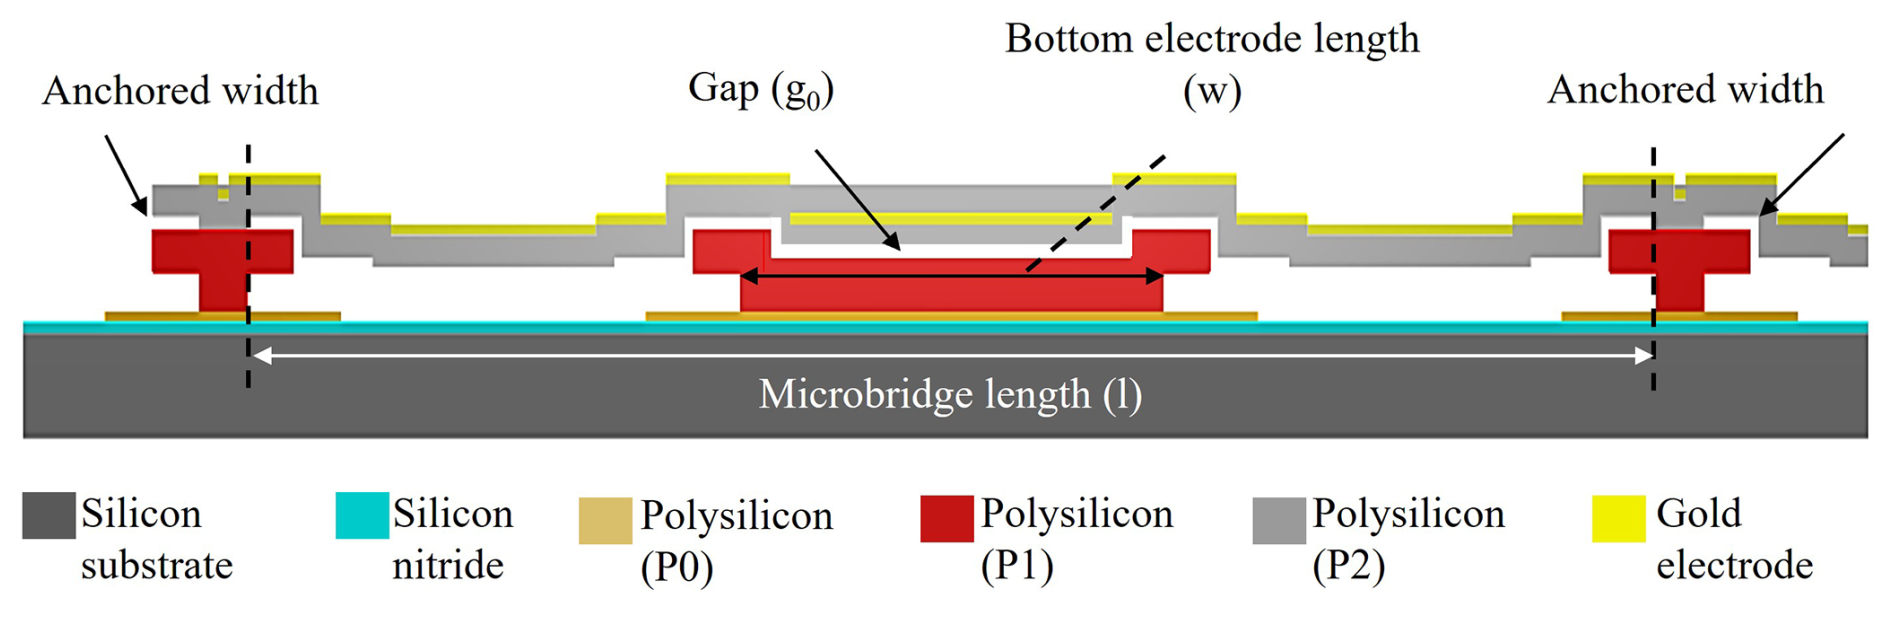
Figure 5Schematic side view of the designed microbridge resonator using the L-Edit CAD tool.
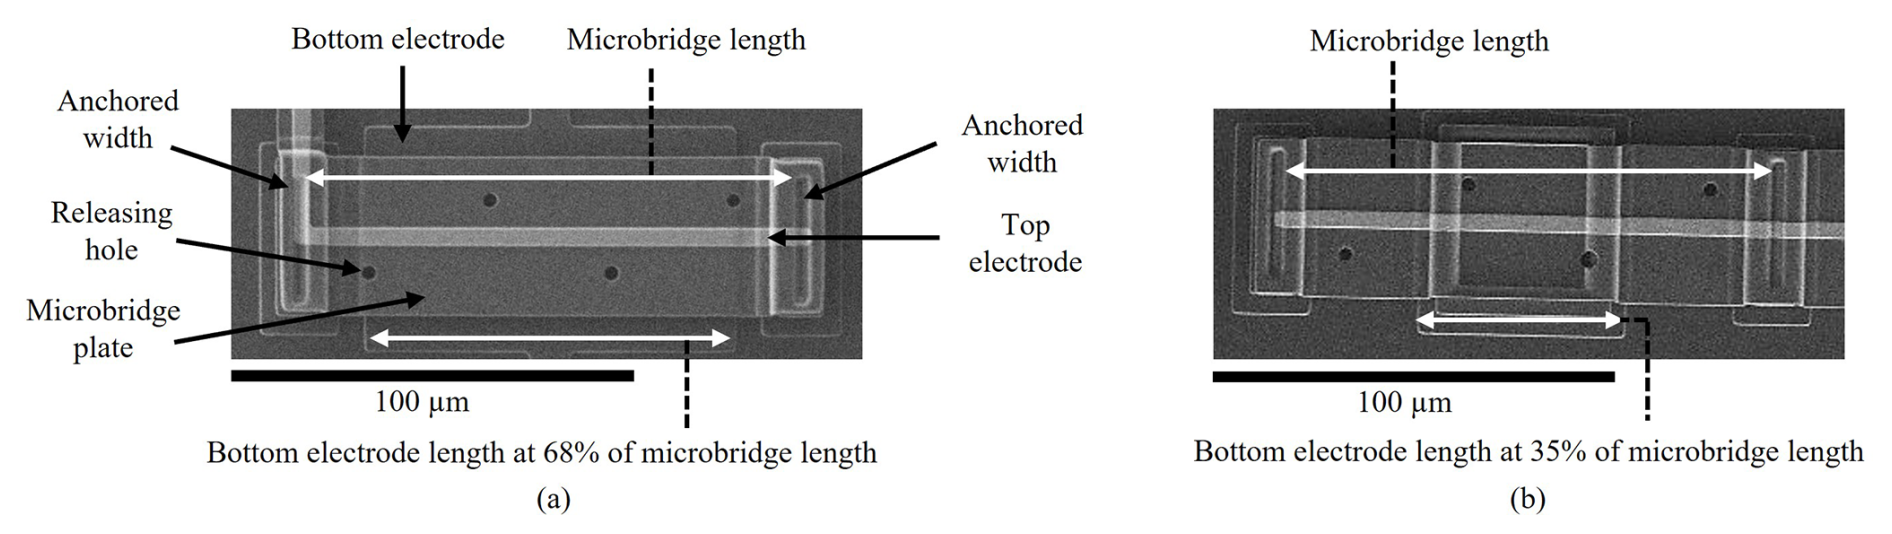
Figure 6SEM images of the developed microbridge resonators with the bottom electrode length at (a) 68 % of the microbridge length and (b) 35 % of the microbridge length.
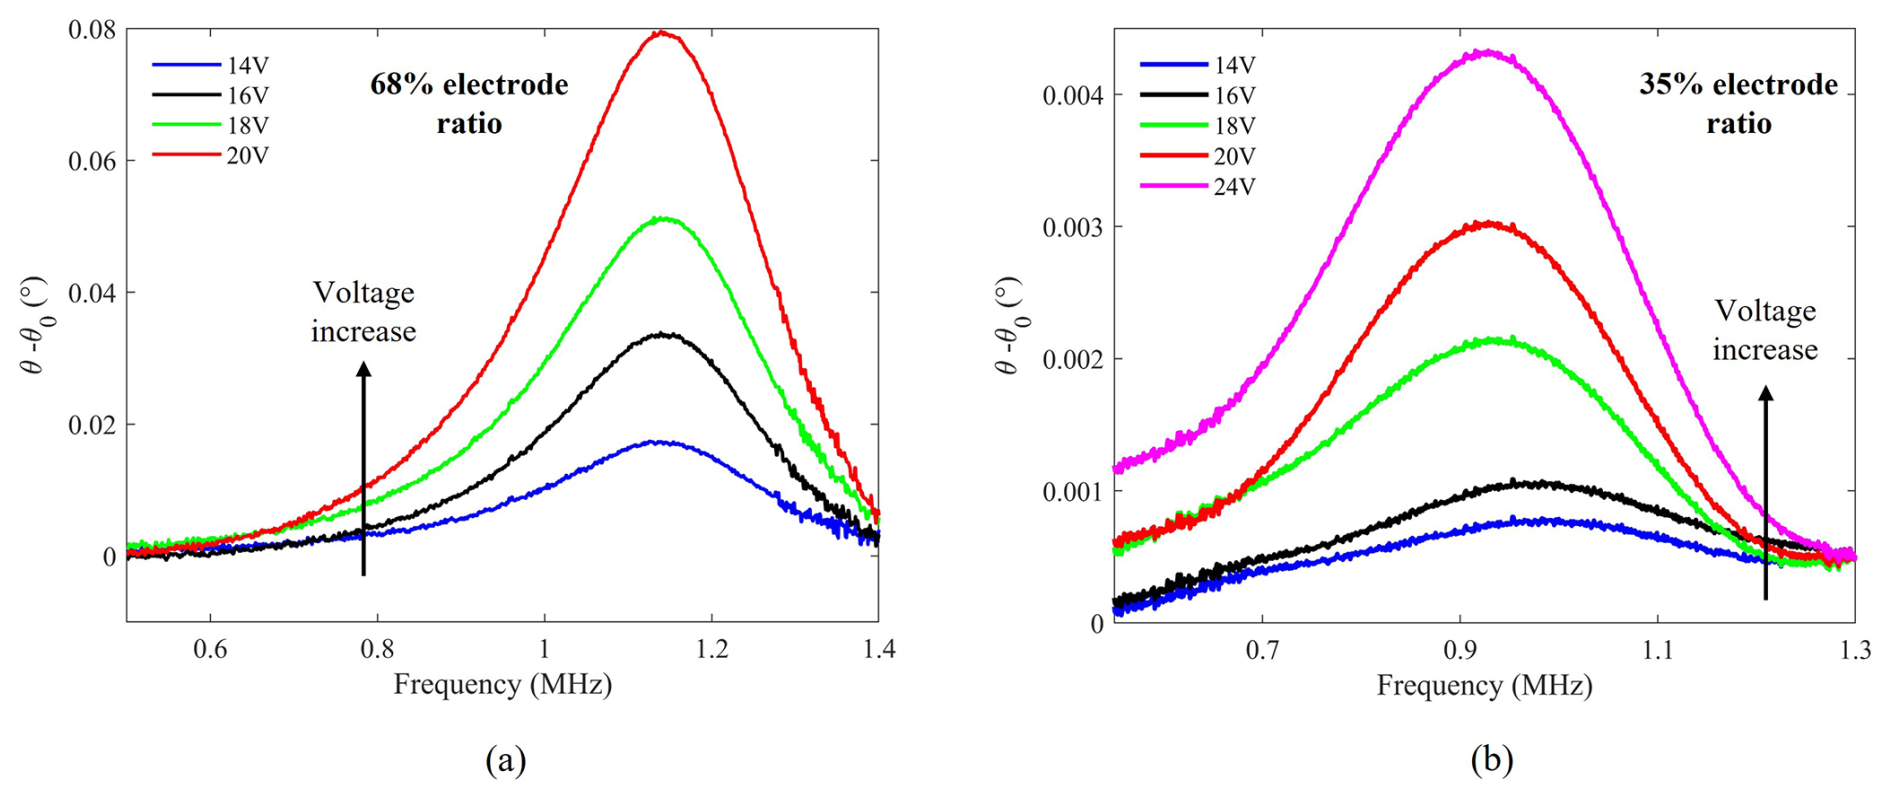
Figure 7Measured resonant frequency versus applied DC voltage for microbridges with (a) a 68 % ratio and (b) a 35 % ratio of the bottom electrode length to the microbridge plate length, using a Keysight E4990A impedance analyzer. The polysilicon microbridge plate has a length of 120 µm and a width of 40 µm. The plate thickness and cavity height are 1.5 µm and 750 nm, respectively.
A 520 nm gold layer, forming the top electrode, is deposited on the final polysilicon layer via sputtering. The first polysilicon layer acts as the bottom electrode. Hydrofluoric acid (HF) etches the sacrificial layers, completing the fabrication. Scanning electron microscopy (SEM) images of microbridge resonators with bottom electrode lengths at 68 % and 35 % of the microbridge plate length are shown in Fig. 6a and b. For consistent analysis of the bottom electrode-to-microbridge plate length ratio, all design parameters including microbridge plate width and thickness, the cavity height, and the material properties remain unchanged.
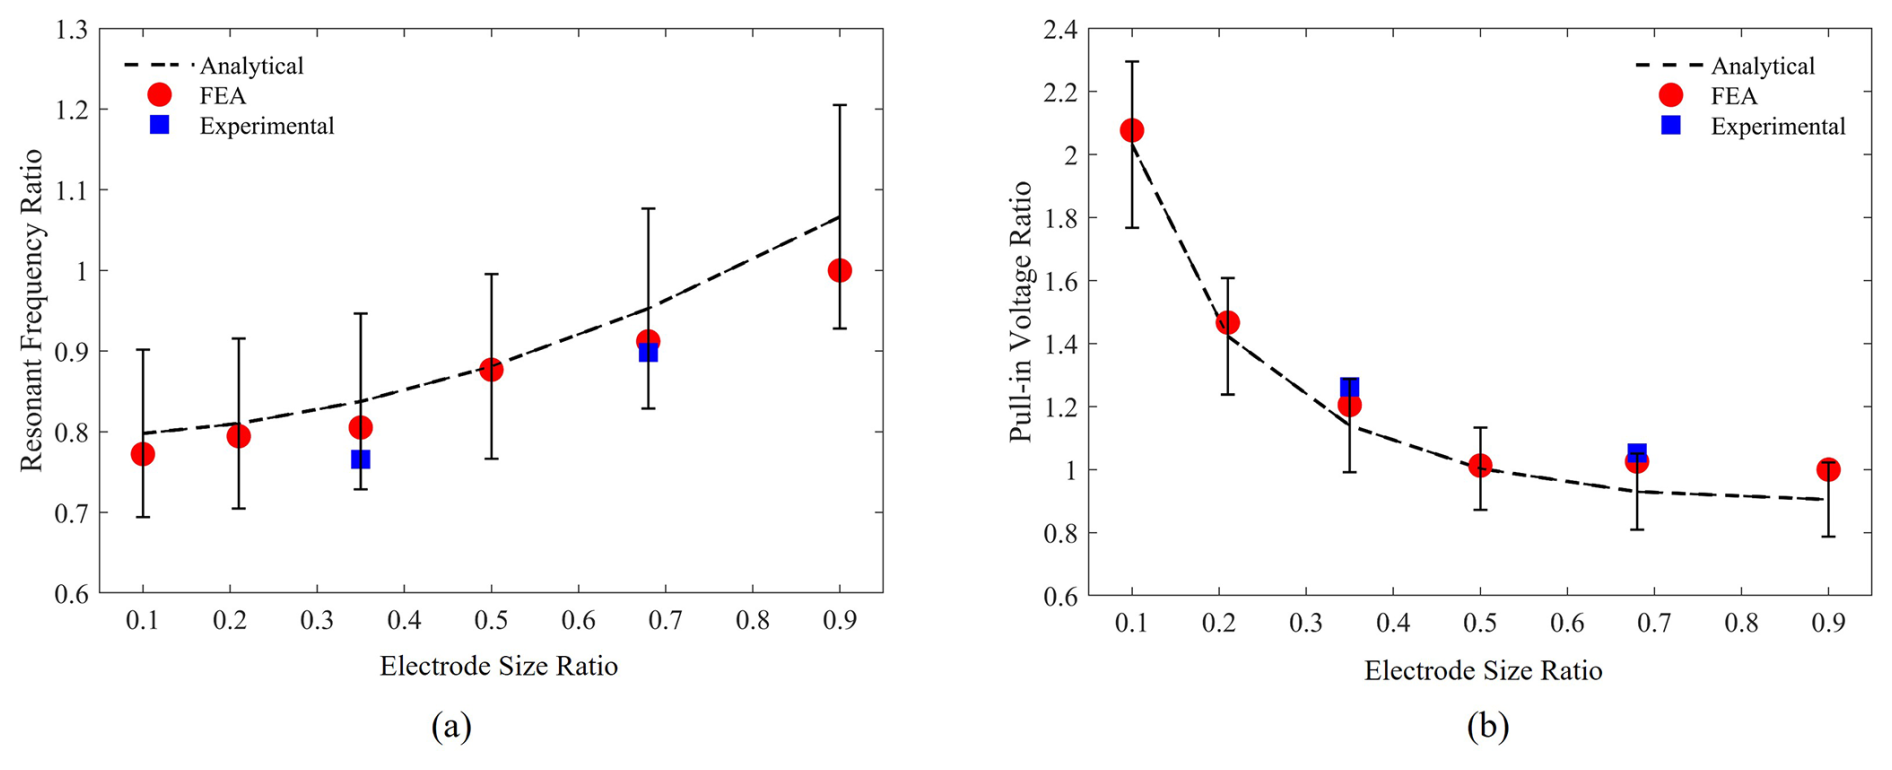
Figure 8Effect of the electrode length ratio on (a) resonant frequency and (b) pull-in voltage, normalized by FEA at a 90 % electrode ratio. The error bars indicate uncertainties arising from the fabrication process and the measurement equipment, with fabrication uncertainties being the dominant factor.
The fabricated microbridges are characterized using a Keysight E4990A impedance analyzer with a 500 mV AC signal superimposed on a swept DC bias voltage, incrementally increased by 1 V steps up to each device's pull-in voltage. All measurements are conducted under standard laboratory conditions at room temperature and atmospheric pressure. The resonant frequency is extracted from the measured phase at each applied voltage, using the phase at 5 V DC as a baseline, and the results are shown in Fig. 7. Measured pull-in voltages are 25 and 21 V for microbridges with 35 % and 68 % ratios, respectively. As demonstrated in Fig. 7, measured resonant frequencies for the microbridges with 35 % and 68 % electrode ratios are 980 kHz and 1.1 MHz, respectively, and the amplitude of the frequency response grows as the applied DC voltage increases. Figure 7 shows that the microbridge with a 68 % electrode ratio exhibits larger frequency response amplitudes, suggesting that larger electrode ratios enhance electromechanical coupling at higher voltages.
The effect of the electrode length ratio on the resonant frequency and pull-in voltage is evaluated. Comparisons between the presented analytical model, the conducted simulations using COMSOL Multiphysics, the electrical characterization for the pull-in voltage, and the resonant frequency of the proposed microbridges are shown in Fig. 8.
The simulation results closely match the experimental data, as shown in Fig. 8, confirming the validity of both the analytical model and the experimental approach. The trends in Fig. 8 indicate that as the electrode length ratio increases, the resonant frequency grows while the pull-in voltage decreases, highlighting the effect of the bottom electrode length with respect to the microbridge length.
This work introduces a critical design parameter for microbridge resonators, focusing on the impact of the ratio between microbridge length and bottom electrode length on reducing pull-in voltage while preserving resonant frequency. An analytical model, validated by FEA and experimental results, demonstrates that increasing the ratio of bottom electrode length to the length of the microbridge significantly reduces pull-in voltage without compromising performance. A 16 % reduction in pull-in voltage is achieved in a microbridge with a 68 % ratio, compared to a 35 % ratio, when the change in the resonant frequency is within ±120 kHz. Future work will focus on the optical evaluation of microbridge deflection, electrode patterning, and refining the electrode length to microbridge length ratio for improved performance.
The software code used in this study was developed in-house for data analysis and device characterization and is not publicly available. COMSOL Multiphysics was used for simulations under a research license, and all post-processing was performed using MATLAB. All codes were developed within and remain the property of the e-Minds Research Lab at the University of Windsor.
The data supporting this study were generated through experiments conducted in the e-Minds Research Lab at the University of Windsor. The data are not publicly available due to institutional confidentiality and ongoing research activities but can be made available from the corresponding author upon reasonable request. No third-party or publicly available datasets were used in this work.
HN, MS, and YE wrote the manuscript draft and performed the measurements; AE supervised.
The contact author has declared that none of the authors has any competing interests.
Publisher's note: Copernicus Publications remains neutral with regard to jurisdictional claims made in the text, published maps, institutional affiliations, or any other geographical representation in this paper. While Copernicus Publications makes every effort to include appropriate place names, the final responsibility lies with the authors. Views expressed in the text are those of the authors and do not necessarily reflect the views of the publisher.
This article is part of the special issue “Eurosensors 2024”. It is a result of the EUROSENSORS XXXVI, Debrecen, Hungary, 1–4 September 2024.
The authors acknowledge the support of CMC Microsystems for providing access to design and fabrication resources.
This work was supported in part by the Natural Sciences and Engineering Research Council of Canada (NSERC) and in part by Canada Foundation for Innovation (CFI).
This paper was edited by Daniel Platz and reviewed by two anonymous referees.
Abdel-Rahman, E. M., Younis, M. I., and Nayfeh, A. H.: Characterization of the mechanical behavior of an electrically actuated microbeam, J. Micromech. Microeng., 12, 759–766, https://doi.org/10.1088/0960-1317/12/6/312, 2002.
Batra, R. C., Porfiri, M., and Spinello, D.: Review of modeling electrostatically actuated microelectromechanical systems, Smart Mater. Struct., 16, R23–R50, https://doi.org/10.1088/0964-1726/16/6/R01, 2007.
Bouchaala, A., Nayfeh, A. H., and Younis, M. I.: Analytical study of the frequency shifts of micro and nano clamped–clamped beam resonators due to an added mass, Meccanica, 52, 333–348, https://doi.org/10.1007/s11012-016-0412-4, 2017.
Hussein, H. and Younis, M. I.: Analytical study of the snap-through and bistability of beams with arbitrarily initial shape, ASME J. Mech. Robot., 12, 041001, https://doi.org/10.1115/1.4045844, 2020.
Koester, D., Cowen, A., Mahadevan, R., Stonefield, M., and Hardy, B.: PolyMUMPs design handbook, MEMSCAP Inc., https://www.cmc.ca/poly-mems-multi-user/ (last access: 9 October 2025), 2003.
Kumar, P., Pawaskar, D. N., and Inamdar, M. M.: Mass sensing based on nonlinear intermodal coupling via 2:1 internal resonance of electrostatically actuated clamped–clamped microbeams, Int. J. Dynam. Control, 12, 2128–2143, https://doi.org/10.1007/s40435-023-01355-7, 2024.
Lee, H. J., Park, K. K., Kupnik, M., Oralia, Ö., and Khuri-Yakub, B. T.: Highly sensitive detection of DMMP using a CMUT-based chemical sensor, in: IEEE Sensors, 2122–2126, https://doi.org/10.1109/ICSENS.2010.5690493, 2010.
Lin, X. and Ying, J.: Analytical model of electrostatic fixed–fixed microbeam for pull-in voltage, in: Proceedings of the IEEE/ASME International Conference on Advanced Intelligent Mechatronics (AIM), 803–807, https://doi.org/10.1109/AIM.2008.4601765, 2008.
Nathani, M. U., Nazemi, H., Love, C., Babu Lopez, Y., Swaminathan, S., and Emadi, A.: Capacitive based micromachined resonators for low level mass detection, micromachines, 12, 13, https://doi.org/10.3390/mi12010013, 2020.
Nazemi, H., Elnemr, Y., and Emadi, A.: microbridge resonators: reducing pull-in voltage with preserving resonant frequency, in: Eurosensors Conference, 1–4 September 2024, Debrecen, Hungary, PT1.9, https://doi.org/10.5162/EUROSENSORSXXXVI/PT1.9, 2024.
O'Mahony, C., Hill, M., Duane, R., and Mathewson, A.: Analysis of electromechanical boundary effects on the pull-in of micromachined fixed–fixed beams, J. Micromech. Microeng., 13, S75–S80, https://doi.org/10.1088/0960-1317/13/5/310, 2003.
Park, S., Yoon, I., Lee, S., Kim, H., Seo, J.-W., Chung, Y., Unger, A., Kupnik, M., and Lee, H. J.: CMUT-based resonant gas sensor array for VOC detection with low operating voltage, Sens. Actuat. B, 273, 1556–1563, https://doi.org/10.1016/j.snb.2018.07.043, 2018.
Rebeiz, G. M.: RF MEMS: theory, design, and technology, in: 1st Edn., John Wiley & Sons, Inc., https://doi.org/10.1002/0471225282, 2003.
Ventsel, E. and Krauthammer, T.: Thin plates and shells: theory, analysis, and applications, in: 1st Edn., Marcel Dekker, https://doi.org/10.1201/9780203908723, 2001.
Yaralioglu, G. G., Ergun, A. S., Bayram, B., Haeggstrom, E., and Khuri-Yakub, B. T.: Calculation and measurement of electromechanical coupling coefficient of capacitive micromachined ultrasonic transducers, IEEE T. Ultrason. Ferroelect. Freq. Control, 50, 449–456, https://doi.org/10.1109/TUFFC.2003.1197968, 2003.
Yaşar, A. İ., Yildiz, F., and Erogul, O.: Evaluation of CMUT performance under different excitation signals and electrode coverage, in: 11th International Conference on Electrical and Electronics Engineering (ELECO), 441–444, https://doi.org/10.23919/ELECO47770.2019.8990518, 2019.
- Abstract
- Introduction
- Principle of operation and modelling of microbridges utilizing the ratio between the electrodes
- Finite Element Analysis (FEA) of the proposed microbridges
- Microbridge fabrication
- Electrical characterization
- Conclusion
- Code availability
- Data availability
- Author contributions
- Competing interests
- Disclaimer
- Special issue statement
- Acknowledgements
- Financial support
- Review statement
- References