the Creative Commons Attribution 4.0 License.
the Creative Commons Attribution 4.0 License.
 | 21 Oct 2025
Local pressure field distribution of bistable PMUTs for distance sensing
Michael Schneider
Mahdi Mortada
Dominik Mayrhofer
Manfred Kaltenbacher
Ulrich Schmid
This work presents both the directivity pattern and distance dependence of the pressure field of a piezoelectric micromachined ultrasonic transducer (PMUT). The PMUT comprises a silicon membrane and an integrated piezoelectric transducer based on aluminum nitride (AlN) and exploits bistability to achieve large displacements during snap-through between the two ground states. Snap-through is initiated by a short rectangular pulse train burst, and the resulting sound pressure pulse is recorded. The impact of the number of excitation signal pulses as well as the number of averaged measurement events on the sound pulse shape is studied to find an optimal balance between short sound pulse duration and high maximum sound pressure. Sound reflectance measurements finally demonstrate the feasibility of bistable PMUT devices for future ultrasonic ranging applications.
- Article
(8783 KB) - Full-text XML
- BibTeX
- EndNote


Ultrasonic imaging utilizes high-frequency sound waves outside the range of human hearing (above 16 kHz) to enable non-destructive object detection, ranging, and localization. This technique has been widely adopted across diverse applications, including medical diagnostics, material integrity testing, gesture sensing, and distance measurement (Yamashita et al., 2002; Dausch et al., 2010; Przybyla et al., 2011, 2014, 2015; Chen et al., 2013; Jung et al., 2017). Ultrasonic sound waves are generated by coupling a movable mechanical structure to an acoustic medium (often air) and thus allowing energy transfer between the mechanical structure (transducer) and the medium. While early ultrasonic transducers were manufactured using macroscopic methods, silicon-based micromachined ultrasonic transducers (MUTs) were introduced in the early 1990s, initially utilizing capacitive transduction principles (Haller and Khuri-Yakub, 1996; Suzuki et al., 1989). Capacitive MUTs (CMUTs) are known for their strong electromechanical coupling, but their performance is limited by the high DC bias voltages required and their restricted displacement due to the limited height of the air gap between the membrane and counter-electrode.
Piezoelectric MUTs (PMUTs) have gained popularity since their introduction in the late 1990s/early 2000s because they can operate at significantly lower voltages and feature a simpler design, eliminating the need for a counter-electrode and consequently allowing larger displacements compared to CMUTs. Initially, most PMUTs utilized lead zirconate titanate (PZT) as piezoelectric material due to its high piezoelectric coefficients (Wang et al., 2006; Yamashita et al., 2002; Muralt et al., 2001; Baborowski et al., 2002; Akasheh et al., 2004), but modern PMUTs also utilize aluminum nitride (AlN) (Guedes et al., 2011; Przybyla et al., 2015) or scandium-doped AlN (ScAlN) (Weekers et al., 2021; Bespalova et al., 2021).
The performance of PMUT devices is often assessed based on their maximum displacement (stroke level) and their responsivity, which is a measure for displacement per applied voltage. To enhance these characteristics, researchers have explored approaches such as pressurized membranes (Morris et al., 2010), optimized flexural supports (Guedes et al., 2011), dome-shaped designs (Hajati et al., 2012; Akhbari et al., 2014, 2015), differential transducer configurations (Sammoura et al., 2014), bimorph architectures (Akhbari et al., 2016), and stress-induced buckling (Yamashita et al., 2015), to name a few.
This work builds on the concept of stress-induced buckling to enhance responsivity in AlN-based PMUTs, leveraging bistability for mechanical amplification. Bistability is caused by sufficiently high compressive stress (see Sect. 2) in the PMUTs membrane, resulting in buckling due to a split in the potential energy well into two stable ground states. Such a buckled structure can either be excited to oscillate within each energy well (intrawell motion) or to conduct snap-through oscillation between the two ground states (interwell motion) (Harne and Wang, 2017), resulting in large displacement in the range of 10 µm and more (Dorfmeister et al., 2019b). The membrane is actuated to snap between the two stable states using an integrated piezoelectric transducer and pulsed electric signals.
Previous studies have examined the fundamental mechanics of this bistable switching (Dorfmeister et al., 2019a, b, 2018) and the impact of distance on the sound pressure pulses generated by these bistable PMUTs (Schneider et al., 2020). In this work, we present the first measurements of the sound pressure polar emission pattern, discuss the impact of several parameters such as averaging and the number of excitation pulses on the quality of the emitted ultrasonic pulse, and demonstrate at the lab level, as well as showing how such a device could be utilized for distance measurements.
The PMUT devices are fabricated starting from a 100 mm silicon on insulator (SOI) wafer with a device layer thickness of 2 µm and a buried oxide (BOX) thickness of 1 µm. The wafers are coated with a stress-compensated silicon oxide and silicon nitride bilayer for electrical insulation. The piezoelectric transducer comprises thermally evaporated bottom and top electrodes (50 nm chromium and 200 nm gold) and a reactively sputter-deposited aluminum nitride (AlN) thin film with 400 nm thickness sandwiched between the two electrodes. The electrodes are patterned with a standard lift-off procedure. The AlN layer is deposited from a 150 mm Al target in a pure nitrogen atmosphere at a chamber back pressure of 2 µbar, DC power of 800 W, and target–substrate distance of 65 mm. The stress in the AlN layer is and tailored to ensure that the total compressive stress in the membrane exceeds the critical stress σc required for buckling, given by
with the thickness-weighted Young's modulus E and Poisson ratio ν of the membrane material stack, the total membrane thickness t, and membrane radius R (Schomburg, 2015). The membrane with diameter 600 µm is defined by backside deep reactive ion etching (Bosch process) and a subsequent hydrofluoric acid removal of the BOX to release the membrane. The wafer is subsequently diced with a wafer dicing saw; the individual dies are glued into dual inline packages (DIP) and electrically connected to the DIP using wire bonding. The final device is shown in Fig. 1a, and a cross-section of a single membrane structure is shown in Fig. 1b.
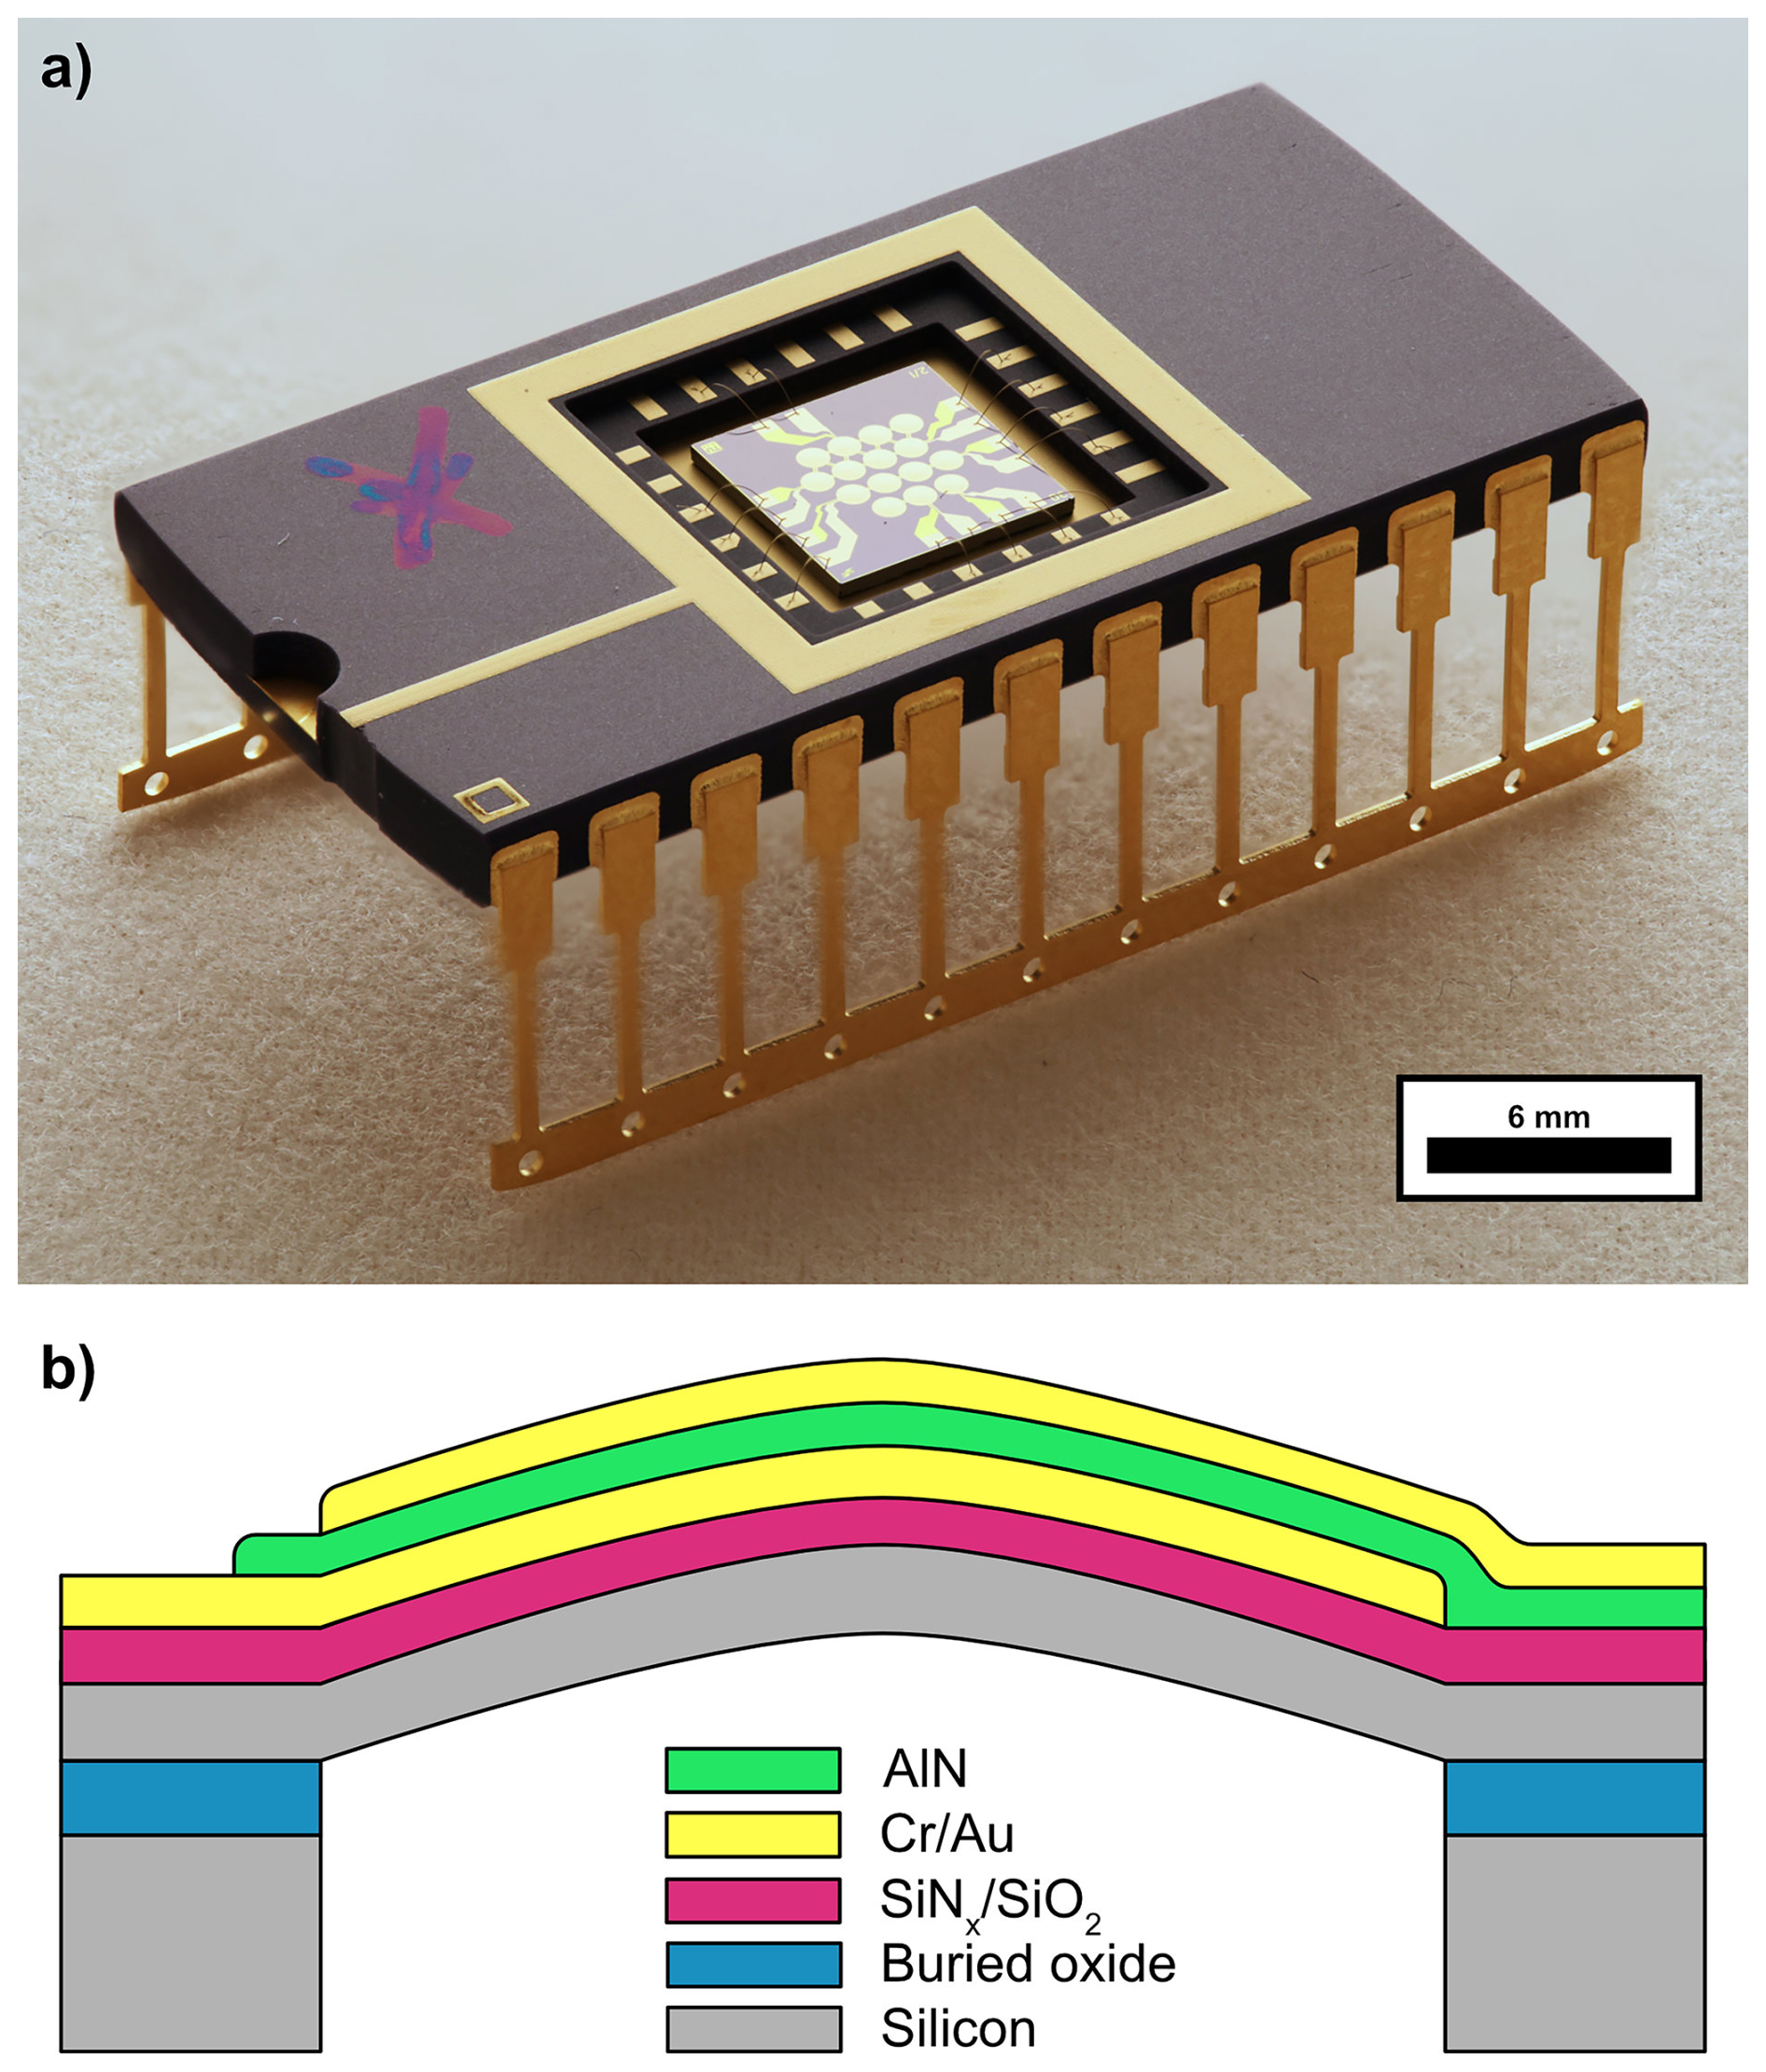
Figure 1(a) Typical bistable PMUT array mounted in a dual inline package. Only a single transducer was used during this study. (b) Schematic cross-section of a single membrane structure.
The PMUT is electrically excited by applying a sinusoidal pulse train with n pulses, frequency of 107 kHz, and amplitude of 25 V to the AlN piezoelectric transducer. If not mentioned otherwise, n=6. The signal is tailored towards effective membrane snap-through initiation and is generated by an Intermodulation Products MLA-3 with subsequent amplification by a factor of 50 using a Trek HF2100 broadband (2 MHz) amplifier. Membrane velocity is recorded using a Polytec single-point laser Doppler vibrometer (LDV) (VibroFlex Connect system with VibroFlex Compact measurement head) set to a bandwidth of 3 MHz and a sensitivity of 2.5 m (s ⋅ V)−1. Acoustic measurements are done with a Brüel and Kjær 4939 free-field microphone offering a frequency range of 4 Hz to 100 kHz and an inherent noise of 28 dB(A). Only for the measurements in Fig. 3, a Brüel and Kjær 4138 pressure field microphone with a frequency range of 6.5 Hz to 140 kHz and an inherent noise of 52.2 dB(A) was used. A pre-amplifier 2670 in combination with a Nexus signal conditioner and amplifier is used for signal conditioning, before the signal is recorded with a Keysight DSOX1204G oscilloscope. For averaging, the entire excitation signal is repeated Navg times and the oscilloscope synchronized to the MLA-3 via triggering on the excitation signal prior to the HF2100 amplifier. If not mentioned otherwise, Navg=256. Sensitivity for the Nexus amplifier is set to 0.01 V Pa−1 for all measurements except reflectance measurements at the three largest distances, where the sensitivity is increased to 0.1 V Pa−1. For the pole figure, the microphone is mounted on a stand which allows equidistant (99.2 mm) rotation of the microphone with respect to the PMUT and the polar angle θ is varied from 2∘ (almost on-axis) to 104° (below the emission plane of the PMUT). The measurement is performed inside a soundproof booth by Soundbricks. The distance between the PMUT and microphone d is coarsely measured with a ruler; however, for more accurate distance measurement, the time of flight (TOF) of the sound pulse ttof together with the speed of sound c=343 m s−1 is used, since d=ttofc. A photograph of the setup is shown in Fig. 2. More details can be found in Schneider et al. (2020).
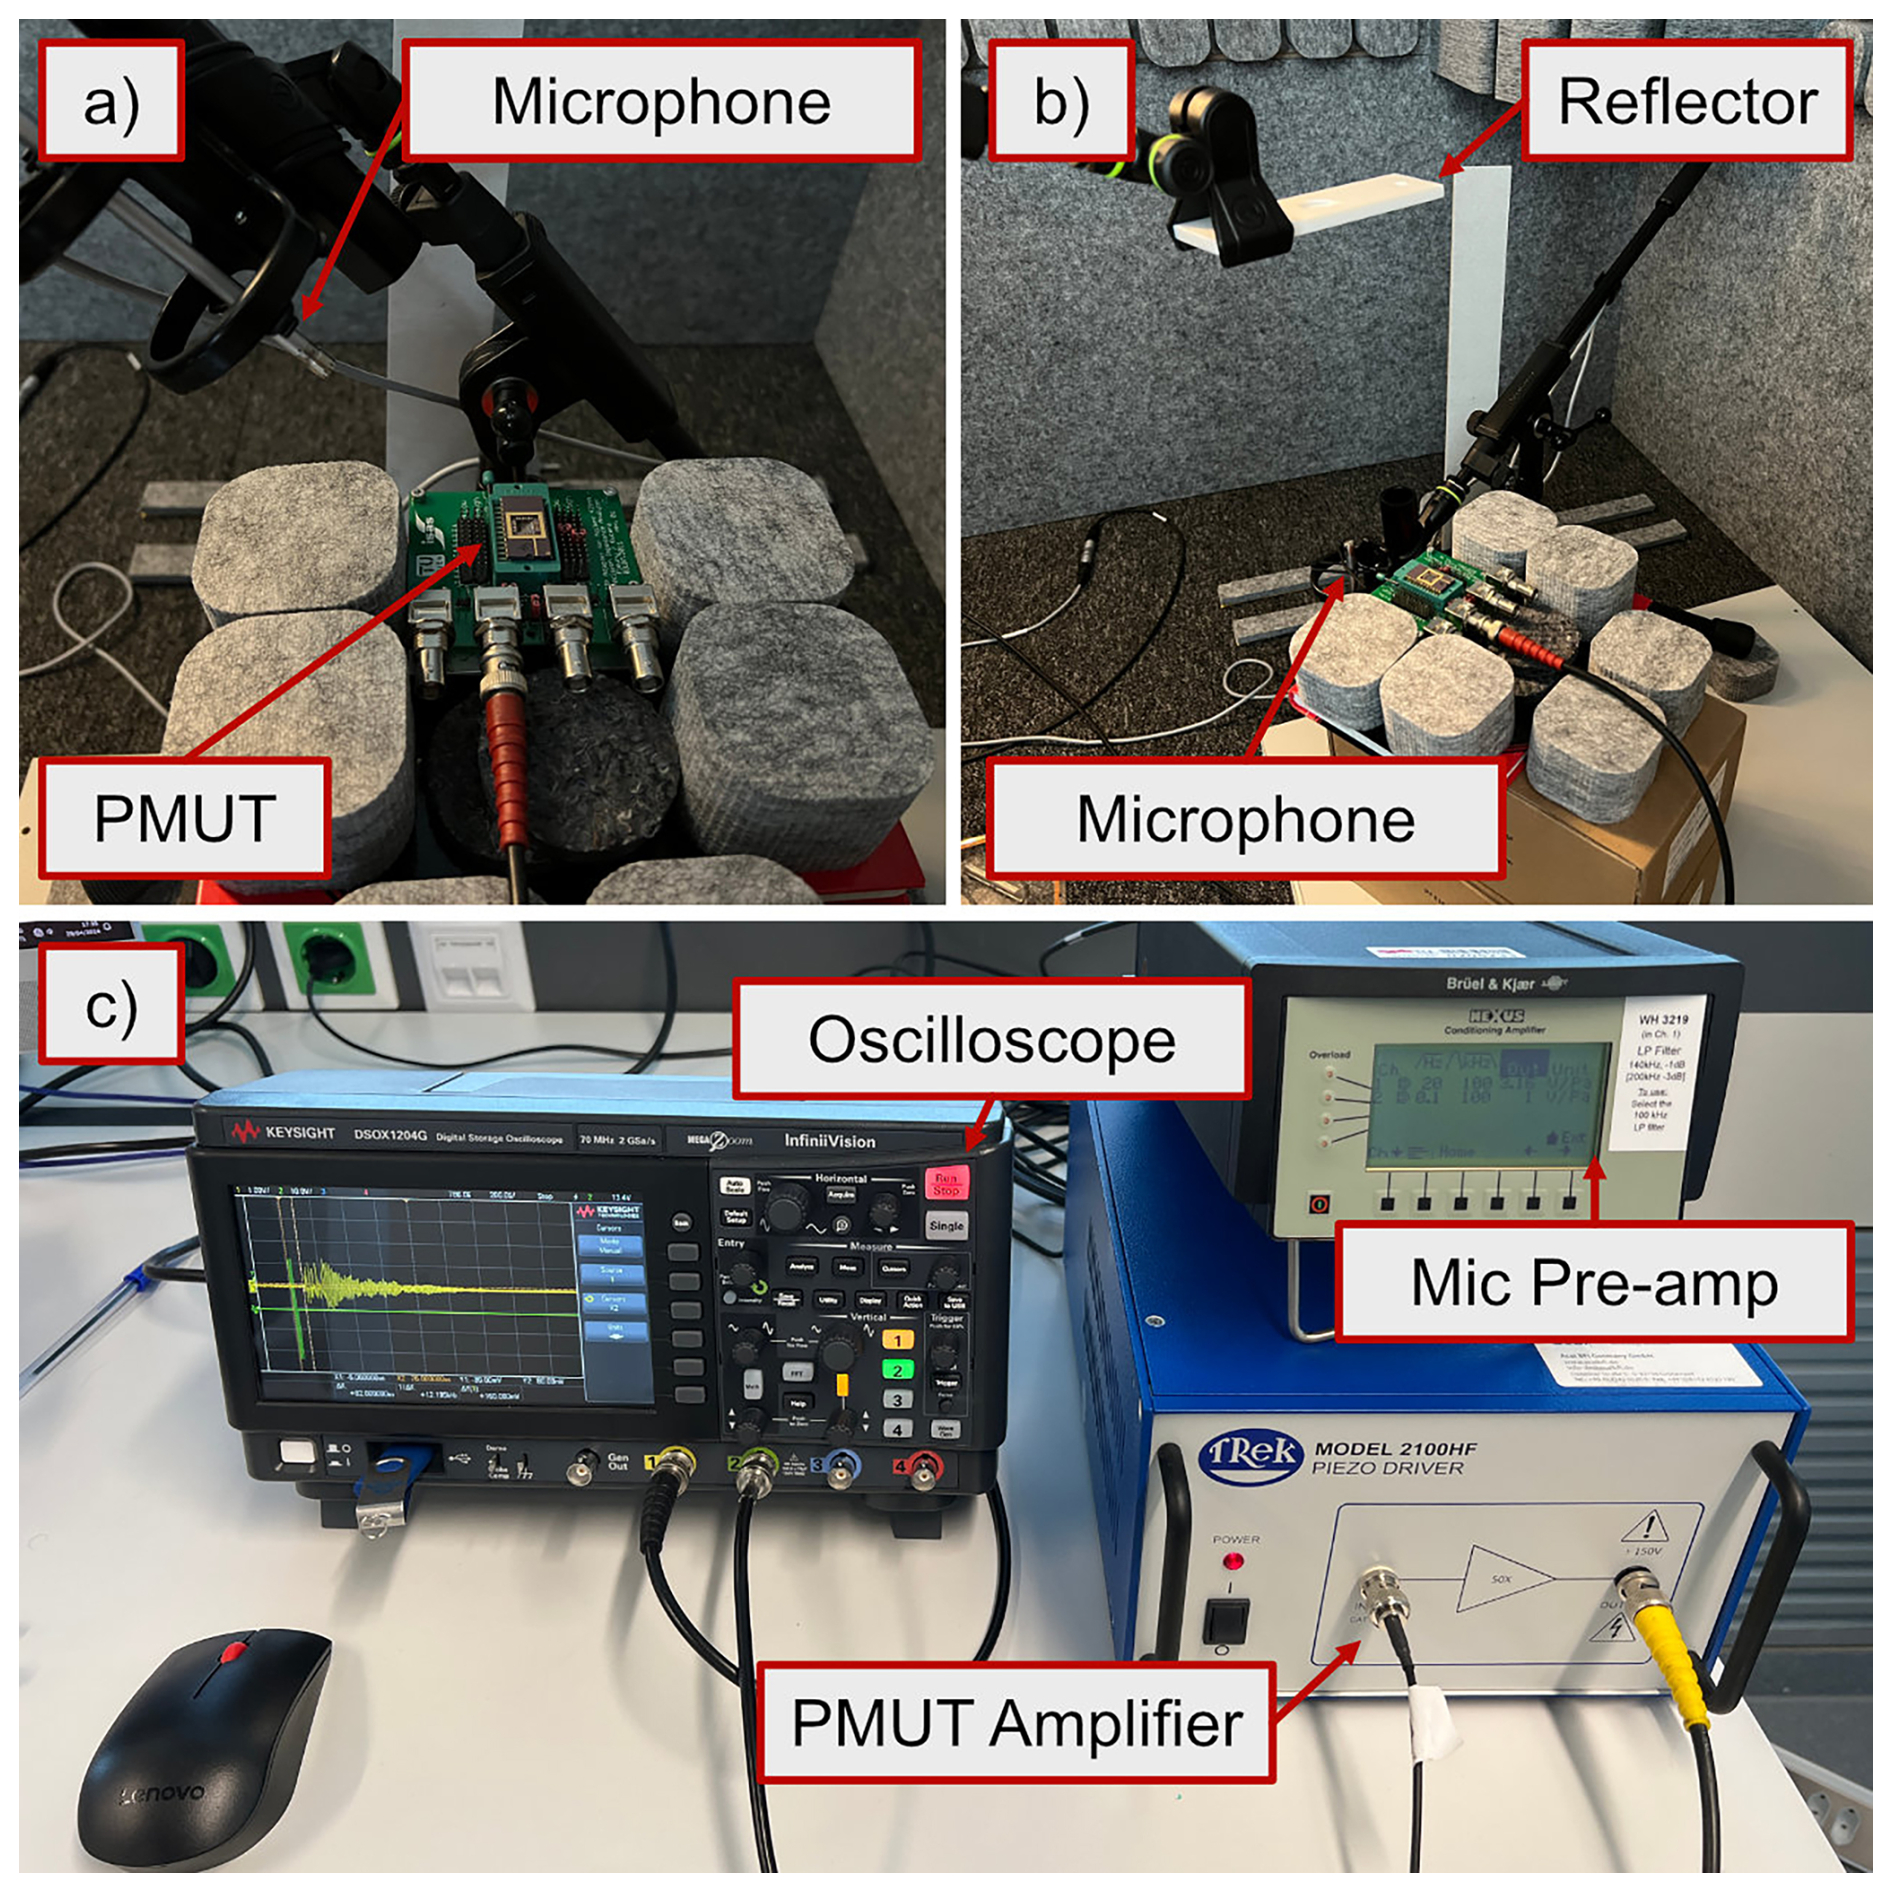
Figure 2Measurement setup in an acoustic isolation booth. (a) Microphone angled at 45° off-axis from PMUT. (b) Reflector placed above PMUT; microphone placed next to PMUT pointed towards the reflector. (c) Microphone pre-amp and oscilloscope for data acquisition. MLA-3 (not shown) output is amplified by a fixed-gain amplifier to drive PMUT.
Figure 3 shows the time-dependent behavior of different quantities for a single PMUT excitation event. Figure 3a shows the sinusoidal pulse train excitation signal for n=6 with the signal onset shifted by −2 µs due to the oscilloscope trigger level, which is set at ≈12 V. The excitation signal lasts for 56 µs. Figure 3b shows the corresponding velocity trajectory v(t) of the membrane, measured at the membrane center. The signal is delayed by 20 µs compared to the electrical excitation signal due to the data processing delay in the LDV system (specified by Polytec at 20 µs). The velocity trajectory features three distinct regimes, marked by different background colors. The first region (red, 20–175 µs) is characterized by continuous snap-throughs of the membrane between the two stable states after an initial ring-up phase (lasting two periods).
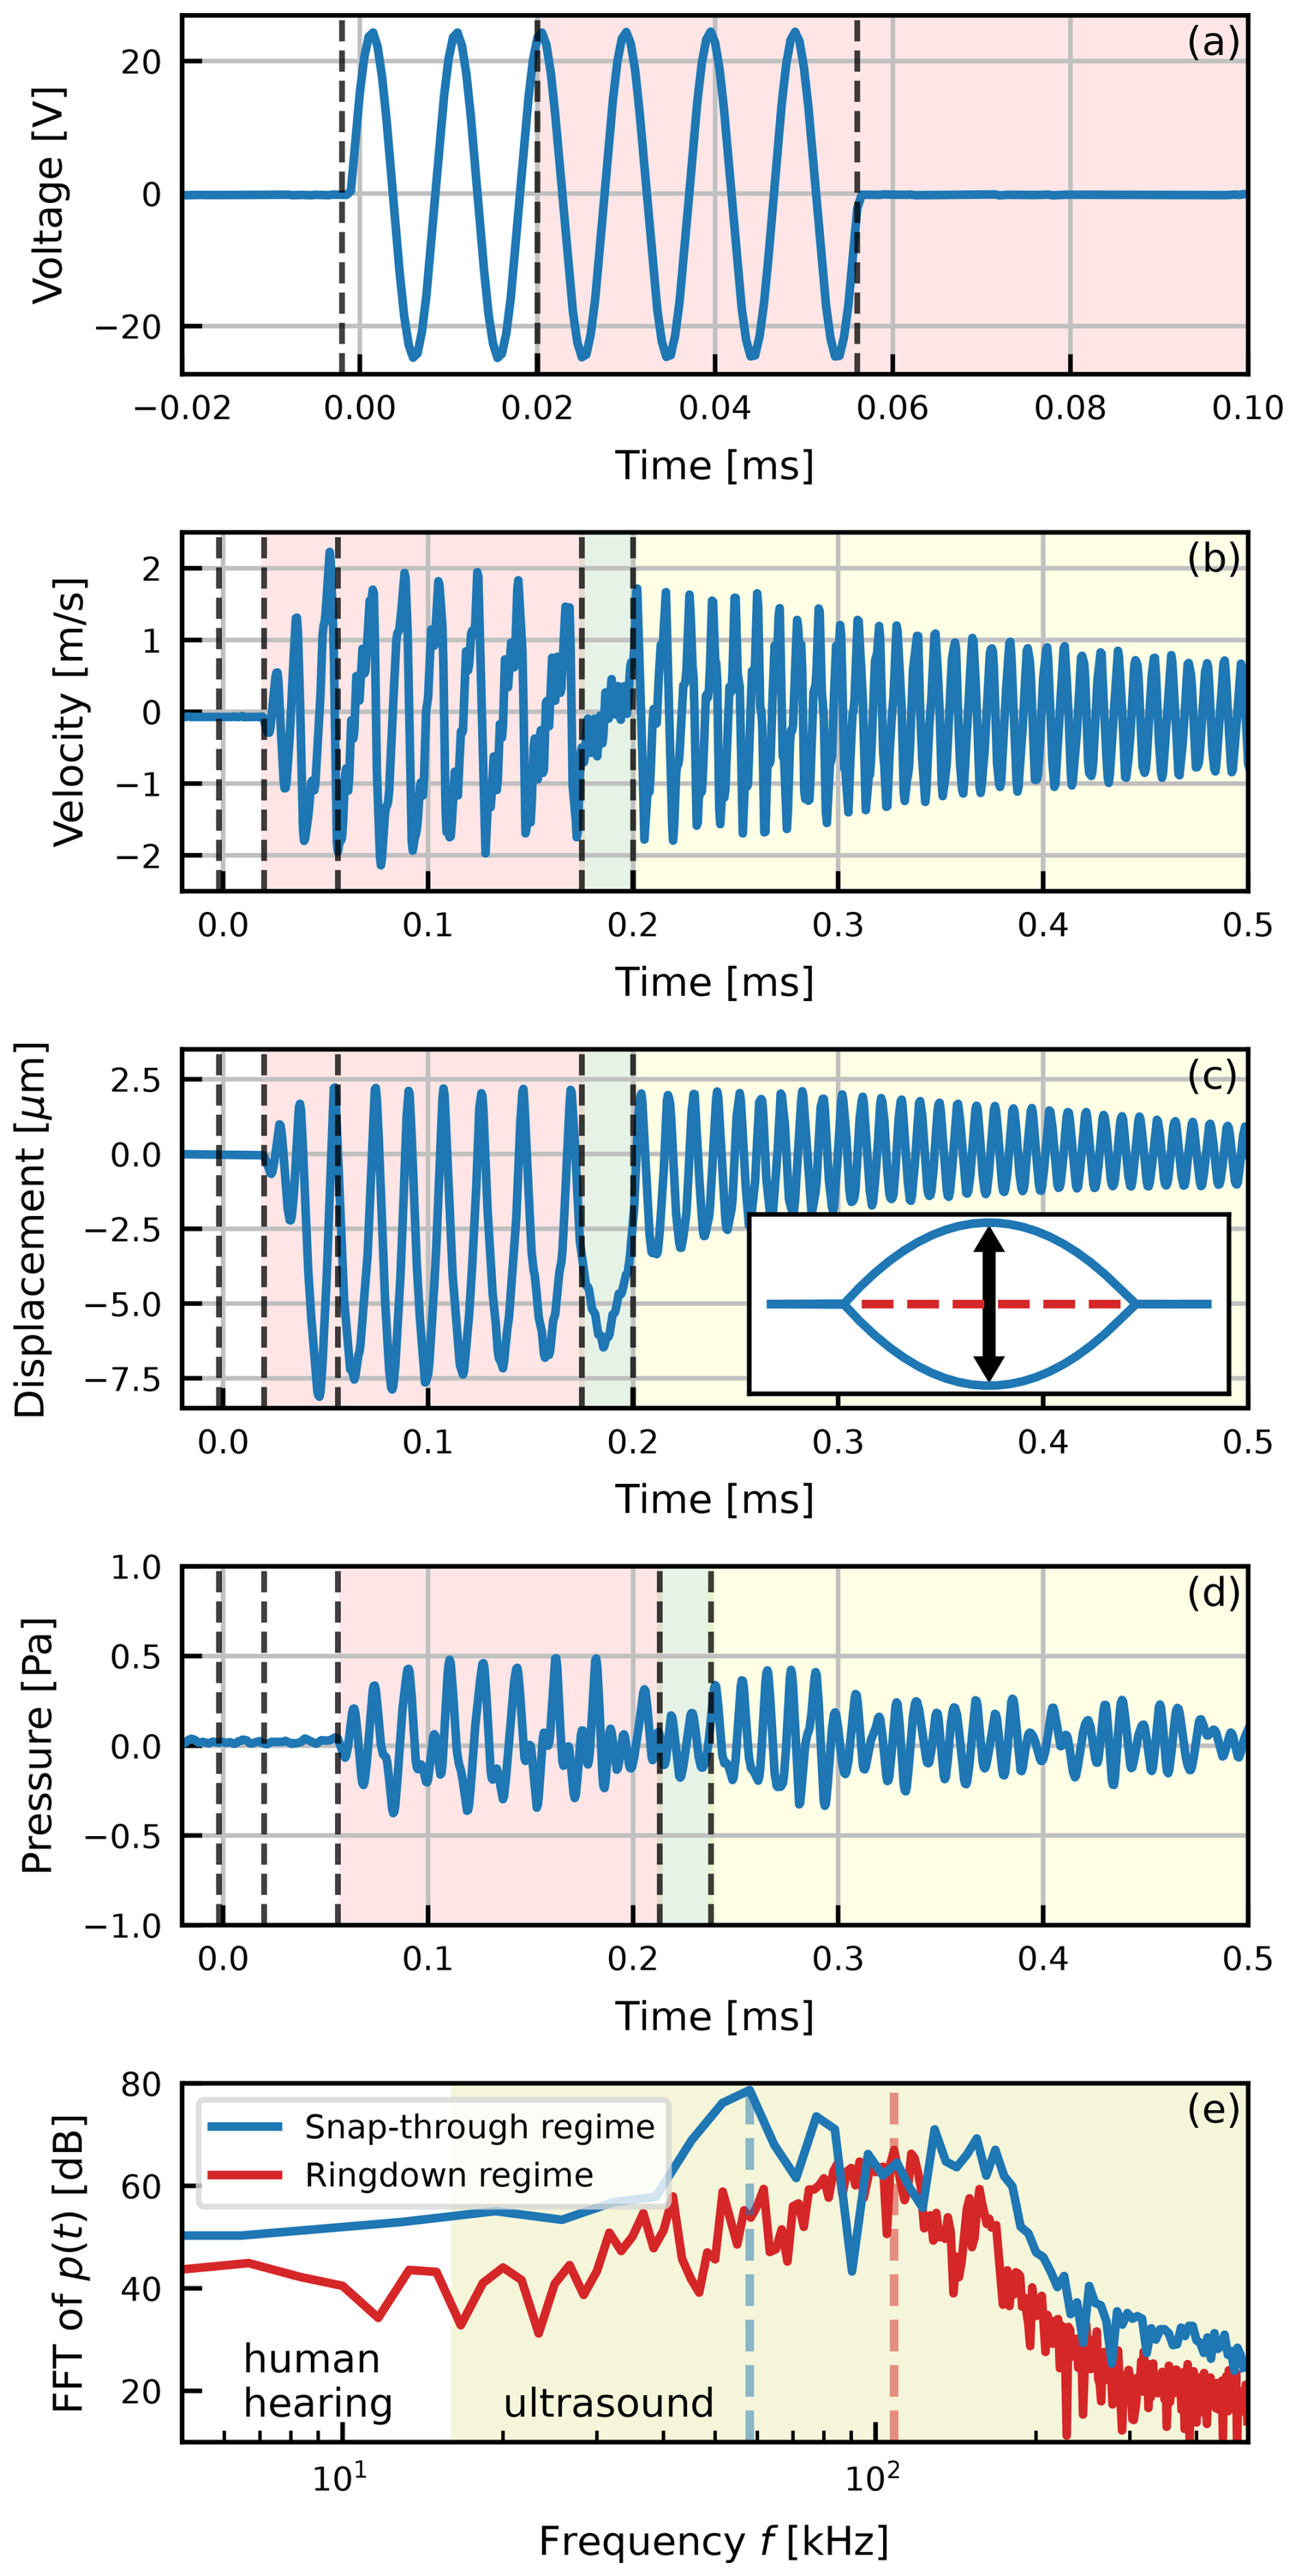
Figure 3Exemplary signal characteristics for a single pulse measurement. The first three dashed lines mark the start of the excitation signal, the start of the membrane movement, and the end of the excitation signal, respectively. Red-, green-, and yellow-colored regions indicate ring-up and subsequent continuous snap-through, transitioning to ring-down and ring-down, respectively. (a) Excitation signal applied to the PMUT. (b) Velocity signal from the LDV measured at the membrane center. (c) Baseline drift-compensated membrane displacement signal. The inset schematically shows the two stable states of the membrane, and the arrow indicates the snap-through direction. (d) Pressure signal recorded at a distance of 13 mm from the membrane center. (e) FFT of both the snap-through and ring-down regimes. Dashed lines indicate the detected maximum. Tinted background indicates the ultrasonic regime.
After reaching the state of continuous snap-through operation, snap-throughs continue for another 97 µs after the excitation signal has terminated due to the kinetic energy stored in the membrane, before v(t) transits through a transitional regime (marked in green, 175–200 µs) into the ring-down regime without snap-throughs (yellow, from 200 µs) where the membrane oscillation decays at or close to the membrane's natural first resonance frequency (see below).
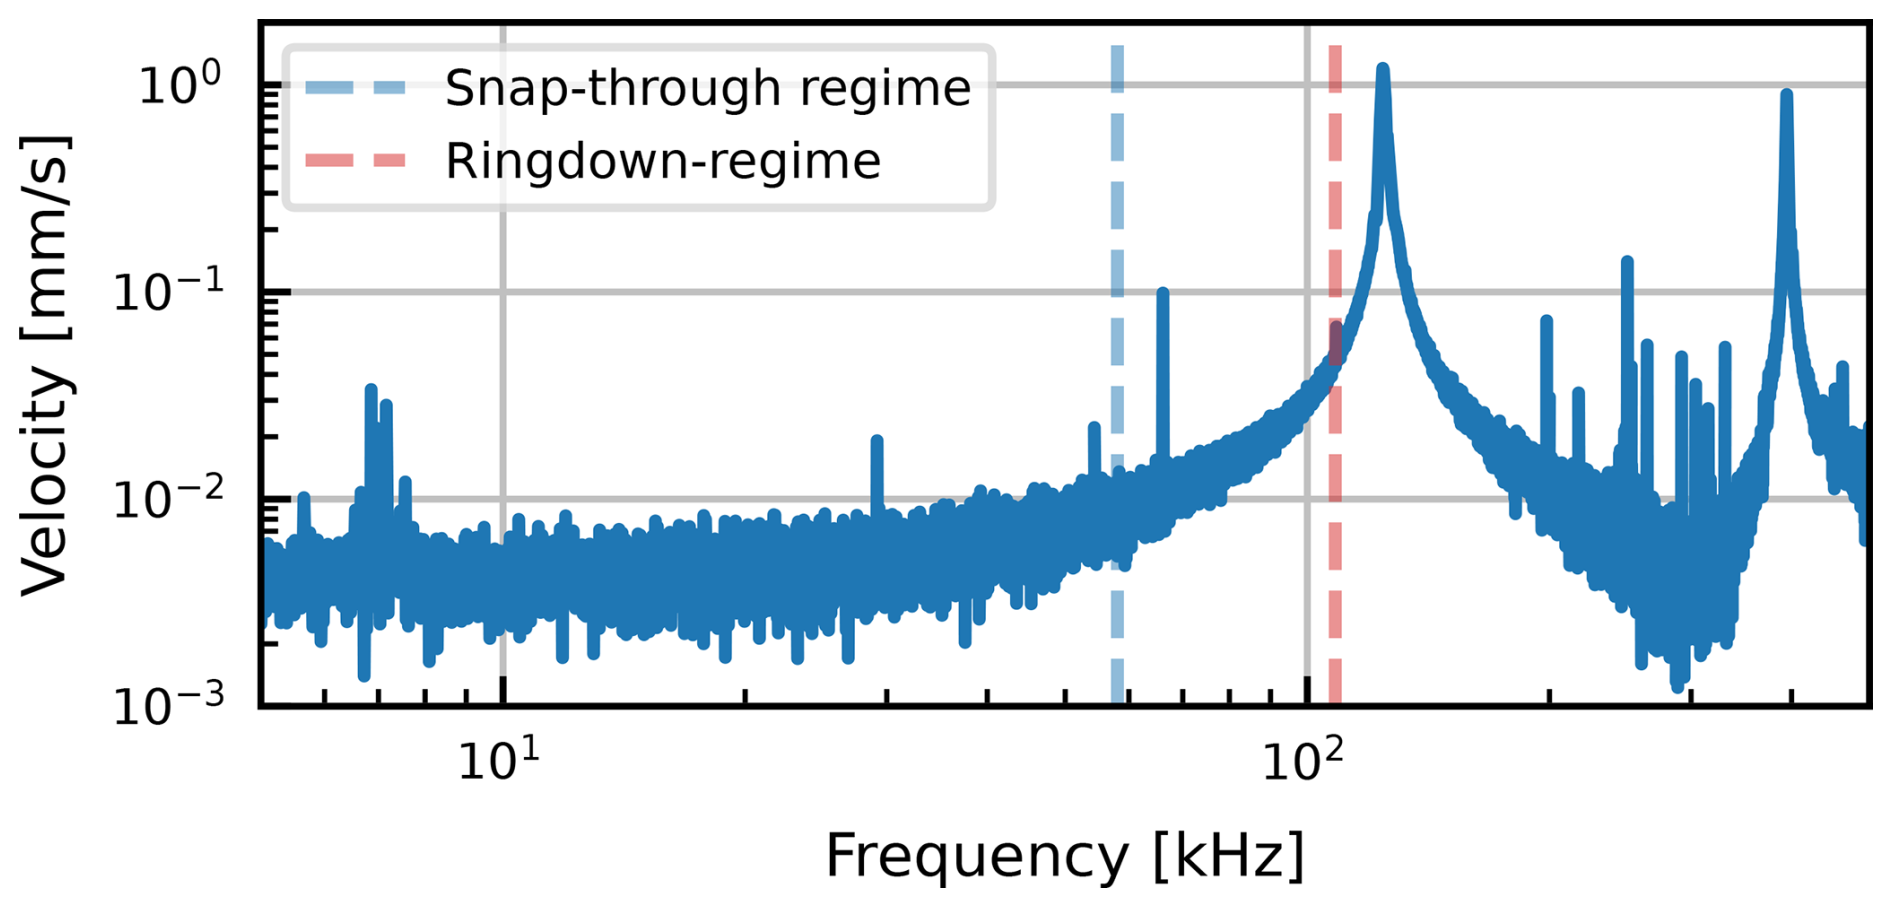
Figure 4Laser Doppler measurement of membrane velocity spectrum under periodic chirp excitation. Dashed lines correspond to the same lines in Fig. 3e.
The displacement w(ti) at the ith time step ti is numerically calculated by a cumulative sum over the velocity value for each time step v(tk) using
The initial time t0=0 corresponds to the first recorded trajectory sample v(t0) and since the membrane is initially at rest, v(t0)=0 and thus w(t0)=0. Thereby, Δt=500 ns is the time step size and hence the inverse of the sampling rate. The conditions w(ti)=0 for any ti prior to excitation start and for ti values after ring-down are used to remove the drift in w(ti) caused by the numerical integration via a second-order polynomial fit. For the sake of simplicity, w(ti) is treated as a continuous function from here on (same as v(t)), and hence w(ti)≡w(t). The resulting displacement trajectory w(t) is shown in Fig. 3c. After two initial intrawell oscillations, the membrane transitions into interwell oscillations, resulting in mechanical displacement amplitudes of the membrane center of up to 10 µm (red regime). As already observed for v(t), the transition back into intrawell oscillations (yellow) occurs through a transitional regime (green) with the ring-down behavior also clearly observable in w(t). The inset in Fig. 3c schematically shows the interwell transition between upper and lower states.
Figure 3d shows the averaged sound pressure signal p(t) measured at a distance of d=13 mm from the membrane center. The signal generated from the membrane snap-through regime (red background) is clearly visible; however, the long ring-down decay (yellow background) also results in a relatively slow decay of p(t) at similar levels compared to the snap-through regime. Similar levels occur since the decay happens at a higher frequency (108.3 kHz, see below) compared to the snap-through regime (77.4 kHz, see below), which compensates for the lower displacement amplitude, since according to the Rayleigh integral, sound pressure in the far-field approximation is proportional to frequency squared (Rayleigh, 1945). For distance sensing applications using time-of-flight approaches, such long decay trails after the initial sound pulse are problematic, since the additional sound generated can mask the reflected sound pulse signal for the receiver microphone. One approach for solving this issue is active damping of the membrane during ring-down, thus significantly shortening the decay time (Liu et al., 2018). The approach used in this work exploits the stochastic nature of both the snap-through regime after excitation signal termination and the transitional regime. While the initial phase of w(t) during excitation is highly deterministic, w(t) after excitation signal termination shows an increasingly stochastic behavior with increasing t, resulting in a variation of the number of snap-throughs or a slight variation of the length of the transitional regime. This leads to random phase shifts of the ring-down oscillation, but not the initial snap-through trajectory. The ring-down trail can therefore be suppressed by averaging over a sufficient number of excitation events (discussed below).
Figure 3e shows the fast Fourier transform (FFT) of p(t) for both the snap-through (red) and ring-down (yellow) regimes, with the dashed lines indicating the most dominant frequencies of 77.4 kHz during snap-through and 108.3 kHz during ring-down. The velocity spectrum of the membrane under periodic chirp excitation is shown in Fig. 4 with the fundamental out-of-plane resonance frequency at 124 kHz. While this is higher compared to 108.3 kHz, the broadness of the peak in the FFT spectrum makes an accurate determination from Fig. 3e difficult, and a measured resonance frequency of 124 kHz is still in good agreement with the observation that ring-down occurs at the first membrane resonance frequency.
Figure 5 shows the impact of averaging on p(t) measured at d=99 mm. The distance was increased from 13 to 99 mm for subsequent emission pattern measurements (see below) but also to decrease the signal-to-noise ratio (SNR) to further highlight the impact of averaging. With increasing Navg, the noise in the decay regime is successfully suppressed, whereas the initial sound pressure pulse remains basically unchanged, highlighting the highly deterministic behavior of the membrane during the initial snap-throughs. Since measurement time is not a concern during this study, subsequent measurements use Navg=256, but as Fig. 5 shows, this can be reduced down to Navg=16 with only a small decrease in the SNR. Given pulse round-trip times in the range of several milliseconds (see below), this would result in a total measurement time decrease in the time-of-flight-based distance measurements from up to 1 s down to below 100 ms.
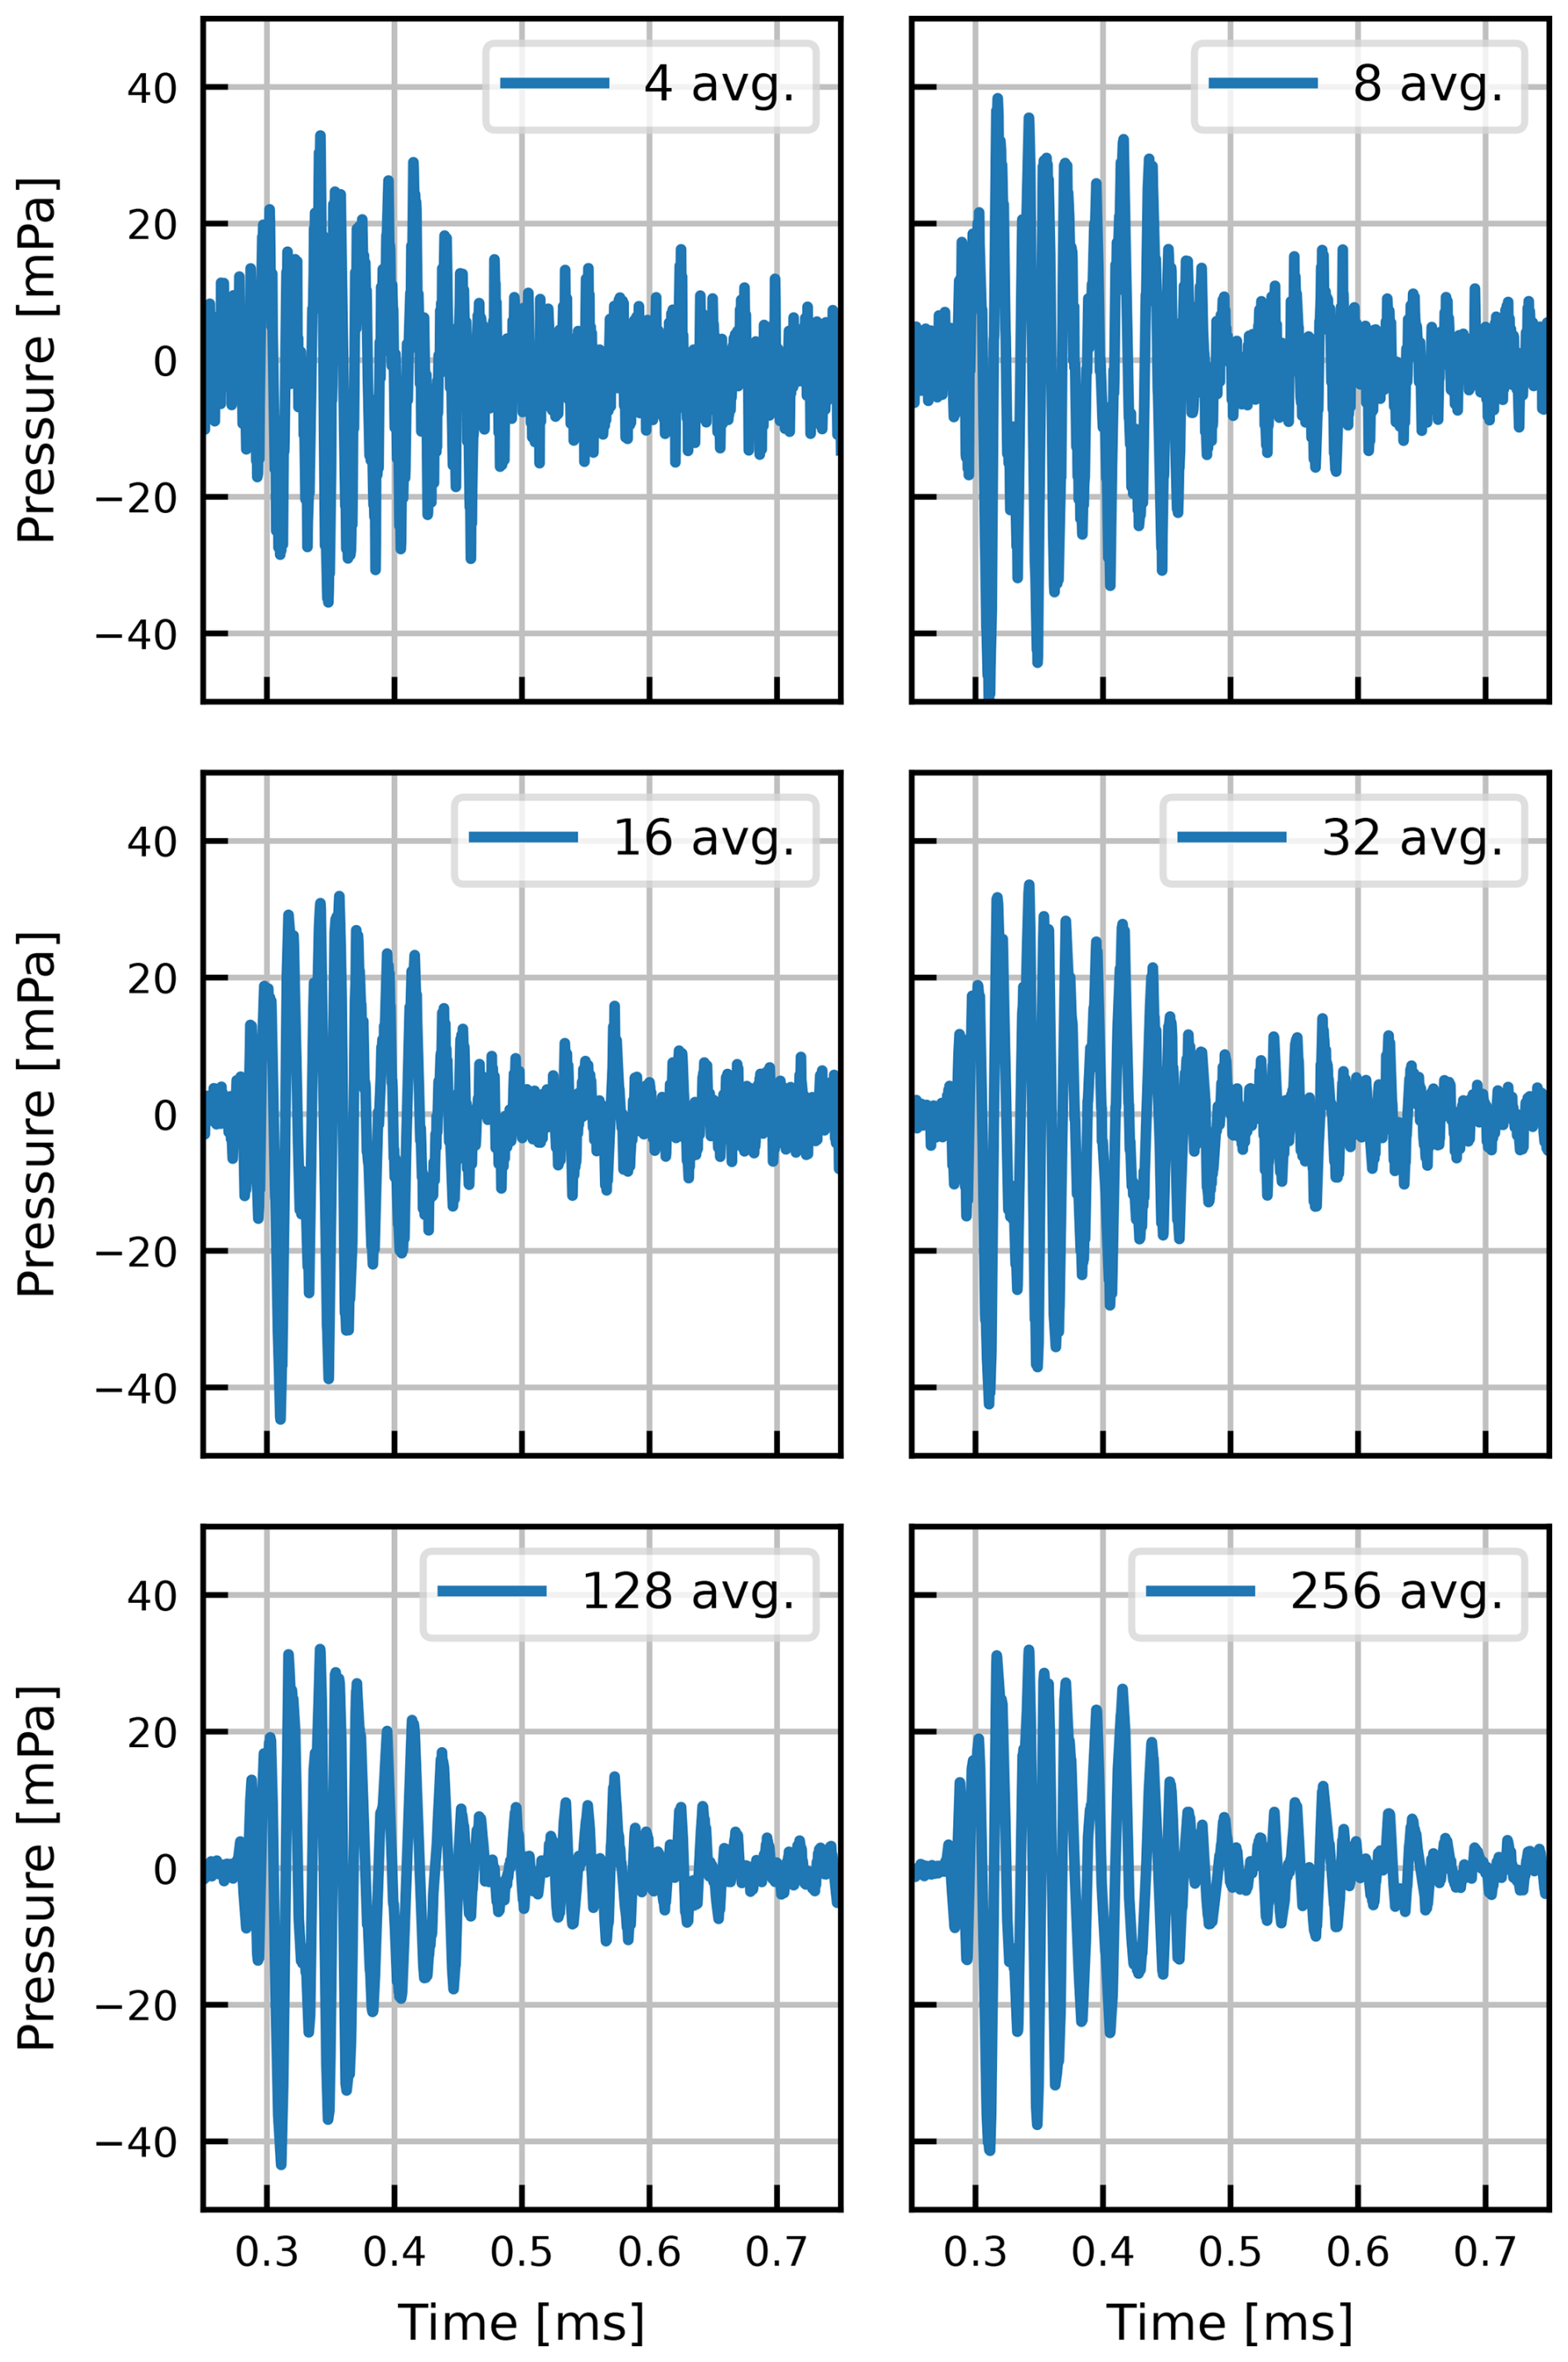
Figure 5Averaged sound pressure signal for various averaging counts (4 signals averaged to 256 signals averaged). The pressure signal is recorded at a distance of 99 mm from the membrane center.
Another factor impacting the duration of the snap-through regime (red region in Fig. 3) is the number of sinusoidal pulses n applied to the piezoelectric transducer. This is shown in Fig. 6 for d=99 mm. For a single pulse at 25 V, no snap-through is initiated, resulting in a ring-down at the natural resonance frequency (similar to an impulse response) and consequently an acoustic response p(t) at higher frequency with lower pressure amplitude. For n=2, snap-through is initiated in agreement with previous works (Dorfmeister et al., 2019b), resulting in an increased maximum pressure achieved for p(t). For , p(t) features a clearly visible snap-through regime with absolute maximum sound pressures reaching values above 40 mPa, while the pressure pulse duration seems to be mostly unaffected by n. This somewhat counterintuitive behavior of the pulse duration could be an artifact of the averaging in combination with the increasingly stochastic trajectory of the membrane for higher values of n due to the highly nonlinear bistable membrane structure, resulting in later oscillations being averaged out. Studies on the highly complex impact of n, but also excitation signal amplitude and frequency, on the dynamics and acoustic performance of such bistable piezoelectric MEMS (micro electromechanical systems) structures are currently under review (Mortada et al., 2025). For all subsequent measurements, n=6 is chosen.
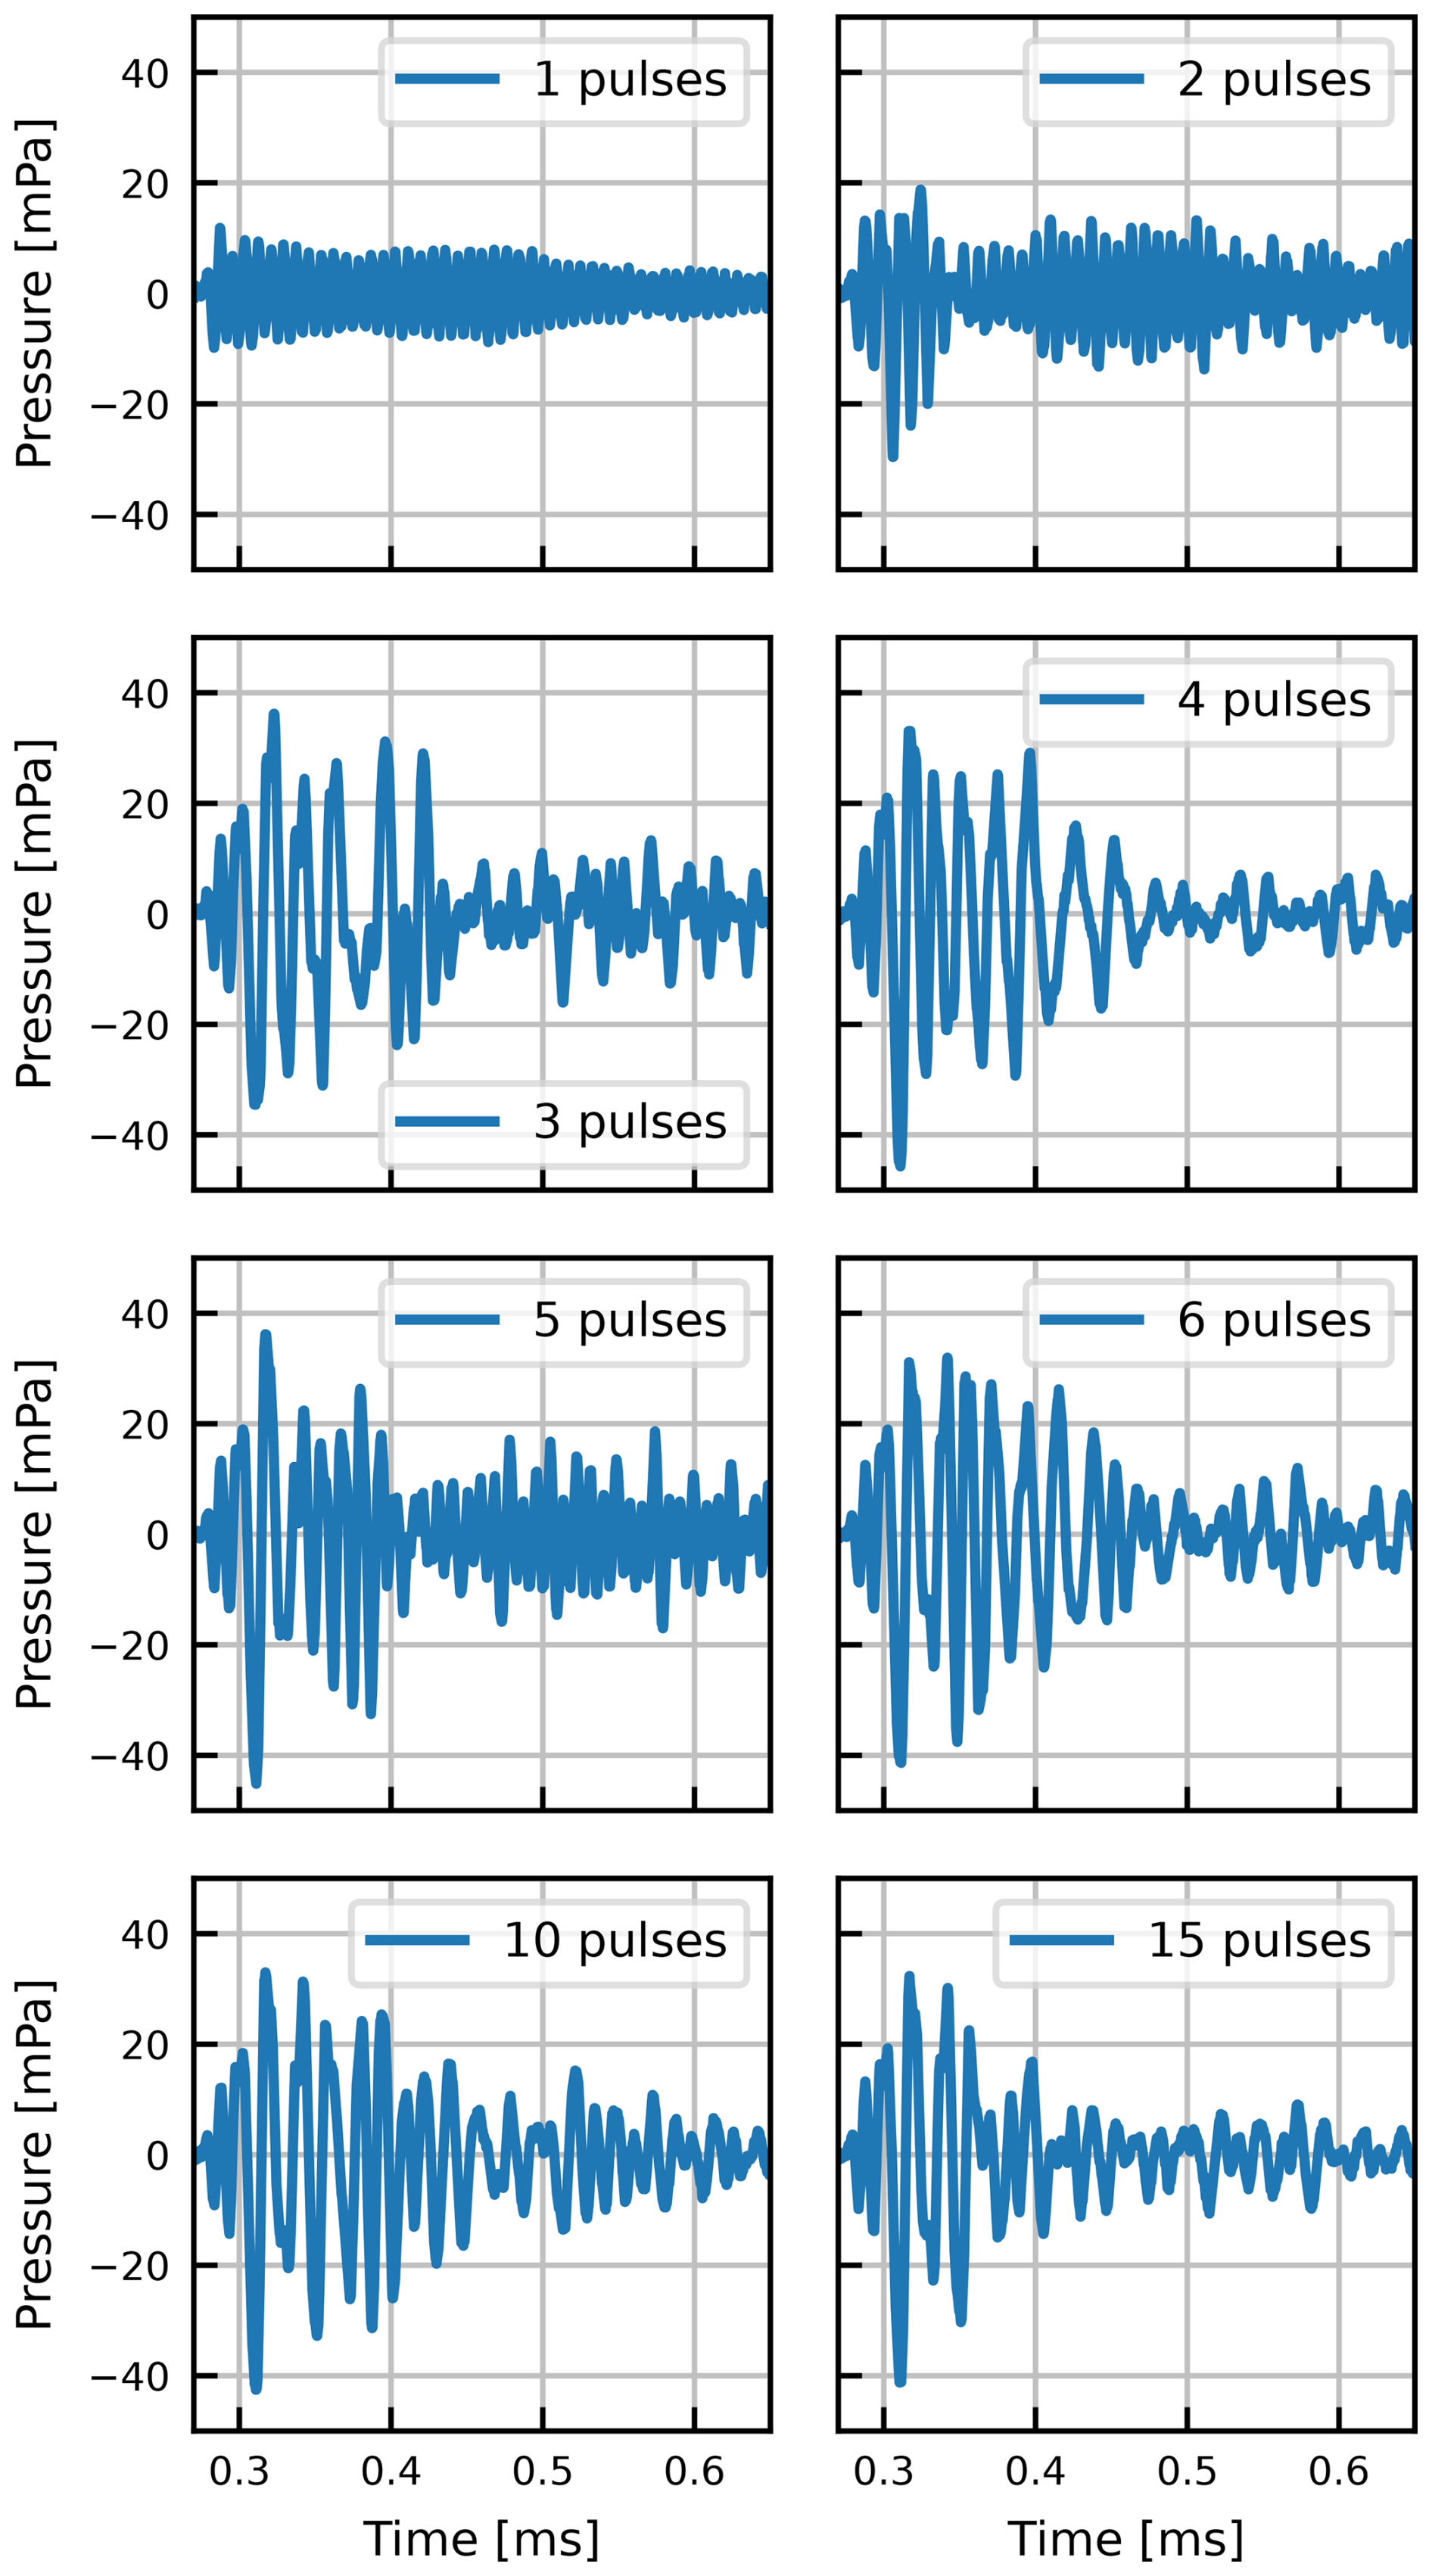
Figure 6Impact of varying the number of excitation pulses n on the pressure signal. The pressure signal is recorded at a distance of 99 mm from the membrane center.
Figure 7 shows the maximum pressure as a function of the distance d. The line shows a fit of a function with a scaling factor a, highlighting the expected inverse relation between pressure and distance . The maximum pressure is chosen in contrast to the sound pressure level (SPL), as the SPL is not a representative quantity when dealing with such short sound pulses. SPL is typically calculated for periodic signals from the root mean square of p(t), which is not a well-defined quantity for pulse signals. In this paper, we use the overall sound pressure level (OSPL) as a more appropriate metric defined as
with the number of FFT lines K, the amplitude of the ith FFT lines FFTi, and the reference pressure . This approach is chosen to provide SPLs more comparable to those obtained from sustained oscillations. The right axis in Fig. 7 shows the OSPL as a function of d and the line represents a fit of
with SPLref as the SPL at a distance of dref. For an arbitrarily chosen distance dref=10 mm, SPLref is the only remaining fitting parameter. Equation (4) is another representation of the inverse relationship between pressure and distance, again resulting in excellent agreement between experiment and theory.
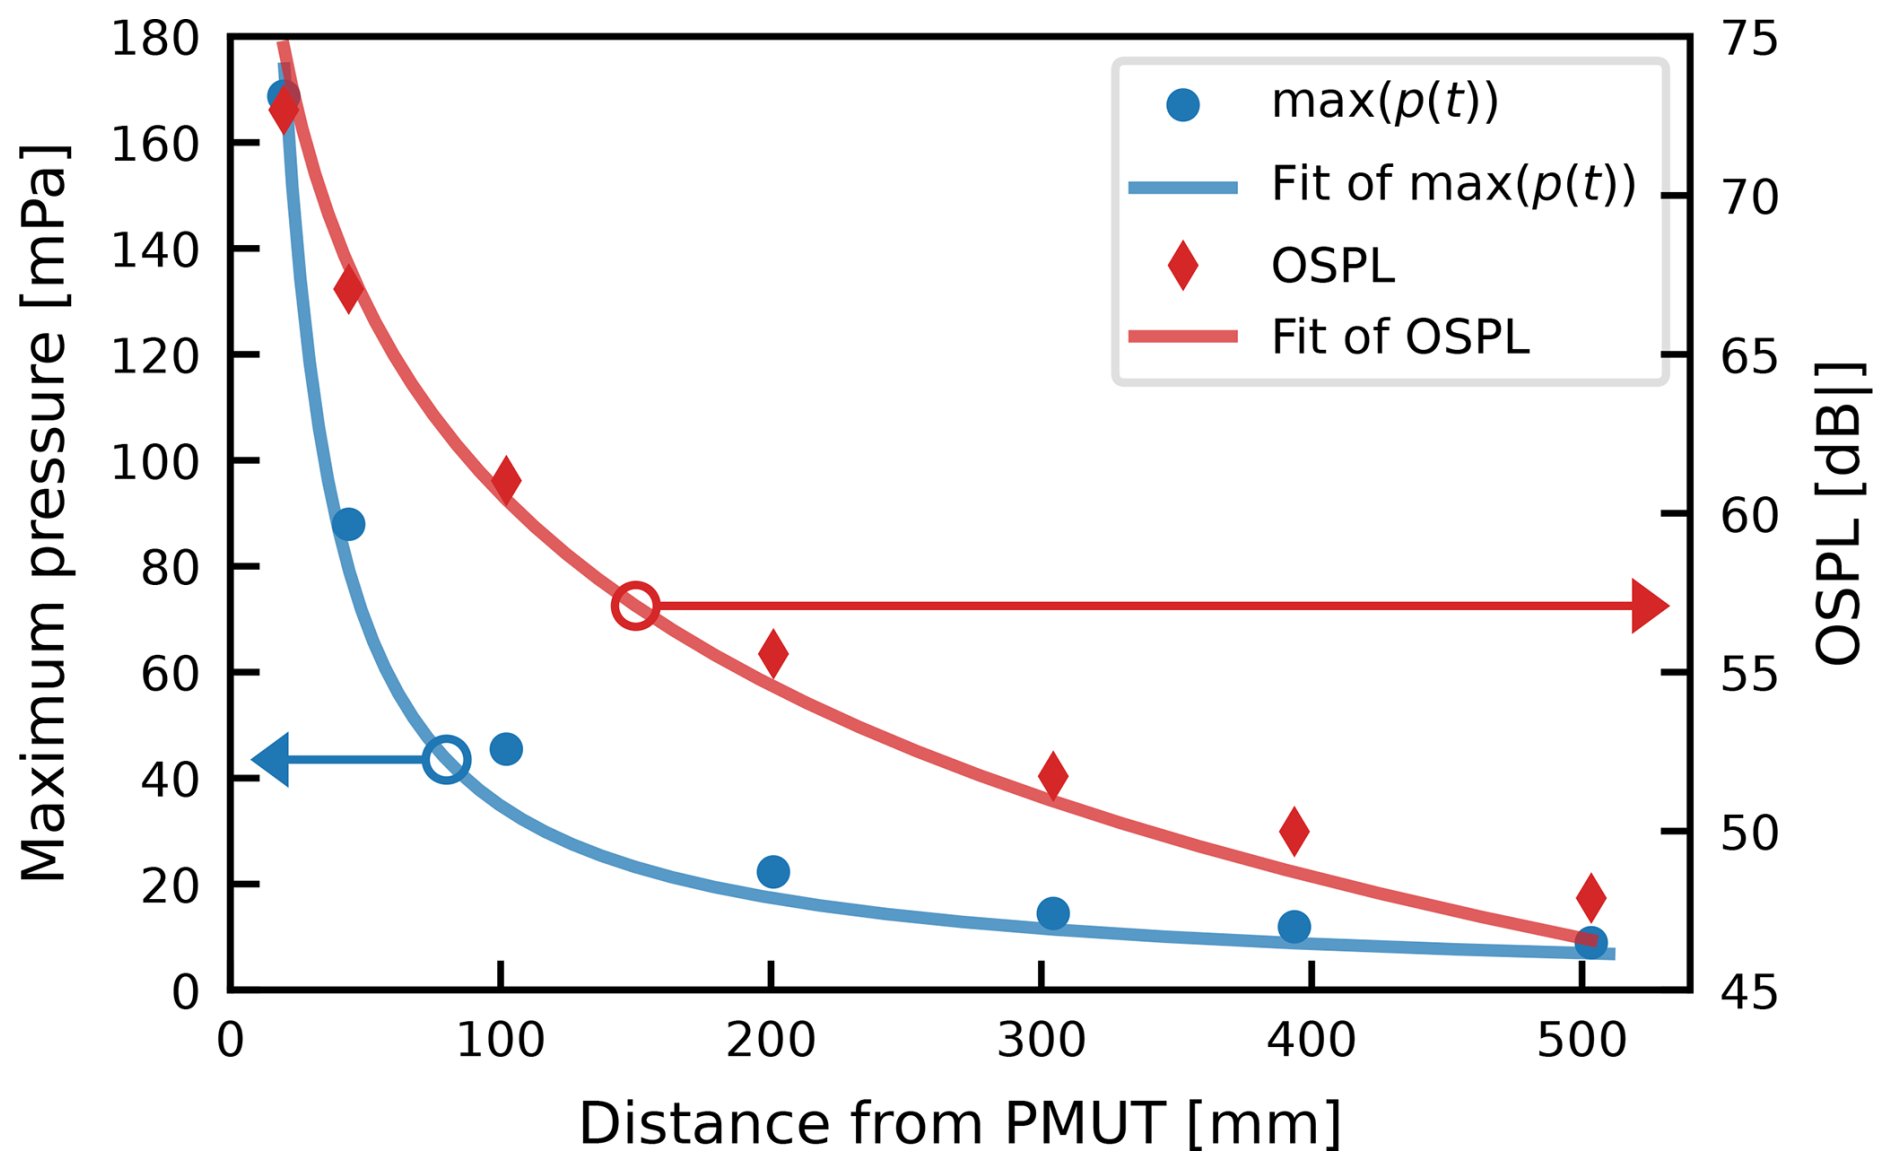
Figure 7(a) Maximum sound pressure and (b) OSPL as a function of distance between the PMUT and microphone.
Triangulation using TOF data from a singular ultrasonic emitter to multiple receivers ideally requires an omnidirectional PMUT. Figure 8 shows the polar emission pattern measured at a distance of d=99 mm for a polar angle θ from 2 to 104° with the PMUT placed in the center. Given the axial symmetry of the PMUT, a variation of the azimuthal angle φ does not change the emission pattern (under the assumption that the fundamental mode dominates). When moving the microphone from on-axis (θ=0°) into a position parallel to the PMUT membrane (θ=90°) and beyond, a decrease in pmax is observed for θ>30°, likely caused by the increasing shadowing of the PMUT by the package, especially for θ>90°. This reproducible behavior is expected; however, the strong decrease towards θ=0° is surprising, and up to now, there has been no quantitative explanation for this pattern. It is likely caused by the complex interaction of acoustic waves with die, DIP, zero-force socket to mount the DIP, and measurement PCB, forming a non-flat topography. Such topographies can lead to constricted emission patterns, as shown in Nayak et al. (2020), and usually require full finite-element analysis (FEA) of the pressure field. Future studies will investigate this behavior using full membrane trajectory measurements as done in Dorfmeister et al. (2019a) in combination with FEA-based acoustic modeling approaches taking the full mounting topography into account.
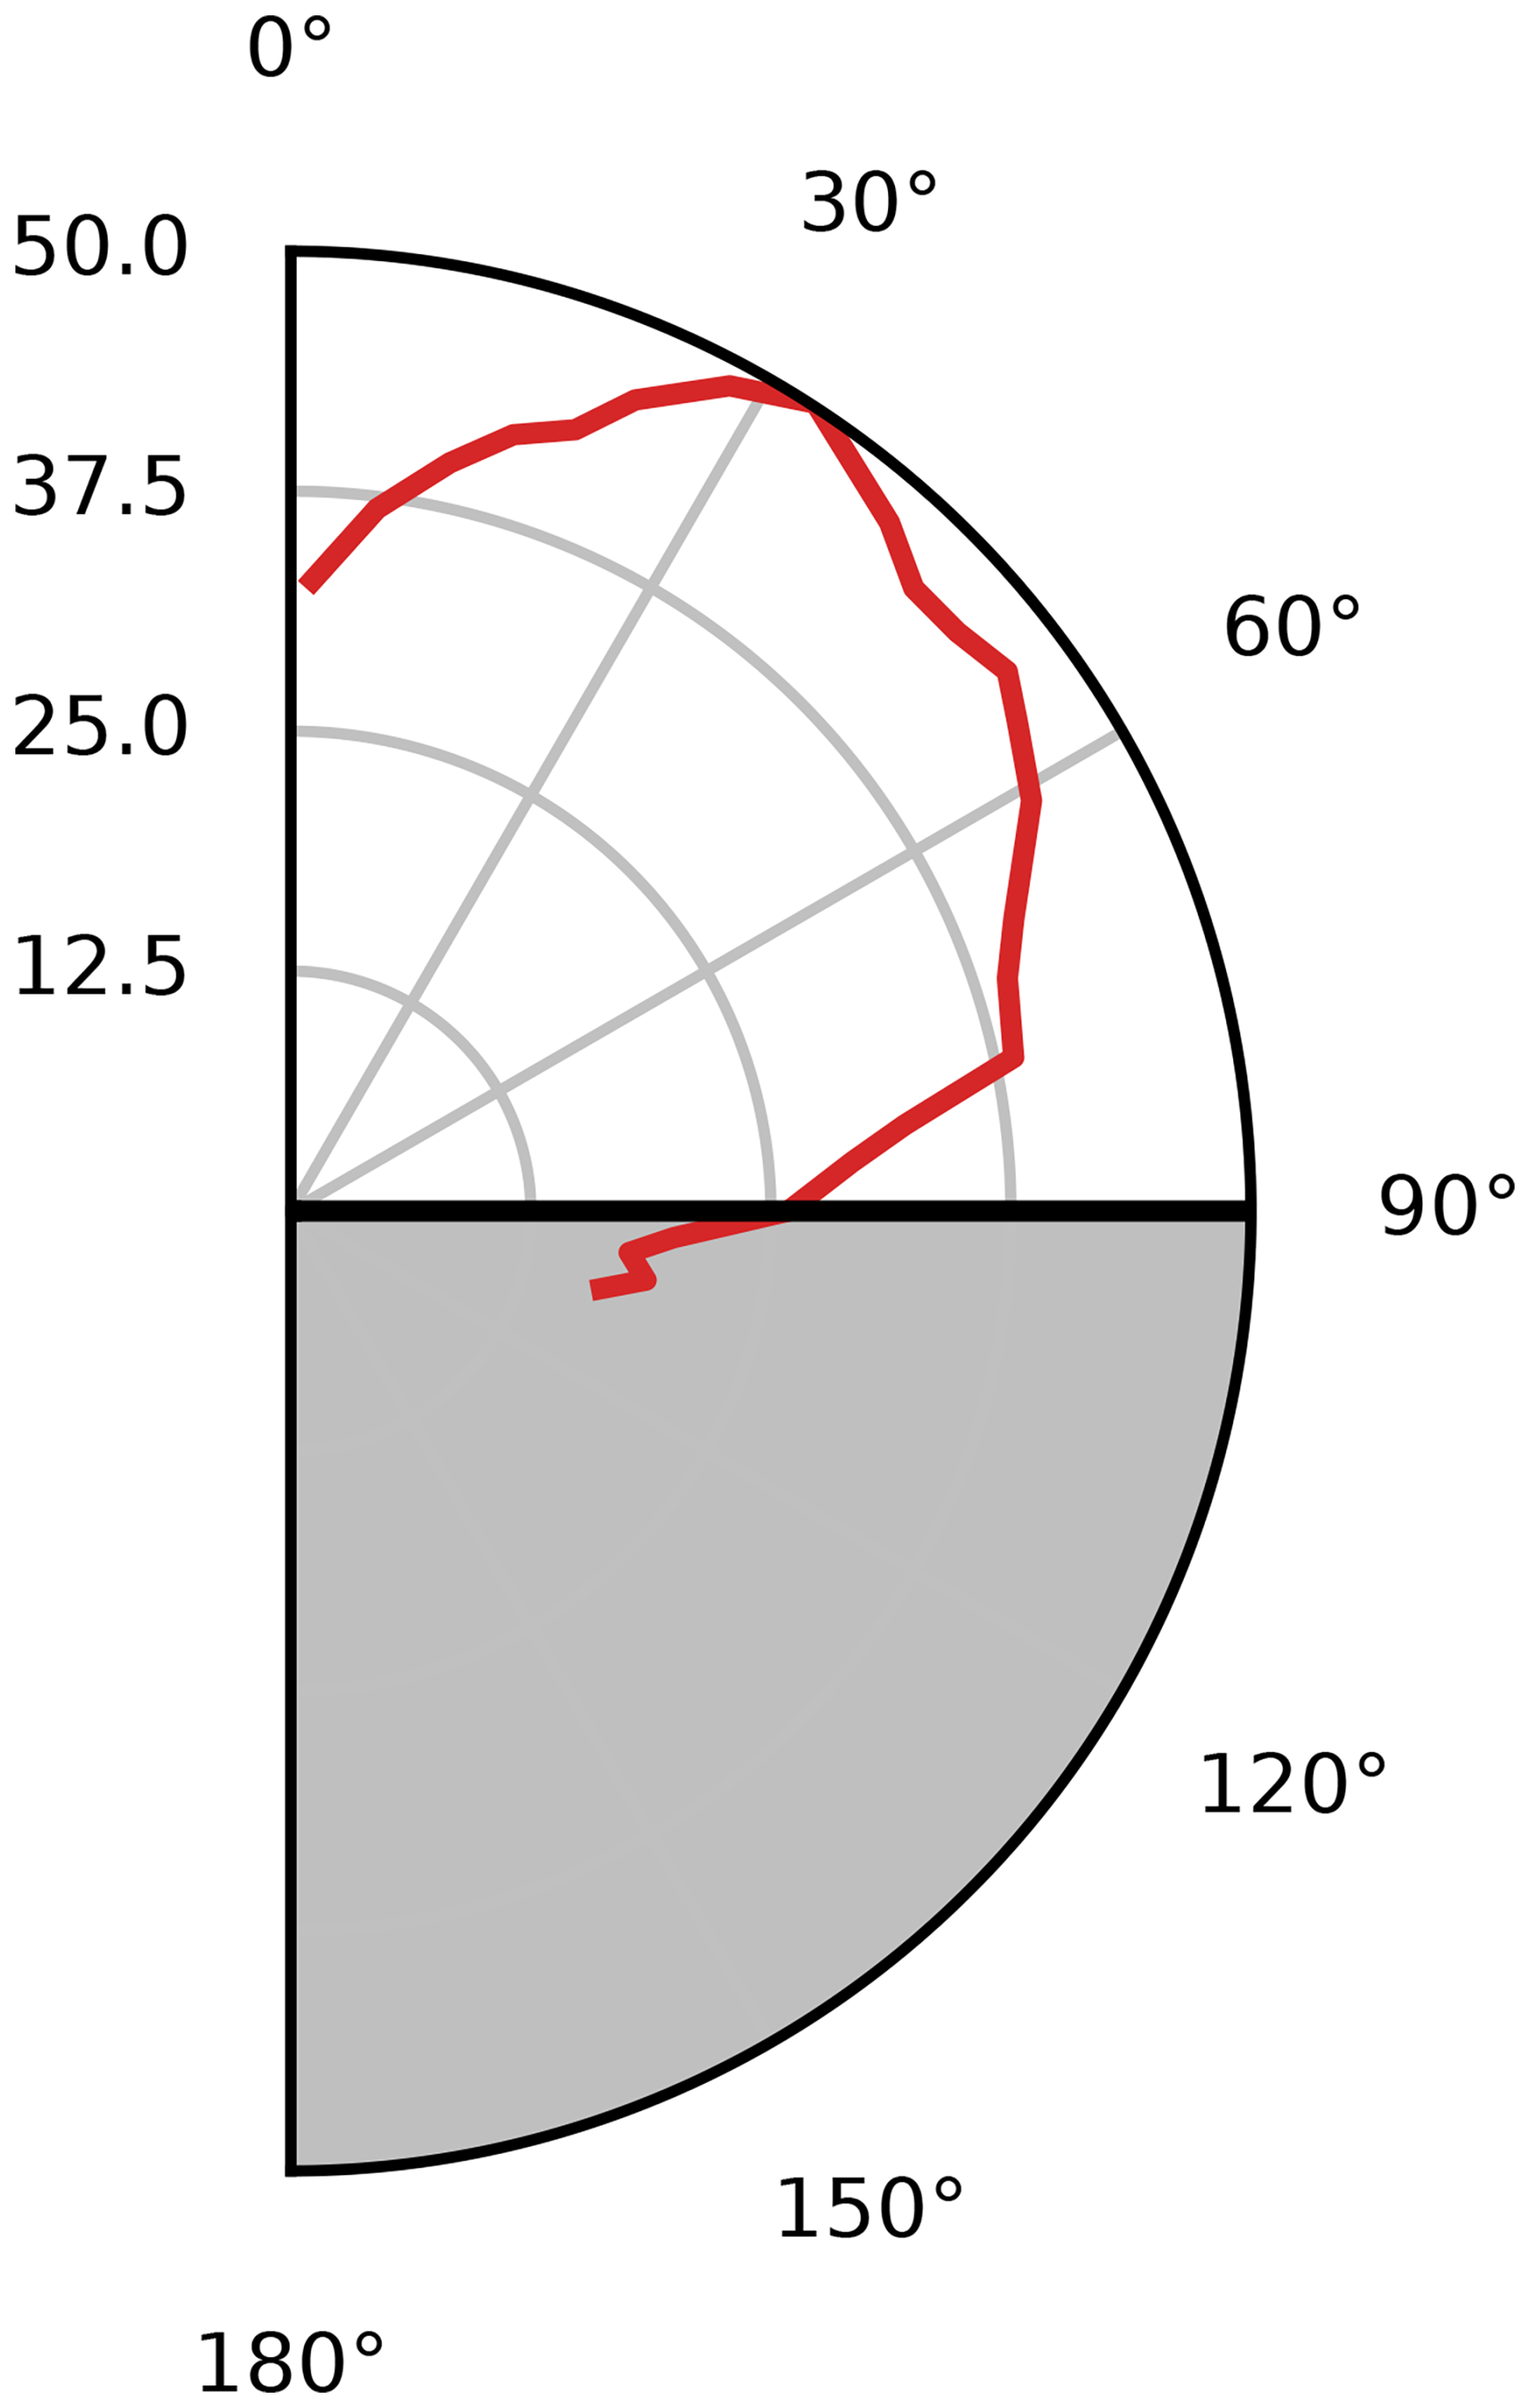
Figure 8Polar emission pattern determined from maximum pressure measured at a distance of 99 mm. Measurement was done from θ=0 to 104°.
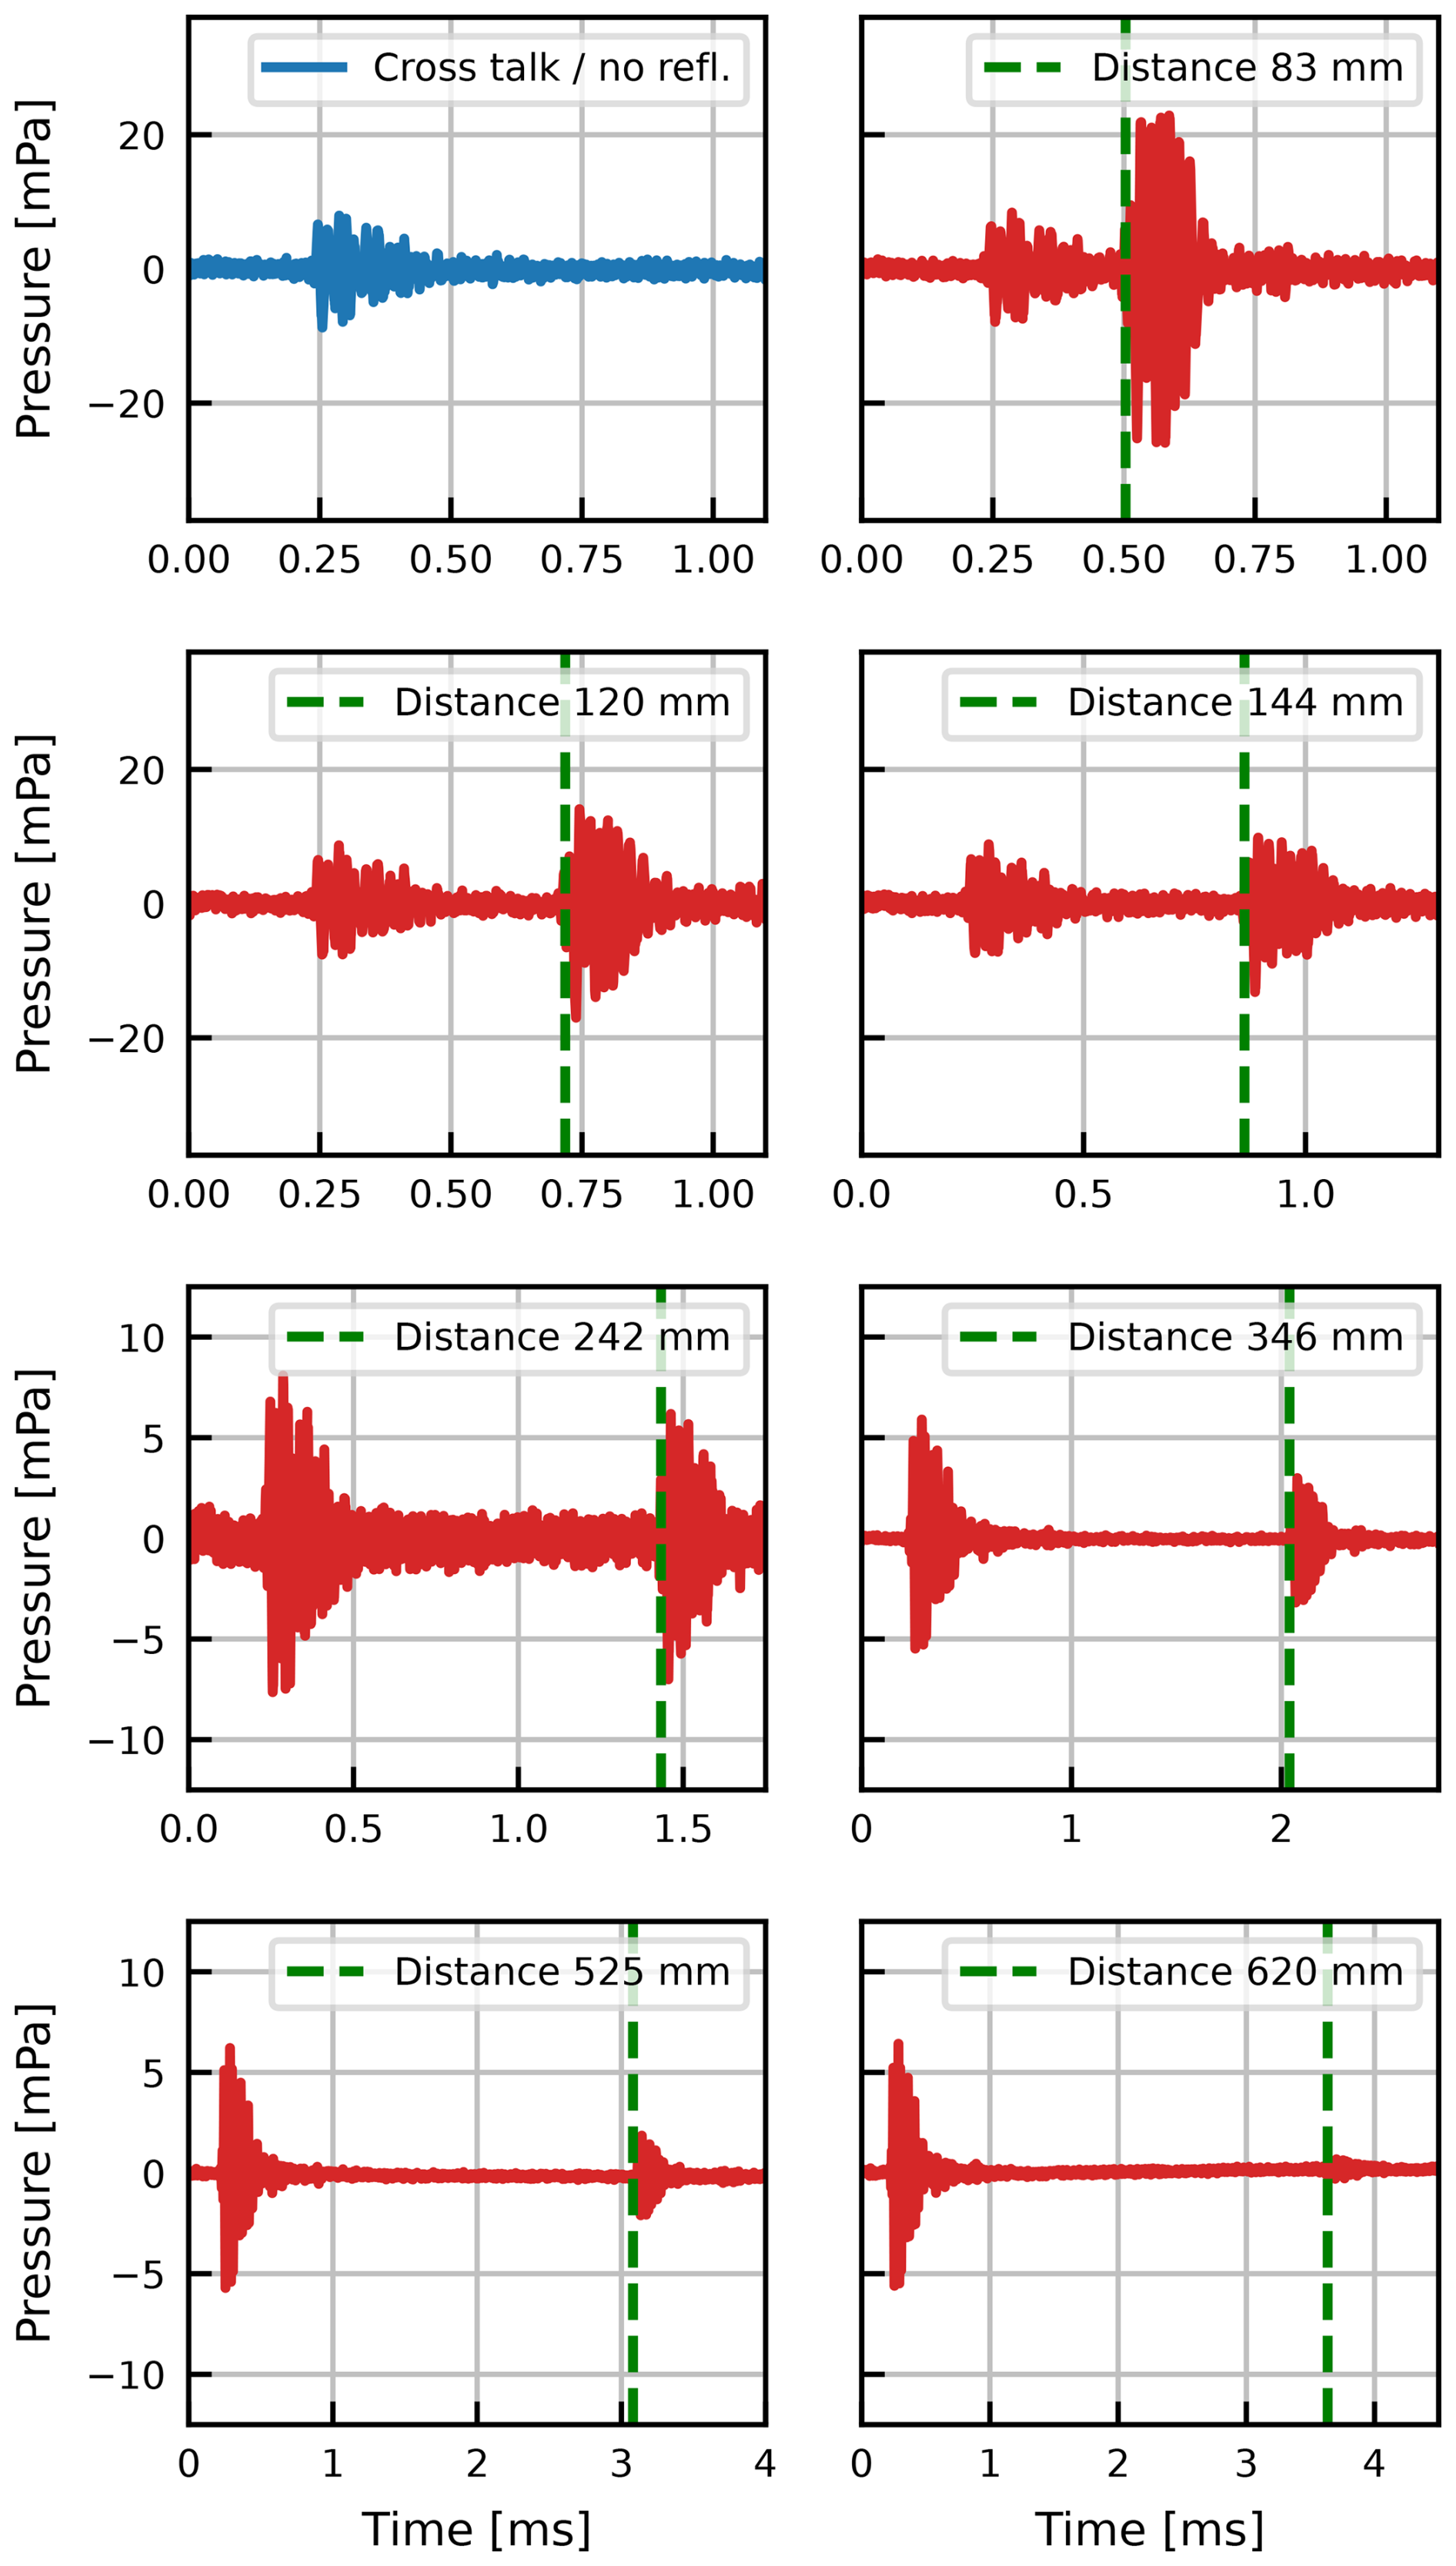
Figure 9Sound pulse reflection measurements at different reflector distances varied from 83 to 620 mm. The first measurement (blue) shows the cross-talk signal without any reflector. The green dashed line indicates the onset of the reflected sound pulse used for time-of-flight analysis.
Finally, to demonstrate the bistable PMUT as a transmitter in a TOF distance measurement setup, the microphone is placed next to the PMUT facing upwards with the microphone's diaphragm at the same height and parallel to the PMUT membrane at a lateral distance of about 85 mm, as shown in Fig. 2b. A 3D-printed plate is placed at various distances from both the PMUT and microphone as acoustic an reflector. The sound pulses generated by the PMUT bounce of the reflector and are subsequently recorded by the microphone after ttof. The sound booth walls are covered with sound-absorbing materials to suppress secondary reflections. The distance is therefore . Since the PMUT also emits sound in-plane (see Fig. 8), the microphone is first hit by the direct pulse after tctlk=0.25 ms, before any reflected pulses arrive. The timing of this cross-talk signal shown in the top left of Fig. 9 is in good agreement with the direct distance of 85 mm between the microphone and PMUT. The other plots in Fig. 9 show both the cross-talk signal at tctlk and the received reflected signal at times . For short distances, the reflected signal is significantly larger compared to the cross-talk signal, which is caused by the lower sound pressure emitted by the PMUT in-plane. In addition, the microphone is only specified for on-axis incidence and is less sensitive (by an unspecified amount) for signals incident perpendicular to the microphone diaphragm.
As the distance is increased, the reflected pulse weakens but is still clearly detectable even at a distance of more than 600 mm. In combination with a single or multiple ultrasound-capable MEMS microphones, both distance sensing and object triangulation could be realized in the future with the developed PMUT.
In this work, the emission pattern of a bistable PMUT has been shown for the first time as well as the expected pressure decrease with distance. A minimum of three excitation signal pulses was required to achieve a sufficient maximum sound pressure, while higher numbers of pulses did not increase the sound pressure level, since the mechanical snap-through amplitude remains constant. The increasingly chaotic behavior of subsequent snap-throughs became apparent by averaging multiple sound pressure events to increase the signal-to-noise ratio, resulting in the presence of only the first few sound pulses in the averaged signal. Reflection measurements finally demonstrated the feasibility of bistable PMUTs for ultrasonic ranging applications. Future work will focus on a more in-depth study of these bistable PMUTs, especially in continuous operation to provide proper sound pressure level values and measures to decrease the increasingly chaotic behavior of these devices with an increasing number of snap-throughs.
All of the data in this work were generated by the authors and are available upon reasonable request.
MS, MM, and DM equally conceptualized the study, developed the methodology, performed the experiments, and collected the data. MS performed data analysis and visualization. MS, MK, and US acquired the funding for this work and provided the resources. MS supervised the involved PhD student and heads the involved Christian Doppler Laboratory, with co-supervision by US. The original draft was written by MS and revised equally by all authors.
At least one of the (co-)authors is a member of the editorial board of Journal of Sensors and Sensor Systems. The peer-review process was guided by an independent editor, and the authors also have no other competing interests to declare.
Publisher’s note: Copernicus Publications remains neutral with regard to jurisdictional claims made in the text, published maps, institutional affiliations, or any other geographical representation in this paper. While Copernicus Publications makes every effort to include appropriate place names, the final responsibility lies with the authors. Views expressed in the text are those of the authors and do not necessarily reflect the views of the publisher.
This article is part of the special issue “Eurosensors 2024”. It is a result of the EUROSENSORS XXXVI, Debrecen, Hungary, 1–4 September 2024.
This work is done within the Christian Doppler Laboratory for Piezoelectric Silicon MEMS with Enhanced Sensitivity and Responsivity – CDL PiezoMEMS – co-funded by Infineon Technologies AG and scia Systems GmbH. The financial support by the Austrian Federal Ministry for Labour and Economy, the National Foundation for Research, Technology and Development, and the Christian Doppler Research Association is gratefully acknowledged.
This research has been supported by the Christian Doppler Forschungsgesellschaft (Christian Doppler Laboratory for Piezoelectric Silicon MEMS with Enhanced Sensitivity and Responsivity).
This paper was edited by Péter Fürjes and reviewed by two anonymous referees.
Akasheh, F., Myers, T., Fraser, J. D., Bose, S., and Bandyopadhyay, A.: Development of piezoelectric micromachined ultrasonic transducers, Sensors and Actuators A: Physical, 111, 275–287, https://doi.org/10.1016/j.sna.2003.11.022, 2004.
Akhbari, S., Sammoura, F., Eovino, B., Yang, C., and Lin, L.: Bimorph Piezoelectric Micromachined Ultrasonic Transducers, Journal of Microelectromechanical Systems, 25, 326–336, https://doi.org/10.1109/JMEMS.2016.2516510, 2016.
Akhbari, S., Sammoura, F., Shelton, S., Yang, C., Horsley, D., and Lin, L.: Highly responsive curved aluminum nitride pMUT, 27th IEEE MEMS, 26–30 January 2014, 124–127, https://doi.org/10.1109/MEMSYS.2014.6765589, 2014.
Akhbari, S., Sammoura, F., Yang, C., Heidari, A., Horsley, D., and Lin, L.: Self-curved diaphragms by stress engineering for highly responsive pMUT, 28th IEEE MEMS, 18–22 January 2015, 837–840, https://doi.org/10.1109/MEMSYS.2015.7051089, 2015.
Baborowski, J., Ledermann, N., and Muralt, P.: Piezoelectric micromachined transducers (PMUT's) based on PZT thin films, 2002 IEEE Ultrasonics Symposium 2002 Proceedings, 8–11 Oct. 2002, vol. 1052, 1051–1054, doi:10.1109/ULTSYM.2002.1192475, 2002.
Bespalova, K., Osterlund, E., Ross, G., Paulasto-Krockel, M., Sebastian, A. T., Karuthedath, C. B., Mertin, S., and Pensala, T.: Characterization of AlScN-Based Multilayer Systems for Piezoelectric Micromachined Ultrasound Transducer (pMUT) Fabrication, Journal of Microelectromechanical Systems, 30, 290–298, https://doi.org/10.1109/jmems.2021.3056928, 2021.
Chen, B., Chu, F., Liu, X., Li, Y., Rong, J., and Jiang, H.: AlN-based piezoelectric micromachined ultrasonic transducer for photoacoustic imaging, Applied Physics Letters, 103, 031118, https://doi.org/10.1063/1.4816085, 2013.
Dausch, D. E., Gilchrist, K. H., Carlson, J. R., Castellucci, J. B., Chou, D. R., and Von Ramm, O. T.: Improved pulse-echo imaging performance for flexure-mode pMUT arrays, Proceedings – IEEE Ultrasonics Symposium, 451–454, https://doi.org/10.1109/ULTSYM.2010.5935826, 2010.
Dorfmeister, M., Schneider, M., and Schmid, U.: Static and dynamic performance of bistable MEMS membranes, Sensors and Actuators A: Physical, 282, 259–268, https://doi.org/10.1016/j.sna.2018.09.038, 2018.
Dorfmeister, M., Schneider, M., and Schmid, U.: 3D characterisation of piezoelectric bistable MEMS membranes during switching, Sensors and Actuators A: Physical, 298, 111576, https://doi.org/10.1016/j.sna.2019.111576, 2019a.
Dorfmeister, M., Kössl, B., Schneider, M., Pfusterschmied, G., and Schmid, U.: Switching performance of bistable membranes activated with integrated piezoelectric thin film transducers, Journal of Micromechanics and Microengineering, 29, 105008, https://doi.org/10.1088/1361-6439/ab3185, 2019b.
Guedes, A., Shelton, S., Przybyla, R., Izyumin, I., Boser, B., and Horsley, D. A.: Aluminum nitride pMUT based on a flexurally-suspended membrane, 16th International Solid-State Sensors, Actuators and Microsystems Conference, 5–9 June 2011, 2062–2065, https://doi.org/10.1109/TRANSDUCERS.2011.5969223, 2011.
Hajati, A., Latev, D., Gardner, D., Hajati, A., Imai, D., Torrey, M., and Schoeppler, M.: Three-dimensional micro electromechanical system piezoelectric ultrasound transducer, Applied Physics Letters, 101, 253101, https://doi.org/10.1063/1.4772469, 2012.
Haller, M. I. and Khuri-Yakub, B. T.: A surface micromachined electrostatic ultrasonic air transducer, IEEE Transactions on Ultrasonics, Ferroelectrics, and Frequency Control, 43, 1–6, https://doi.org/10.1109/58.484456, 1996.
Harne, R. L. and Wang, K. W.: Harnessing Bistable Structural Dynamics: For Vibration Control, Energy Harvesting and Sensing, John Wiley & Sons Ltd., https://doi.org/10.1002/9781119128052, 2017.
Jung, J., Lee, W., Kang, W., Shin, E., Ryu, J., and Choi, H.: Review of piezoelectric micromachined ultrasonic transducers and their applications, Journal of Micromechanics and Microengineering, 27, 113001, https://doi.org/10.1088/1361-6439/aa851b, 2017.
Liu, X., Chen, X., Le, X., Wang, Y., Wu, C., and Xie, J.: Reducing ring-down time of pMUTs with phase shift of driving waveform, Sensors and Actuators A: Physical, 281, 100–107, https://doi.org/10.1016/j.sna.2018.08.039, 2018.
Morris, D. J., Need, R. F., Anderson, M. J., and Bahr, D. F.: Enhanced actuation and acoustic transduction by pressurization of micromachined piezoelectric diaphragms, Sensors and Actuators A: Physical, 161, 164–172, https://doi.org/10.1016/j.sna.2010.05.028, 2010.
Mortada, M., Das, P. T., Schmid, U., and Schneider, M.: High-resolution parametric characterization of snap-through behaviour in bistable PiezoMEMS membranes, Sensors and Actuators A: Physical, 389, 116548, https://doi.org/10.1016/j.sna.2025.116548, 2025.
Muralt, P., Schmitt, D., Ledermann, N., Baborowski, J., Weber, P. K., Steichen, W., Petitgrand, S., Bosseboeuf, A., Setter, N., and Gaucher, P.: Study of PZT coated membrane structures for micromachined ultrasonic transducers [medical imaging], 2001 IEEE Ultrasonics Symposium. Proceedings. An International Symposium (Cat. No.01CH37263), 7–10 October 2001, vol. 902, 907–911 https://doi.org/10.1109/ULTSYM.2001.991867, 2001.
Nayak, B., Gupta, H., Roy, K., Ashok, A., Shastri, V., and Pratap, R.: An Experimental Study of the Acoustic Field of a Single-Cell Piezoelectric Micromachined Ultrasound Transducer (PMUT), 2020 5th IEEE International Conference on Emerging Electronics (ICEE), 26–28 November 2020, 1–4, https://doi.org/10.1109/ICEE50728.2020.9777041, 2020.
Przybyla, R. J., Shelton, S. E., Guedes, A., Izyumin, I. I., Kline, M. H., Horsley, D. A., and Boser, B. E.: In-Air Rangefinding With an AlN Piezoelectric Micromachined Ultrasound Transducer, IEEE Sensors Journal, 11, 2690–2697, https://doi.org/10.1109/JSEN.2011.2157490, 2011.
Przybyla, R. J., Tang, H. Y., Shelton, S. E., Horsley, D. A., and Boser, B. E.: 3D ultrasonic gesture recognition, Digest of Technical Papers – IEEE International Solid-State Circuits Conference, 210–211, https://doi.org/10.1109/ISSCC.2014.6757403, 2014.
Przybyla, R. J., Tang, H., Guedes, A., Shelton, S. E., Horsley, D. A., and Boser, B. E.: 3D Ultrasonic Rangefinder on a Chip, IEEE Journal of Solid-State Circuits, 50, 320–334, https://doi.org/10.1109/JSSC.2014.2364975, 2015.
Rayleigh, J. W. S.: The Theory of Sound, Dover Publications, New York, ISBN-10: 0486602923, ISBN-13: 978-0486602929, 1945.
Sammoura, F., Shelton, S., Akhbari, S., Horsley, D., and Lin, L.: A two-port piezoelectric micromachined ultrasonic transducer, Joint IEEE ISAF/IWATMD/PFM, 12–16 May 2014, 1–4, https://doi.org/10.1109/ISAF.2014.6923004, 2014.
Schneider, M., Dorfmeister, M., Moll, P., Kaltenbacher, M., and Schmid, U.: Bi-Stable Aluminum Nitride-Based Piezoelectric Micromachined Ultrasonic Transducer (PMUT), Journal of Microelectromechanical Systems, 29, 1–6, https://doi.org/10.1109/JMEMS.2020.3004243, 2020.
Schomburg, W. K.: Introduction to Microsystem Design, 2nd, Springer Berlin, Heidelberg, https://doi.org/10.1007/978-3-662-47023-7, 2015.
Suzuki, K., Higuchi, K., and Tanigawa, H.: A silicon electrostatic ultrasonic transducer, IEEE Transactions on Ultrasonics, Ferroelectrics, and Frequency Control, 36, 620–627, https://doi.org/10.1109/58.39112, 1989.
Wang, Z., Zhu, W., Miao, J., Zhu, H., Chao, C., and Tan, O. K.: Micromachined thick film piezoelectric ultrasonic transducer array, Sensors and Actuators A: Physical, 130–131, 485–490, https://doi.org/10.1016/j.sna.2005.10.054, 2006.
Weekers, B., Billen, M., Haouari, R., and Rochus, V.: Design of a PMUT array for Multifrequency Imaging, 2021 22nd International Conference on Thermal, Mechanical and Multi-Physics Simulation and Experiments in Microelectronics and Microsystems (EuroSimE), https://doi.org/10.1109/eurosime52062.2021.9410846, 2021.
Yamashita, K., Katata, H., Okuyama, M., Miyoshi, H., Kato, G., Aoyagi, S., and Suzuki, Y.: Arrayed ultrasonic microsensors with high directivity for in-air use using PZT thin film on silicon diaphragms, Sensors and Actuators A: Physical, 97–98, 302–307, https://doi.org/10.1016/S0924-4247(02)00037-7, 2002.
Yamashita, K., Nishiumi, T., Arai, K., Tanaka, H., and Noda, M.: Intrinsic Stress Control of Sol-Gel Derived PZT Films for Buckled Diaphragm Structures of Highly Sensitive Ultrasonic Microsensors, Procedia Engineering, 120, 1205–1208, https://doi.org/10.1016/j.proeng.2015.08.802, 2015.