the Creative Commons Attribution 4.0 License.
the Creative Commons Attribution 4.0 License.
 | 19 Jun 2025
Ultrasonic time-of-flight measurements for inline gas analysis and process monitoring in the phenolic urethane cold box process
Jakob Sablowski
Muhammad Talal Asghar
Mohammed Shakeer Khan
Michal Szucki
Christian Kupsch
The phenolic urethane cold box (PUCB) process is widely employed for sand core production in the foundry industry. It allows high production rates of sand cores, which are later used for producing complex metal castings. The process begins by shooting a sand–binder mixture into a core box to define the core geometry. During the subsequent curing stage, catalysts are introduced to harden the binders and are then removed by blowing dry compressed air through the sand core. In order to optimize this complex and highly dynamic production process for efficiency and core quality, there is a need for measurement systems that can reliably monitor the curing stage.
In this study, we present a measurement system capable of capturing the dynamics of the PUCB core-curing stage via ultrasonic time-of-flight measurements. By measuring the speed of sound, the concentration of the catalyst in the exhaust airstream is determined. Volumetric flow rate and temperature are measured simultaneously. The measurement system is validated, and measurement uncertainties are discussed.
We demonstrate the measurement system in a PUCB core-making machine using N,N-dimethyl-n-propylamine (DMPA) as the catalyst. DMPA concentrations of up to 3.6 % ± 0.5 % (coverage factor k=1) were found in the exhaust airstream. The measurements provide insights into the dynamics of the curing stage, and we showcase the potential for the optimization of catalyst removal. Integrating this measurement system into core-making machines enables automation strategies, potentially enhancing efficiency and product quality in foundry operations.
- Article
(1580 KB) - Full-text XML
- BibTeX
- EndNote


1.1 Sand core production with the phenolic urethane cold box process
The phenolic urethane cold box (PUCB) process is used in the foundry industry to produce sand cores, which are essential for giving complex internal shapes to metal castings. It is known for high production rates and is the most widely used process for sand core production (Holtzer and Kmita, 2020).
The PUCB process can be divided into three steps. First, a mixture of sand and chemical binders is shot into the core box. This is followed by core curing, which consists of the gassing and purging steps. During gassing, a catalyst such as N,N-dimethyl-n-propylamine (C5H13N), referred to in the paper as DMPA, is blown through the core box with compressed air. The interaction between DMPA and binders initiates a polyaddition reaction and facilitates fast formation of hard urethane linkages between the sand grains. After hardening, the catalyst is removed from the sand core by an airstream during the purging step.
The distribution of the catalyst in the sand core during the gassing and purging steps influences the resulting core quality (Khan and Szucki, 2024). Both steps involve complex flow dynamics within the sand core. Temperature changes and phase changes of the catalyst can occur as well. These phenomena are in turn influenced by the core geometry and the properties of the sand–binder mixture.
In this context, the duration of the purging step is a crucial parameter. If the duration is too short, some of the catalyst remains in the sand core after it is removed from the PUCB machine, which poses a safety and environmental hazard. If the purging duration is unnecessarily long, the overall efficiency of the sand core production is reduced. Currently, the purging duration has to be set manually by the operator of the machine along with other input parameters. These parameters are selected individually on a digital process control unit in a core-making machine. Selection of optimal input parameters for different core geometries, such as catalyst quantity, system air pressure, and purging time can be challenging. Generally, the amine quantity for a core is selected based on the sand-to-amine weight ratio ranging between 0.2 and 1 mL kg−1 of sand-to-binder proportion ranging between 1 % and 2 % (Holtzer and Kmita, 2020). Due to a lack of real-time monitoring systems and the variety of core designs, the cold box process parameters are selected using trial-and-error methods and the experience of the machine operator. Core simulation tools have been useful in predicting the quality of the core for a given input parameter (Sturm and Wagner, 2014). Continuous efforts are being made to bring accuracy and precision in predicting the core quality using various simulation approaches (Khan et al., 2024). To better validate these simulations, measurements of the catalyst output during the purging process are required.
1.2 Gas analysis based on speed-of-sound measurements
Due to the introduction and removal of the catalyst during the core-curing stage of the PUCB process, the composition of the exhaust airstream changes during the process. These changes occur within seconds and are correlated to the different process steps and the process parameters of the PUCB process. Detecting changes in the gas composition therefore provides valuable information about the process. One possibility for facilitating a sufficiently fast inline gas analysis is the measurement of the speed of sound in the exhaust airstream.
The speed of sound of a gas depends on the composition and thermodynamic state of the gas. This relation has been applied for high-accuracy gas temperature measurements using acoustic resonators (Moldover et al., 2014). The speed of sound can also be calculated via ultrasonic time-of-flight measurements, which is usually less accurate compared to the measurements with acoustic resonators. However, ultrasonic time-of-flight measurements are already widely used for flow measurements in industrial applications, and the speed of sound is a by-product of the calculation of the flow velocity. This provides the opportunity for inline gas analysis during flow measurements.
Ultrasonic time-of-flight measurements have been investigated to analyze binary gas mixtures (Joos et al., 1993). This allows for, for example, measuring the humidity of air with a gas flow meter (Löfqvist et al., 2003). An emerging application of this principle is the characterization of mixtures of natural gas and hydrogen (Monsalve et al., 2024). Compared to other measurement principles for inline gas analysis, such as metal oxide gas sensors, infrared spectroscopy, or gas chromatography, ultrasonic time-of-flight measurements are fast, robust, and relatively inexpensive. Combining these characteristics with the possibility of simultaneous flow measurement is promising for applications in the context of the PUCB process.
1.3 Aim and outline of this article
In this study, we present an ultrasonic measurement system for the simultaneous measurement of DMPA concentration and volumetric flow rate at the exhaust vents of PUCB machines. The measurement system comprises an ultrasonic flow sensor and a temperature sensor. Volumetric flow rate and speed-of-sound measurements are performed using the ultrasonic time-of-flight method. Measurements of temperature and the speed of sound are used to calculate the DMPA concentration in a binary mixture of air and DMPA. This allows us to monitor the PUCB process and to derive process parameters such as the purging duration. The measurement system could potentially be used to optimize the core-making process in real time for each individual sand core to reduce production times.
In Sect. 2, the measurement concept is introduced along with basic concepts, including the principles of ultrasonic time-of-flight measurements and the method for calculating DMPA concentration from speed-of-sound measurements. Then, the experimental setup and methodology used to validate the measurement system on a PUCB core-making machine are described, and the measurement uncertainty is evaluated. In Sect. 4, the results of the validation experiments are presented, and the potential for optimization of the PUCB process is demonstrated, focussing on the purging step of the PUCB process. Section 5 concludes the study by summarizing the key findings and potential applications of the measurement system.
2.1 Ultrasonic time-of-flight principle
The ultrasonic time-of-flight method allows us to measure the volumetric flow rate of liquids and gases by measuring the time of flight of ultrasonic pulses propagating through the fluid. The principle is based on the alignment of the propagation path of the ultrasonic wave with the flow direction of the fluid. When the ultrasonic wave propagates in the flow direction (downstream direction), the time of flight between the transmitter and receiver decreases with increasing flow rates. Conversely, the time of flight increases when the ultrasonic wave propagates against the flow direction (upstream direction). The measurement principle is illustrated in Fig. 1.
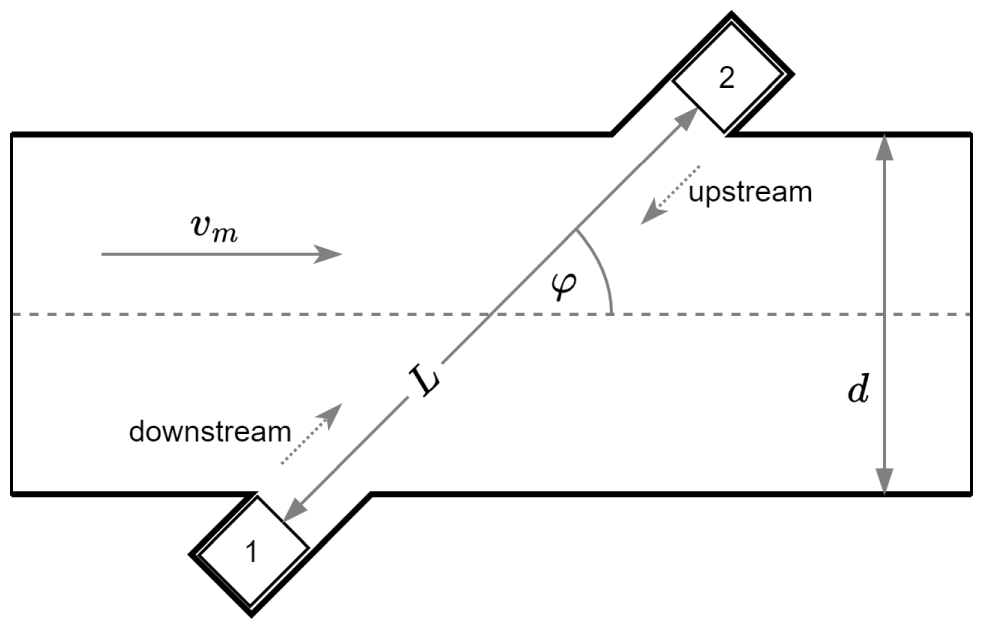
Figure 1Ultrasonic time-of-flight measurement in a flow channel with two ultrasonic transducers marked as 1 and 2, showing the mean velocity of the fluid vm, the angle between the acoustic path and the fluid flow direction φ, the inner diameter of the flow channel d, the distance between the two transducers L, and the directions of the upstream and downstream ultrasonic signals.
The velocity of the moving medium can be calculated by measuring the time of flight in both directions. When the ultrasonic transducer 1 transmits an ultrasonic pulse, the ultrasonic waves propagate in the direction of the fluid flow and are received by transducer 2. The time of flight of this downstream signal is represented by Eq. (1):
where td is the time of flight in the direction of fluid flow, L is the length of the acoustic path, φ is the angle between the acoustic path and fluid flow direction, vm is the mean velocity of the fluid flow along the acoustic path, and c is the speed of sound in the fluid. The speed of sound depends on the temperature and the fluid properties.
Ultrasonic transducer 2 transmits ultrasonic waves that propagate through the fluid in the direction against the fluid flow and are received by ultrasonic transducer 1. The time of flight (tu) for this upstream signal is represented by Eq. (2):
The mean fluid velocity (vm) can be calculated by
Note that this equation includes the approximation . The speed of sound c can be obtained by
Equation (3) is valid if the transducers are located exactly at the walls of the pipe and the fluid flow fills the whole area between them. By approximation, this is also true if the diameter of the flow channel is very large compared to the distance of the transducers from the walls of the flow channel. This is the case in most applications. In cases where the transducers are placed further apart, such as in the sensor module shown in Fig. 3, there are some parts along the signal path without any flow in the direction of the flow channel. In these cases, the additional time that the ultrasound pulses take to reach the gas flow needs to be considered, and tu and td are then calculated by
and
where d is the diameter of the flow channel. With these equations in mind, vm is then calculated by
2.2 Calculation of DMPA concentration
In the context of the PUCB process, the main focus is the measurement of the concentration of the catalyst DMPA in the exhaust airstream. The fluid properties of DMPA are presented in Table 1.
Table 1Properties of DMPA (Haynes et al., 2017; GESTIS Substance Database, 2024) and Chemical Abstracts Service (CAS) Registry Number.
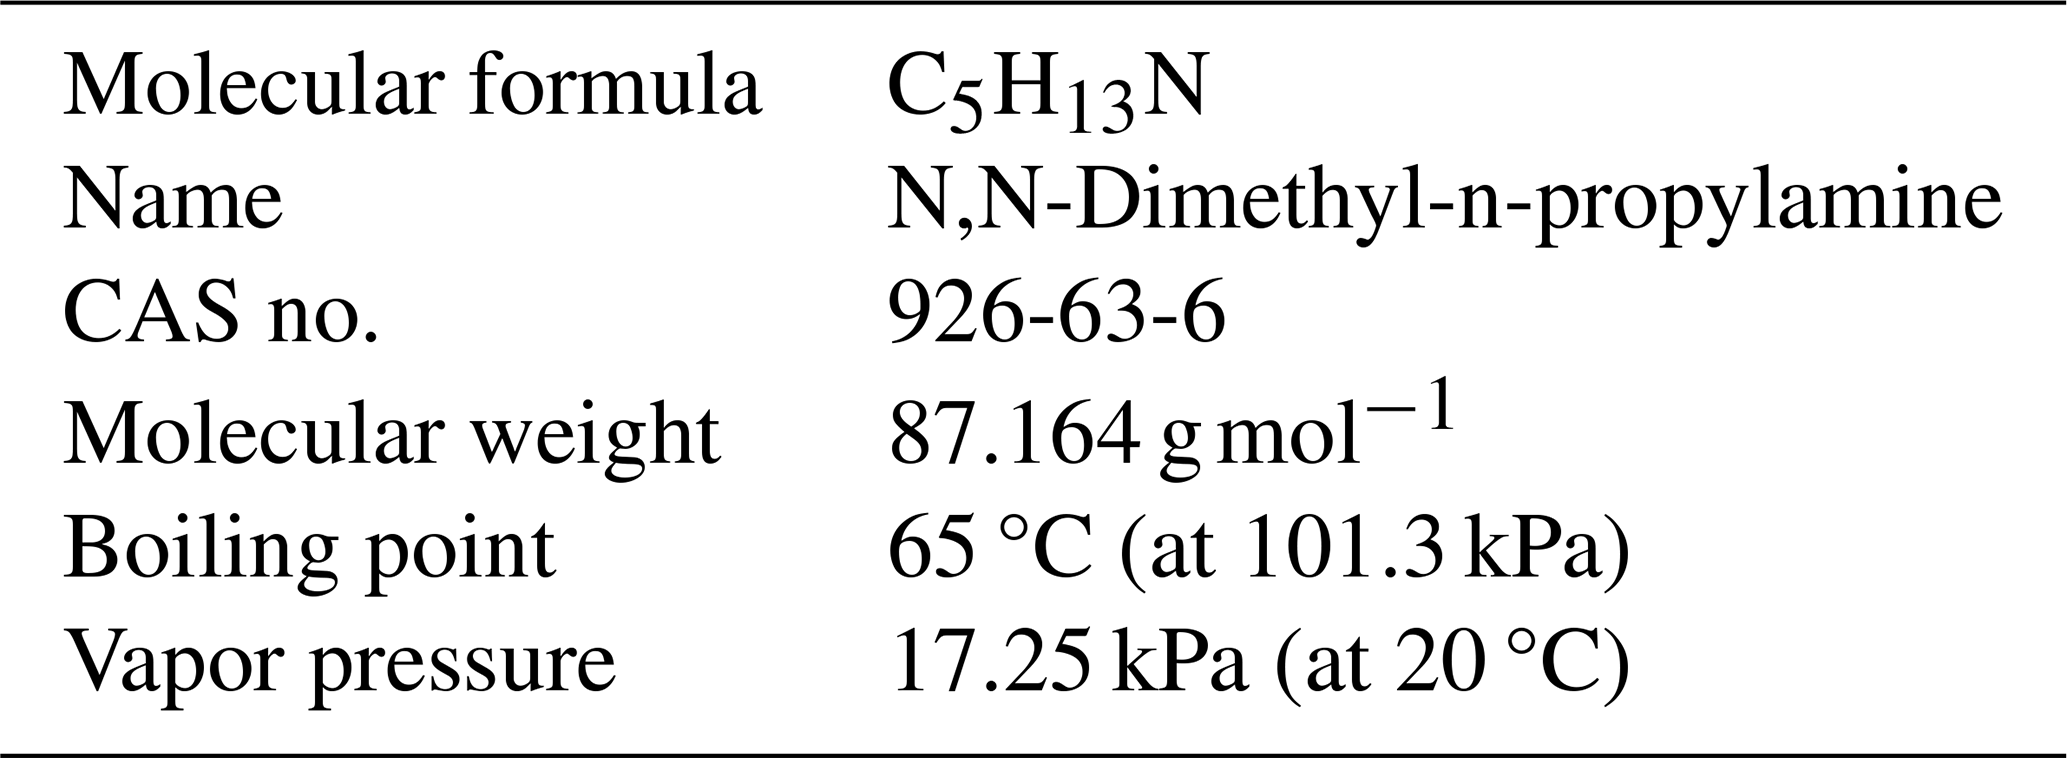
During the purging step of the PUCB process, air is blown through the sand core to remove DMPA from it. Since temperatures are below the boiling point of DMPA, this can be understood as a convective drying process. The exhaust gas is assumed to be a mixture of air and DMPA vapor. From the vapor pressure of DMPA presented in Table 1, the maximum DMPA concentration in the exhaust gas is estimated to be 17 % at a temperature of 20 °C. The actual concentration of DMPA in the exhaust airstream is unknown. The goal of the time-of-flight measurement is to measure the DMPA concentration based on the speed of sound in the exhaust stream.
Assuming ideal gas behavior for the mixture of air and DMPA, the mixture speed of sound (cm) can be calculated by
where γm is the heat capacity ratio of the mixture, R0 is the gas constant, T is the absolute temperature in kelvin, and Mm is the molar mass of the mixture. The molar mass Mm and the heat capacity ratio γm can be calculated by
and
where xi is the molar mass fraction, cp,i is the mass specific isobaric heat capacity, and cv,i is the mass specific isochoric heat capacity for component i.
We use Mayer's relation, that is
and the definition of the heat capacity ratio, that is
Therefore, Eq. (10) results in
For a binary mixture with only two gas components (denoted here by subscripts 1 and 2), such as the mixture of air and DMPA, the speed of sound of the mixture can be derived from Eqs. (8), (9), and (13):
Equation (14) provides a direct relation between the speed of sound of the mixture cm, which can be calculated from the ultrasonic time of flight with Eq. (4), and the molar fraction of component 1 x1.
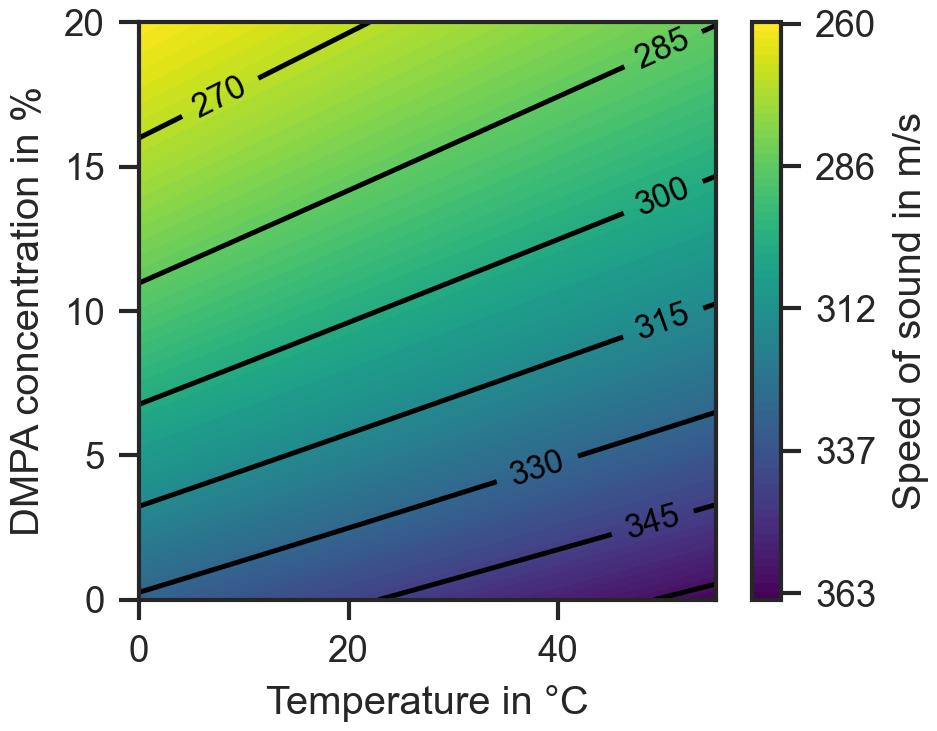
The specific heat capacity ratio of DMPA is estimated based on its molecular structure using the Joback group contribution method (Joback and Reid, 1987). For the relevant temperature range of 0 to 60 °C, this results in a heat capacity ratio in the range of 1.058 to 1.070. For the calculations in this study, a constant value of γ=1.07 is assumed for the gas phase of DMPA. Using Eq. (14), the theoretical value of the speed of sound in a mixture of DMPA and air can be determined depending on the concentration and temperature of the gas mixture. The result is shown in Fig. 2. This relation allows for the calculation of the DMPA concentration from the speed of sound and the temperature of the gas mixture in the PUCB process.
2.3 Measurement system design
The main purpose of the measurement system is the monitoring of the DMPA concentration and flow rate of the exhaust airstream after the core box. This allows for conclusions about the process dynamics in the core-making machine and enables process control strategies to optimize production times and core quality.
To capture the dynamics of the PUCB process, a measurement rate of at least 2 s−1 is aimed for. The sensor module should allow for integration into existing PUCB machinery. This means that the sensor module should be relatively small, robust, and inexpensive. In comparison to these requirements, a high accuracy of the flow rate and DMPA measurements is not the primary concern as long as the measurements are precise enough to detect changes and have a high repeatability.
To implement the time-of-flight principle, a 3D-printed sensor module was fabricated. The sensor module consists of two parts and a sealing plate. The sensor module has a flow channel with an internal diameter of 6 mm and a length of 120 mm. The flow channel has a small opening to install a thermocouple within the gas flow. The ultrasound transducers are arranged on opposite sides of the flow channel at an angle of 45°. The ultrasound transducers are arranged at a distance to the walls of the flow channel. This is done to ensure that the time of flight is sufficiently large to avoid any overlap between the received ultrasound signals at one transducer and electromagnetic interferences from the excitation of the opposite transducer. Figure 3 shows the sensor module. The upper part of the sensor module is a vertically mirrored version of the lower part but without the thermocouple opening. Both parts are connected by screws with the sealing plate and both ultrasound transducers in between.
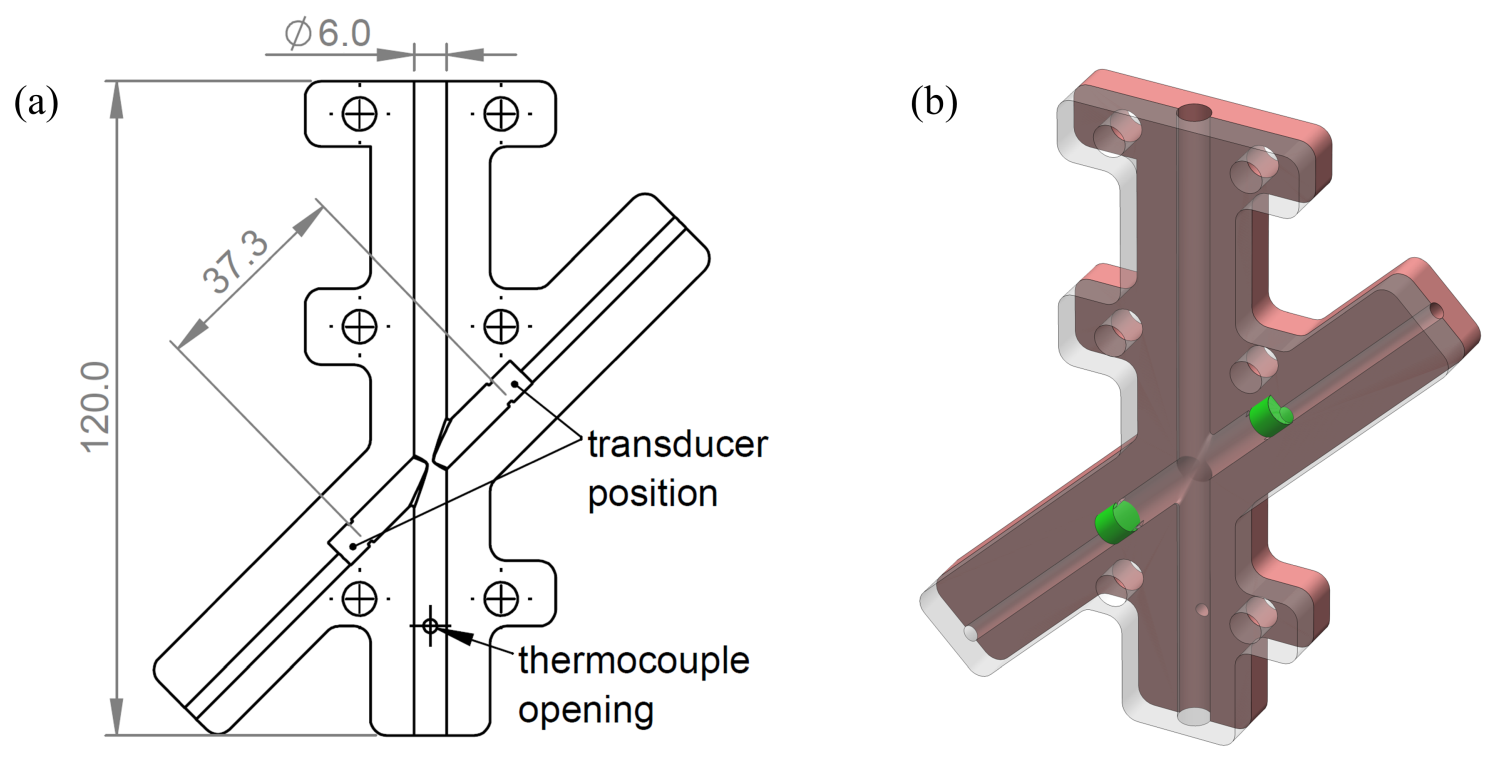
Figure 3Sensor module. (a) A drawing of the lower part of the sensor module with the positions of the thermocouple and the transducers. The flow direction is from top to bottom. All dimensions are in millimeters. (b) A 3D rendering of sensor module with the lower part shown in red, the transducers in green, and the top part transparent.
Piezoelectric ultrasonic transducers (SC049-A, SECO-Sensor GmbH, Coburg, Germany) with an outer diameter of 6 mm and a resonance frequency of 490 ± 15 kHz were used in the setup. The us4R-lite ultrasound platform (us4us, Warsaw, Poland) was used for data acquisition and to excite the transducers. The transducers were excited with square wave signals with a center frequency of 490 kHz (1 period, peak-to-peak voltage of 60 V, pulse repetition frequency of 500 Hz).
Temperatures in the flow channel of the sensor module were measured with a type-k thermocouple wire (T 190-11, Ahlborn Mess- und Regelungstechnik GmbH, Holzkirchen, Germany). For the reference measurements, an additional PT100 resistance thermometer (Ahlborn Mess- und Regelungstechnik GmbH, Holzkirchen, Germany) was placed in the flow channel for a more accurate temperature measurement. The PT100 and the thermocouple were connected to a measurement and data acquisition device (ALMEMO 710, Ahlborn Mess- und Regelungstechnik GmbH, Holzkirchen, Germany). This data acquisition device and the us4R-Lite platform were connected to a computer to control the measurements and to save the measurement data.
2.4 Ultrasound signal processing
The ultrasonic signals received at the transducers are evaluated in order to obtain the time of flight for the upstream and for the downstream direction. For preprocessing, the signals were first averaged over 50 repetitions to reduce noise, assuming a stationary process during the measurement. Subsequently, forward–backward filtering is applied with a fourth-order Butterworth bandpass filter (lower and upper −3 dB cutoff frequencies of 400 and 800 kHz).
Estimating the time of flight directly from the measurement signal is often unreliable. Therefore, each measurement signal is compared to a reference signal to obtain a time offset Δt of the wave package. The reference signals (upstream and downstream signals) were measured under well-known conditions in pure air and without any flow through the sensor module. The time of flight for the reference signal tref is calculated from theory based on the temperature-dependent speed of sound in air and the distance between the transducers. The time of flight for each measurement is then calculated by obtaining the time offset Δt relative to the reference signal and adding it to the reference time of flight tref:
This is done separately for the upstream and downstream signals. The same reference signals are used for all measurements.
To obtain the time offset Δt, the reference and measurement signals are first windowed with a window length of 4300 samples (corresponding to a time window of 66.2 µs) around the wave package with the highest amplitude. The calculation of the time offset between the two signals is then done in two steps. First, the time offset is estimated based on the cross-correlation of the reference and measurement signals. The measurement signal is then shifted in time according to this estimation. Secondly, the time offset between the reference signal and the shifted measurement signal is calculated from the difference between the instantaneous phases of the two signals. For both signals, the instantaneous phase is estimated and averaged over the middle of the most prominent wave package, which is found by choosing the signal parts where the amplitude is >90 % of the maximum value.
The two steps to calculate the time offset are necessary since the accuracy of the cross-correlation method is limited by the sampling rate of the ultrasound signals, which is 65 MHz. Upsampling of the ultrasound signals would be possible to increase the accuracy, but this would be more computationally intensive compared to the phase estimation method, which is not limited by the sampling rate. Nevertheless, the correlation method is required to ensure phase differences smaller than 2π between the signals before calculating the phase difference. Time shifting the measurement signal based on the cross-correlation before applying the phase estimation also minimizes the influence of the pulse form on the differences between the instantaneous phases. Again, all the calculations are done separately for the upstream and downstream signals. From the time-of-flight values and the measured temperature, the flow velocity and the DMPA concentration are then calculated as described in Sect. 2.1 and 2.2.
3.1 Volume flow calibration
The mean flow velocity vm given by Eq. (7) from the time-of-flight method represents the flow velocity along the acoustic path between the transducers. In order to obtain the volumetric flow rate from these measurements, the velocity profile of the flow in the sensor module has to be considered. This is done by introducing a correction factor K to the volumetric flow rate calculation:
where A is the pipe's cross-sectional area and K is a correction factor that depends on the velocity profile of the flow. The correction factor K is usually calculated from the Reynolds number (Baker, 2016). During the validation, it was discovered that these values are not directly applicable for the measurement system. This is most likely because the 3D-printed sensor module is not completely airtight. Other reasons are the positioning of the transducers, which cause changes in the flow, and the very small diameter of the flow channel compared to the size of the transducers. These design choices were made because flexibility in the integration in the core-making machine was prioritized over the accuracy of the flow measurement. For these reasons, the correction factor K was determined experimentally in a controlled lab environment using compressed air and a reference flow meter (PFM710S-C6-C-N, SMC Corporation, Tokyo, Japan). Temperatures measured in the sensor module were in the range of 25.3 to 26.5 °C for the calibration measurements. The correction factor was determined to be K=1.22 for the relevant flow range of 1 to 10 L min−1. Note that the correction factor can change if the temperature changes enough to cause significant changes in density and viscosity. In this case, further calibration measurements at different temperatures may be required. Since the temperature in the experiments did not deviate more than 3.8 K from the temperature during the calibration measurement, the correction factor was kept constant for all measurements. Figure 4 shows the results of the calibration.
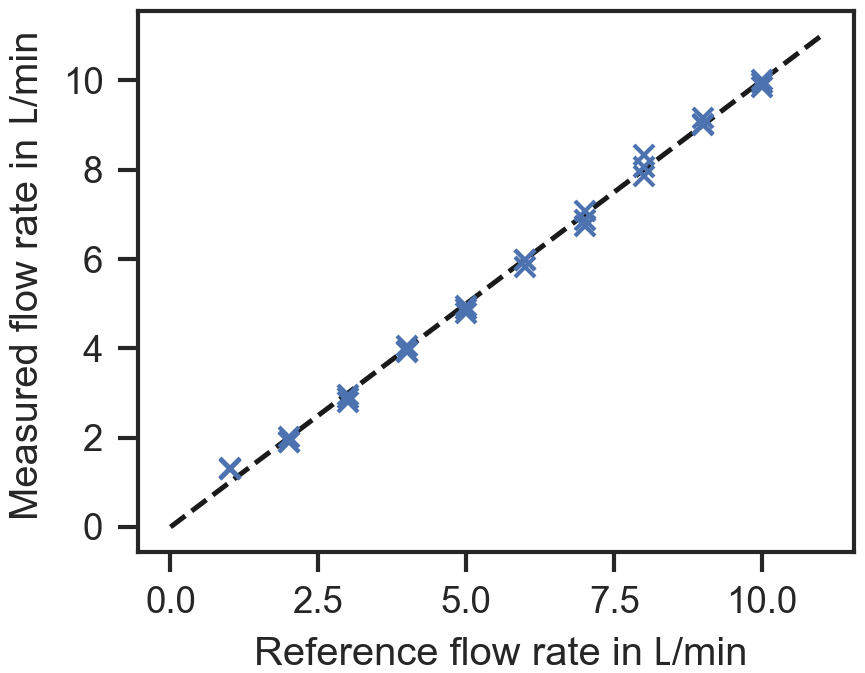
Figure 4Calibrated flow rate measurements. Each measurement was repeated three times. The correction factor K was obtained via least-squares approximation. The root mean square deviation from the reference flow rate is 0.18 L min−1 after calibration.
3.2 Measurement setup of the core-making machine
In order to validate the measurement system and to demonstrate its potential for application in the PUCB process, measurements were conducted with a lab-scale core-making machine (Universal Core Shooter, MULTISERW-Morek, Brzeźnica, Poland). For the experiments, the gas supply of the core-making machine was connected to a custom-made cylindrical core box with an inner diameter of 40 mm and a length of 45 mm. The gas inlet at the top of the core box was connected to the gas supply of the core-making machine, while the gas outlet at the bottom was connected to the 3D-printed sensor module.
Before the measurements, the core box was filled with a sand–binder mixture of H32 silica sand and a total of 1.6 % of binders (phenolic resin and polyisocyanate). The measurements were conducted starting with the lowest DMPA amount of 0.1 mL followed by 0.5 and 2 mL. Two measurements were conducted for each DMPA amount. The set points for the DMPA amount were specified using the digital process control unit of the core-making machine. Using the gas supply from the core-making machine ensured that relevant process dynamics and DMPA concentrations were provided for the experiments. Subsequently, the core box was filled with a new sand–binder mixture, and the measurements were repeated with a different volume flow rate. Values of 2, 6, and 10 L min−1 were chosen as the set points for the volume flow rate.
3.3 Evaluation of measurement uncertainty
The two measurands obtained by the measurement system are the volumetric flow rate and the DMPA concentration. Their measurement uncertainty is evaluated according to the Guide to the Expression of Uncertainty in Measurement (JCGM, 2008). Due to the very good repeatability that was observed for both the ultrasound and temperature measurements, statistical (type-a) uncertainties are assumed to be very small compared to type-b measurement uncertainties. Therefore, only type-b uncertainties are considered here. Figure 5 shows the influences on the calculated DMPA concentration.
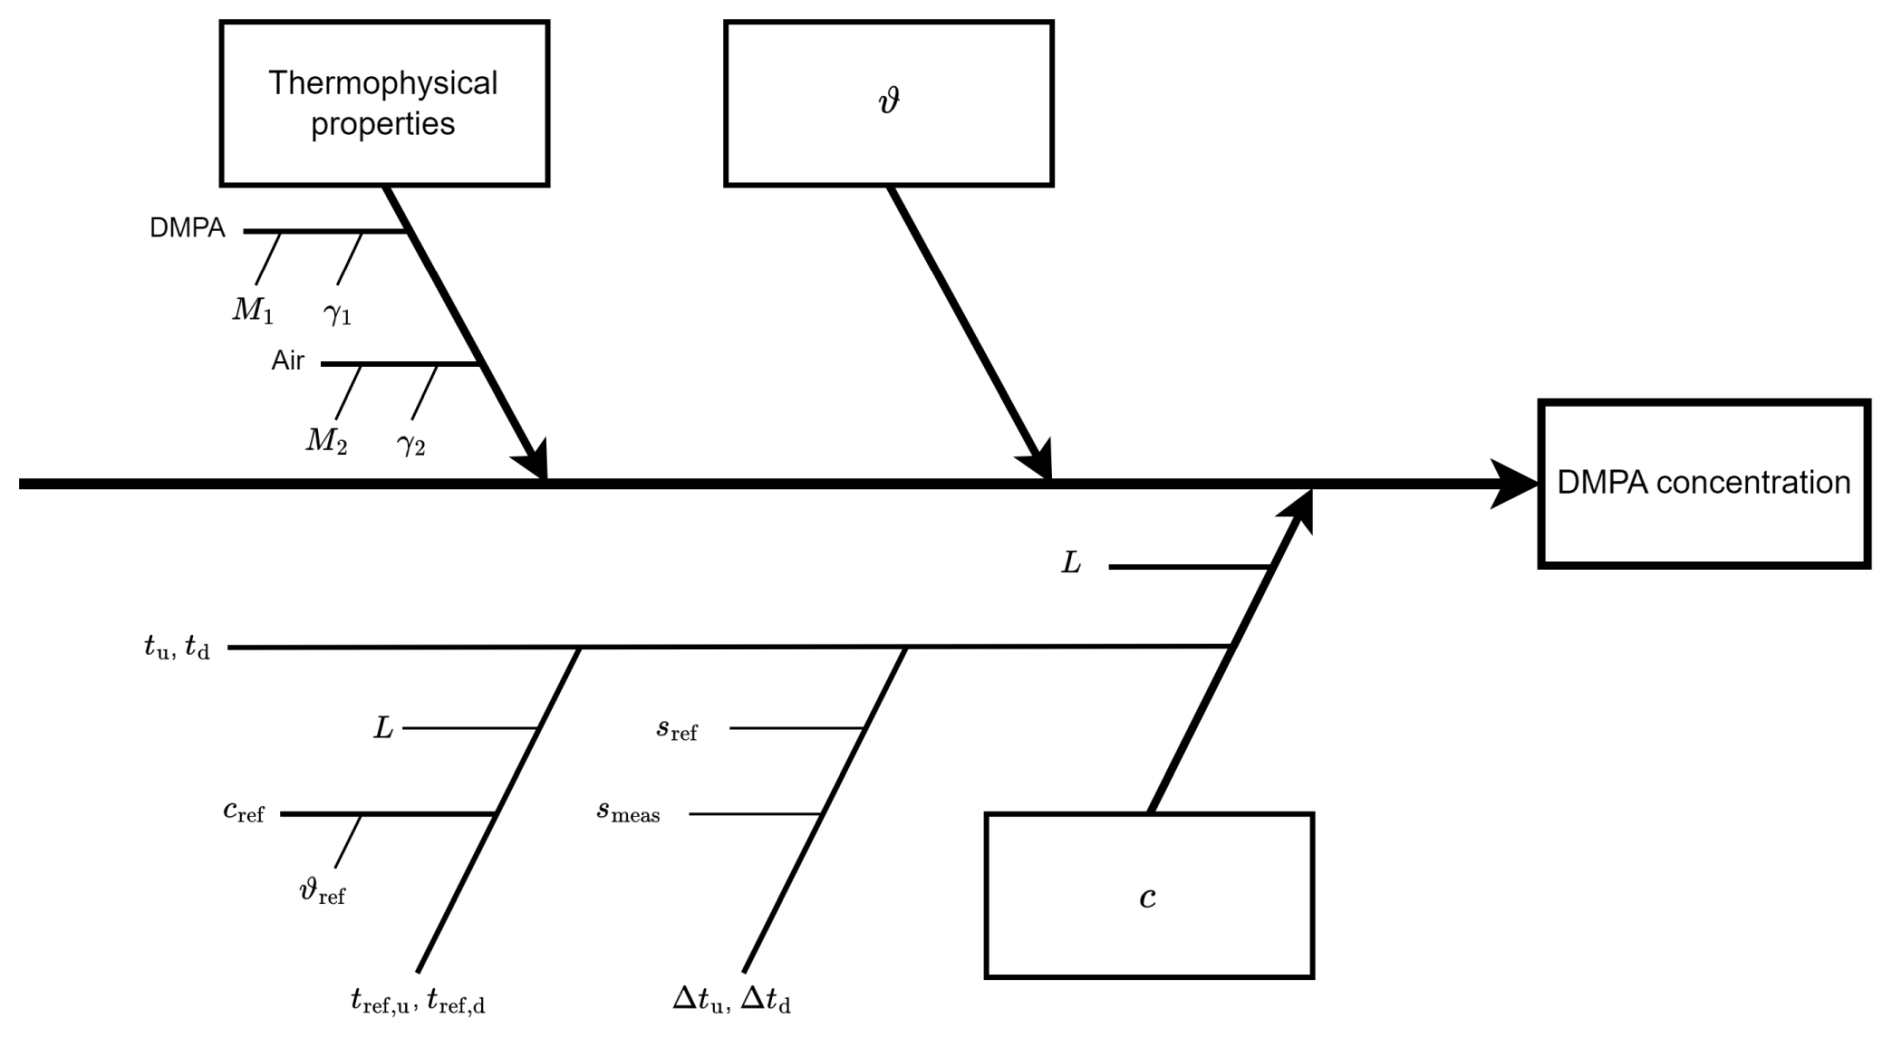
Figure 5Influences on the calculation of DMPA concentration, where M1 and M2 are the molar masses of DMPA and air, respectively; γ1 and γ2 are the corresponding heat capacity ratios; ϑ is the temperature; L is the distance between the transducers; tu and td are the upstream and downstream time of flight; cref is the reference speed of sound; ϑref is the reference temperature; tref,u and tref,d are the upstream and downstream reference time of flight; sref is the reference signal; smeas is the measurement signal; Δtu and Δtd are the time offsets between the signals for the upstream and downstream direction; and c is the speed of sound.
The uncertainties in these influences have to be evaluated in order to calculate the resulting measurement uncertainty in the DMPA concentration. The complete model equation can be derived by solving Eq. (14) for the DMPA concentration x1, which results in
where
with the following definitions:
where M1 is the molar mass and γ1 is the heat capacity ratio of DMPA, M2 and γ2 are the respective quantities for air, T is the absolute temperature in kelvin, R is the gas constant, and c is the speed of sound, which is calculated from the time-of-flight measurements using Eq. (4).
Some of the influences shown in Fig. 5 are assumed to be exact values because they have a negligible uncertainty. These values are the molar mass M2, the heat capacity ratio γ2 of air, and the molar mass M1 of DMPA. Uncertainties associated with the assumption of ideal gas behavior are negligible for the conditions during the measurements and are not considered in the calculations. In applications with rapid temperature changes in the gas flow, the dead volume in front of each transducer can introduce a temperature gradient along the ultrasound propagation path, potentially affecting the concentration measurements. However, since temperature variations during each measurement were small, this effect is not considered in the uncertainty evaluation. The uncertainties in the signal time offsets Δtu and Δtd depend on the signal processing described in Sect. 2.4. It was found that there is no significant noise or jitter in the averaged and filtered signals, sref and smeas. Using synthetic signals to investigate the uncertainty due to the signal processing algorithms, it was found that the most important factor is the pulse form of the wave packages that are used for the calculation of the instantaneous phases of the two signals. To mitigate this influence, the time offset between the two signals is calculated and averaged over several values around the center of the wave package. The standard deviation of the mean time offset was below 0.5 ns for all measurements presented in this study.
The heat capacity ratio γ1 of DMPA is required to calculate the DMPA concentration using Eq. (14). It is estimated based on the Joback group contribution method, which usually has deviations of less than 2 % for the ideal gas heat capacity (Poling et al., 2001, p. 3.47). Based on this information, a value of 0.02 is estimated for the standard uncertainty in γ1.
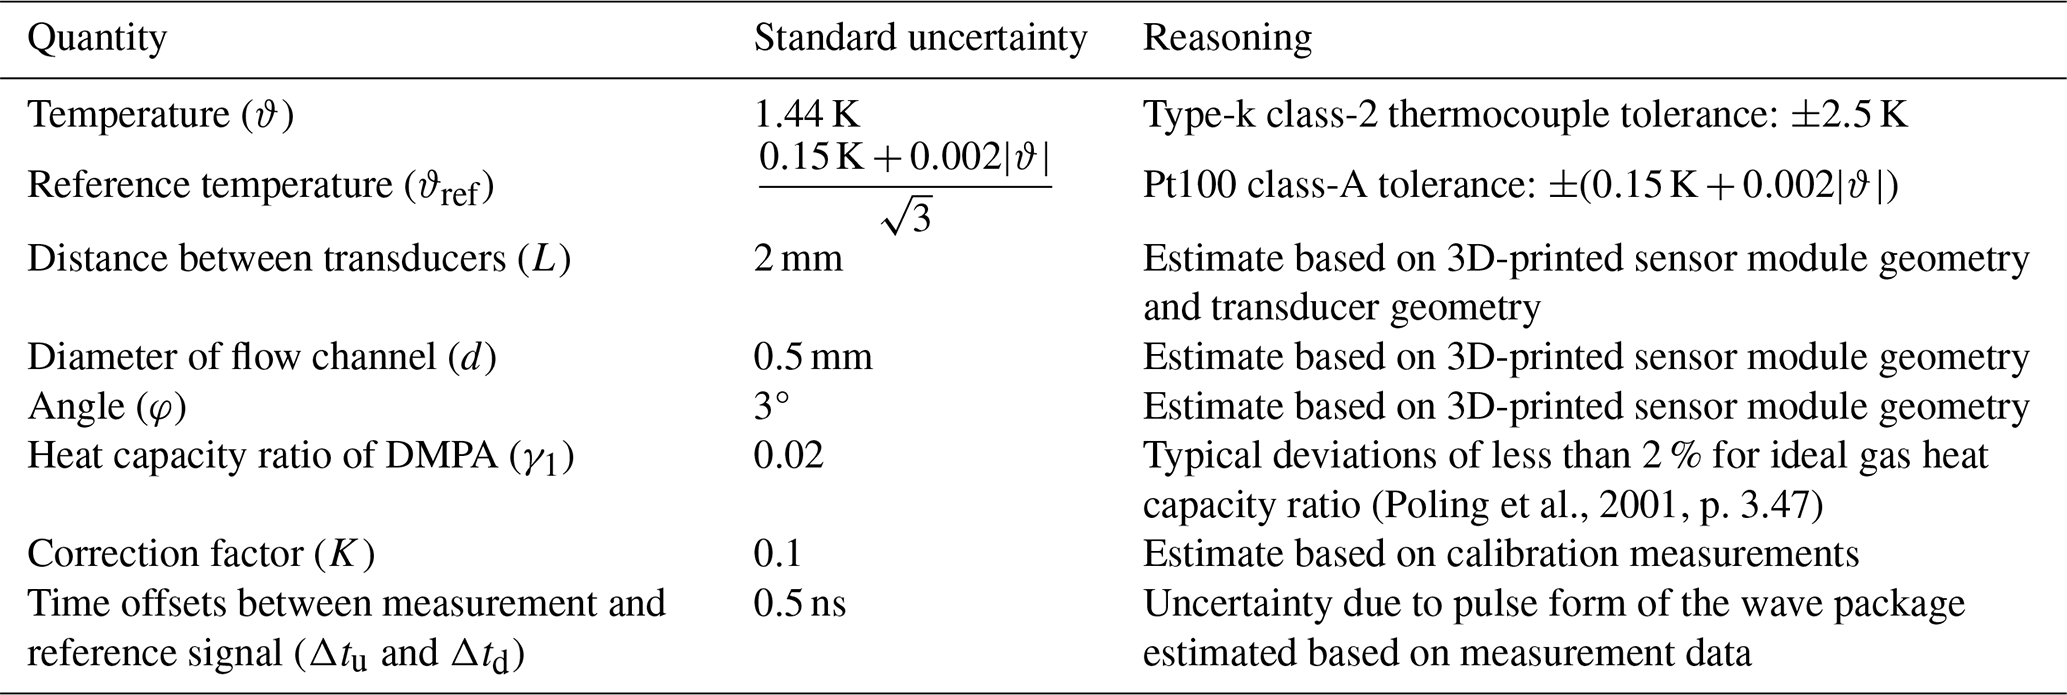
The uncertainties in the other influences shown in Fig. 5 are inferred from technical specifications or estimated. The volumetric flow rate Q is calculated according to Eqs. (7) and (16). Therefore, it depends on the speed of sound c and the times of flight tu and td, with their respective influences as shown in Fig. 5, and also on the diameter of the flow channel d, the angle of the ultrasound path φ, and the correction factor K. Table 2 lists all standard uncertainties that were considered for the measurement uncertainty in the DMPA concentration and the volumetric flow rate. With these standard uncertainties, the uncertainty propagation was performed with the Uncertainties Python package (Lebigot, 2019).
Table 2Estimated standard uncertainties influencing the calculation of the volumetric flow rate and the DMPA concentration.
4.1 Validation of flow rate and DMPA concentration measurements during core-curing stage
Experiments were conducted with the core-making machine to validate the measurement system for the PUCB process. The goal of the measurements is to obtain information on the state of the core-curing stage that is relevant for controlling and optimizing the process. The key for that is to detect changes in the DMPA concentration and volume flow rate. Rather than the absolute values, these changes characterize the state of the process, e.g., the beginning and the end of the purging step.
The experiments were conducted with different DMPA quantities (0.1, 0.5, 2.0 mL) and volume flow rates (2, 6, 10 L min−1). Temperatures measured in the sensor module were in the range of 22.7 to 23.7 °C for all measurements and did not change significantly during each experiment. Figure 6 shows the measured DMPA concentration and volume flow rate for a complete curing cycle with a set flow rate of 10 L min−1 and 2 mL DMPA added during the gassing step.
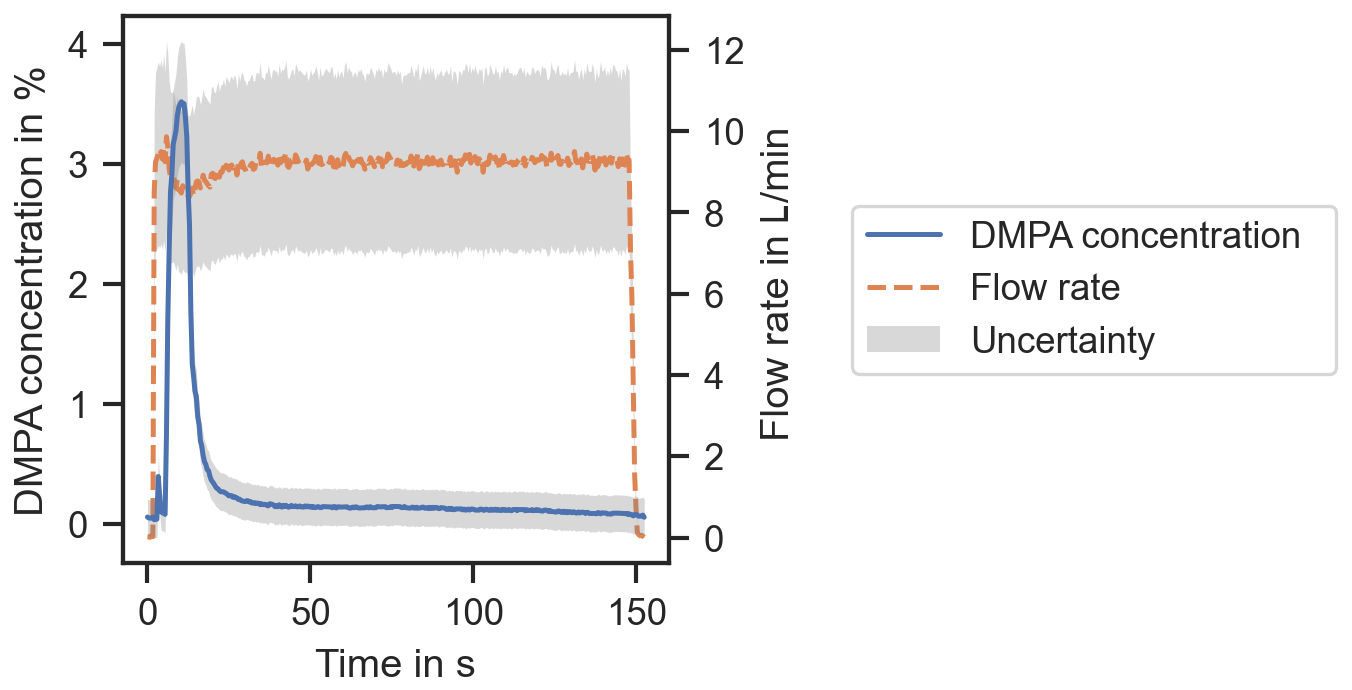
Figure 6DMPA concentration and flow rate over time for measurement series with 2.0 mL DMPA and 10 L min−1 flow rate with the respective standard uncertainty.
It can be seen that there is a clear peak in DMPA concentration. This peak marks the end of the curing stage, where DMPA is introduced in the sand core. There is also a smaller peak right at the beginning of the process, which is most likely due to DMPA residues in the system from previous cycles. After the DMPA concentration peaks at around 3.5 % ± 0.5 % (coverage factor k=1) at about 10 s, the effect of purging becomes visible as the DMPA concentration decreases.
Figure 7 shows the effect of different DMPA amounts and different volume flow rates on the measured DMPA concentration.
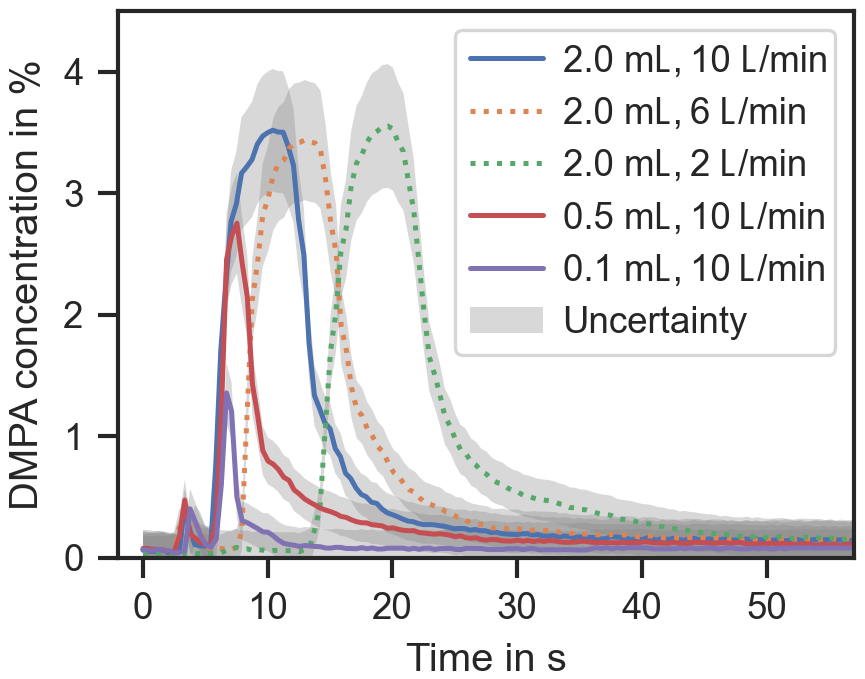
Figure 7DMPA concentration over time for different amounts of DMPA and flow rates with the respective standard uncertainty.
As expected, if less DMPA is introduced in the process, lower DMPA concentrations are measured. If the volume flow rate is reduced, it takes longer until the highest DMPA concentration is reached, and the changes in the DMPA concentration are also slower. A similar pattern was also observed for reduced volume flow rates with 0.5 mL DMPA and 0.1 mL DMPA added. Repeating the measurements produced similar curves for the DMPA concentration in each case.
The volume flow rates were also measured. They clearly indicate the beginning and the end of the curing stage as can be seen in Fig. 6. Within the measurement uncertainty, the measured flow rates are in good agreement with the set values. Given the simple setup of the time-of-flight measurement, without any flow conditioning and with a single, short ultrasound path through the flow, the measurement uncertainty is reasonably small. It has been demonstrated numerous times that highly accurate flow rate measurements are possible with the ultrasonic time-of-flight method. However, for the purpose of process control in core making, this is not required, which is why a simple and highly integrable system is favored here. The validation measurements show plausible results for the volumetric flow rate and the DMPA concentration. Based on these measurements, information on the core-curing stage can be obtained, which is demonstrated in the following section.
4.2 Demonstration of process monitoring: purging duration estimation
Measurements of the DMPA concentration and volume flow rate at the exhaust vent allow us to implement process monitoring for the core-curing stage. Most importantly, the purging duration can be estimated based on the measured volume flow and DMPA concentration. To demonstrate this, an arbitrary criterion for the end of the purging process is defined as the time when the centered moving average of the DMPA concentration over five consecutive values drops below 0.2 %. The purging duration is then defined as the time from the peak of the DMPA concentration up until the end of the purging process. Prior to purging, the start of the gassing process, where DMPA is introduced, can be identified by the rise in the volume flow rate. These simplistic criteria for the beginning and end of the process steps are used here only to demonstrate the application of the measurement system. Figure 8 shows the gassing and purging steps in relation to the measurement data for one measurement and the resulting purging durations for all measurements.
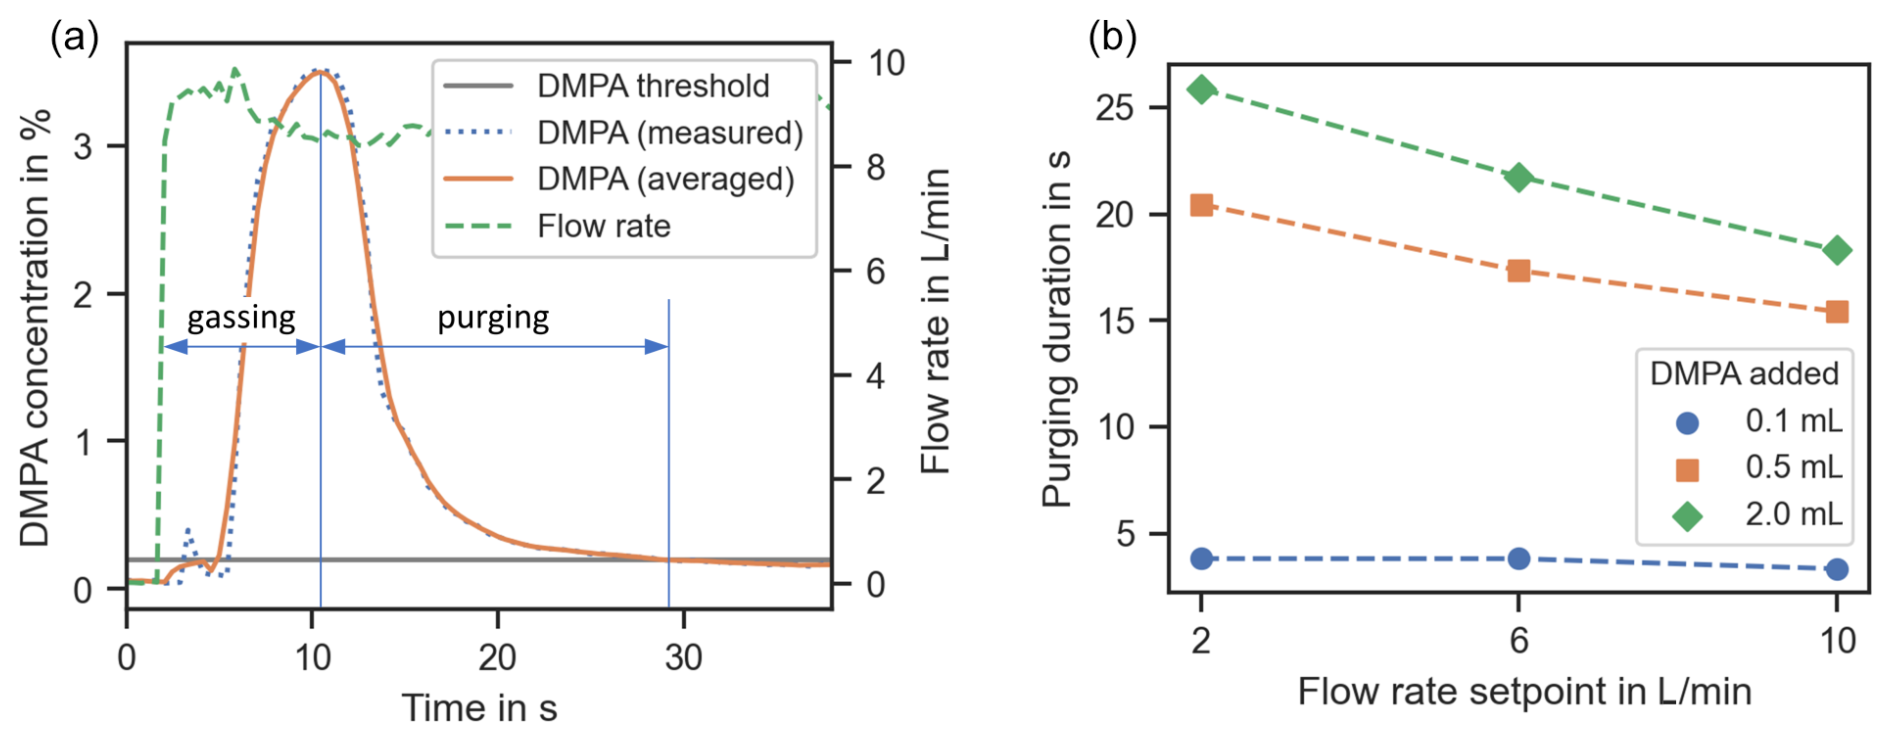
Figure 8Detection of beginning and end of the purging process based on measurement data (a) and purging durations for different flow rates and DMPA amounts (b). A DMPA concentration of 0.2 % is defined as the threshold value for the end of purging.
These results illustrate the potential of the measurement system to detect the beginning and end of the purging process in real time. Implementation in PUCB machines would allow us to stop the purging at the optimal time for each individual core. Furthermore, the measurement system can be used to gain a better understanding of the PUCB process itself.
It can be seen from Fig. 8, that the purging duration increases with the amount of the DMPA that is used. An increase in the flow rate leads to shorter purging durations. Both of these effects were expected qualitatively and are physically plausible. The application of the measurement system allows us to quantify these effects. For example, in this specific setup, increasing the flow rate from 2 to 10 L min−1 results in shorter purging durations of about 5 s, which corresponds to a decrease of about 20 %. It can be expected that this value varies to a high degree, depending greatly on the PUCB machine, the process parameters, and the size and geometry of the core. Due to the complex nature of the core-making process, a prediction of the optimal purging duration from theory alone seems unfeasible. This illustrates the potential of the measurement system for the optimization of the PUCB process.
A measurement system is presented to provide real-time monitoring of the phenolic urethane cold box (PUCB) process by measuring the concentration of the catalyst N,N-dimethyl-n-propylamine (DMPA), volumetric flow rate, and temperature in the exhaust airstream. Utilizing the ultrasonic time-of-flight principle alongside temperature measurements, the DMPA concentration is determined from the speed of sound in the exhaust gas mixture.
The measurement system was validated through experiments conducted on a lab-scale core-making machine with a simplified core box setup. The results indicate that higher amounts of DMPA introduced during the gassing phase leads to higher measured DMPA concentrations, while increased flow rates result in faster reductions in DMPA concentration during purging. These findings align with the expected behavior of the process, confirming the reliability and sensitivity of the measurement system.
An investigation into the measurement uncertainty was conducted, considering factors such as temperature measurement accuracy, uncertainties in the ultrasonic time-of-flight measurements, and calibration of the flow rate. The impact of these uncertainties in the calculated DMPA concentration and volumetric flow rate was assessed using the Guide to the Expression of Uncertainty in Measurement (GUM) framework. The results indicate that the measurement system provides sufficiently accurate and repeatable data for effective process monitoring and control.
The system enables the detection of the end of the purging process in real time, allowing for the estimation of optimal purging durations based on actual process dynamics rather than predefined time settings. This capability holds significant potential for process optimization as it can reduce production times and improve core quality by preventing unnecessary purging and ensuring complete removal of the catalyst.
Although the current setup was tested on a simple core geometry with a single exhaust vent, the principles and methodologies developed can be extended to more complex core geometries and industrial-scale PUCB machines. Integrating this measurement system into existing machinery could facilitate advanced automation strategies. Future work may involve using the measurement system to validate computational models of the sand core to further enhance process understanding. Additionally, exploring the application of this measurement system to monitor other catalysts or processes within the foundry industry could broaden its utility.
In conclusion, the ultrasonic measurement system provides a robust and effective solution for real-time monitoring of the PUCB process. Its implementation can lead to enhanced efficiency and product quality in foundry operations, addressing a critical need for reliable process monitoring in the industry.
The code and data that support the findings of this study are available from the corresponding author, Christian Kupsch, upon reasonable request.
Conceptualization, resources, and funding acquisition: CK and MS; methodology and validation: JS and CK; software, analysis, and visualization: JS; investigation: MTA and MSK; data curation and writing (original draft preparation): JS and MTA; writing (review and editing): all authors; supervision and project administration: JS, CK, and MS. All authors have read and agreed to the published version of the paper.
The contact author has declared that none of the authors has any competing interests.
Publisher's note: Copernicus Publications remains neutral with regard to jurisdictional claims made in the text, published maps, institutional affiliations, or any other geographical representation in this paper. While Copernicus Publications makes every effort to include appropriate place names, the final responsibility lies with the authors.
This research has been supported by the Dr. Erich Krüger Foundation (Modellbasiertes Sensorsystem für die kontinuierliche Prozessüberwachung beim Kernschießen project).
This paper was edited by Thomas Fröhlich and reviewed by two anonymous referees.
Baker, R. C.: Flow Measurement Handbook: Industrial Designs, Operating Principles, Performance, and Applications, 2nd edn., Cambridge University Press, 788 pp., ISBN 978-1-107-04586-6, 2016.
GESTIS Substance Database: https://gestis-database.dguv.de/data?name=073330, last access: 26 September 2024.
Haynes, W. M., Lide, D. R., and Bruno, T. J.: CRC Handbook of Chemistry and Physics, 97th edn., CRC Press, Boca Raton, London, New York, 2652 pp., ISBN 978-1-4987-5429-3, 2017.
Holtzer, M. and Kmita, A.: Mold and Core Sands in Metalcasting: Chemistry and Ecology: Sustainable Development, Springer International Publishing, Cham, https://doi.org/10.1007/978-3-030-53210-9, 2020.
JCGM: Evaluation of measurement data – Guide to the expression of uncertainty in measurement, https://doi.org/10.59161/JCGM100-2008E, 2008.
Joback, K. G. and Reid, R. C.: Estimation of Pure-Component Properties from Group-Contributions, Chem. Eng. Commun., 57, 233–243, https://doi.org/10.1080/00986448708960487, 1987.
Joos, M., Müller, H., and Lindner, G.: An ultrasonic sensor for the analysis of binary gas mixtures, Sensor. Actuat. B-Chem., 16, 413–419, https://doi.org/10.1016/0925-4005(93)85220-5, 1993.
Khan, M. S. and Szucki, M.: Numerical and Experimental Analysis of Amine Flow in Foundry Sand Cores, in: Proceedings of the 10th World Congress on Mechanical, Chemical, and Material Engineering (MCM'24), The 10th World Congress on Mechanical, Chemical, and Material Engineering, 22–24 August 2024, Barcelona, Spain, https://doi.org/10.11159/htff24.253, 2024.
Khan, M. S., Mrowka, N. M., Sablowski, J., Asghar, M. T., Kupsch, C., and Szucki, M.: Investigations of the Cold Box Core Curing Stage Using an Augmented Simulation Approach, Int. J. Metalcast., https://doi.org/10.1007/s40962-024-01445-y, 2024.
Lebigot, E. O.: Uncertainties: a Python package for calculations with uncertainties, http://pythonhosted.org/uncertainties/ (last access: 10 September 2024), 2019.
Löfqvist, T., Delsing, J., and Sokas, K.: Speed of sound measurements in gas-mixtures at varying composition using an ultrasonic gas flow meter with silicon based transducers, in: Proceedings of the 11th IMEKO TC9 Conference on Flow Measurement, 11th IMEKO TC9 Conference on Flow Measurement, 12–14 May 2003, Groningen, the Netherlands, https://urn.kb.se/resolve?urn=urn:nbn:se:ltu:diva-30347 (last access: 10 September 2024), 2003.
Moldover, M. R., Gavioso, R. M., Mehl, J. B., Pitre, L., de Podesta, M., and Zhang, J. T.: Acoustic gas thermometry, Metrologia, 51, R1, https://doi.org/10.1088/0026-1394/51/1/R1, 2014.
Monsalve, J. M., Völz, U., Jongmanns, M., Betz, B., Langa, S., Ruffert, C., Amelung, J., and Wiersig, M.: Rapid characterisation of mixtures of hydrogen and natural gas by means of ultrasonic time-delay estimation, J. Sens. Sens. Syst., 13, 179–185, https://doi.org/10.5194/jsss-13-179-2024, 2024.
Poling, B. E., Prausnitz, J. M., and O'Connell, J. P.: The properties of gases and liquids, 5th edn., McGraw-Hill, New York, NY, 752 pp., ISBN 978-0-07-149999-6, 2001.
Sturm, J. and Wagner, I.: Practical use of core simulation for process optimization, Casting Plant and Technology International, 1, 16–23, 2014.