
the Creative Commons Attribution 4.0 License.
the Creative Commons Attribution 4.0 License.
 | 06 Aug 2026
High-resolution characterization of the size-of-source effect via a continuously variable aperture
Miguel-David Mendez-Bohorquez
Robert Schmoll
Andreas Kroll
The size-of-source effect (SSE) is a major source of uncertainty in radiation thermometers and thermal imaging cameras. This effect is considered a systematic error and is typically evaluated by measuring changes in the detected signal as the size of the radiant source is varied using a set of circular apertures of different diameters. The accurate characterization of the SSE requires measurements over a wide range of object sizes with well-distributed sample points, which is both time-consuming and labor-intensive. This paper proposes a new approach in which the aperture of an iris diaphragm is continuously adjusted to vary the size of the radiant source. An experimental study was conducted to compare the results obtained with individual fixed apertures and to assess whether the camera frame rate and the iris-driving period influence the measured temperature. The proposed approach reproduced the SSE with the same accuracy as measurements made with individual apertures while providing a significantly larger number of measurement points and a notable reduction in the measurement time. Furthermore, the method showed no significant sensitivity to the driving speed of the iris or the camera's frame rate within the investigated range. However, temporal effects arising from the optical components were found to disturb the measurement.
- Article
(5162 KB) - Full-text XML
- BibTeX
- EndNote


Accurate temperature measurement with radiation thermometers and thermal imaging cameras is often compromised by the size-of-source effect (SSE) (Saunders and Edgar, 2009; Pušnik and Geršak, 2021), where the detector signal depends on the apparent size of the target (Bloembergen, 2009a). This effect can arise from multiple factors, including limitations in the performance of the optics or the electronics (Budzier and Gerlach, 2021), scattering both inside and outside the lens (Ohtsuka and Bedford, 1989; Yoon et al., 2005), other optical aberrations (Riou et al., 2006), and reflections from internal sensor components (Envall et al., 2009). The SSE is widely recognized as a systematic error and has been the subject of extensive research for multiple purposes. These efforts include quantifying its contribution to the uncertainty budget in temperature measurements using radiation thermometers (Bloembergen, 2009a; de Lucas, 2022) and thermal imaging cameras (König et al., 2020; McMillan et al., 2018, 2022; McMillan, 2023), formulating mathematical models to describe the phenomenon (Solorio-Leyva et al., 2004; Bloembergen, 2009b; Saunders and Edgar, 2009; Schramm et al., 2022), and developing strategies to compensate for its effects (Saunders, 2011; Schramm et al., 2019). Three measurement methods are commonly recognized as the principal procedures for evaluating the SSE. The first, known as the direct method (Graham and Mohamed, 1999; Hill and Woods, 2004; Pušnik et al., 2006; Yoo et al., 2009; König et al., 2020), involves varying the size of the radiant source by placing circular apertures of different diameters in front of a uniform heat source and recording the resulting changes in the detector signal for each aperture size. The second, referred to as the central obscuration or indirect method (Graham and Gennady, 2001; Hanssen et al., 2004; Bart et al., 2007; Saunders, 2011; AlDawood et al., 2023), quantifies the stray or scattered radiant flux that reaches the detector from regions outside its nominal field of view. This is achieved by inserting a central disk that blocks the direct radiation from the source while allowing only the off-axis stray radiation to be measured. The resulting value is then subtracted from the signal variation obtained when changing the source diameter, providing a corrected evaluation of the SSE. The third method determines the SSE by mathematically analyzing the detector's measured point-spread function (PSF) and the total radiant flux reaching the detector for different source diameters under a known background temperature (Jhonson et al., 1998; Mekhontsev, 2003; Envall et al., 2009). Each method offers distinct advantages and limitations, and each method's suitability depends on both the device under test and the objective of the measurement. The direct method is fast and readily automatable, but it also captures scattering effects originating both inside and outside the nominal field of view of the optics. The central obscuration (indirect) method mitigates this limitation; however, it is labor-intensive and can introduce source errors arising from sensor reflections or from the misalignment of the experimental setup. In addition, it is more susceptible to noise because the measurement relies on a residual signal that may have a critically low amplitude when the radiant source and the aperture are at similar temperatures. The choice of measurement method therefore depends on factors such as the sensitivity of the detector to signal changes, the complexity of the experimental setup, and the level of detail required to characterize the SSE. The appropriate sampling of the SSE curves is crucial, as it allows the identification of specific object size ranges in which the effects responsible for the SSE occur, as demonstrated by Ohtsuka and Bedford (1989). Regarding compensation strategies, approaches based on optical optimization, such as those by Yoon et al. (2005), have largely been exhausted – especially for imaging devices – leading to the emergence of numerical methods (Schramm et al., 2019, 2022). For these approaches, the SSE must be measured over a wide and representative range of object sizes with a sufficiently large number of data points. However, the effort and time required for SSE measurements increase proportionally with the number of source diameters tested, which often becomes a limiting factor. This paper presents a rapid variant of the direct method, in which a thermal imaging camera records the signal changes as the size of the radiant source is continuously varied using an iris diaphragm. This approach makes SSE analysis much more flexible, as it enables the selection of defined size ranges after data acquisition and allows for broader point sampling. As a result, it provides an improved description of the SSE across different regions of the curve, while significantly reducing the required measurement time. The paper is structured as follows: Sect. 2 describes the experimental setup and the SSE assessment method. Section 3 presents an experimental comparison alongside a temporal analysis. Finally, Sect. 4 offers conclusions and an outlook on future research directions.
The SSE was measured using the direct method through two different approaches, the results of which are compared and analyzed. For the first approach (hereafter referred to as the discrete approach), a set of circular apertures of individual sizes is used, while for the second approach (hereafter referred to as the continuous method), a circular aperture with an iris diaphragm is used to vary the size of the radiating surface. In this section, the experimental setup and the evaluation methods are described.
2.1 Experimental setup
The measurement setup is shown in Fig. 1. An Infrared Systems IR-150/301 heat plate radiator (label A in Fig. 1) was used for the SSE measurements. The unit features a 304.8 mm×304.8 mm flat black square emitting surface, with an emissivity of over the wavelength of range 1 to 99 µm. It operates from ambient temperature up to 500 °C and exhibits a short-term temporal stability of ±0.1 °C and a long-term stability of ±0.2 °C, according to the manufacturer. Temperature regulation is achieved via a PID controller (label B in Fig. 1). Further details are provided in the data sheet of Infrared Systems (2025). Individual circular apertures (label C in Fig. 1) were used to vary the area of the observed radiant surface. For the discrete method, circular patterns were cut into stainless steel sheets of 2 mm thickness. Stainless steel was chosen for its high thermal conductivity, which ensures a uniform temperature distribution on the camera-facing side. To minimize the reflection of ambient radiation, this side was coated with certified paint providing ϵ>0.9 in both the long-wavelength infrared (LWIR) and mid-wavelength infrared (MWIR) ranges. Further details are provided by (). The radiator-facing side was left unpainted to reflect incident infrared radiation from the plate, thus slowing the heating of the aperture side observed by the camera. The holes were laser-cut to produce smooth burr-free circles and avoid the irregular conical patterns that conventional cutting tools can create for small-diameter apertures. An example aperture is shown in Fig. 2a. For the continuous method, an iris diaphragm (hereafter referred to as the iris), manufactured by Edmund Optics (2026) and featuring 18 blue tempered spring steel leaves with a pin lever actuator, was securely mounted within a 3D-printed bracket. The bracket design provides a balance between the smooth insertion of the iris and sufficient stiffness to prevent movement while adjusting the aperture size. The iris, the aperture, and the 3D-printed bracket are shown in Fig. 2b. The aperture diameters and measurement distances were selected based on the area of the radiant heat source captured in the image, as determined by the camera optics. To enable comparison across different optical configurations, a relative diameter, ϕrel, was defined to normalize the aperture sizes in the image. For a thermogram of an arbitrary aperture with diameter ϕ in mm, ϕrel in percent is calculated as follows:
where ϕpx is the circle diameter in px, and Vres is the image size in the vertical direction in px. The diameter of the circle in the image ϕpx was obtained using the function HoughCircles of the library OpenCV (Bradski, 2000), version 4.11 (OpenCV team, 2025). Normalization via Vres is adopted because, due to the sensor's landscape format and aspect ratio, it constitutes the primary constraint on spatial resolution. This approach facilitates not only the assessment of the SSE for different optical systems but also its compensation. Compensation methods, such as the one presented by Schramm et al. (2019), address subsequent applications in practical end-user scenarios for regions of the thermograms whose dimensions are entirely contained within the image. However, it is important to note that saturation of the SSE is independent of Vres and does not necessarily occur at ϕrel=100 % (ϕpx=Vres). The SSE measurements were performed using an MWIR thermal imaging camera (see Table 1), which was mounted on a sliding carriage (label D in Fig. 1). The carriage moves along two parallel rails fixed to an optical bench, allowing the distance between the camera and the apertures to be adjusted for measurements under different optical configurations. A multi-axis platform (label E in Fig. 1) was mounted on top of the carriage in a vertical configuration to hold the camera. The platform can be precisely adjusted along both horizontal and vertical axes with a resolution of 1 µm, facilitating the accurate and repeatable centering of the aperture in the image. The ambient temperature and air humidity were measured during the measurements to monitor possible drift that could affect the results. Different camera configurations were not considered, as no dependency of the measurement method on the camera technology was expected. Therefore, the results presented in this paper should be generally applicable for evaluating the measurement of the SSE in infrared thermal imaging devices, when an iris diaphragm is used to vary the size of the radiant source.
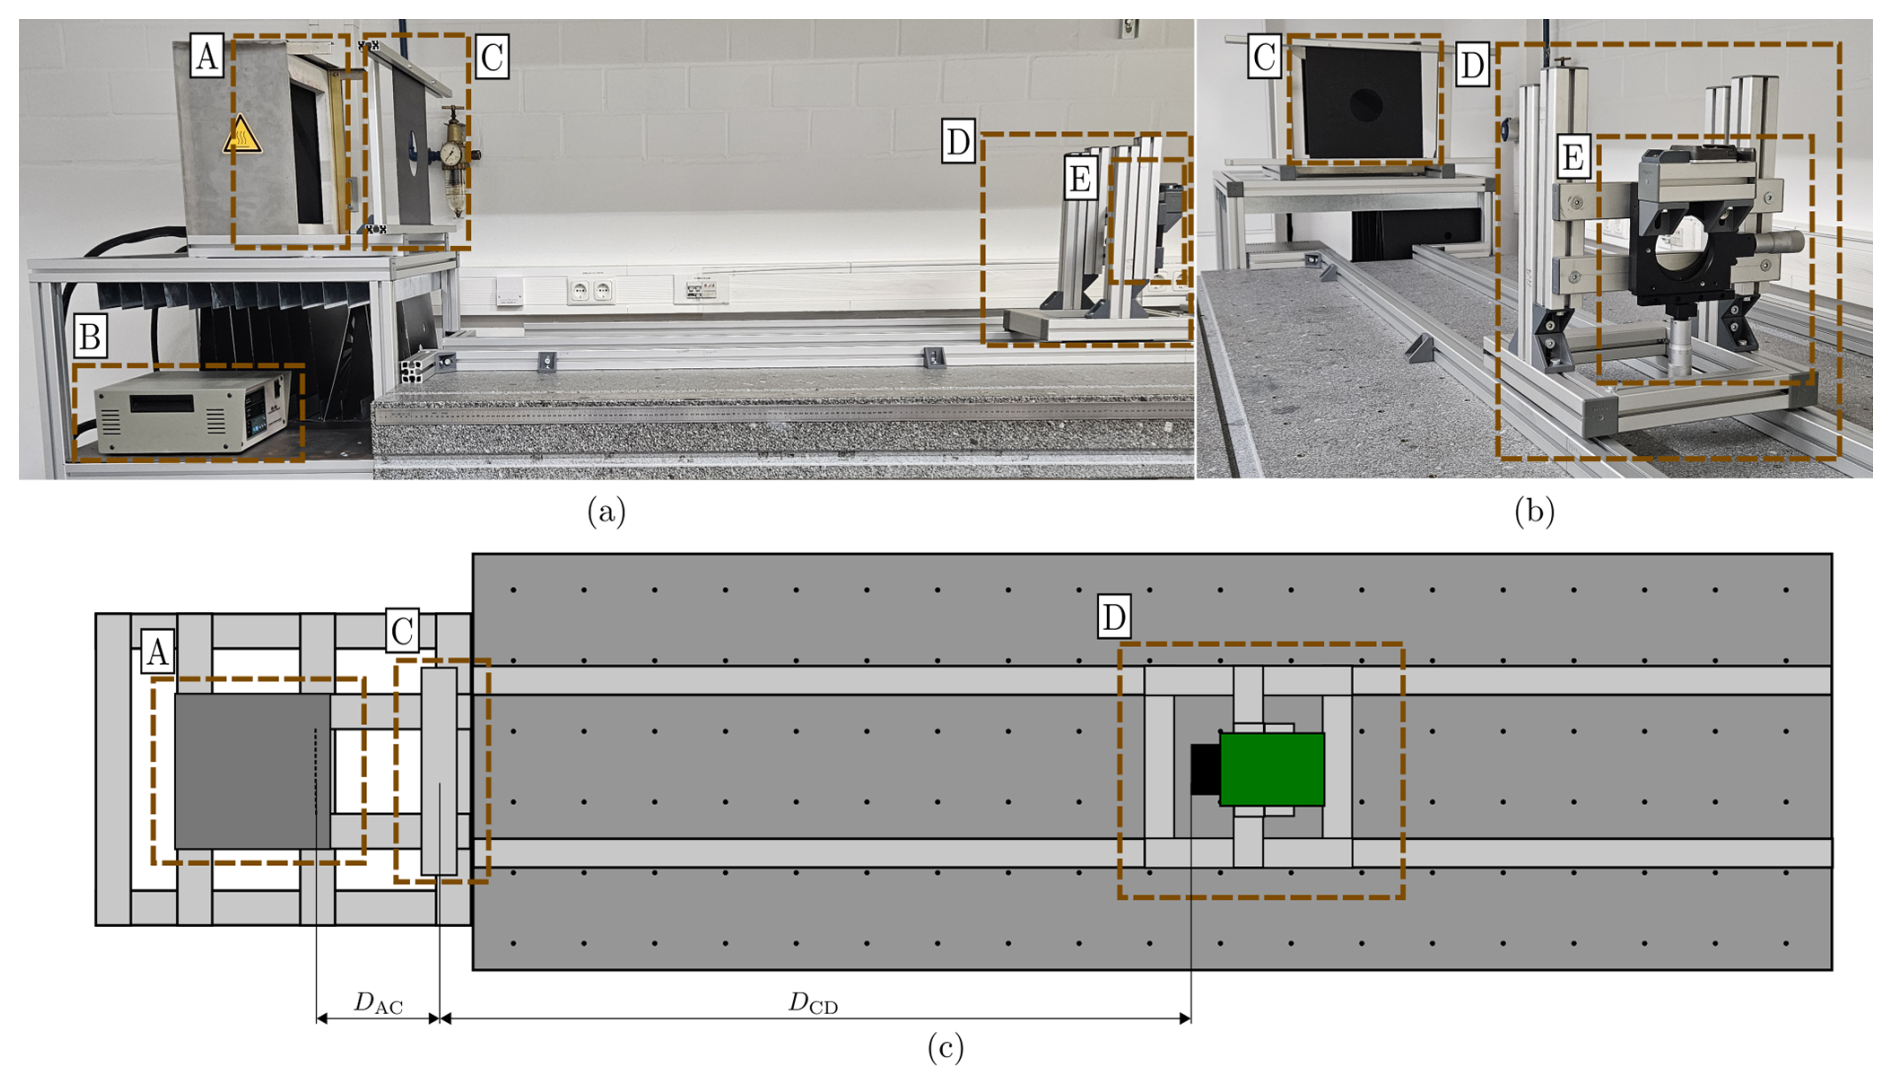
Figure 1Measurement stand: the heat plate radiator (label A) is positioned next to the optical bench. Its radiance temperature is set and regulated by a controller (label B). The size of the radiant source is varied using circular apertures (label C). The camera is mounted on a sliding carriage (label D), which allows the adjustment of the distance between the infrared camera and the aperture (DCD). The aperture is aligned with the image center by adjusting the vertical and horizontal positions of the multi-axis platform (label E).
2.2 Size-of-source effect measurement and assessment
The SSE measurement was performed by first setting a radiance temperature Tset on the controller and waiting for the surface temperature of the heat plate radiator to reach steady state. The thermal imaging camera was then focused on the edge of the circular apertures, and non-uniformity correction (NUC) was performed before measuring each optical configuration.
2.2.1 Discrete approach
Each aperture was placed in front of the heat plate radiator, after which a set of 50 thermograms (Nframes=50) was recorded using the thermal imaging camera. The next aperture was placed after a 2 min waiting period, since the thermal equilibrium of the heat plate surface is disturbed shortly after the metal sheet apertures are positioned. This disturbance depends on the distance between the heat plate radiator and the apertures (DAC; see Fig. 1), the exposed area of the aperture plate and the measurement sequence. When using an ascending order of aperture diameters, the first aperture reflects a large portion of the emitted radiation, causing its surface temperature to rise abruptly – an effect that the controller cannot compensate for quickly. A similar effect occurs as the diameter increases, although it becomes less pronounced compared with the first aperture. This results in a non-monotonic curve, which contrasts with the expected SSE behavior (Bloembergen, 2009b). This behavior can be mitigated through the adjustment of DAC, as demonstrated in a previous experimental study (Mendez-Bohorquez et al., 2025) that employed the same heat plate radiator, controller, aperture holder, and rigid frame used in the present work. In that study, the effect of this parameter was analyzed for four distances DAC between 80 and 300 mm. Since the measurements tended toward stability for DAC≥250 mm, this value (DAC=250 mm) was adopted for the experiments described herein. To evaluate the SSE, the 50 thermograms for each aperture were pixelwise-averaged to obtain an average thermogram M (see Fig. 2c) and reduce temporal noise. Then, a temperature deviation Δθ caused by the diameter change was calculated:
where j represents an arbitrary aperture, and θj is the mean temperature value obtained over a concentric circular region of interest, with a radius of 5 px. This spatial averaging was performed to reduce spatial noise in the measurements. In Eq. (2), θref corresponds to the reference temperature used to determine the temperature deviations associated with the SSE. It was defined as the value of θj at the largest aperture.
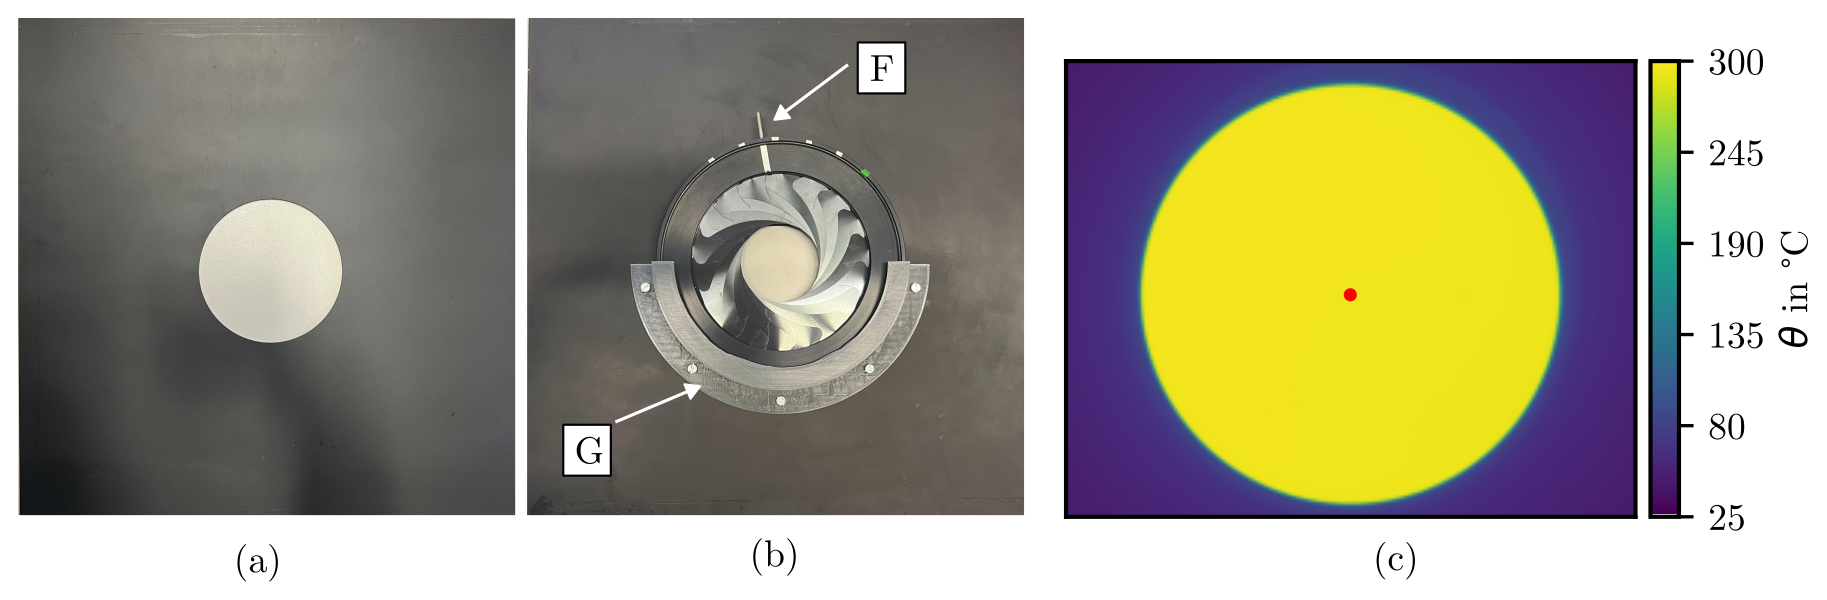
Figure 2Apertures used to measure the SSE: (a) an exemplary aperture for the discrete approach. (b) A bracket to hold the iris diaphragm. (c) An example of an average thermogram M. The region of interest considered for the evaluation of the SSE is represented by the red circle.
2.2.2 Continuous approach
For the continuous method, temperature changes throughout a complete iris closing–opening cycle were recorded as a sequence of thermograms. The iris was operated manually, and efforts were made to maintain a constant opening speed across the entire range of motion. It was assumed that this did not introduce significant deviations since the camera's response is faster than the rate of change in the aperture diameter. Furthermore, the movement of the iris blades is not expected to disrupt the thermal equilibrium of the radiator. While rapid iris adjustment could potentially alter the local thermal boundary layer, the volume of air displaced is insufficient to affect the surface temperature of the radiator, especially given its high thermal inertia. Unlike the discrete method, this approach requires more extensive post-processing to evaluate the SSE, as the image diameter varies continuously and a representative sample cannot be obtained simply by averaging a fixed number of frames. The evolution of the image diameter depends on both the camera's frame rate and the speed at which the iris lever is operated. Nevertheless, this method offers the flexibility to select the size ranges and level of detail for SSE analysis after the measurements have been performed.
To evaluate the SSE, a set of relative diameters Φsample was defined for sampling:
where nd corresponds to the number of sampled points and Dr is the largest relative diameter. In this study, Φsample covered , using 2 % as the step size between points and 5 % for ϕrel>50 %. These values were chosen because, in the first range, the SSE curves do not exhibit a proportional progression, whereas beyond this point, they typically grow in proportion to the diameter of the aperture (Graham and Gennady, 2001). This flexible definition is not constrained by technical limits and can be tailored to focus on specific regions of the object-size range. Each frame in the thermogram sequence is analyzed to identify those in which the difference between the instantaneous relative diameter ϕrel and any reference value in Φsample is below ±0.5 %. After processing the full sequence, an average thermogram is computed for every sampled diameter in Φsample. These averaged thermograms are then used to evaluate the SSE, as described in Sect. 2.2.1. An example of a continuous-method measurement is shown in Fig. 3. In this case, the SSE was measured using a telescopic lens (see Table 2) while the camera operated at frame rate f=200 Hz, and the iris was manually closed and reopened over a period 𝒯iris of 18 s (𝒯iris=18 s). Figure 3a shows that the temperature in the region of interest (ROI) θ decreases as the relative diameter ϕrel is reduced and increases again as the iris reopens. Figure 3b presents the relationship between ϕrel and θ for all frames. This is an initial representation of the SSE, which can be fitted to a functional form, such as those described by Bloembergen (2009b). An example of the sampling process is shown in Fig. 3c. The number of sampled frames Nframes differs for each sampled diameter and, in most cases, is less than 50. This value depends on the frame rate f and 𝒯iris (open–close–open time), whose influence on the SSE evaluation is discussed in Sect. 3.2.
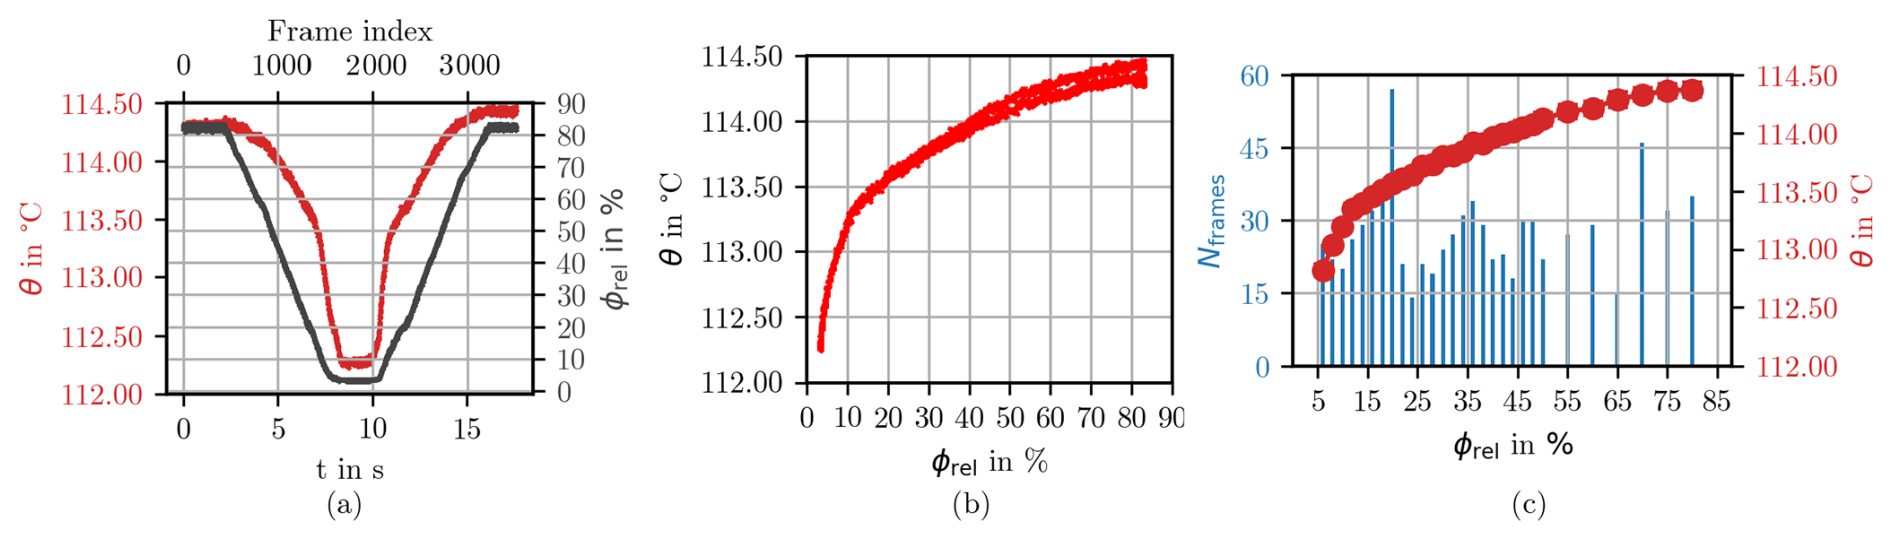
Figure 3Post-processing steps of an SSE measurement using the continuous approach: the optical configuration corresponds to the telescopic lens (see Table 2) at Tset=120 °C, with the camera operating at a frame rate of f=200 Hz. (a) Temporal evolution of the measured temperature θ (red, left axis) and the identified relative diameters ϕrel (black, right axis) for each frame in the sequence. (b) Relationship between θ and ϕrel for all thermograms. (c) SSE measurement obtained with the continuous approach, sampled at the defined ϕrel values. The number of sampled frames Nframes is shown on the left axis. The temperature θ measured from the averaged frames is indicated by the filled circular markers on the right axis, and the error bars represent the standard deviation of θ calculated with the sampled frames.
An experimental study was conducted to assess the results of SSE measurements using the continuous approach by analyzing different key aspects. First, the degree of agreement between the results from the two approaches was examined to determine if the SSE is reproduced similarly in both cases. Second, the influence of the camera's frame rate and the opening and closing speed of the iris was evaluated to determine whether they affect the measured temperature. Finally, the limitations of the continuous approach when measuring the SSE in optical systems with temporal dependencies were investigated. The technical details of the MWIR camera are presented in Table 1. The considered distance for the measurements and the diameters of the apertures used in each case are listed in Table 2.
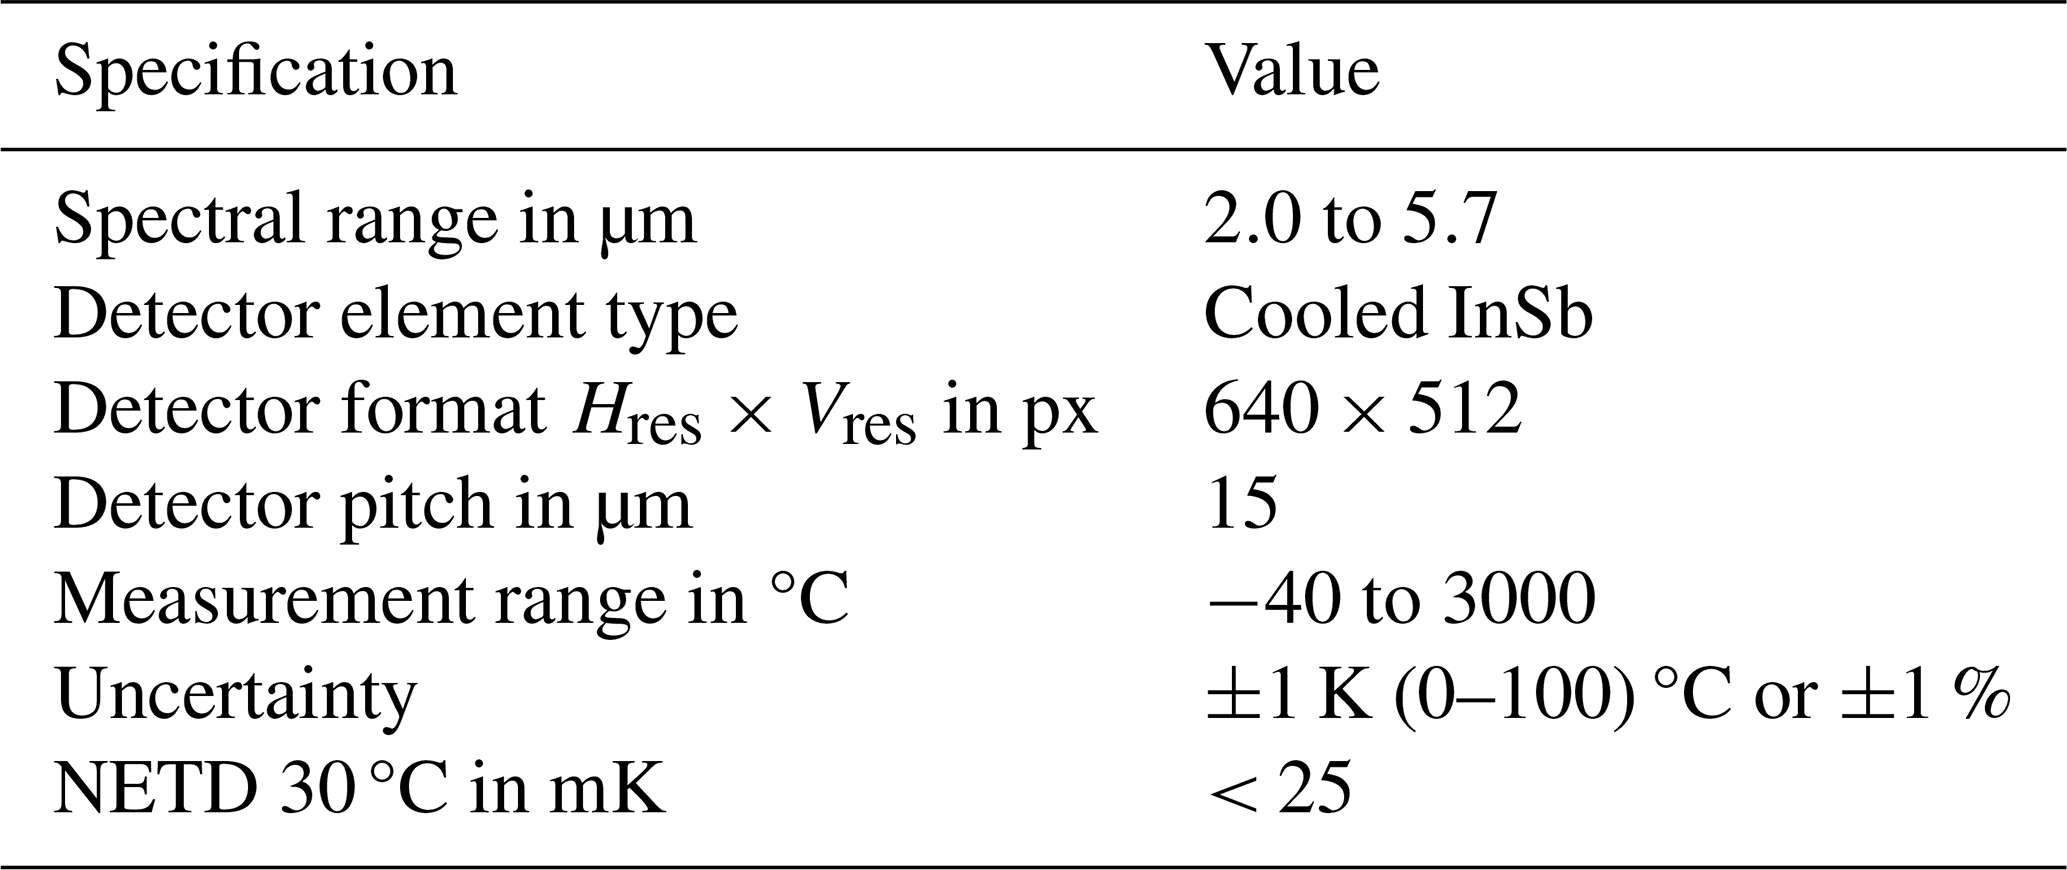
Table 2Distances and diameters considered for the measurement of the SSE.
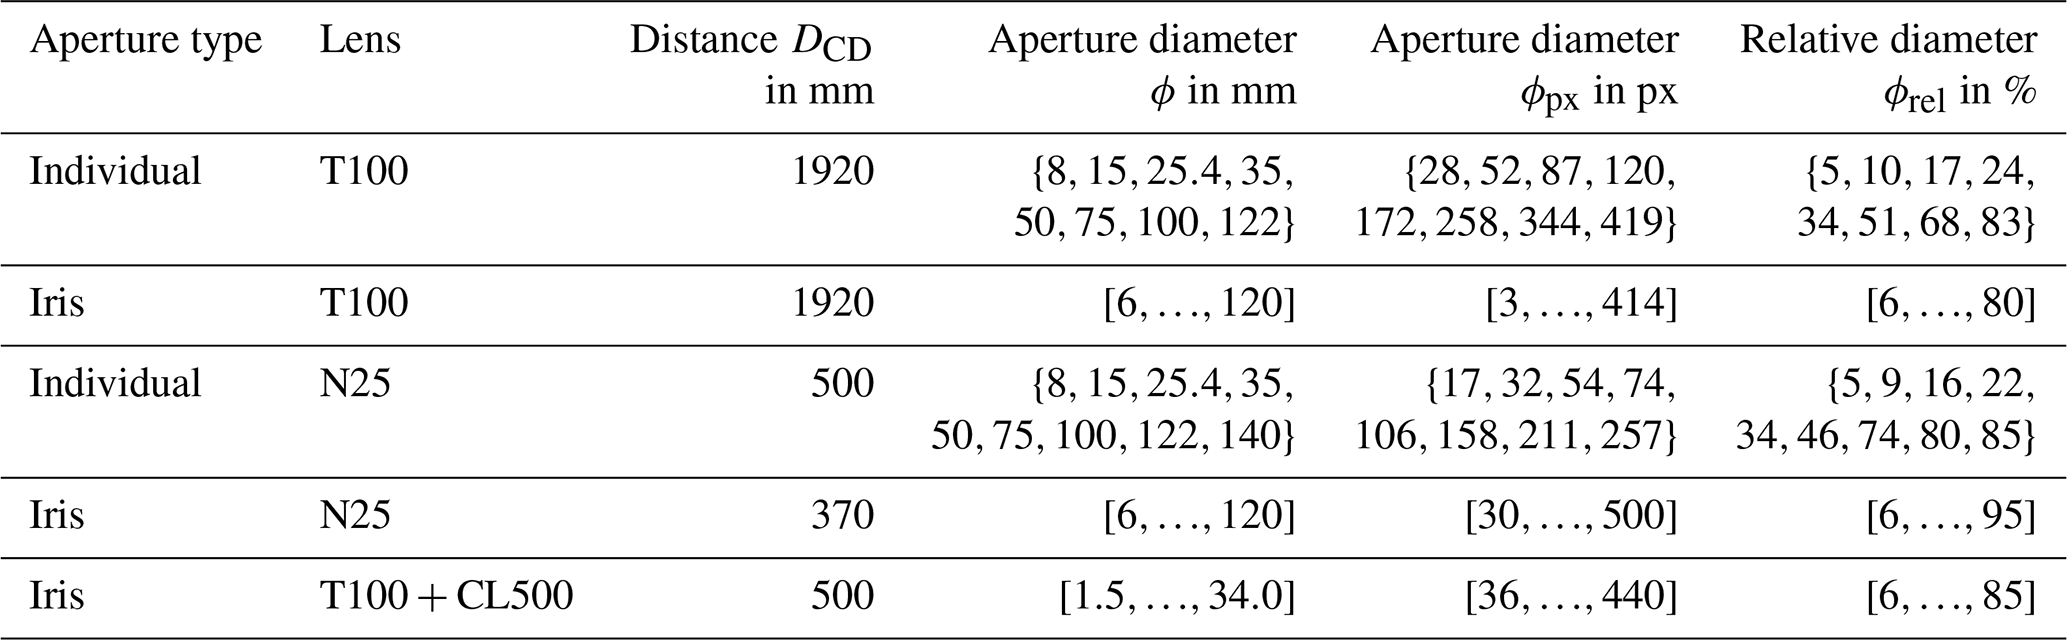
T100: telescopic lens 100 mm; N25: normal lens 25 mm; T100 + CL500: telescopic lens 100 mm with close-up lens.
3.1 Experimental validation
The SSE was measured using both approaches – continuous and discrete – employing a telescopic lens at Tset=120 °C and a normal lens at Tset=200 °C, respectively. The results are shown in Fig. 4. For the optical configurations considered, the curves obtained from both measurement approaches exhibit a similar monotonically increasing behavior. The measured deviation Δθ is nearly identical across the entire range of ϕrel, resulting in an almost complete overlap of the curves in each case. These observations indicate that both approaches reproduce the SSE to the same extent.
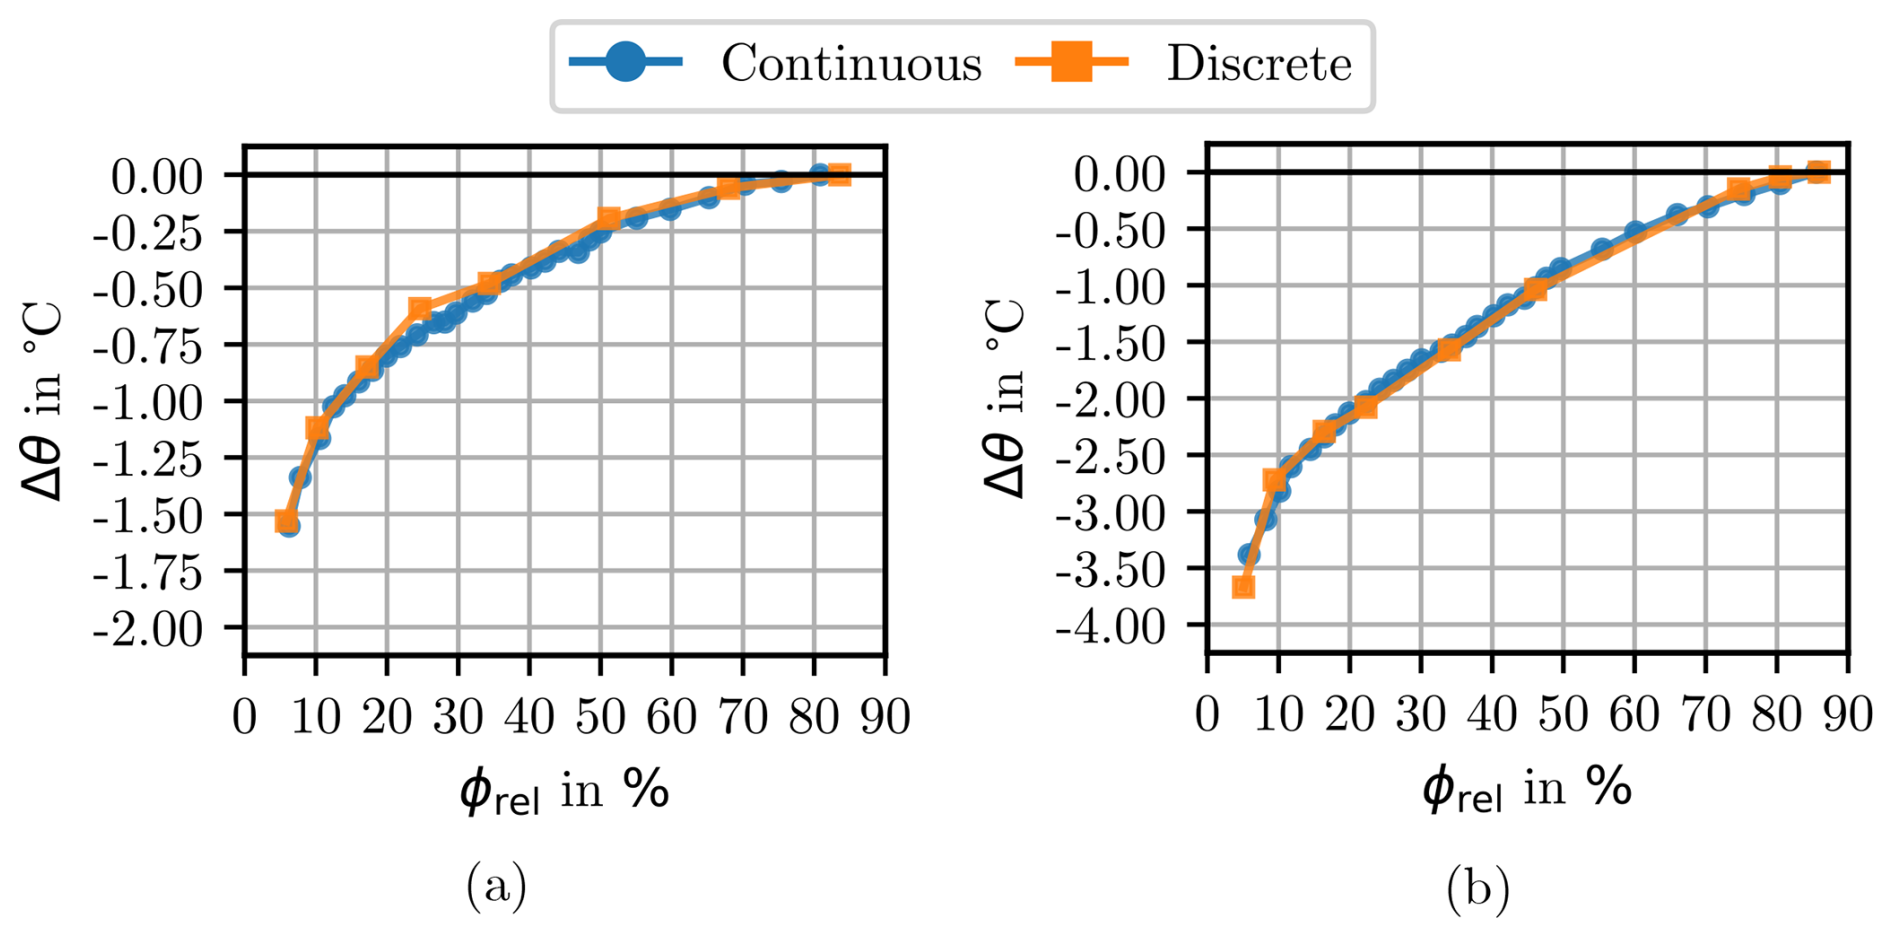
Figure 4SSE measured with the discrete and continuous approaches: (a) telescopic lens at Tset=120 °C and (b) normal lens at Tset=200 °C. The continuous black line corresponds to Δθ=0 °C.
The main differences between the two methods lie in the number of sampled points on the curve, the measurement time, and the disk space required to store the data retrieved by the camera software. A summary of these three aspects is presented in Table 3. The curve resolution is markedly higher when the SSE is measured using the continuous approach, which makes it possible to detect the irregularity in the discrete-method curve at ϕrel ≈ 25 % (see Fig. 4a). At this location, the discrete data point is displaced, possibly due to temperature drift of the heat plate radiator – an effect related to the radiator's long-term stability. The continuous approach is less affected by this, since the range of aperture diameters to be measured is covered significantly faster than in the discrete approach (see Table 3). The closely spaced sampling of the continuous method clearly reveals the true progression of Δθ in this region, which aligns with the trend obtained when the outlying point in the orange curve is disregarded and agrees with the proportional relationship in this region reported by other authors (Graham and Gennady, 2001). The difference of Δθ at the smallest aperture in Fig. 4b between both approaches could also be attributed to side effects, such as the temporal stability of the heat plate radiator or small differences in camera focus. These effects are more pronounced for small object sizes due to the resulting reduction in modulation at high spatial frequencies (Budzier and Gerlach, 2021). The improved sampling observed with the continuous approach allows for a clearer depiction of the actual progression curve in the range where the response is not proportional. Regarding storage requirements, the disk space needed is significantly larger for the continuous approach as a natural consequence of saving a greater number of thermograms.

3.2 Influence of the camera frame rate and iris-driving period in the continuous approach
As stated earlier, the rate at which the image diameter changes in the thermogram sequence depends on both the iris-driving period 𝒯iris and the camera frame rate f. To evaluate the influence of these parameters, a parametric study was carried out. The SSE was measured with the telescopic lens and the close-up lens at Tset=275 °C. The camera was operated at its maximum frame rate, fmax=339 Hz, and the corresponding integration time for the selected measuring range was tint=28 µs. The iris was driven with three different periods, approximately 𝒯iris = {2, 5, 10} s, corresponding to a full close-and-reopen cycle (see Fig. 5). These values serve as references and are not exact since the iris adjustments were performed manually.
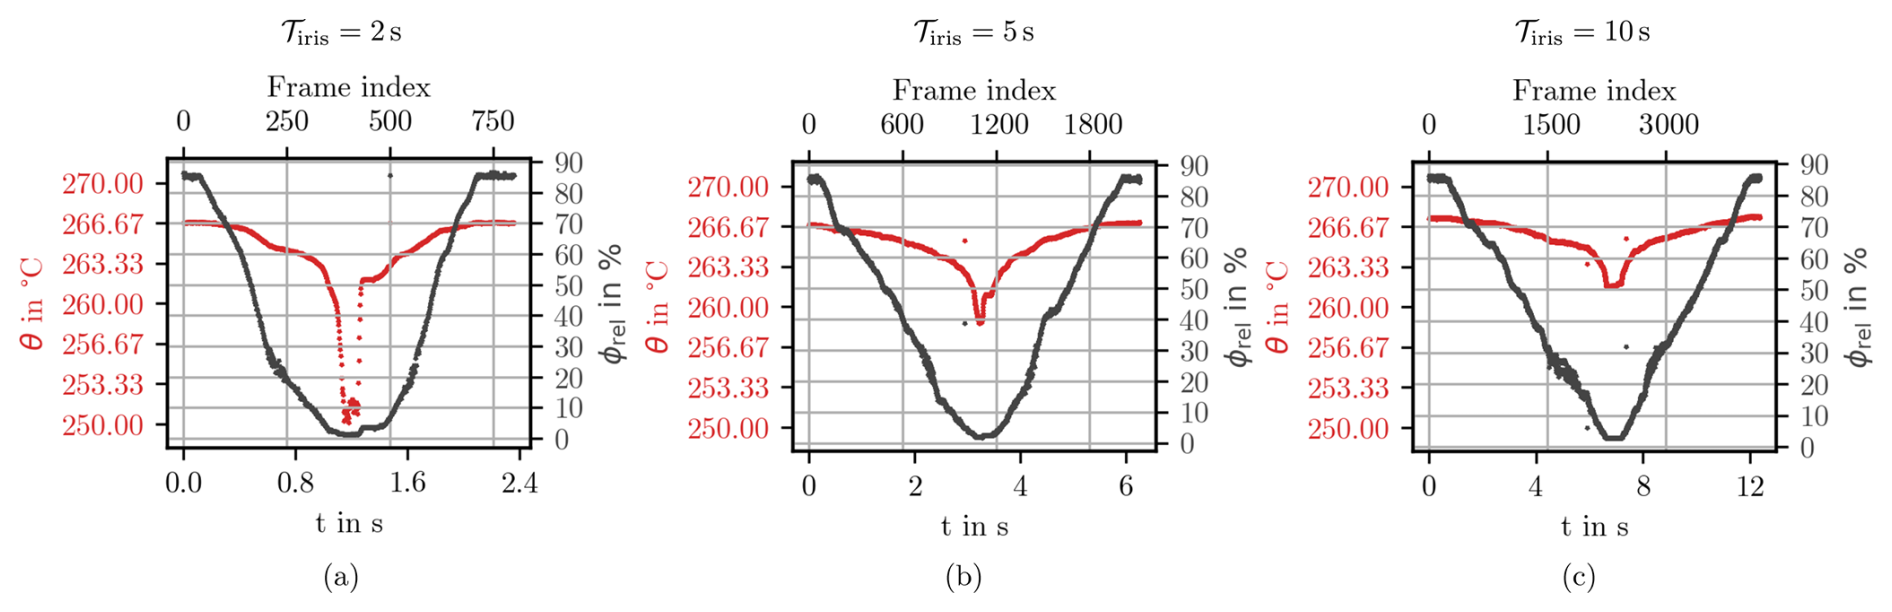
Figure 5Temporal evolution of θ for 𝒯iris = {2, 5, 10} s at fmax=339 Hz. The SSE was measured with the telescopic lens and the close-up lens at Tset=275 °C.
For the case with the highest iris dynamics (𝒯iris = 2 s), the temporal change rate of the radius, Δtpx, during the transit time ttr between the two limits can be approximated as
Since tint is significantly lower than Δtpx, each frame in the datasets collected for this experiment can be considered discrete and unaffected by blur.
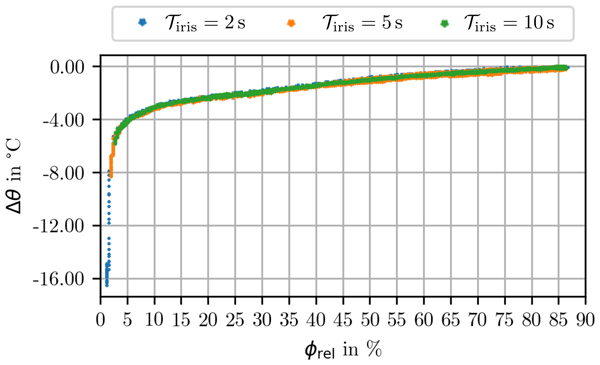
The results reveal that the continuous approach captures the reduction in image contrast caused by optical limitations (Budzier and Gerlach, 2021), as can be observed in Fig. 6. The difference between the minimum and maximum values of θ is linked to this phenomenon and decreases down to a value of ϕrel set by the modulation transfer function (MTF) of the optical system. The reproducibility of this measurement approach is demonstrated by these results, as the relationship between the measured temperature and the aperture diameter remains practically the same under varying conditions, across the entire range of the SSE curve. If the measurements are performed during the period in which thermal equilibrium is maintained, the SSE measurement is not significantly affected by systematic errors. For , the ROI is comparable to the iris-aperture diameter in the image, implying that the calculated θ may include pixels from the transition zone between the hot plate and the aperture. Pixels in this zone are strongly affected by the limited optical performance at high spatial frequencies.
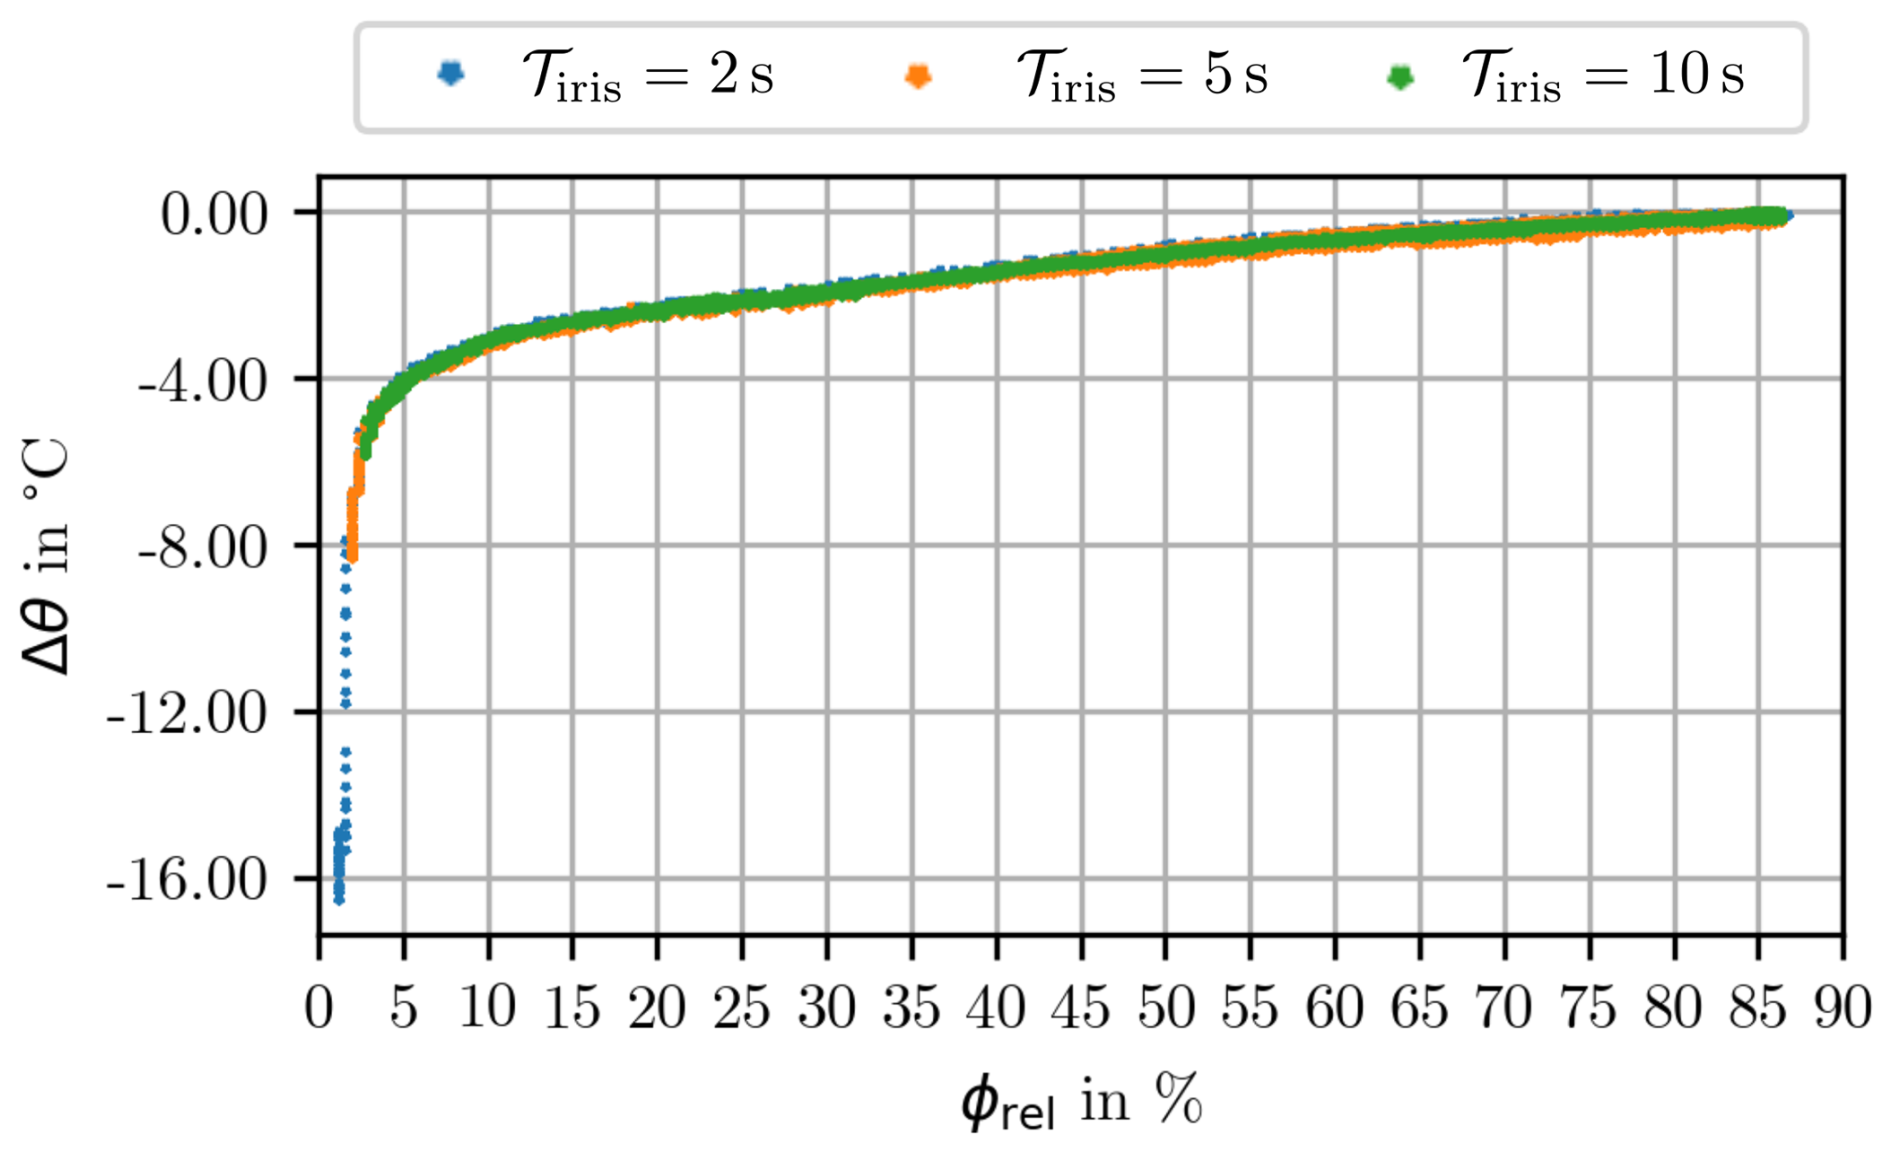
Figure 6Relationship between Δθ and ϕrel, for 𝒯iris = {2, 5, 10} s at fmax=339 Hz for all thermograms. The temperature deviations Δθ were calculated with the data presented in Fig. 5, where θref was set at the maximum temperature of each measurement sequence.
To further assess the effect of the camera frame rate, the SSE measurements were downsampled to create new datasets. For each 𝒯iris, a downsampled dataset was constructed by selecting thermograms Mi at the following indices:
where Ntotal is the total number of frames in the original sequence, i is the frame index, and k is an integer defining the sampling interval. This yields an effective downsampled frame rate fsi:
Nsi denotes the size of each downsampled dataset, and tis is the timestamp of each sampled thermogram, as originally recorded by the camera. In this study, the sampling steps were used, corresponding to . These values of k ensure that the constructed subsets comprise frames sampled at different positions in the original sequence. As a result, the overlap between subsets is minimized, which in turn reduces the correlation between them. The new subsets were not filtered with a low-pass anti-aliasing filter in either the temporal or spatial domain. When the subsets were created, the frame size was not reduced, and each frame was acquired independently; therefore, their temporal characteristics remain unaltered. Figure 7 shows the frames sampled for SSE evaluation along Φsample, for the considered iris-driving periods 𝒯iris and downsampled frame rates fsi. The reference number of frames, Nframes=50 (from the discrete approach), is rarely achieved; in most cases, the number of sampled frames is an order of magnitude lower. Additionally, the number of relative diameters in Φsample for which only a single frame was sampled increases as fsi and 𝒯iris decrease. This is significant, since diameter measurements based on a single frame are insufficient for monitoring temporal noise in the measured values.
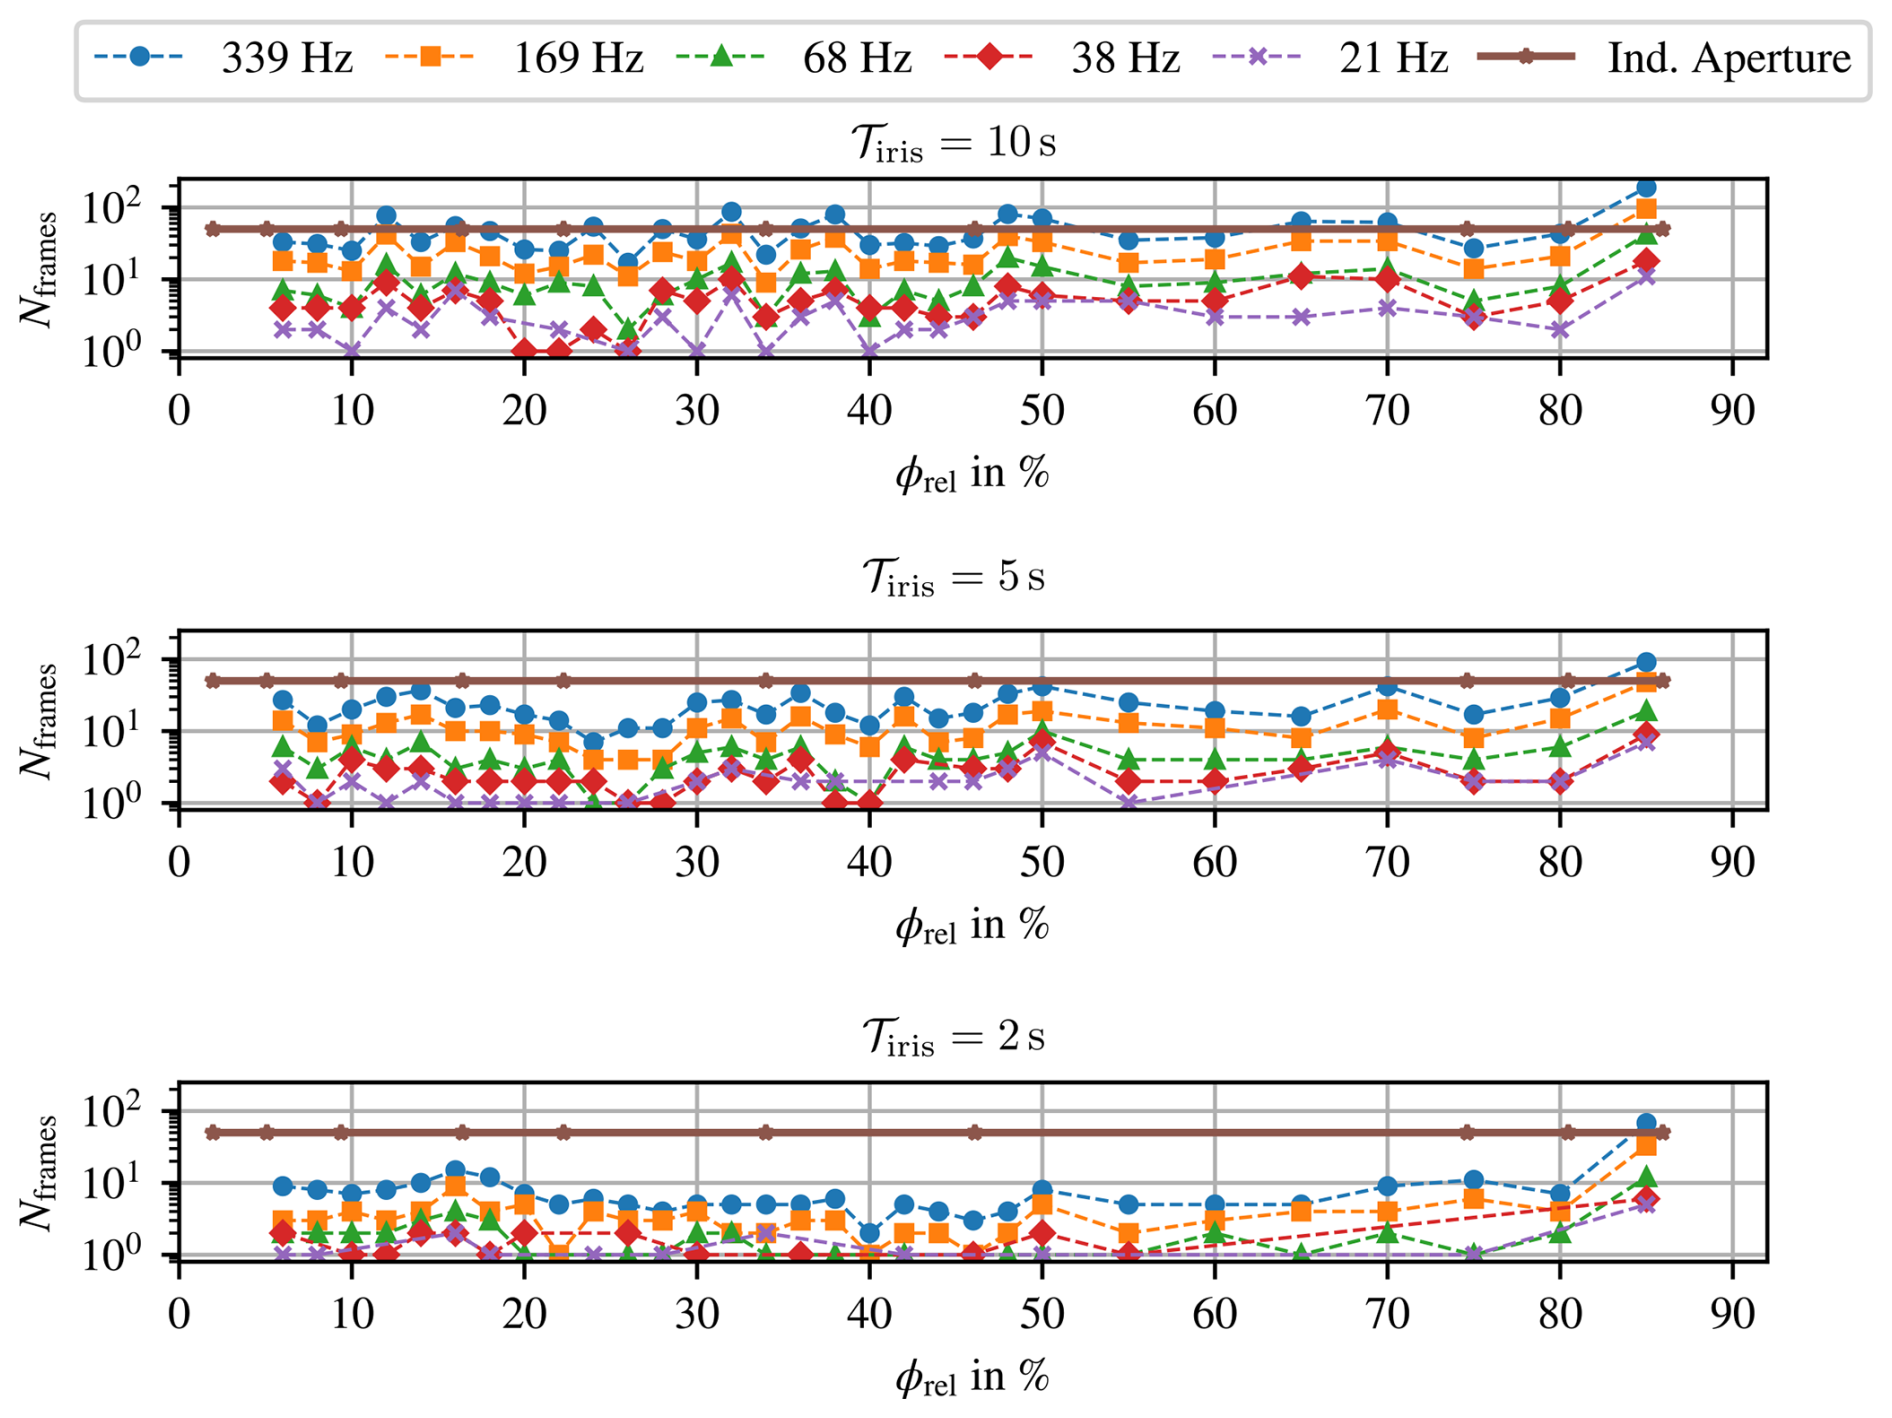
Figure 7Number of frames grouped over the range of ϕrel. “Ind. Aperture” corresponds to the case of the optical configuration with a normal lens at Tset=200 °C, which is presented as a reference case.
The standard deviation of θ, calculated over the sampled frames, is shown in Fig. 8. It can be observed that the temporal noise of θ, with Nframes=50, is similar to that obtained from thermograms of varying sizes acquired at different points in time. This suggests that, for both the discrete and continuous approaches, the temporal noise affecting the SSE measurement is comparable and primarily associated with common factors, such as the intrinsic temporal noise of the camera. It also indicates that the iris-driving period 𝒯iris and the camera frame rate f have little influence on the temporal stability of the measurement. Consequently, both approaches can accurately reproduce the SSE, provided that the thermogram sequence is acquired during a period of thermal equilibrium.
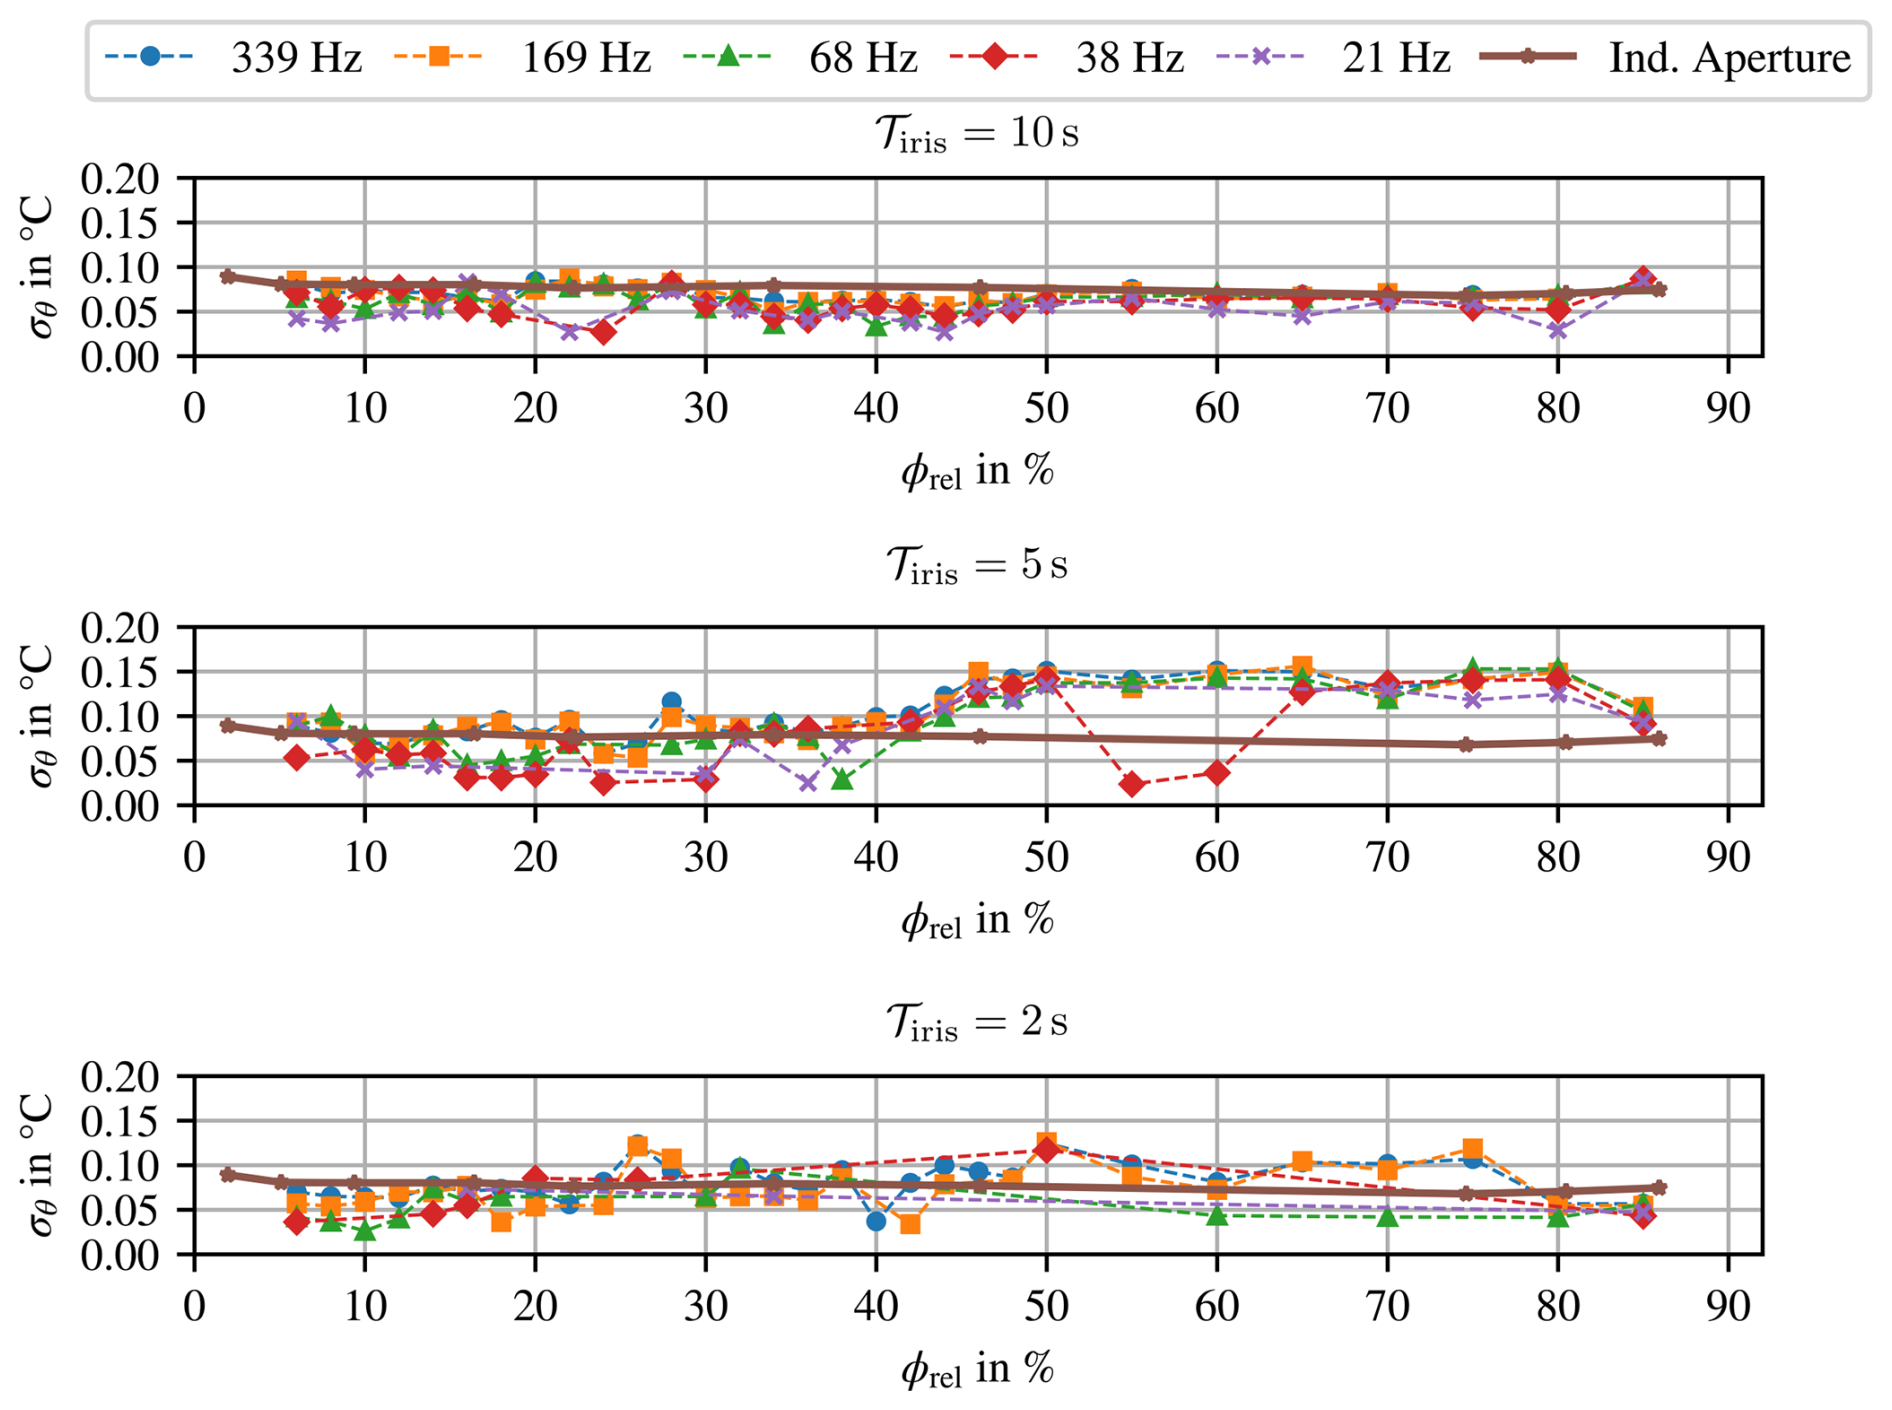
Figure 8Standard deviation calculated in the ROI, considered for the evaluation of the SSE, over the range of ϕrel. “Ind. Aperture” corresponds to the case of the optical configuration with a normal lens at Tset=200 °C, which is presented as a reference case. For points where Nframes=1, the standard deviation was not computed.
The calculated temperature deviations Δθ for the considered iris-driving periods are shown in Fig. 9. Three representative values of k were analyzed, corresponding to the maximum camera frame rate, half of that rate, and a value representative of what other cameras on the market can achieve (, and 16). In all cases, the SSE is reproduced comparably, and features of the curve, such as the change in slope between ϕrel=10 % and ϕrel=15 %, can be identified. It can be observed that, as the iris-driving period increases, the number of sampled measurement points across the considered ϕrel range also increases; conversely, decreasing 𝒯iris results in fewer sampled points. Even though sparse sampling can be locally compensated by defining additional measurement points in Φsample (), the general trend of the SSE within this range is already apparent in the results.
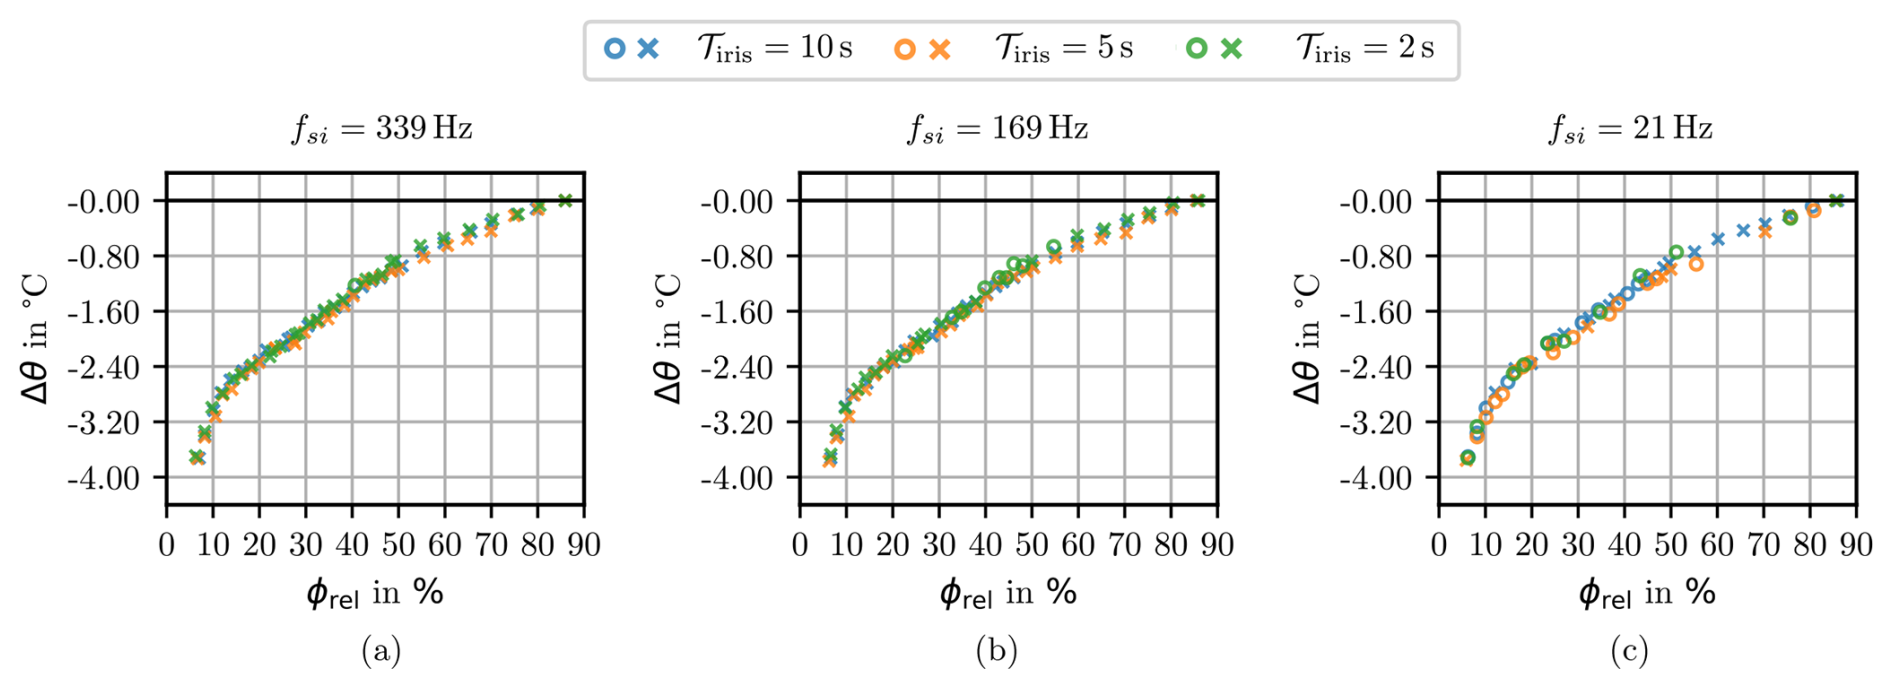
Figure 9Temperature deviations Δθ over the range of ϕrel for the considered driving periods 𝒯iris and , and 16. The continuous black line corresponds to Δθ=0 °C. Markers “o” and “x” represent data points obtained by averaging fewer than three frames and three or more frames, respectively.
3.3 Optical systems with transient response
The measurement of the SSE is influenced by not only temporal effects arising from the experimental setup but also the optical configuration of the camera. This is the case of certain absorptive neutral density filters, which regulate the amount of irradiance reaching the detector to enable measurements at higher temperatures. In the present study, the SSE was measured using the telescopic lens with an absorption filter at Tset=500 °C. Figure 10a shows the temporal evolution of the measured temperature within the ROI θ. It can be observed that while the change in diameter ϕrel appears approximately periodic, the measured temperature does not exhibit the same cyclic symmetry. Instead, θ displays a non-stationary baseline that shifts for the consecutive cycle. Figure 10c presents the distribution of Δθ as a function of ϕrel, revealing a non-closing hysteresis loop. The progression of the curves shows that the path followed during the opening of the iris does not coincide with the return path during its closure. Furthermore, the first cycle concludes at a temperature value lower than the initial state, resulting in an open-loop behavior with a residual Δθ offset. This indicates that the measured signal is coupled with the temporal history of the aperture adjustment, suggesting a thermal loading effect inherent to the absorptive optical configuration. The results in Fig. 10b confirm that this absorption-induced drift is reflected in the digital signal (DV) before any software post-processing, localizing the phenomenon within the optical path.
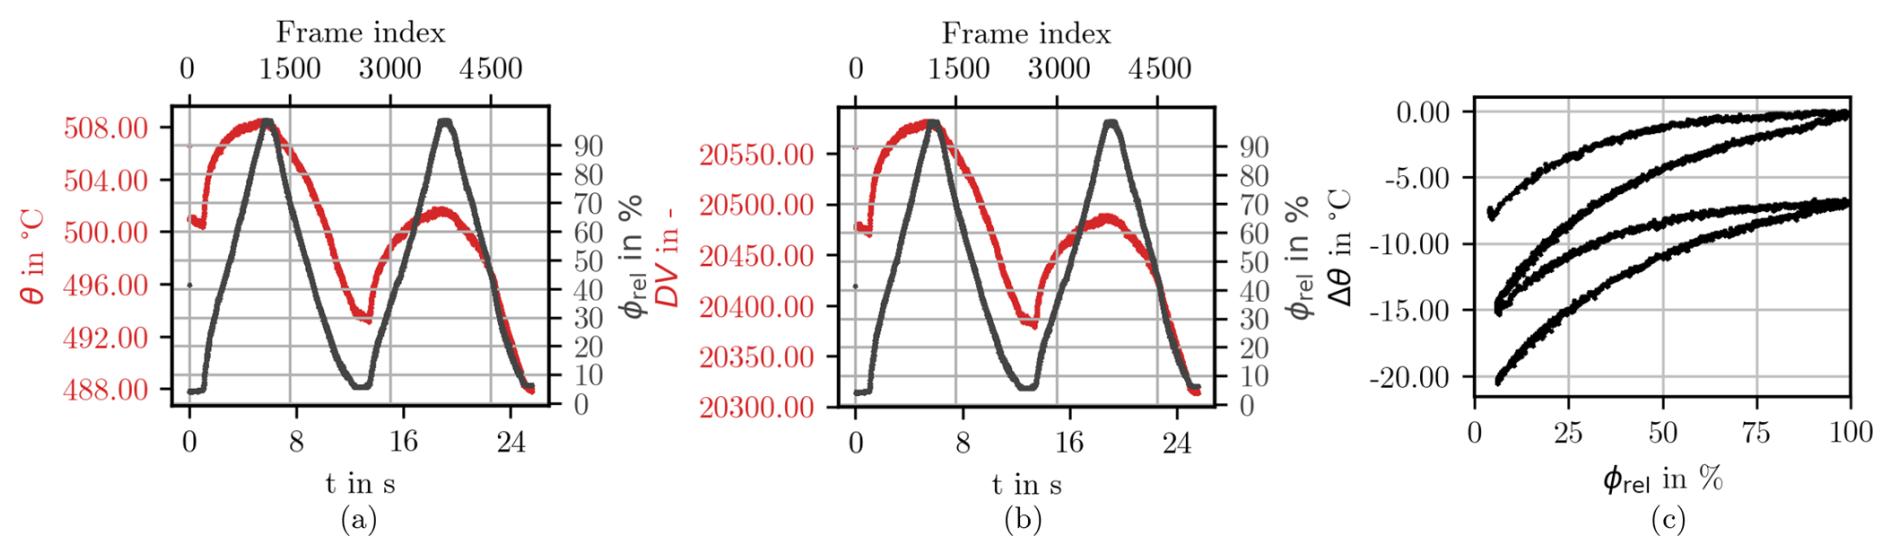
Figure 10SSE measurement for the telescopic lens with an absorptive filter at Tset=500 °C. (a) Temporal evolution of the measured temperature θ and (b) mean digital raw values DV within the ROI. (c) Relationship between Δθ and ϕrel for all thermograms, exhibiting a non-closing hysteresis loop due to absorption-induced thermal drift.
The above results raise the question of whether the SSE should be treated as a dynamic phenomenon. However, it is important to differentiate between the physical nature of the SSE, which remains an inherently static opto-geometric effect, from its experimental characterization, which in this case is intertwined with the thermal dynamics of the filter. The measurement incorporates a temporal component that ideally should converge to a steady state to isolate the true SSE. Achieving such stabilization is challenging in practice, as SSE measurements are often constrained by surface temperature perturbations of the heat plate radiator when apertures are placed in front of it for extended periods. Consequently, under these experimental conditions, the recorded response manifests as a dynamic process with a transient component. Practical aspects such as how the SSE manifests in scenarios outside the laboratory, for example when measuring a hot spot at radiance temperatures where such filters are required, how it can be accounted for in the uncertainty budget, and how the SSE can be compensated for will be addressed in future work.
This paper presents an alternative method for measuring the size-of-source effect (SSE) of infrared cameras, referred to as the continuous approach. This method involves recording the change in the detector signal as an iris diaphragm is continuously adjusted to vary the size of the radiant source. The continuous approach was compared against the direct method, referred to as the discrete approach. The SSE measurements were performed with a mid-wavelength infrared camera for two radiance temperatures and two types of lenses. Both methods provide a similar description of the dependency of the measured temperature on the aperture diameter. The results obtained with the continuous approach are less affected by the temporal stability of the heat plate radiator, as the measurement time is reduced by approximately 98 % in the experiments. The increased sampling density across the image size range enhances the resolution of the measured temperature deviation curves and enables a more detailed description of the SSE. Furthermore, the continuous approach makes it possible to flexibly adjust both the number of sampled points and their distribution after data acquisition, thereby facilitating more detailed SSE studies and supporting compensation methods based on numerical analysis. The iris diaphragm driving period and the camera frame rate were analyzed regarding whether these factors influence the assessment of the SSE. The analysis shows that these parameters have a negligible impact on the measured dependency of the temperature on the aperture diameter. Instead, the temporal variation in the measured temperature values is primarily determined by inherent factors, such as the temporal stability of the camera, for both discrete and continuous methods. Additionally, the SSE was characterized using an absorptive neutral density filter. The results indicate that in such configurations, the observed response cannot be treated as a purely static phenomenon due to a non-negligible thermal transient effect. This temporal effect introduces an absorption-induced drift that is coupled with the SSE, raising the question of whether the system must reach a steady state before characterization or if the measurement should be modeled as a dynamic process. Consequently, while the continuous method proposed in this paper remains a robust tool for rapid characterization, its application is limited to systems with thermal transients and requires careful decoupling of these effects to isolate the true stationary SSE. Nevertheless, this effect was uniquely evident when using the continuous method, posing an interesting question regarding the characterization of these kind of filters. Practical aspects such as measuring the SSE for this optical configuration, isolating it in practical situations, assessing its contribution to the uncertainty budget, and developing compensation strategies will be addressed in future work. Furthermore, future research will focus on enhancing the experimental setup by incorporating a stepper motor to more precisely control the iris diaphragm and its aperture change rate. The thermogram sequences acquired with the continuous approach will also be further analyzed to study the transfer function of the camera system and to develop methods for compensating for the SSE and other thermogram artifacts related to underlying physical phenomena.
Code and data are available upon request from the corresponding author.
MM performed the measurements, implemented the computational evaluation methods, analyzed the data, and wrote the paper. RS and AK supervised the research, reviewed the findings, and provided corrections to the paper.
The contact author has declared that none of the authors has any competing interests.
Publisher's note: Copernicus Publications remains neutral with regard to jurisdictional claims made in the text, published maps, institutional affiliations, or any other geographical representation in this paper. The authors bear the ultimate responsibility for providing appropriate place names. Views expressed in the text are those of the authors and do not necessarily reflect the views of the publisher.
This article is part of the special issue “Sensors and Measurement Science International SMSI 2025”. It is a result of the 2025 Sensor and Measurement Science International (SMSI) Conference, Nuremberg, Germany, 6–8 May 2025.
This research has been supported by the Bundesministerium für Wirtschaft und Klimaschutz (grant no. KK5055007AB1).
This paper was edited by Bernhard Jakoby and reviewed by two anonymous referees.
AlDawood, N. D., AlSbaiy, E. S., AlQahtani, N. M., and Ahmed, K. M.: Exploring the size-of-source effect of transfer radiation thermometers by various methods, in: Proceedings of the 2023 14th International Conference on Measurement, IEEE, Smolenice, Slovakia, 273–276, https://doi.org/10.23919/MEASUREMENT59122.2023.101644 59, 2023. a
Bart, M., Van Der Ham, E. W. M., and Saunders, P.: A new method to determine the size-of-source effect, Int. J. Thermophys., 28, 2111–2117, https://doi.org/10.1007/s10765-007-0251-6, 2007. a
Bloembergen, P.: On the uncertainty in the correction for the size-of-source effect, Metrologia, 46, 544–553, https://doi.org/10.1088/0026-1394/46/5/019, 2009a. a, b
Bloembergen, P.: Analytical representations of the size-of-source effect, Metrologia, 46, 534–543, https://doi.org/10.1088/0026-1394/46/5/018, 2009b. a, b, c
Bradski, G.: The OpenCV Library, Dr. Dobb's Journal of Software Tools, https://github.com/opencv/opencv (last access: 14 July 2026), 2000. a
Budzier, H. and Gerlach, G.: The size-of-source effect in thermography, J. Sens. Sens. Syst., 10, 179–184, https://doi.org/10.5194/jsss-10-179-2021, 2021. a, b, c
de Lucas, J.: Measurement, validation and uncertainty of an experimental procedure to characterize the size-of-source effect of radiation thermometers, in the framework of an industrial calibration laboratory, Sensors, 22, 8284, https://doi.org/10.3390/s22218284, 2022. a
Edmund optics: Standard Series Iris Diaphragms, https://www.edmundoptics.de/f/Standard-Series-Iris-Diaphragms/11621, last access: 9 January 2026. a
Envall, J., Mekhontsev, S. N., Zong, Y., and Hanssen, L. M.: Spatial scatter effects in the calibration of IR pyrometers and imagers, Int. J. Thermophys., 30, 167–178, https://doi.org/10.1007/s10765-008-0547-1, 2009. a, b
Graham, M. and Gennady, S.: A comparative study of size of source effect (SSE) determination techniques, in: Proceedings of the 8th International Symposium on Temperature and Thermal Measurements in Industry and Science, vol. 1, VDI/VDE-Gesellschaft Mess- und Automatisierungstechnik (GMA), Berlin, Germany, 150–160, ISBN 3800726769, 2001. a, b, c
Graham, M. and Mohamed, I.: SSE and temperature uncertainty, II-Low temperature systems, in: Proceedings of the 7th International Symposium on Temperature and Thermal Measurements in Industry and Science, vol. II, NMi Van Swinden Laboratorium in cooperation with Technical Committee 12 of the International Measurement Confederation IMEKO, Delft, the Netherlands, 687–692, https://www.researchgate.net/publication/283327102_Size_of_Source_Effect_and_temperature_uncertainty_II_low_temperature_systems/citations (last access: 23 July 2026), 1999. a
Hanssen, L. M., Mekhontsev, S. N., and Khromchenko, V. B.: Infrared spectral emissivity characterization facility at NIST, in: Proceedings of SPIE 5405, Thermosense XXVI, edited by: Burleigh, D. D., Cramer, K. E., and Peacock, G. R., vol. 5405, SPIE, Orlando, USA, 12 pp., https://doi.org/10.1117/12.542224, 2004. a
Hill, K. D. and Woods, D. J.: Exploring the size-of-source and distance effects of radiation thermometers, in: Proceedings of the 9th International Symposium on Temperature and Thermal Measurements in Industry and Science, vol. I, Laboratory for Process Measurement, Cavtat-Dubrovnik, Croatia, 599–604, ISBN 978-1-5108-0398-5, 2004. a
Infrared Systems: IR-150/301 Blackbody Radiator, https://infraredsystems.com/products/ir-150.html, last access: 15 July 2026. a
Jhonson, C., Fowler, J., and Cromer, C.: The SeaWiFS TransferRadiometer (SXR), vol. 1, NASA Center for AeroSpace Information, https://ntrs.nasa.gov/citations/19980223941 (last access: 15 July 2026), 1998. a
König, S., Gutschwager, B., Taubert, R. D., and Hollandt, J.: Metrological characterization and calibration of thermographic cameras for quantitative temperature measurement, J. Sens. Sens. Syst., 9, 425–442, https://doi.org/10.5194/jsss-9-425-2020, 2020. a, b
Lab IR Paints: Thermographic paint for low temperature applications, https://paints.labir.cz/en/paints/herp-lt/, last access: 9 May 2024. a
McMillan, J. L.: Traceable thermal imaging in harsh environments, PhD thesis, University of Surrey, https://doi.org/10.48550/arXiv.2302.05198, 2023. a
McMillan, J. L., Whittam, A., Rokosz, M., and Simpson, R.: Towards quantitative small-scale thermal imaging, Measurement, 117, 429–434, https://doi.org/10.1016/j.measurement.2017.12.023, 2018. a
McMillan, J. L., Hayes, M., Hornby, R., Korniliou, S., Jones, C., O'Connor, D., Simpson, R., Machin, G., Bernard, R., and Gallagher, C.: Thermal and dimensional evaluation of a test plate for assessing the measurement capability of a thermal imager within nuclear decommissioning storage, Measurement, 202, 111903, https://doi.org/10.1016/j.measurement.2022.111903, 2022. a
Mekhontsev, S.: Low scatter optical system for emittance and temperature measurements, in: AIP Conference Proceedings, Temperature, Its Measurement and Control in Science and Industry, vol. 684, American Institute of Physics, Chicago, USA, 693–698, https://doi.org/10.1063/1.1627208, 2003. a
Mendez-Bohorquez, M.-D., Ebert, J., Sommerlade, L., Schmoll, R., and Kroll, A.: The size of source effect for middle- and long-wavelength infrared cameras: assessment by direct measurements and a modulation transfer function approach, Quant. Infr. Therm. J., 1–18, https://doi.org/10.1080/17686733.2025.2589712, 2025. a
Ohtsuka, M. and Bedford, R.: Measurement of size-of-source effects in an optical pyrometer, Measurement, 7, 2–6, https://doi.org/10.1016/0263-2241(89)90019-5, 1989. a, b
OpenCV team: Open Source Computer Vision Library, GitHub [code], https://github.com/opencv/opencv/tree/4.11.0 (last access: 15 July 2026), 2025. a
Pušnik, I. and Geršak, G.: Evaluation of the size-of-source effect in thermal imaging cameras, Sensors, 21, 607, https://doi.org/10.3390/s21020607, 2021. a
Pušnik, I., Grgić, G., and Drnovšek, J.: System for the determination of the size-of-source effect of radiation thermometers with the direct reading of temperature, Meas. Sci. Technol., 17, 1330–1336, https://doi.org/10.1088/0957-0233/17/6/007, 2006. a
Riou, O., Durastanti, J. F., and Tortel, V.: Evaluation of error in temperature starting from the slit response function and calibration curve of a thermal focal plane array camera, in: Proceedings of the 2006 International Conference on Quantitative InfraRed Thermography, QIRT Council, Padua, Italy, https://doi.org/10.21611/qirt.2006.025, 2006. a
Saunders, P.: Correcting radiation thermometry measurements for the size-of-source effect, Int. J. Thermophys., 32, 1633–1654, https://doi.org/10.1007/s10765-011-0988-9, 2011. a, b
Saunders, P. and Edgar, H.: On the characterization and correction of the size-of-source effect in radiation thermometers, Metrologia, 46, 62–74, https://doi.org/10.1088/0026-1394/46/1/008, 2009. a, b
Schramm, S., Schmoll, R., and Kroll, A.: Compensation of the size-of-source effect of infrared cameras using image processing methods, in: Proceedings of the 2019 13th International Conference on Sensing Technology (ICST), IEEE, Sydney, Australia, 6 pp., https://doi.org/10.1109/ICST46873.2019.9047669, 2019. a, b, c
Schramm, S., Ebert, J., Schmoll, R., and Kroll, A.: Compensating the size-of-source effect: Relationship between the MTF and a data-driven convolution filter approach, in: Proceedings of the 2022 International Conference on Quantitative InfraRed Thermography, QIRT Council, Paris, France, p. 1001, https://doi.org/10.21611/qirt.2022.1001, 2022. a, b
Solorio-Leyva, J. C., Suarez-Romero, J. G., Hurtado-Ramos, J. B., Tepichin Rodriguez, E., and Cortes-Reynoso, J.-G. R.: The size-of-source effect in practical measurements of radiance, in: Proceedings of SPIE 5622, 5th Iberoamerican Meeting on Optics and 8th Latin American Meeting on Optics, Lasers, and Their Applications, SPIE, Porlamar, Venezuela, 1243–1248, https://doi.org/10.1117/12.590882, 2004. a
Yoo, Y. S., Kim, B.-H., Park, C.-W., Lee, D.-H., and Park, S.-N.: Size of source effect of a transfer reference thermometer suitable for international comparisons near to room temperature, in: Proceedings of the fundamental and Applied Metrology (IMEKO 2009, 20th International Conference), vol. 1, International Measurement Confederation (IMEKO), Lisbon, Portugal, 1495–1500, http://www.imeko2009.it.pt/Papers/FP_233.pdf (last access: 23 July 2026), 2009. a
Yoon, H. W., Allen, D. W., and Saunders, R. D.: Methods to reduce the size-of-source effect in radiometers, Metrologia, 42, 89–96, https://doi.org/10.1088/0026-1394/42/2/003, 2005. a, b