
the Creative Commons Attribution 4.0 License.
the Creative Commons Attribution 4.0 License.
 | 28 May 2026
Towards high-frame-rate data acquisition for ultrasound and photoacoustic imaging with high signal-to-noise ratio
Sebastian Kindorf
Fabio Gutmann
Christian Weber
Benedikt Bierer
Jürgen Wöllenstein
Chris Stoeckel
We present an eight-channel evaluation board that enables fast data acquisition for ultrasound sonography (USG) and photoacoustic imaging (PAI). High frame rates enable averaging, resulting in an improved signal-to-noise ratio (SNR). A high SNR is becoming increasingly important in photoacoustic imaging, as the trend in the development of new systems is shifting from powerful solid-state lasers (pulse repetition frequency ≈ 10–100 Hz, pulse energy ≈ 10–100 mJ) to integrated compact pulsed laser diodes (PLDs) offering higher pulse repetition frequencies (≈ 1–10 kHz) at reduced pulse energies (≈ 1 µJ–2 mJ). The board is designed for processing high data rates and a robust analog signal chain. It integrates a programmable preamplifier (preamp) with adjustable gain followed by an integrated circuit comprising low-noise amplification, low-pass filtering, and 12-bit analog-to-digital (ADC) conversion. An AMD Zynq system-on-chip (SoC) handles processing on the board. The ADC is readout with low-voltage differential signal (LVDS) and the captured data are transmitted via Ethernet. Evaluation and image processing is done on a PC. The scientific contribution is the quantitative characterization of gain distribution and its effect on SNR in a multichannel photoacoustic receive chain. A sustained acquisition rate of 540 frames per second is demonstrated, validating frame averaging as an effective method to compensate for reduced pulse energy of compact pulsed laser diodes.
- Article
(2067 KB) - Full-text XML
- BibTeX
- EndNote


Photoacoustic imaging (PAI) combines the advantages of optical and ultrasound imaging, offering high spatial resolution and specific tissue composition information through the detection of ultrasound waves generated by absorbed optical energy (Xu and Wang, 2006; Cao et al., 2022). The technique operates by illuminating tissue with short pulses of light that are absorbed by chromophores, leading to transient thermoelastic expansion and the generation of broadband ultrasound that is detected and reconstructed into images (Xu and Wang, 2006). The optically generated ultrasound is typically in the megahertz range, with higher frequencies offering improved spatial resolution but greater acoustic attenuation, which limits the achievable imaging depth. Photoacoustic imaging requires pulsed lasers that emit light in a wavelength range of 400 to 1400 nm (Riksen et al., 2023). High-energy solid-state lasers, such as Nd:YAG lasers, provide sufficient fluence with ≤ 20 mJ cm−2 for deep imaging but are typically bulky, costly, and limited in pulse repetition frequency (PRF) of ≈ 10–100 Hz, which constrains clinical practicality (Xu and Wang, 2006; Wang and Hu, 2012; Upputuri and Pramanik, 2015). Optical parametric oscillators (OPOs) are commonly coupled to such systems to enable tunable wavelength output, allowing advanced imaging applications. Pulsed semiconductor emitters offer compactness, high PRF (≈ 1–10 kHz compared to ≈ 10–100 Hz for solid-state systems), and lower cost, but their lower pulse energy (≈ 1 µJ–2 mJ) reduces signal-to-noise ratio and often requires frame averaging (Upputuri and Pramanik, 2015; Daoudi et al., 2014). Receiver-side strategies such as filters and sliding averaging can improve sensitivity and contrast without increasing pulse energy or changing wavelength but requires a sufficient pulse repetition frequency, underscoring the importance of high-throughput, low-noise broadband detection electronics (Enz and Temes, 1996; Walden, 1999). To address this need, a high-frame-rate ultrasound acquisition system designed for high-SNR measurements is developed.
Photoacoustic imaging maps optical absorption in tissue by detecting ultrasound waves that arise from transient thermoelastic expansion after pulsed optical excitation. The method combines molecularly-specific optical contrast with ultrasonic spatial resolution for medical imaging (Xu and Wang, 2006). Figure 1 illustrates the PAI working principle in six steps. Although ultrasound and photoacoustic imaging share similar receive hardware and signal processing, they differ fundamentally in their signal generation. In photoacoustic imaging, pulsed optical excitation is used, where the wavelength, pulse energy, and duration are chosen to maximize photoacoustic efficiency while satisfying stress and thermal confinement conditions at the absorber scale and remaining within the maximum permissible exposure limits of the laser safety standards (Riksen et al., 2023).
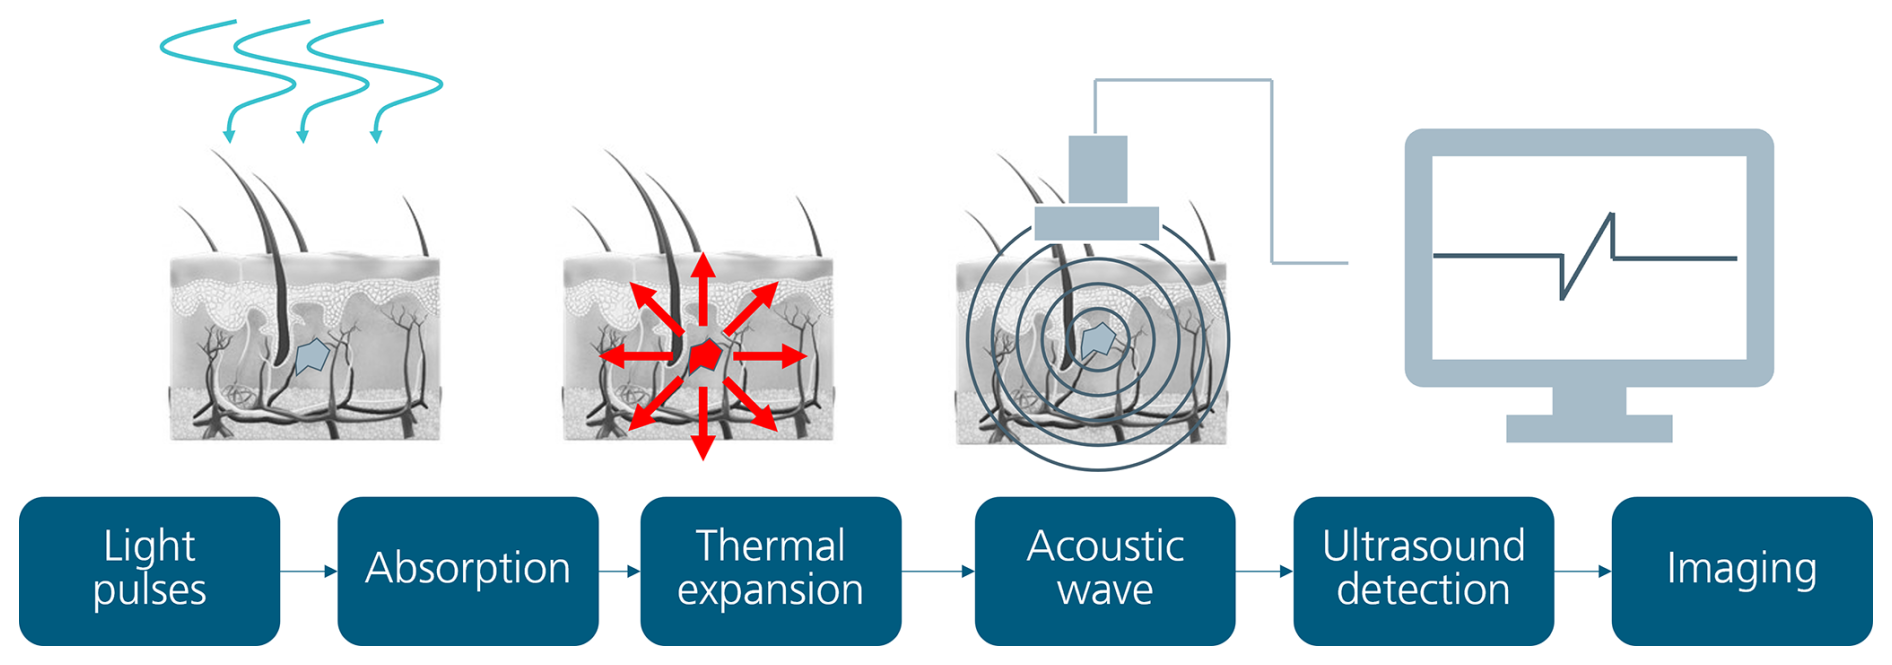
Figure 1The schematic illustrates the PAI principle. Nanosecond light pulses enter tissue and are absorbed by chromophores, which convert it into heat. The rapid thermal expansion generates an outward-propagating acoustic wave. An ultrasound array detects the waveforms. Beamforming and signal processing are used to reconstruct an image of the absorbed optical energy.
The emitted photons are scattered in the tissue and then absorbed by chromophores. These are primarily hemoglobin, melanin, lipids, and water, which absorb the pulse energy and relax non-radiatively, converting optical energy into heat. The resulting initial pressure rise depends on the Grüneisen parameter, local temperature, tissue composition, absorption coefficient, and fluence (Riksen et al., 2023; Xu and Wang, 2006; Jacques, 2013). The Grüneisen parameter describes the efficiency of heat-to-pressure conversion in the tissue (Xu and Wang, 2006). Using specific wavelengths of the light source that correspond to the absorption characteristics of different biological chromophores enables the visualization of anatomical structures and physiological processes, which is shown in Fig. 2 (Manohar and Razansky, 2016).
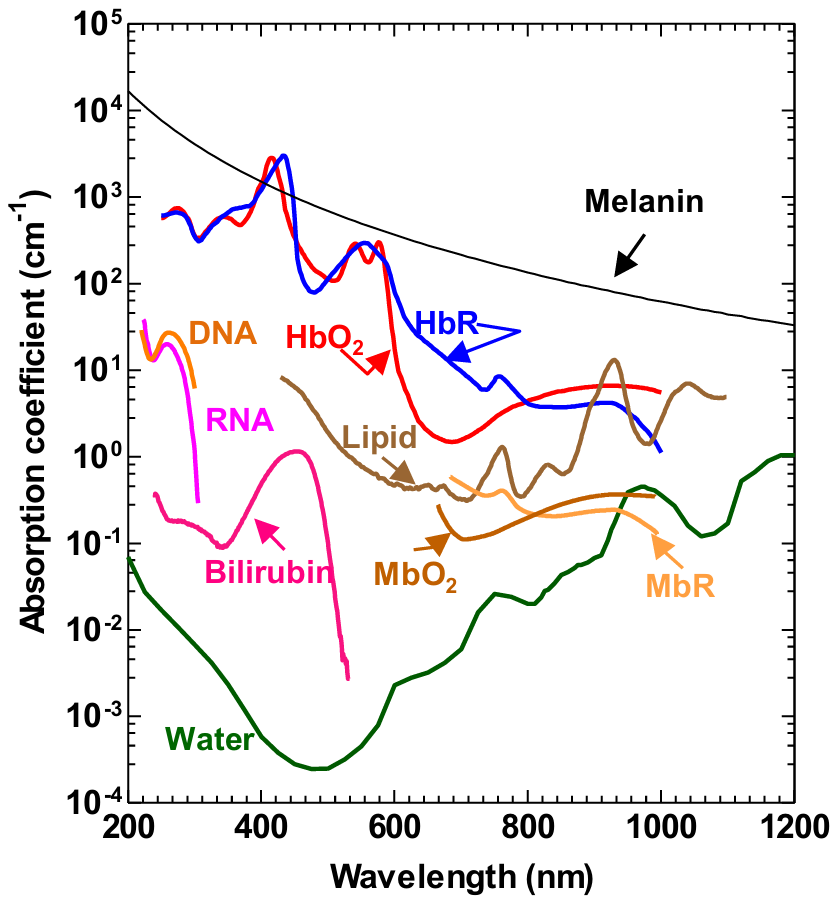
Figure 2Absorption coefficient vs. wavelength of different tissue-typical chromophores with logarithmic axis (Yao and Wang, 2014).
The thermoelastic expansion causes a rapid local increase in temperature due to thermal and stress-related limitations, where absorbed energy cannot dissipate through heat conduction or lattice vibrations fast enough to prevent pressure buildup. This effect occurs when the pulse duration is significantly shorter than the thermal diffusion and stress propagation time of the absorber. This leads to an instantaneous increase in pressure, causing a broadband acoustic emission. The emitted bandwidth depends on the pulse duration of the light source (Riksen et al., 2023; Wang and Hu, 2012).
The thermoelastic generated ultrasound wave propagates outward toward the skin. Its amplitude and frequency composition are influenced by the size of the absorber and the absorption contrast. Image artifacts are primarily caused by spatial heterogeneity of the sound velocity, boundary reflections and reverberation, as well as limited view, resulting in blurring, geometric distortions, and spurious mirror images (Riksen et al., 2023; Wang and Hu, 2012).
To record these ultrasonic waves, a broadband array with typically 128 or 256 sensor elements captures the waveforms. Its center frequency, fractional bandwidth, sensitivity, element spacing, and aperture determines resolution and SNR (Xu and Wang, 2006). In the receive electronics, the noise standard deviation scales with the noise-equivalent bandwidth (σnoise∝ √ B). Widening the bandwidth improves axial resolution but reduces SNR for a fixed signal peak. Dominant noise sources are the transducer's Johnson–Nyquist noise arising from its resistive elements, and the amplifier's intrinsic voltage and current noise due to device thermal noise, shot noise, and low-frequency flicker () noise (Nyquist, 1928; Walden, 1999; Enz and Temes, 1996).
Imaging reconstruction re-creates the initial pressure distribution, most commonly with delay-and-sum beamforming, although model-based approaches are also used (Wang and Hu, 2012). This is where the main advantage of photoacoustics over ultrasound imaging comes into play. Not only can different tissue types be distinguished but chromophores like oxy- and deoxyhemoglobin, melanin, and lipids also enable the label-free visualization of microvasculature, and tissue composition and support functional readouts (Cox et al., 2012). In signal-to-noise-limited operation, averaging N independent frames improves sensitivity by √N (10 log10(N) dB), and matched filtering provides energy-optimal detection without degrading spatial resolution (Turin, 1960). For a good SNR, transducers and amplifiers must be matched to each other to discuss the transmission of as much power as possible and to avoid reflections. This will be discussed in the following chapter.
Under clinically permissible optical fluence and typical tissue properties, transducer photoacoustic receive signals are in general several magnitudes weaker than conventional diagnostic ultrasound signals (Beard, 2011). The initial pressure in photoacoustics scales with the absorbed optical energy and the Grüneisen parameter but decreases with depth as a result of optical and acoustic attenuation, which limits the receiver signal (Xu and Wang, 2006). Conventional diagnostic ultrasound uses transmit pressures in the megapascal range, and the receive electronics are designed to accommodate large echo amplitudes and wide dynamic range, whereas photoacoustic signals at comparable frequencies often originate from kilopascal-scale initial pressures and therefore require higher overall receive gain and lower input referred noise at the first stage (Wells, 1999; Szabo, 2014; Beard, 2011). These differences make careful matching of the transducer and the preamplifier essential to maximize the signal-to-noise ratio through appropriate input impedance, noise figure, and gain distribution (Beard, 2011; Xu and Wang, 2006). In conventional medical ultrasound systems, the receive path begins with a low-noise preamplifier followed by variable gain and filtering which sets the noise performance and enables time gain compensation for depth-dependent attenuation (Wells, 1999; Szabo, 2014). The transition from high-pulse-power laboratory lasers to compact laser diodes with lower pulse energy and a higher repetition rate further reinforces the need for noise-efficient front-end design in photoacoustic systems (Wang and Hu, 2012).
The following simulation study presents a quantitative analysis of receiver preamplifier and ultrasonic transducer effects in a controlled environment. An AD8334 is used as the preamplifier, employing the SPICE macro model provided by Analog Devices (Analog Devices, Inc., 2025). Figure 3 illustrates the internal architecture with a low-noise amplifier (LNA) that provides fixed initial gain and a variable gain amplifier (VGA) that enables programmable gain and time gain compensation (TGC). The device produces a differential output, which is converted to a single-ended signal by a unity gain difference amplifier implemented with an OPA4354 and four matched 1 kΩ resistors, ensuring compatibility with the subsequent analog front-end. The block diagram shown is taken from the single-channel AD8331 and is representative of the four-channel AD8334 used in this study (Analog Devices, Inc., 2025).
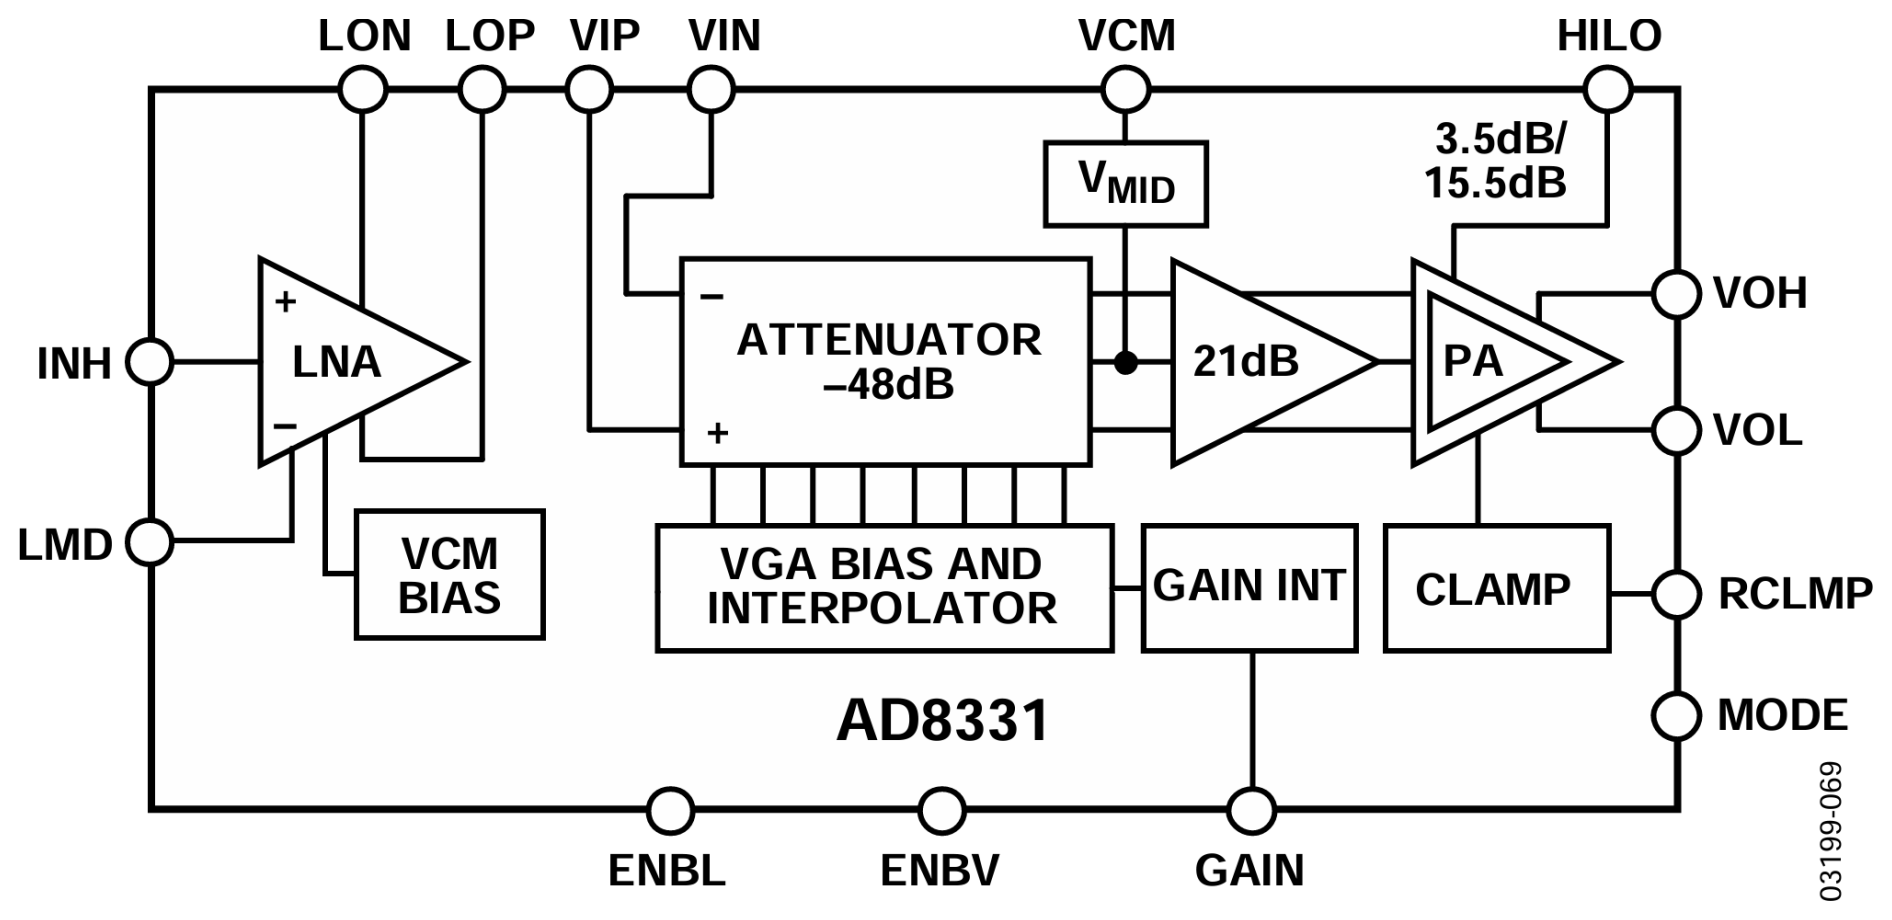
Figure 3Internal setup of the AD8334 with low-noise amplifier (LNA) and variable gain amplifier (VGA) (Analog Devices, Inc., 2025).
The input signal models a piezoelectric micromechanical ultrasonic transducer (PMUT) manufactured using the technology developed by Stoeckel et al. (2024). The PMUT is represented as a damped mass-spring resonator with a seismic mass of 2.3 × 10⁻¹¹ kg, a mechanical stiffness of 3600 N m−1, and a quality factor of Q= 3, yielding a simulated resonance frequency of 2 MHz. The electromechanical transduction is modeled with a charge-per-deflection coefficient of 9.3 × 10⁻⁷ C m−1 per membrane across 360 membranes, resulting in a total transduction factor of 3.35 × 10⁻⁴ C m−1.
When driven by a broadband photoacoustic pressure transient, which takes the form of a bipolar N-shaped wave at the transducer surface, the PMUT responds according to its resonant transfer function. Due to the narrowband mechanical resonance of the PMUT (Q= 3), the broadband acoustic excitation produces a short exponentially damped sinusoid at the electrical output, whose frequency and decay rate reflect the resonant frequency and quality factor of the transducer. The incident pressure is set to 1 kPa. The receiver area consists of 360 membranes with a diameter of 100 µm, which leads to an overall active area of 8.88 mm2. The PMUT presents a capacitive source impedance of approximately 227Ω at the 2 MHz resonance frequency, determined by the static parallel capacitance of 350 pF. As the transducer operates on a charge generation principle, maximum signal transfer is achieved by a high-impedance amplifier input rather than a conjugate impedance match. The LNA is therefore configured with feedback resistance of 100 kΩ, ensuring that signal charge is preserved at the amplifier input and minimizing loading of the capacitive source. To maintain a linear mapping from the incident acoustic pressure p(t) to voltage, the PMUT output is AC-coupled into the AD8334-based preamplifier chain.
The resulting time-domain waveforms are shown in Fig. 4 and illustrate signal propagation through the preamplifier chain. The LNA provides a fixed gain of 19 dB, increasing the peak signal from approximately 5 mV at the PMUT node V(preamp_in) to approximately 50 mV at the differential LNA output V(LNA_OP, LNA_ON). The VGA gain is set by a resistive voltage divider with R= 39 kΩ and R= 10 kΩ, producing a control voltage of 1.02 V at the gain pin and a resulting VGA gain of approximately 20.8 dB, which brings the differential output V(VGA_OH, VGA_OL) into the sub-volt range. The subsequent unity gain difference amplifier delivers a peak amplitude of approximately 0.8 V at the single-ended output V(preamp_out), which remains within the supply voltage range and confirms the absence of clipping. The waveform shape is preserved throughout the signal chain, and the absence of unwanted transients or overshoots confirms adequate bandwidth and stable operation across all gain stages.
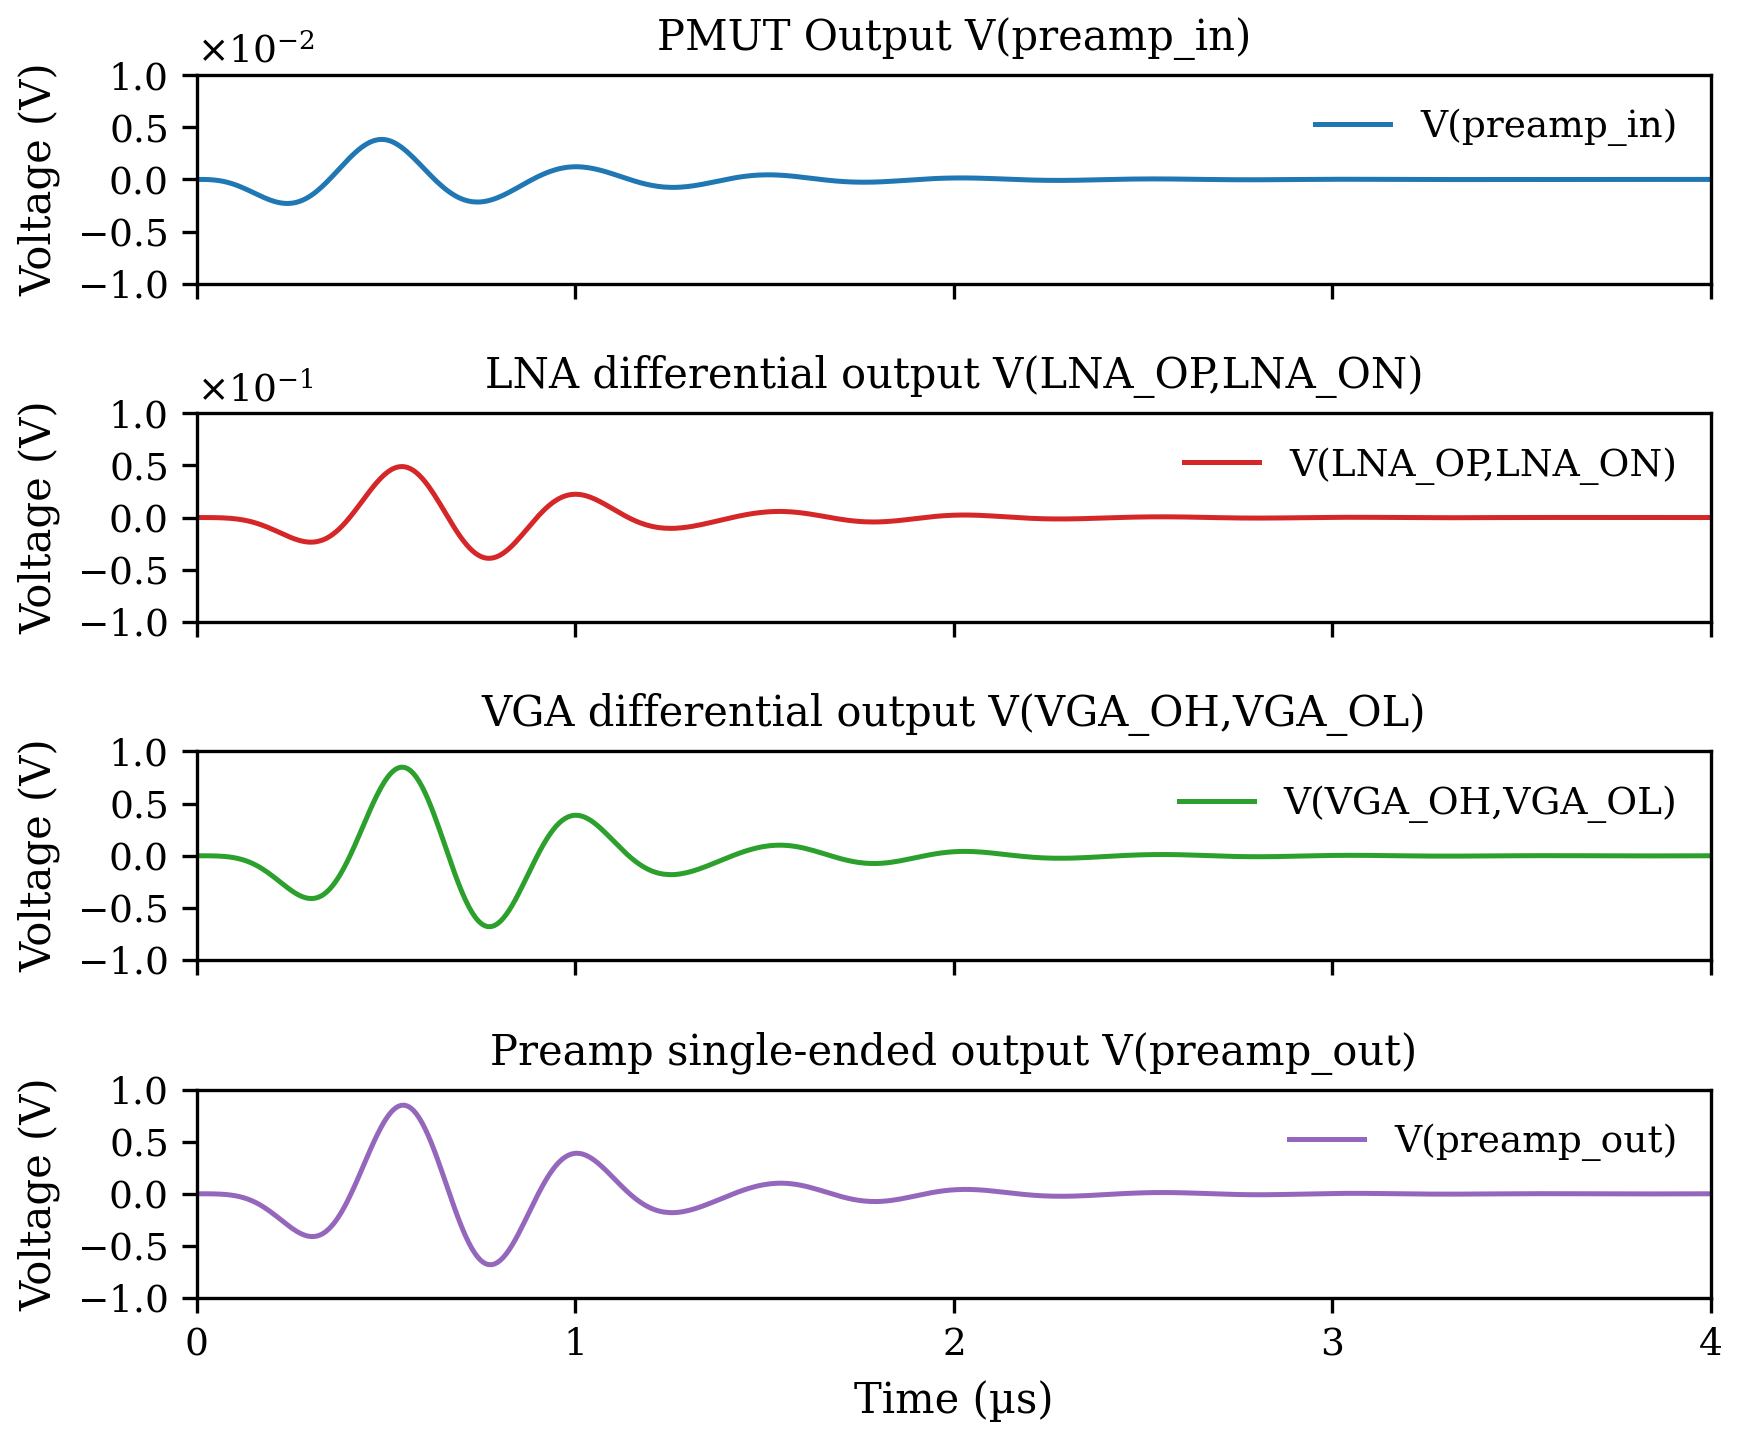
Figure 4Simulated receive-path waveforms from sensor to preamp output: PMUT signal at V(preamp_in), followed by the LNA differential output V(LNA_OP, LNA_OL) and VGA differential output V(VGA_OH, VGA_OL), ending with the preamplifier single-ended output V(preamp_out).
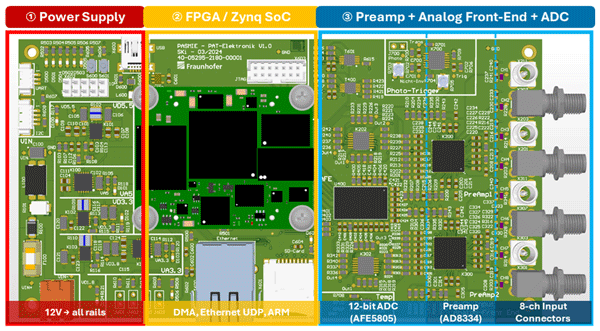
A custom-printed circuit board (PCB) was developed to acquire and forward multichannel ultrasonic data from a PMUT array. The platform implements eight receive channels at 50 MSPS and focuses on high frame rate, low-noise signal conditioning, and deterministic streaming to a host system. The architecture comprises three functional blocks, which are shown in Fig. 5. An onboard power supply converts a 12 V input into regulated rails for the analog and digital domains, with 3.3 and 5 V for analog sections and 3.3 V for digital logic shown in red. The receive-path conditions the weak transducer signals through a dedicated preamplifier (AD8334) followed by the AFE5805, which provides low-noise amplification, low-pass filtering, and 12-bit analog-to-digital conversion, both marked in blue. A processing unit based on an AMD Zynq™ 7020-1C FPGA from Trenz Electronic (TE0720-04-61C33MA) system-on-chip combines an Artix-7 field-programmable gate array (FPGA) fabric for high-speed capture and buffering with a dual-core ARM Cortex-A9 that executes bare metal control firmware and Ethernet transmission, which is displayed in orange. Bare metal firmware development is a specialized approach in which programming is done directly at the hardware level without relying on an operating system or middleware.
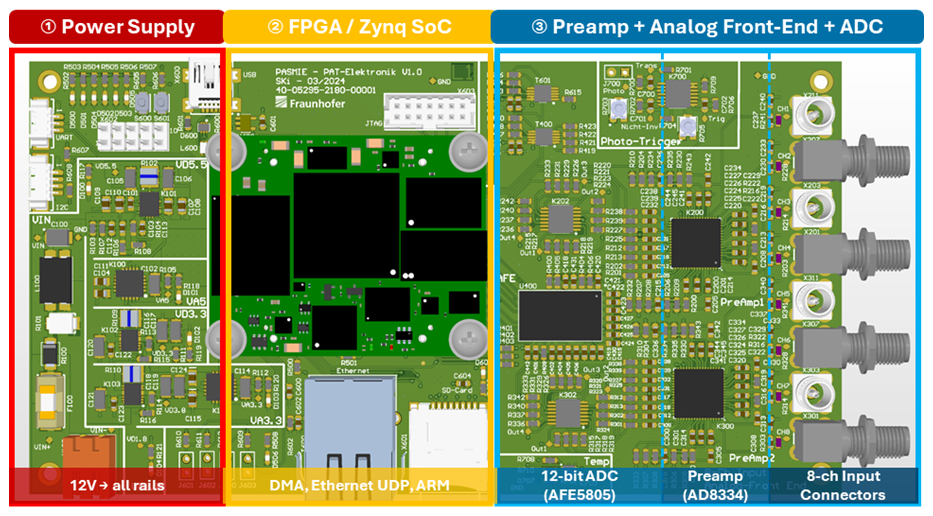
Figure 5Eight-channel PCB for fast ultrasound readout. The onboard power supply derives all regulated rails from a 12 V input (red). The analog front-end section (blue) is subdivided into three stages: eight SMA input connectors for the transducer array, two AD8334 low-noise preamplifiers that boost the raw transducer signals, and an AFE5805 from Texas Instruments that performs 12-bit analog-to-digital conversion with an integrated programmable attenuator and low-pass filter. Data are transmitted via LVDS to the FPGA, deserialized, written to memory by DMA, and forwarded over Ethernet UDP to a host PC for reconstruction and filtering. An AMD Zynq 7020 system-on-chip combining FPGA fabric with dual ARM Cortex-A9 cores manages acquisition control and data transfer (orange).
Figure 6 illustrates the signal and data flow from the transducer to the host computer and shows how the preamp, the analog front-end with the ADC, and the SoC interact to deliver a stream of time-aligned data. The signal path begins at a PMUT array with a center frequency of 2 MHz. The platform operates in receive-only mode, with no transmit path and no transmit–receive protection. The ultrasound signal is generated by a pulsed laser. Each channel first passes through a dedicated preamplifier stage implemented with AD8334 devices. The internal LNA provides 19 dB of gain and the variable gain amplifier supports up to 43.5 dB of gain. No time gain compensation is applied, and no external low-pass filter is placed before the preamplifier. In the configuration shown in the figure, the effective preamplifier gain is set to 40 dB. The conditioned signals enter the AFE5805, which integrates a 12-bit analog-to-digital converter and configurable analog blocks (Texas Instruments, 2025).
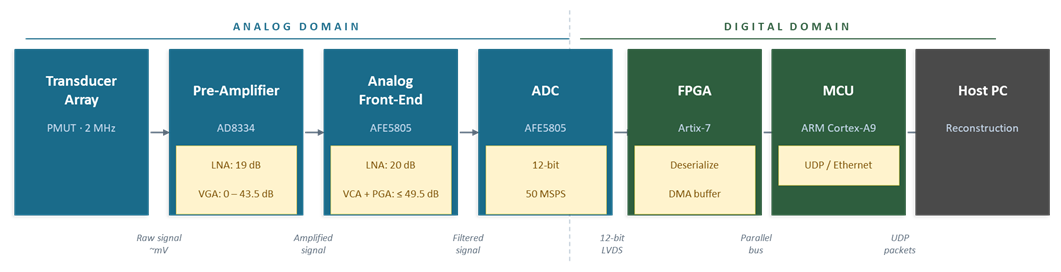
Figure 6Block diagram of the eight-channel PAI acquisition platform illustrating the complete signal chain from transducer to image reconstruction. The analog amplification chain comprises two cascaded stages. First, the preamplifier (AD8334) provides a fixed low-noise amplifier (LNA) gain of 19 dB, followed by a variable gain amplifier (VGA) with a range of 0 to 43.5 dB, configured to a total preamplifier gain of 40 dB. Second, the analog front-end (AFE5805) integrates a fixed LNA of 20 dB, a voltage-controlled attenuator (VCA, 0 to 46 dB), and a programmable gain amplifier (PGA, 0 to 30 dB), yielding a maximum combined gain of 49.5 dB. No time gain compensation and no external low-pass filter are applied prior to the preamplifier. The conditioned signals are digitized at 12-bit resolution with 50 MSPS. Within the AMD Zynq 7020 system-on-chip, the FPGA fabric deserializes the LVDS data stream and transfers samples to on-chip memory via DMA, while the ARM Cortex-A9 MCU transmits the buffered data over UDP/Ethernet to the host PC for image reconstruction.
The AFE5805 contains a low-noise amplifier with 20 dB fixed gain. A voltage-controlled attenuator with a 46 dB range, precedes a programmable gain amplifier that provides up to 30 dB of gain. Together these stages set the overall analog chain gain, which at minimum attenuation reaches a typical maximum of 49.5 dB. This gain staging elevates the signal level while preserving headroom at the converter input. The board interfaces to the transducer through SMA connectors to maintain signal integrity and to simplify laboratory integration. After conversion, the AFE outputs serial LVDS data together with a data clock and a frame clock. FPGA recovers the clocks, deserializes the streams into a synchronous parallel bus, and buffers the data first in first out (FIFO) memories. These data are written via direct memory access (DMA) into the microcontroller unit memory to decouple acquisition from network transmission.
Acquisition is synchronized to the optical excitation by a fast photodetector trigger. A silicon-biased photodetector with a 35 ns rise time (Thorlabs DET100A2) provides a clean input trigger that defines the start of a fixed 50 µs capture window which yields 2500 samples per channel per measurement at 50 MSPS. The 12-bit AFE data are converted into a 16-bit vector for internal processing. The resulting data volume per measurement consists of eight channels with 16 bits each and 2500 samples, resulting in 40 000 bytes. The microcontroller unit reads the buffers, appends minimal frame metadata if required, and streams the payload over Ethernet using UDP to a host computer for storage and reconstruction.
This chapter contains the evaluation of the concept in a controlled photoacoustic experiment and the verification of whether the platform can detect and average weak acoustic transients across eight channels. The choice of eight channels is based on the standard architecture of integrated circuits for analog front-ends with integrated analog-to-digital converters. This study therefore serves as a preliminary investigation to validate the platform concept before the system is scaled up to a higher number of channels, such as 32 or 128, in future work. A pulsed laser illuminates a spherical absorber that converts optical energy into an acoustic pressure transient through thermoelastic expansion. The laser source is a CryLaS DSS1064-Q3 that provides 1.5 ns optical pulses with 50 µJ pulse energy at a wavelength of 1064 nm and a pulse repetition frequency of 1 kHz. The absorber is a 3.4 mm black cellulose acetate sphere placed with 34 mm distance to the transducer. The acoustic wave is detected by an array of eight 2 MHz PMUTs, each with an active membrane area of 8.88 mm2 and a pitch of 0.8 mm × 10 mm from Fraunhofer ENAS (Stoeckel et al., 2024). A Thorlabs DET100A2 photodetector delivers an electrical trigger derived from the optical pulse and defines the start of each acquisition window. Each trigger starts a fixed capture window of 50 µs at 50 MSPS, which yields 2500 samples per channel per measurement at 12-bit resolution. With the configured buffering and network pipeline, approximately 540 trigger events per second are acquired and transmitted to the host computer. The data acquisition electronics operate independently of the laser source and are driven at their maximum sustainable throughput, which in the current implementation limits the effective trigger rate to 540 Hz despite the laser providing a pulse repetition frequency of 1 kHz. This throughput exceeds the 10–50 Hz pulse repetition typical of high-energy photoacoustic sources based on Nd:YAG or OPO lasers (as reviewed by Beard, 2011) and surpasses the roughly 20 to 50 frames per second common in conventional B-mode ultrasound imaging (as described by Szabo, 2014). At the same time, it remains below the kilohertz pulse repetition frequencies characteristic of photoacoustic systems driven by diode laser, where kilohertz operation is achieved only at reduced pulse energy, as demonstrated by Upputuri and Pramanik (2015; Orfanakis et al., 2021).
Figure 7 presents representative multichannel traces and the averaged waveform in the interval from 20 to 24 µs with a prominent bipolar arrival near 21.5 µs. Timing is consistent across channels within the sampling interval of 20 ns, and amplitudes remain stable without baseline drift. No saturation is observed, which confirms adequate headroom with the chosen gain distribution. Only two channels exhibit signals with significant amplitude, consistent with the experimental geometry. The spherical absorber acts as a point source emitting an omnidirectional pressure wave. Channels along the direct acoustic path receive the maximum pressure amplitude, while laterally offset channels receive only a fraction of the wavefront, resulting in lower amplitudes toward the outer channels. The experiment records 300 acquisitions and applies sliding window averaging. An arithmetic mean is calculated based on the 300 measured values. During ongoing measurements, older measurements are replaced by newer ones, a process known as sliding window averaging. For N independent and time-aligned acquisitions, the SNR increases by √N. The signal-to-noise ratio is defined as the ratio of the peak-to-peak amplitude of the bipolar photoacoustic signal to the standard deviation of the noise measured in the interval from 5 to 20 µs. This window is free of both the electromagnetic pulse and the acoustic signal, making it well suited for noise estimation. For N equals 300, the theoretical improvement is 17.3. The averaged waveform exhibits a clear pulse shape with reduced random noise compared with single shot traces and, with that, provides a clean estimate of the photoacoustic response of the spherical absorber.
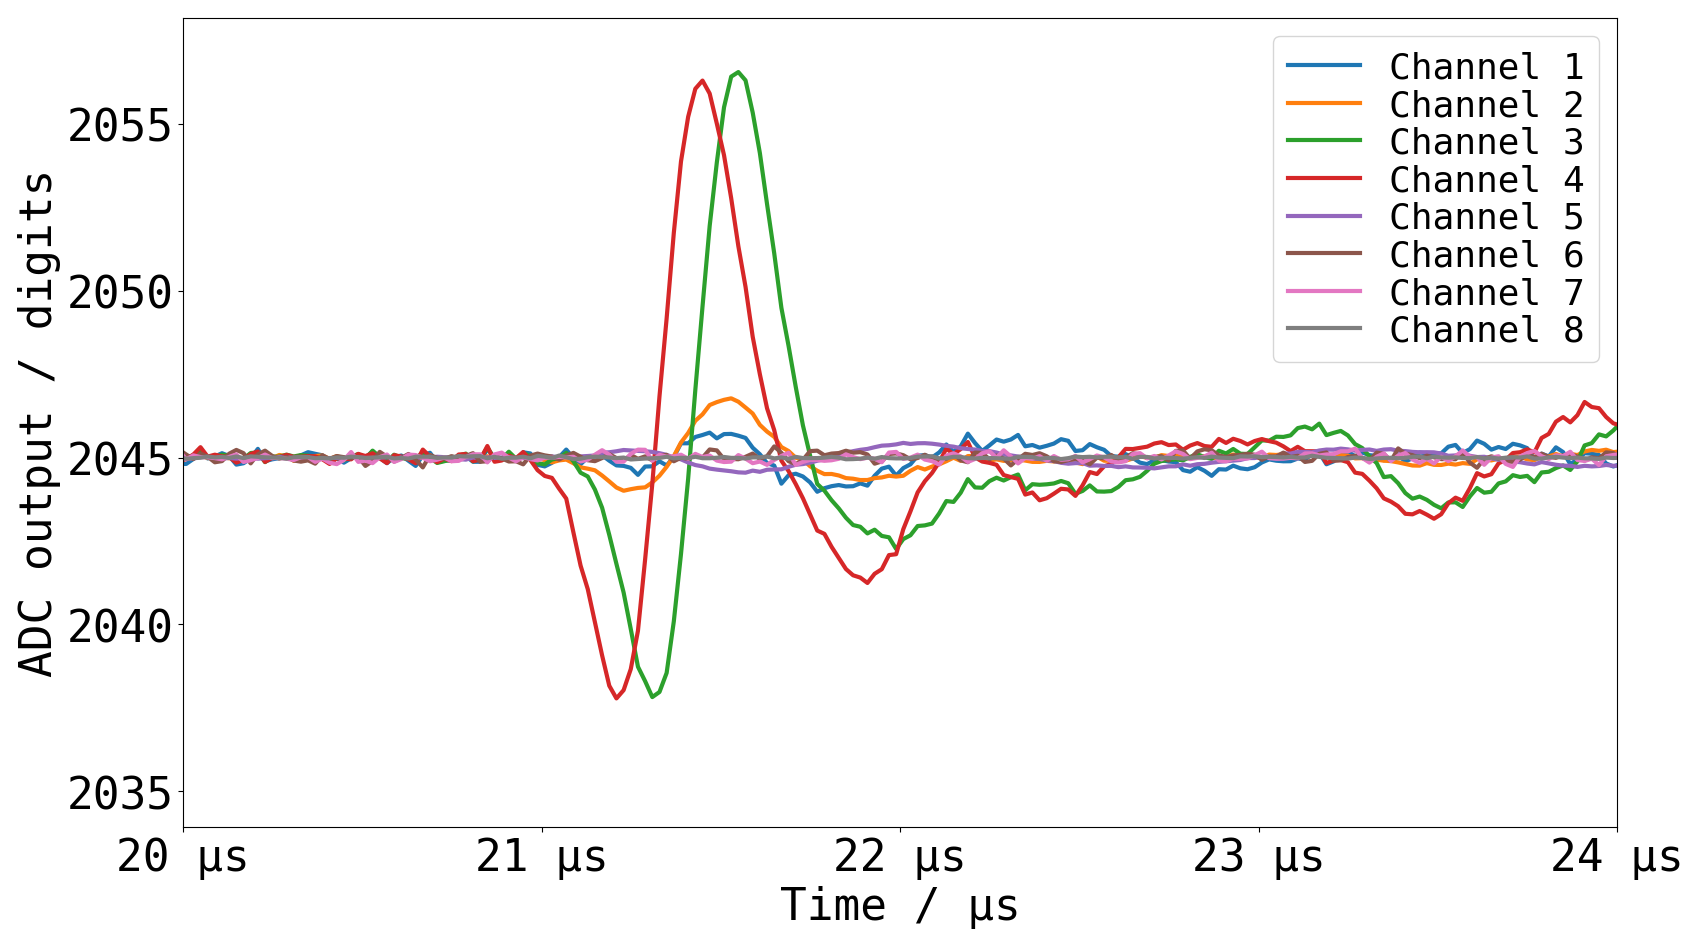
Figure 7PAI measurement averaged over 300 acquisitions. A 2 MHz ultrasound transducer records multichannel signals after excitation by a laser pulse with 50 µJ energy and 1.5 ns duration. Traces show AFE output for eight channels in the window 20 to 24 µs with a prominent photoacoustic peak near 21.5 µs. The two central channels receive the highest acoustic pressure as they are positioned along the direct acoustic path to the spherical point source, resulting in the largest signal amplitudes. The data indicate stable timing and amplitude across channels, with no baseline drift.
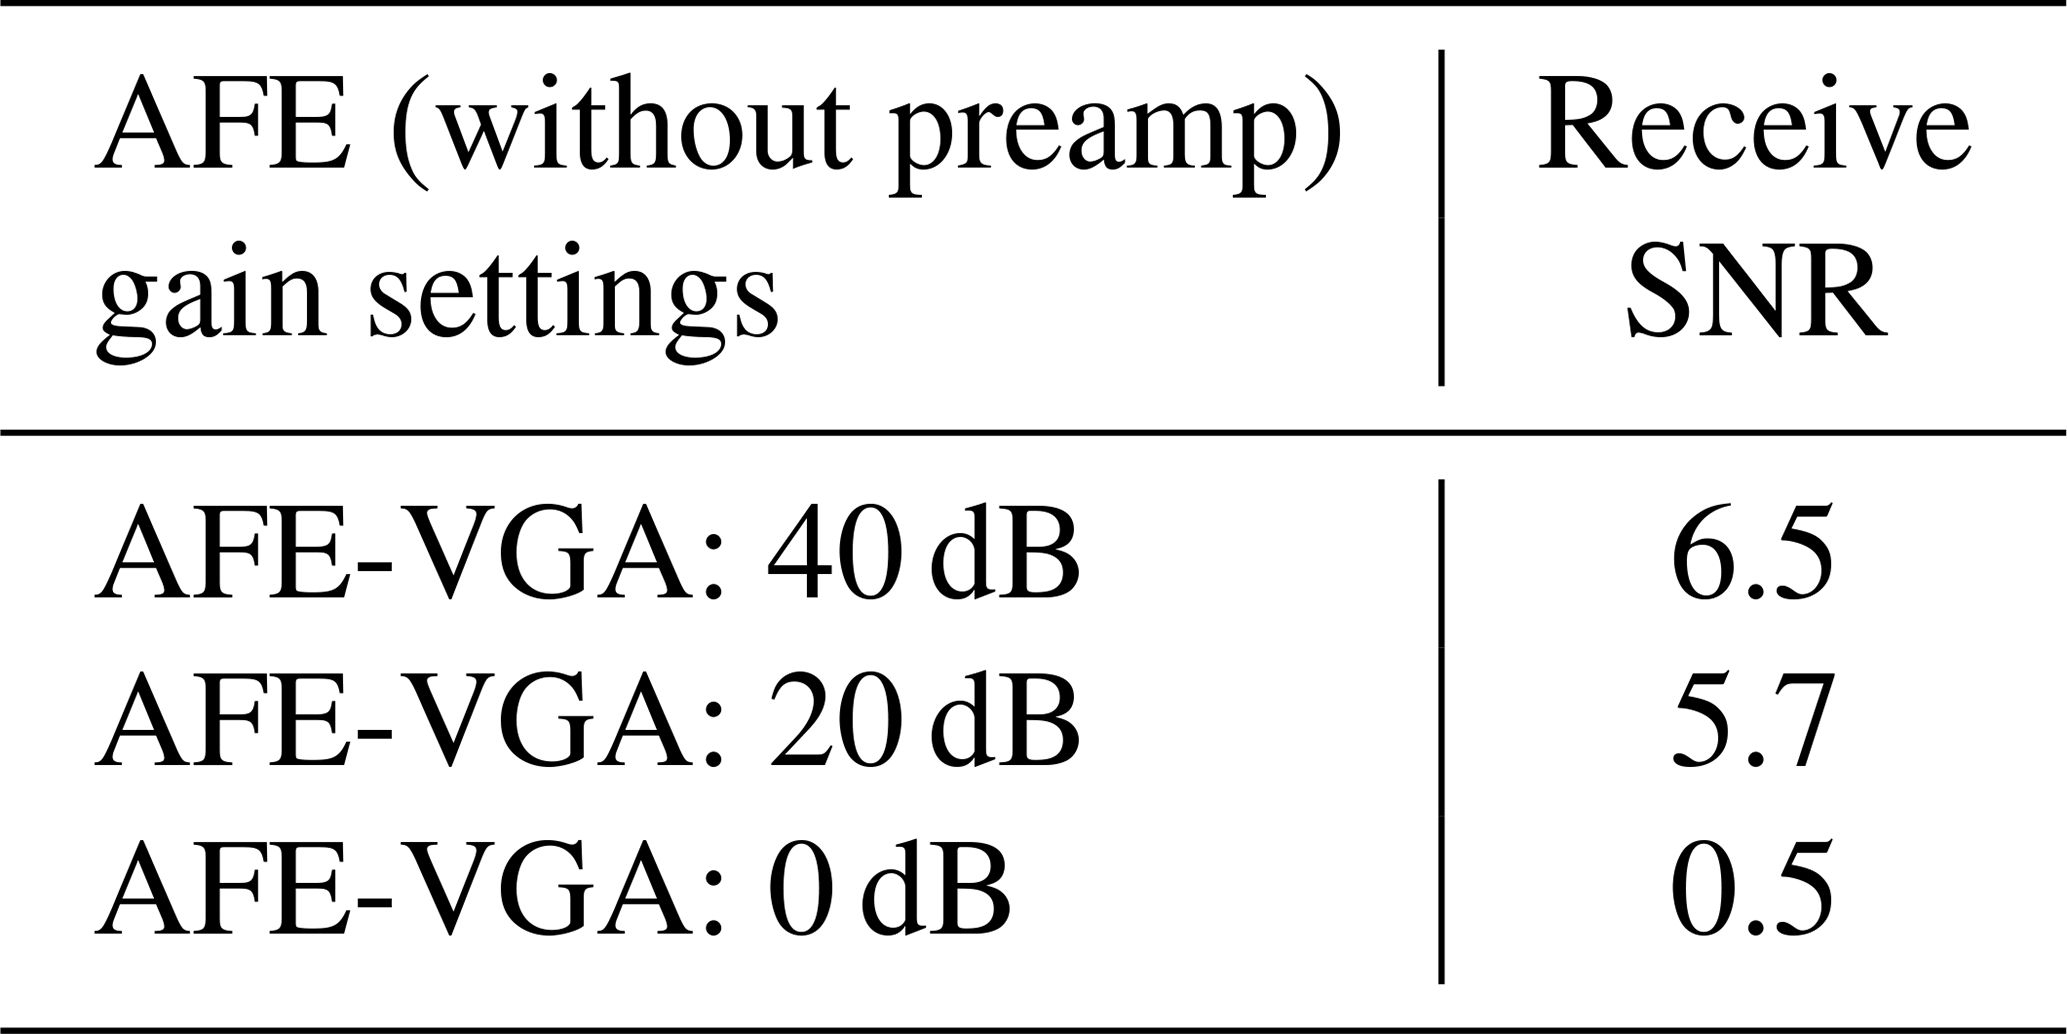
In addition to the concept evaluation, a supplementary measurement is presented that leverages the capability of disconnecting the preamplifier and enabling extended analysis of gain distribution and its effect on SNR. Each condition was averaged over 300 acquisitions, and the total variable gain was kept at 40 dB, split between the preamplifier and the AFE. Table 1 summarizes configurations with preamplifier, and Table 2 summarizes configurations without preamplifier. The highest SNR is a factor of 6.5 without the preamplifier at 40 dB AFE, whereas the best result with the preamplifier is 3.4. Across all settings, the SNR with the preamplifier was lower than without the preamplifier. This indicates that the preamplifier is not optimally configured for this transducer and AFE. The obtained results demonstrate an SNR comparable to that of Agano and Awazu (2020), indicating a methodologically sound approach to circuit design. This enables further optimization through targeted improvement of the subcomponents.
Table 1SNR of the receiver compared to the gain when the preamplifier is connected (300 averages and total gain fixed at 40 dB).
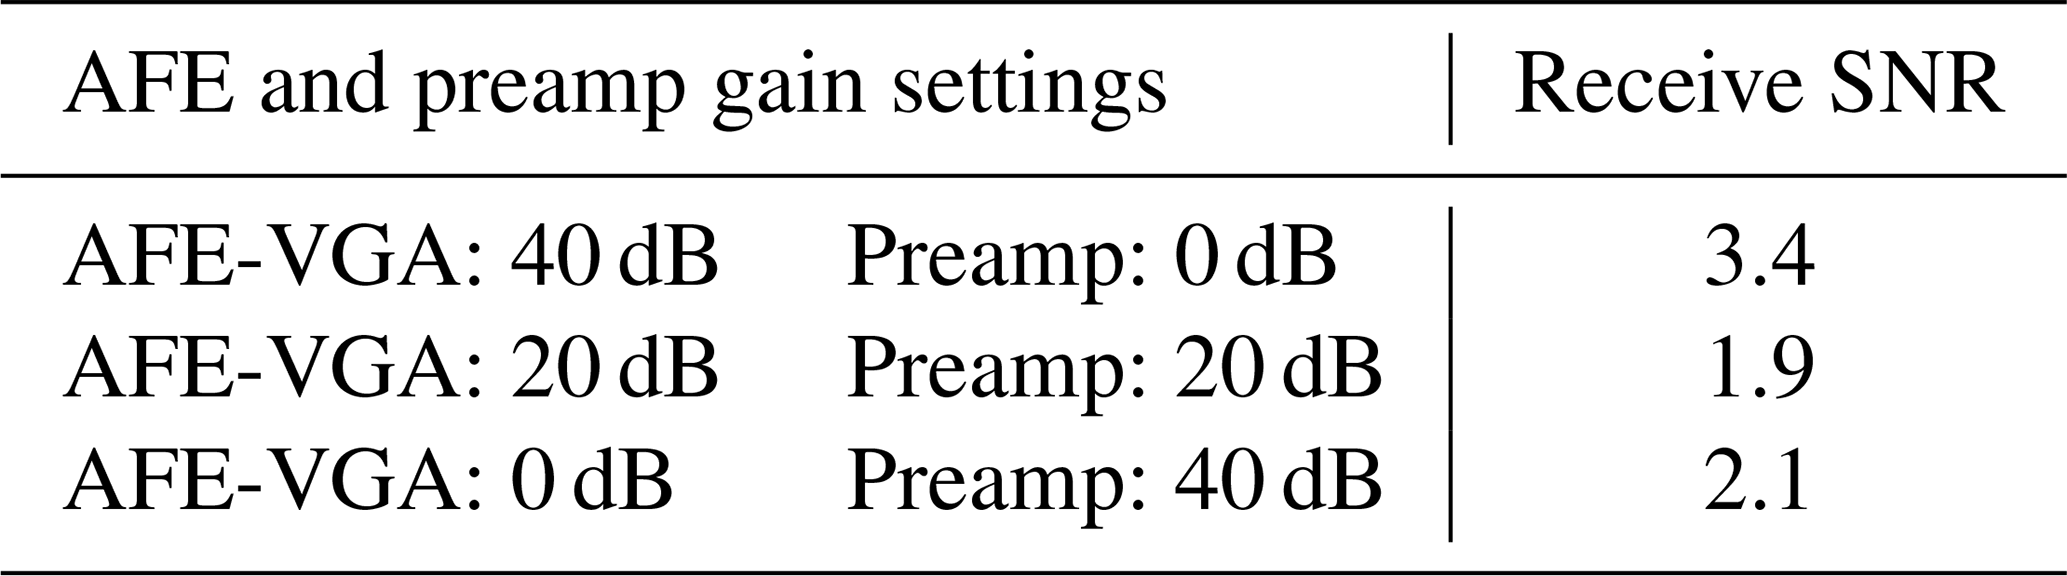
Table 2SNR of the receiver compared to amplification without a connected preamplifier (300 averages).
An eight-channel evaluation platform for high-frame-rate data acquisition in ultrasound and photoacoustic imaging is presented. The system combines a programmable low-noise variable gain preamplifier (AD8334), the AFE5805 providing low-noise amplification, low-pass filtering, and 12-bit analog-to-digital conversion, and an AMD Zynq SoC that captures up to 50 MSPS per channel. The ADC data are read via LVDS by the FPGA fabric, buffered via DMA, and transmitted as UDP packets over Ethernet to a host for off-board processing and image reconstruction. The high throughput enables extensive frame averaging to improve the signal-to-noise ratio, which is crucial for photoacoustic imaging based on pulsed laser diodes, with lower pulse energies. A frame rate of 540 frames per second across eight channels is reached, which exceeds the state of the art of normal USG or PAI with solid-state laser. An SNR of 6.5 without the preamplifier and 3.4 with the preamplifier were measured. A 2 MHz PMUT model coupled to the AD8334 quantifies the receive-chain transfer characteristics and noise contributions in a simulation. The platform is suitable for high-frame-rate measurements in photoacoustics and sonography, and provides a robust basis for advanced filtering, beamforming, and real-time reconstruction.
In order to expand the capabilities of the current platform, a modular circuit board is planned that will enable targeted noise and performance analysis through the flexible substitution of preamplifiers and front-end integrated circuits. Standardized analog interfaces and mezzanine plug-in modules will be employed to facilitate rapid comparison of gain, noise figure, bandwidth, and linearity across device families. On the software side, the adoption of PetaLinux and the proposed software architecture is expected to improve reliability and increase sustained data rates. To sustain gigabit-level throughput to the host, an optimized high-speed interface such as USB 3.x will be integrated together with DMA-based streaming, ring buffers, and zero-copy transfer paths. In addition, a sliding window averaging algorithm will be implemented in the FPGA to significantly reduce the data rate into and out of the processor. To support diverse experimental conditions, multiple programmable trigger inputs and outputs will be added for tight synchronization with a range of light sources and external systems. A systematic evaluation with different optical sources will be conducted to quantify the effects on signal amplitude, spectral content, signal-to-noise ratio, and averaging requirements. Based on these results, the analog receive chain and FPGA processing will be refined to support real-time photoacoustic and ultrasound imaging.
The underlying software code is not publicly available and can be requested from the authors if required.
The underlying measurement data are not publicly available and can be requested from the authors if required.
SK wrote the original draft and conducted the measurement experiments. SK developed the electronics with support from CW. FG built the software for controlling the board and the graphical user interface. CS was responsible for the design of the PMUT and the simulation. JW and BB developed the concept for the imaging method and were responsible for obtaining funding. All authors contributed to the review and editing of the final article.
The contact author has declared that none of the authors has any competing interests.
Publisher's note: Copernicus Publications remains neutral with regard to jurisdictional claims made in the text, published maps, institutional affiliations, or any other geographical representation in this paper. The authors bear the ultimate responsibility for providing appropriate place names. Views expressed in the text are those of the authors and do not necessarily reflect the views of the publisher.
The authors want to thank the laser, electronics, assembly, and packaging laboratory at the Fraunhofer IPM for their support.
This work was supported by the Fraunhofer internal programs under grant no. PREPARE 40-05295.
This paper was edited by Andreas Schütze and reviewed by two anonymous referees.
Agano, T. and Awazu, K.: Effect of Amplifier Gain on Photoacoustic SNR (Signal-to-Noise Ratio) in an LED-based Photoacoustic Imaging System, Laser Therapy, 29, 77–85, https://doi.org/10.5978/islsm.20-OR-09, 2020.
Analog Devices, Inc.: AD8334 Quad Low Noise Variable Gain Amplifier for Ultrasound, Datasheet, https://www.analog.com/en/products/ad8334.html (last access: 17 October 2025), 2025.
Beard, P.: Biomedical photoacoustic imaging, Interface Focus, 1, 602–631, https://doi.org/10.1098/rsfs.2011.0028, 2011
Cao, R., Zhao, J., Li, L., Du, L., Zhang, Y., Luo, Y., Jiang, L., Davis, S., Zhou, Q., de la Zerda, A., and Wang, L. V.: Optical-resolution photoacoustic microscopy with a needle-shaped beam, Nat. Photonics, https://doi.org/10.1038/s41566-022-01112-w, 2022.
Cox, B., Laufer, J. G., Arridge, S. R., and Beard, P. C.: Quantitative spectroscopic photoacoustic imaging: a review, J. Biomed. Opt., 17, 061202, https://doi.org/10.1117/1.JBO.17.6.061202, 2012.
Daoudi, K., van den Berg, P. J., Rabot, O., Edden, Y., Steenbergen, W., and Deliolanis, N. C.: Handheld probe integrating laser diode and ultrasound transducer array for ultrasound/photoacoustic dual modality imaging, Opt. Express, 22, 26365–26374, https://doi.org/10.1364/OE.22.026365, 2014.
Enz, C. C. and Temes, G. C.: Circuit techniques for reducing the effects of op-amp imperfections: autozeroing, correlated double sampling, and chopper stabilization, P. IEEE, 84, 1584–1614, https://doi.org/10.1109/5.542410, 1996.
Jacques, S. L.: Optical properties of biological tissues: a review, Phys. Med. Biol., 58, R37–R61, https://doi.org/10.1088/0031-9155/58/11/R37, 2013.
Manohar, S. and Razansky, D.: Photoacoustics: a historical review, Photoacoustics, 4, 137–142, https://doi.org/10.1364/AOP.8.000586, 2016.
Nyquist, H.: Thermal agitation of electric charge in conductors, Phys. Rev., 32, 110–113, https://doi.org/10.1103/PhysRev.32.110, 1928.
Orfanakis, M., Tserevelakis, G., and Zacharakis, G. J.: A Cost-Efficient Multiwavelength LED-Based System for Quantitative Photoacoustic Measurements, MDPI Sensors, 21, 1–14, https://doi.org/10.3390/s21144888, 2021.
Riksen, J. J. M., Nikolaev, A. V., and van Soest, G.: Photoacoustic imaging on its way toward clinical utility: a tutorial review focusing on practical application in medicine, J. Biomed. Opt., 28, 121205, https://doi.org/10.1117/1.JBO.28.12.121205, 2023.
Stoeckel, C., Mulay, S., Meinel, K., Bankwitz, J., Seiler, J., and Ullmann, D.: Technology for Piezoelectric Micromachined Ultrasonic Transducers with Adaptive Channel Geometry and Chip Size, UFFC-JS, Taipei, Taiwan, 22–26 September 2024, 4 pp., https://doi.org/10.1109/UFFC-JS60046.2024.10793711, 2024.
Szabo, T. L.: Diagnostic Ultrasound Imaging: Inside Out, Academic Press, ISBN 978-0-12-396487-8, https://doi.org/10.1016/C2011-0-07261-7, 2014.
Texas Instruments: AFE5805 Ultrasound Analog Front End, Datasheet, https://www.ti.com/product/AFE5805 (last access: 17 October 2025), 2025.
Turin, G. L.: An introduction to matched filters, IRE T. Inform. Theor., 6, 311–329, https://doi.org/10.1109/TIT.1960.1057571, 1960.
Upputuri, S. and Pramanik, M.: Fast photoacoustic imaging systems using pulsed laser diodes: a review, Biomed. Eng. Lett., 5, 241–251, https://doi.org/10.1007/s13534-018-0060-9, 2015.
Xu, M. and Wang, L. V.: Photoacoustic imaging in biomedicine, Rev. Sci. Instrum., 77, 1–22, https://doi.org/10.1063/1.2195024, 2006.
Walden, R. H.: Analog-to-digital converter survey and analysis, IEEE J. Sel. Area. Comm., 17, 539–550, https://doi.org/10.1109/49.761034, 1999.
Wang, L. V. and Hu, S.: Photoacoustic tomography: In vivo imaging from organelles to organs, Science, 335, 1458–1462, https://doi.org/10.1126/science.1216210, 2012.
Wells, P. N. T.: Ultrasonic imaging of the human body, Rep. Prog. Phys., 62, 671–722, https://doi.org/10.1088/0034-4885/62/5/201, 1999.
Yao, J. and Wang, L. V..: Sensitivity of photoacoustic microscopy, Photoacoustics, 2, 87–101, https://doi.org/10.1016/j.pacs.2014.04.002, 2014.
- Abstract
- Introduction
- Working principle of photoacoustic imaging
- Electronic front-end design and simulation of the photoacoustic receive path
- Realization of the platform
- Concept evaluation
- Summary
- Outlook
- Code availability
- Data availability
- Author contributions
- Competing interests
- Disclaimer
- Acknowledgements
- Financial support
- Review statement
- References
- Abstract
- Introduction
- Working principle of photoacoustic imaging
- Electronic front-end design and simulation of the photoacoustic receive path
- Realization of the platform
- Concept evaluation
- Summary
- Outlook
- Code availability
- Data availability
- Author contributions
- Competing interests
- Disclaimer
- Acknowledgements
- Financial support
- Review statement
- References