the Creative Commons Attribution 4.0 License.
the Creative Commons Attribution 4.0 License.
 | 23 Mar 2018
Test method for narrowband F/TDMA-based wireless sensor/actuator networks including radio channel emulation in severe multipath environments
Christoph Cammin
Dmytro Krush
Ralf Heynicke
Gerd Scholl
A test method for narrowband wireless sensor/actuator networks is presented, facilitating affordable and efficient performance and compliance tests prior to the deployment of the wireless communication systems. Commonly used channel models are examined to derive a worst-case test scenario. Employing frequency/time division multiple access (F/TDMA) techniques and protocol synchronization, a new and efficient test method is suggested, where the equipment under test (EUT) is evaluated under the worst-case scenario. A cost-efficient channel emulator is introduced to emulate fading in multipath environments. Also, industrial interferes can be included in the setup. Furthermore, a procedure to test wireless devices with integrated, non-detachable antennas is presented.
- Article
(4886 KB) - Full-text XML
- BibTeX
- EndNote


Industrial applications pose stringent requirements on wireless systems' reliability, maximum delay time, and coexistence behavior. In order to ensure reliable wireless system operation in the field, pretests in well-defined, representative and reproducible environments have to be accomplished. Generally, the equipment under test (EUT) has to comply with a given wireless standard so that conformity and compatibility tests have to be carried out. These tests are impeded by EUTs with a non-detachable, integrated antenna, e.g., a sealed sensor. For these EUTs the test signals have to be electromagnetically coupled into the EUT via radiation. Another issue is the question of how the EUT will behave in the target environment, especially in a multipath environment with fading radio channels. The purpose of a wireless standard is to guarantee system interoperability for subsystems normally produced by different manufacturers. Commonly, wireless standards also include additional rules on the equipment to provide necessary performance requirements. Generally, the performance degradation of a wireless system can have multiple reasons, e.g., time jitter, unstable frequency, frequency offset, modulation impairments, or an insufficient system dynamic range. All these imperfections influence the frame and bit error probabilities (FEP, BEP), which are integral indicators of the system performance. As frequency bands for the operation of wireless devices are limited resources, many wireless communication systems have to share the same frequency bands, especially the ISM (industrial, scientific, medical) frequency band in the 2.4 GHz range, which is one of only a few bands that is available worldwide (Cammin et al., 2016). Coexistence mechanisms are taken into account in most wireless standards, where a competing coexistence environment often degrades the performance of a wireless system in terms of lowered data throughput and/or increased delay time (Cammin et al., 2016). Also, a higher number of communication nodes might lower the performance of each single node. As a consequence the system should be tested under full communication load to be sure that there will be no performance degradation even in worst-case scenarios. The following considerations are predominantly focused on IO-Link Wireless, an emerging wireless communication standard for factory automation (Heynicke et al., 2017; Krush et al., 2016). Without loss of generality the approach can also be applied to other communication systems. Many wireless communication systems utilize time division multiple access (TDMA) schemes for media access, whereby the radio channel is subdivided into time slots which are assigned to the different devices (Heynicke et al., 2017; Krush et al., 2016).
If low cycle times on the order of a few ms are required, a star-shaped topology with numerous (e.g., up to 60, Cammin et al., 2016, or up to 100, Heynicke et al., 2017; Krush et al., 2016) nodes (e.g., sensors, actuators) connected to a single base station (BS) is typically used (Koerber et al., 2007). An illustration is shown in Fig. 1.
Generally, the time-variant and frequency-selective behavior of a radio channel can roughly be described by two parameters, which are coherence time and coherence bandwidth (Koerber et al., 2007; Rappaport, 2001; Shankar, 2012). The first parameter describes an average temporal period during which the radio channel remains approximately constant over time and the latter describes an average frequency spacing, within which the radio channel remains approximately constant over frequency, respectively (Rappaport, 2001; Shankar, 2012). According to the definition in Koerber et al. (2007), in an industrial environment the coherence time typically lies between 2 and 15 ms and the coherence bandwidth between 6 and 60 MHz, respectively (Koerber et al., 2007; Rappaport, 2001). If the coherence bandwidth is significantly larger than the transmission bandwidth of the wireless communication system, the radio channel can be considered frequency-flat and is denoted as a narrowband channel. The radio channel is commonly described by the complex transfer function H(f,t) of time t and frequency f (Rappaport, 2001). Phase or group delay variations of the radio channel can be neglected in the narrowband case (Rappaport, 2001). Without oversimplification the radio channel can thus be emulated by a specific attenuation for a particular time and frequency (Rappaport, 2001). Communication systems like Bluetooth (Rappaport, 2001), IO-Link Wireless (Heynicke et al., 2017; Krush et al., 2016) and several other industrial sensor/actuator networks (Krush et al., 2017) employ narrowband communication, where these assumptions are applicable.
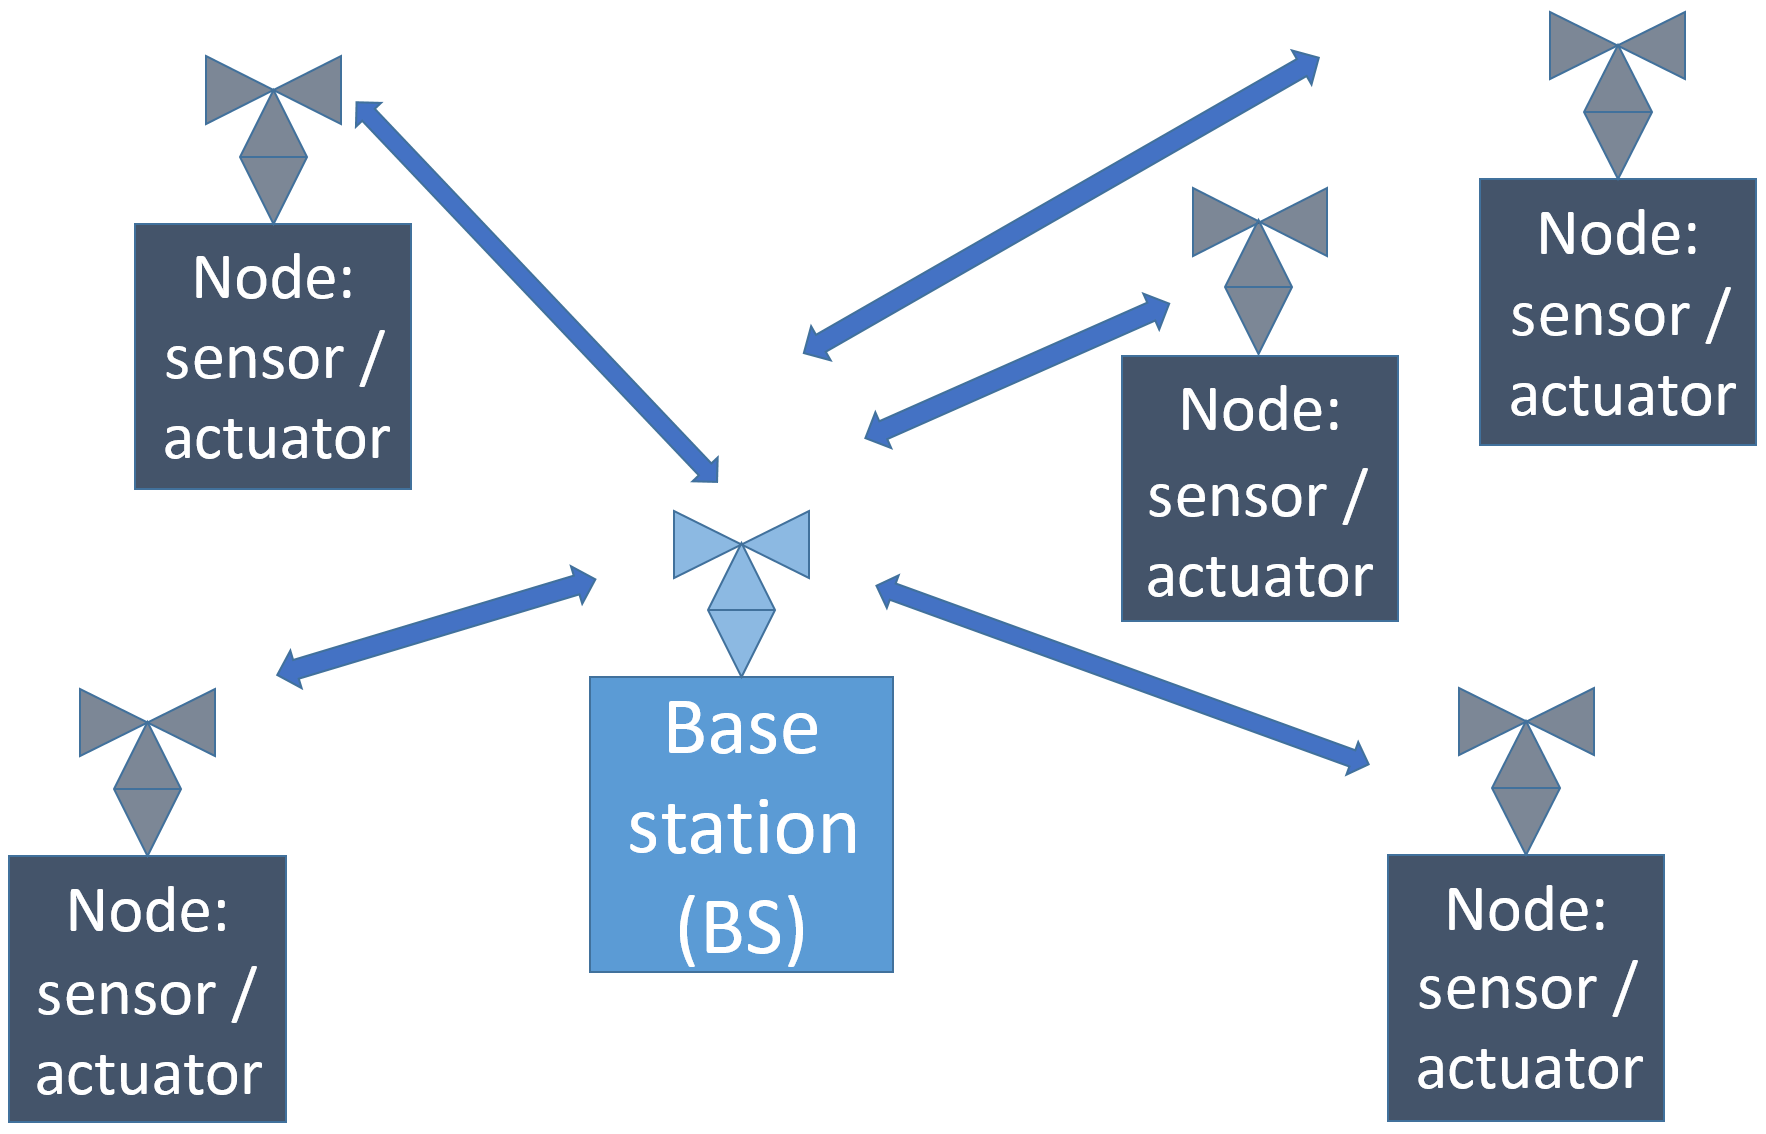
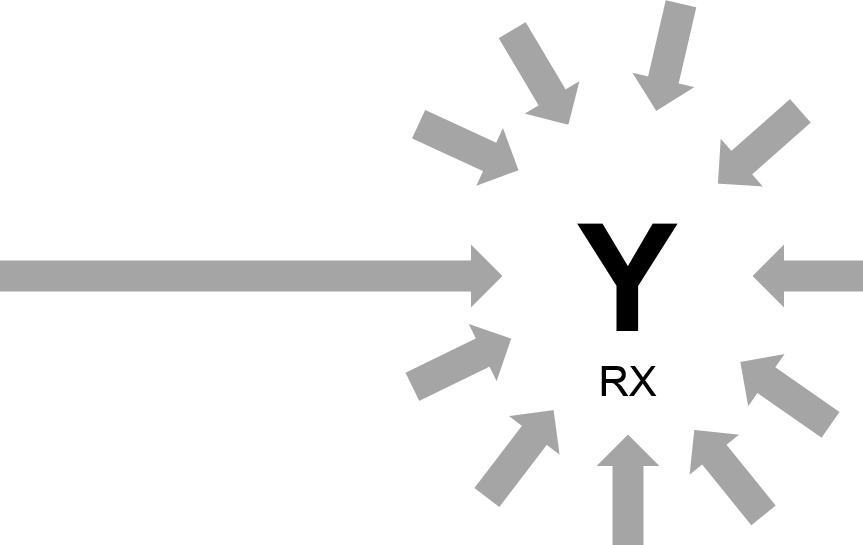
Figure 2Illustration for the physical interpretation of Rician fading: many scattered components (short arrows) are superimposed by a single dominant path (long arrow).
2.1 Radio channel models
Rayleigh, Rice, Nakagami and Weibull channel models are oftenly employed to describe the magnitude or envelope of the signals in terms of small-scale fading for non-line-of-sight (NLOS) or partially obstructed line-of-sight (OLOS) radio channels, respectively (Rappaport, 2001; Shankar, 2012). In addition, the log-normal distribution is commonly used to model large-scale fading and shadowing (Rappaport, 2001; Shankar, 2012), but is also occasionally employed to model small-scale fading, too (Rappaport, 1989; Rappaport and McGillem, 1989; Shankar, 2012).
2.2 Rice distribution
The fundamental scenario which is described by a Rician fading channel is a dominant path with signal power A2 at the receiver (e.g., a line-of-sight component: LOS case) and superimposed multipath components with a mean signal power 2σ2 resulting in a probability density function (PDF) of the signal's amplitude r (Rappaport, 2001):
where I0 is the modified Bessel function of the first kind and zero order. The ratio
is commonly denoted as the Rician K factor (Rappaport, 2001). A sketch to visualize the physical interpretation of a Rician faded receiving signal is shown in Fig. 2, whereby the length of the arrows corresponds to the magnitude of the specific multipath component and the direction represents the phase of that multipath component.
2.3 Rayleigh distribution
As the dominant component in Rician fading vanishes, which is equivalent to a Rician K factor approaching zero (or −∞ dB, respectively) or the limit A→0, the Rician distribution becomes a Rayleigh distribution with (Rappaport, 2001)
There 2σ2 represents the mean signal power level. In this sense Rayleigh fading is the worst-case scenario of Rician fading, because fading dips of the received amplitude occur statistically more frequently for Rayleigh fading than for Rician fading. The fundamental scenario to obtain a Rayleigh fading channel is a non-line-of-sight (NLOS) path between transmitter and receiver. Therewith the signal arrives at the receiver over different paths. The signal components from the reflections exhibit approximately the same amplitude and their phases are uniformly distributed (Rappaport, 2001).
Figure 3 shows a visualization of the physical interpretation. Many (scattered) multipath components arrive at the receiver with approximately the same magnitude (length of the arrows) and approximately uniformly distributed phases (directions of the arrows).
2.4 Nakagami distribution
The Nakagami distribution is also used to model small-scale fading (Shankar, 2012) and fits so-called delay clusters, meaning scenarios where the delay time spreads occur in clusters with roughly the same delay times within a single cluster but significant differences between the clusters (Eluma and Arshad, 2013). In Agrawal et al. (2014) it was pointed out that the Nakagami distribution characterizes deep fading as well. A physical interpretation of the Nakagami distribution is given in Abbas and Sheikh (1996). The PDF of the Nakagami distribution
has two parameters, typically denoted as m and Ω, whereby Γ(…) is the Gamma function and the Nakagami parameter m is limited to (Abbas and Sheikh, 1996). m is also referred to as the shape factor (Eluma and Arshad, 2013) or a fading figure (Abbas and Sheikh, 1996), and represents the severity of fading (Agrawal et al., 2014). The scaling or spreading parameter Ω represents the mean signal power (Abbas and Sheikh, 1996; Eluma and Arshad, 2013).
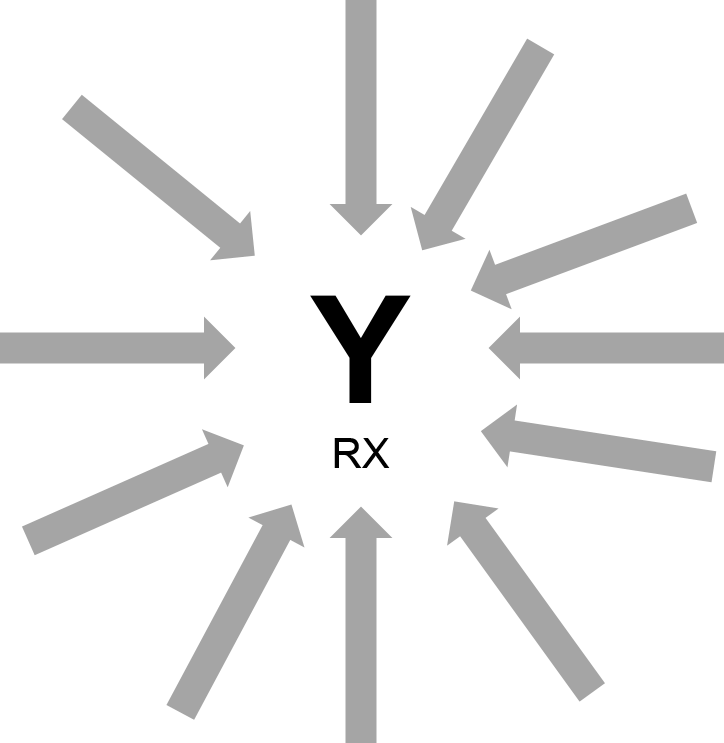
Figure 3Illustration for the physical interpretation of Rayleigh fading: no dominant path exists and many scattered components (arrows) with roughly the same power level (similar length to the arrows) are superimposed.
The Nakagami distribution is an approximate solution of the distribution of the sum of random vectors, even if the magnitudes of the components have random magnitudes (as in contrast to the Rayleigh distribution) (Abbas and Sheikh, 1996; Agrawal et al., 2014; Hashemi, 1993; Riback et al., 2005). The Nakagami distribution is also a good approximation for a Rice distribution (Abbas and Sheikh, 1996; Hashemi, 1993; Riback et al., 2005), and the Nakagami parameter m is directly related to the Rician K factor by (Abbas and Sheikh, 1996)
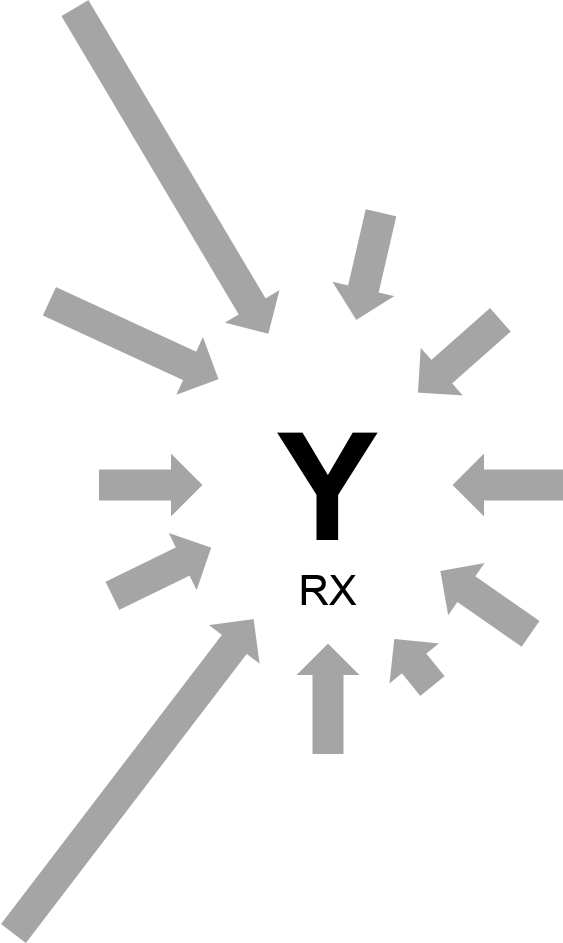
A coarse visualization of the physical interpretation is shown in Fig. 4. Scattered components with a variety of magnitudes are superimposed by a few dominating clusters.
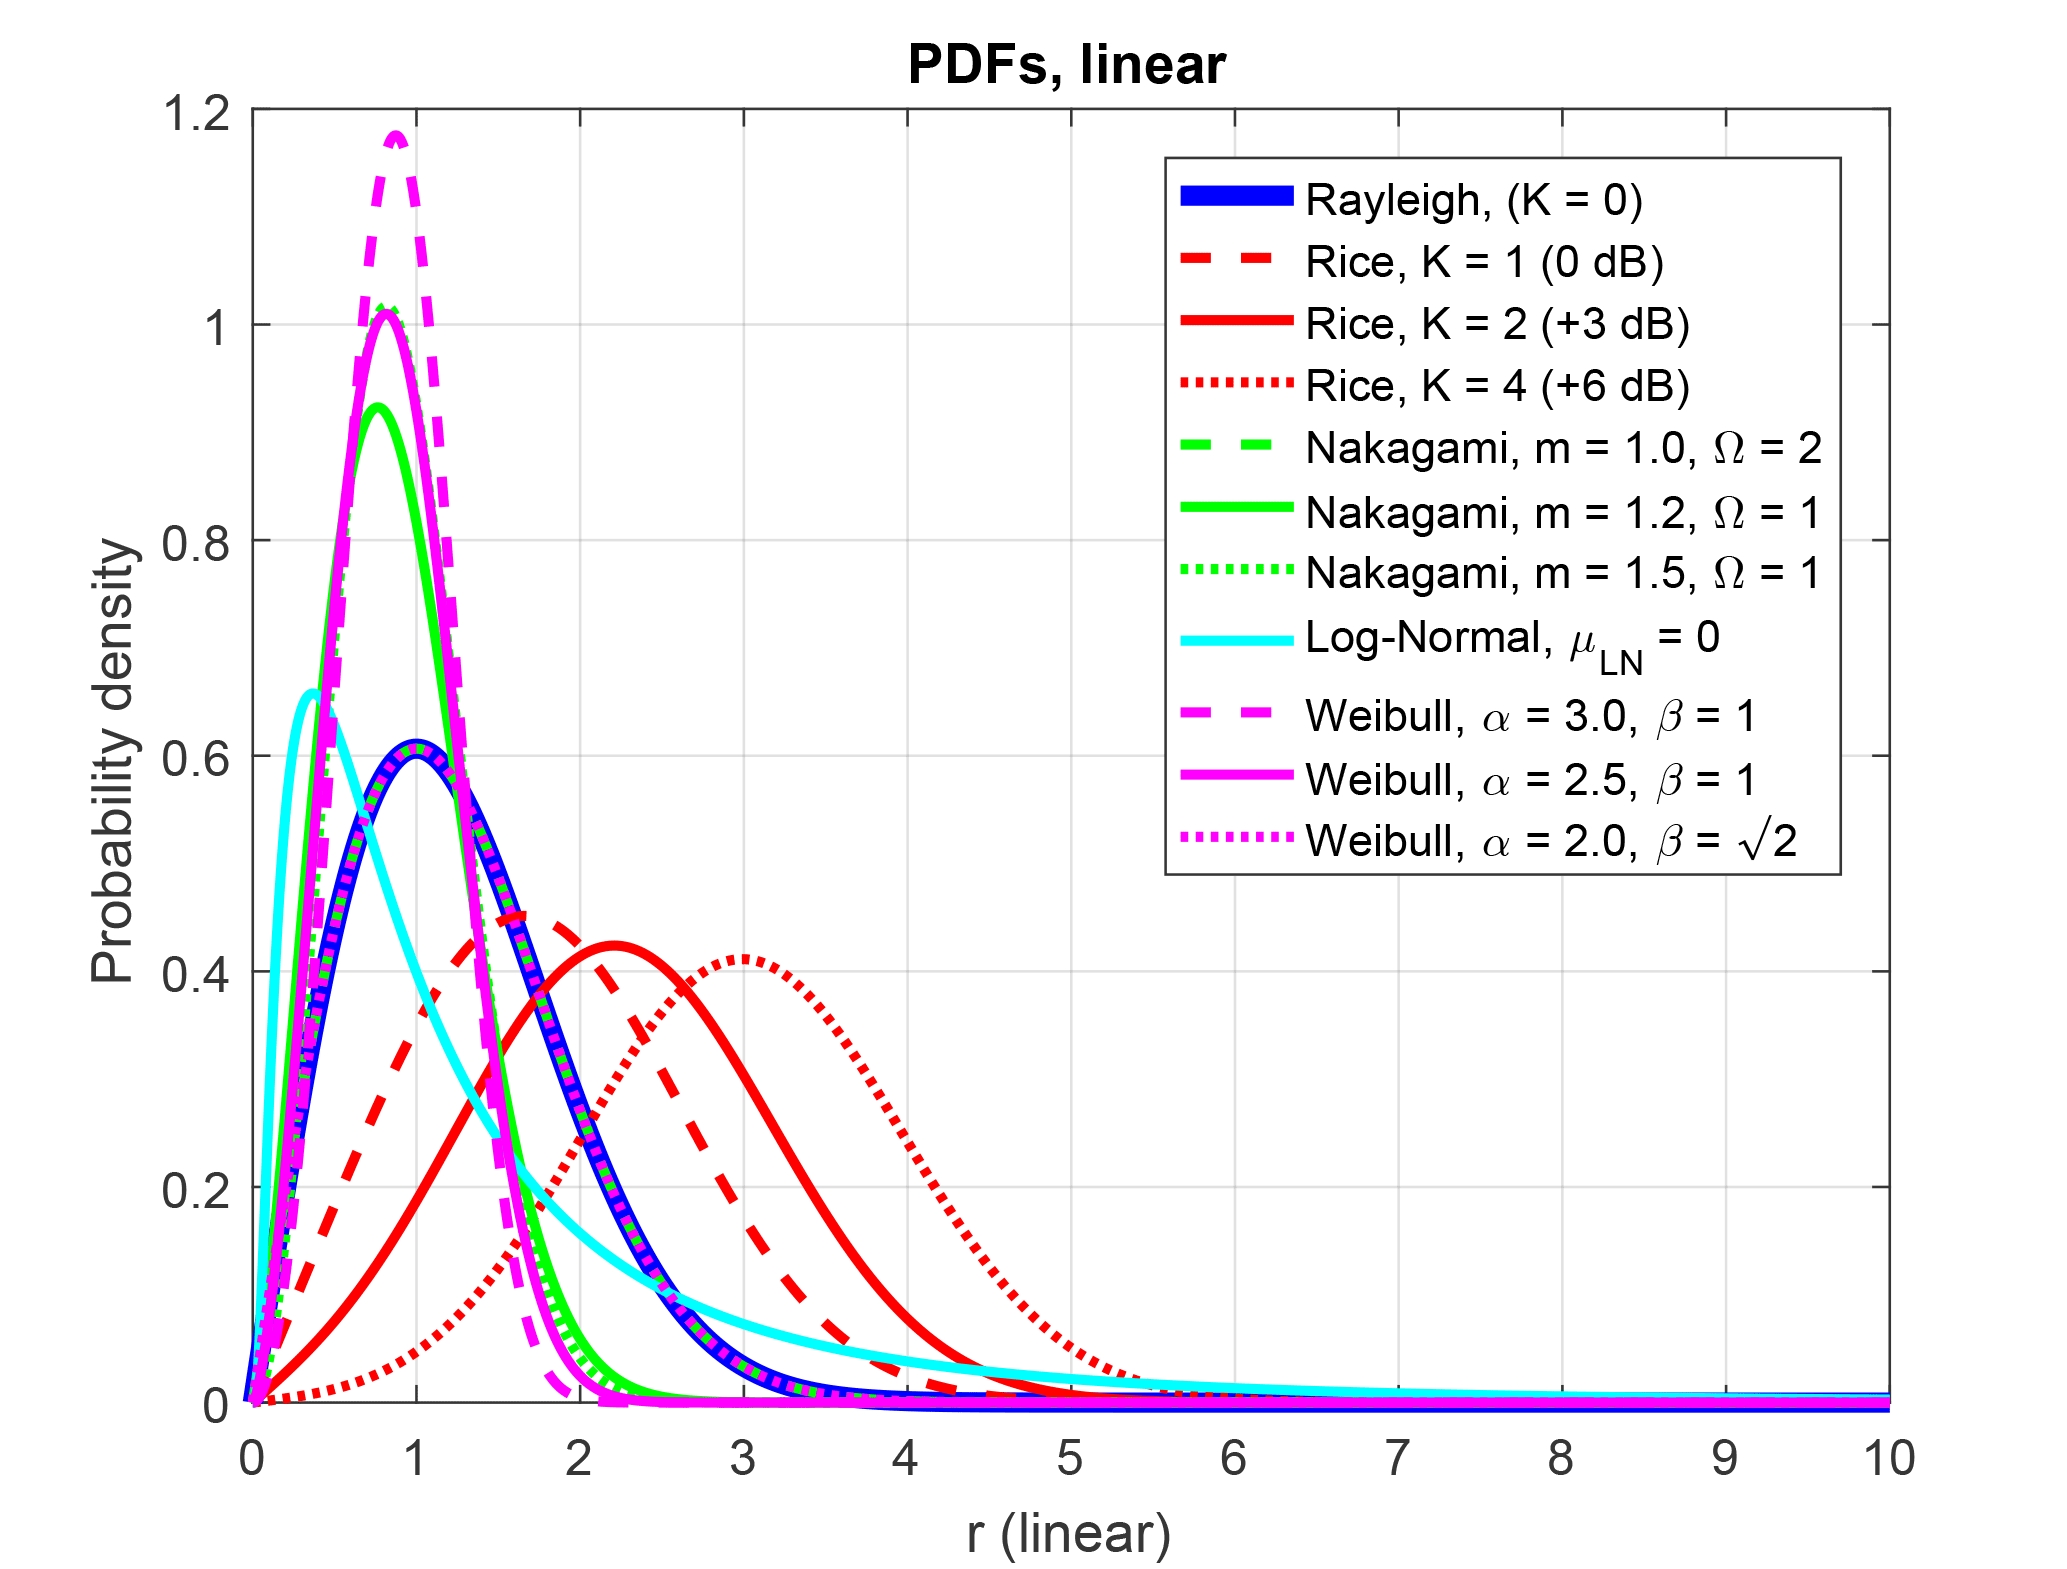
Figure 5PDFs for Rayleigh, Rician, Nakagami and log-normal fading with different parameters. Where applicable, the parameter σ was chosen equal to unity.
The Nakagami distribution can be considered a generalized Rayleigh distribution (Shankar, 2012) and for m=1 both distributions correspond to each other (Abbas and Sheikh, 1996; Shankar, 2012). More accurately, the Nakagami PDF with m=1 has to represent the same mean power to equal a Rayleigh PDF, meaning to fulfill
e.g., with σ=1, , as shown in Figs. 5 and 6. As a further consequence, the scaling factor ωN has no influence on the CDF, if the CDF is normalized to its median.
2.5 Weibull distribution
The Weibull distribution is also used to model small-scale fading, although no physical explanation for the Weibull distribution exists (Hashemi, 1993; Riback et al., 2005). Commonly, the Weibull distribution is expressed with two parameters, a shape parameter α and a scale parameter β (Eluma and Arshad, 2013; Riback et al., 2005; Shankar, 2012), as
Also, a simplified form using just one parameter exists (Shankar, 2012). The Weibull distribution can also be considered a generalized Rayleigh distribution and corresponds to it in the special case α=2. More accurately, the Weibull PDF with α=2 and equals the Rayleigh PDF with σ=1, as shown in Figs. 5 and 6. For the Weibull parameter α>2 less deep fading occurs compared with a Rayleigh model.
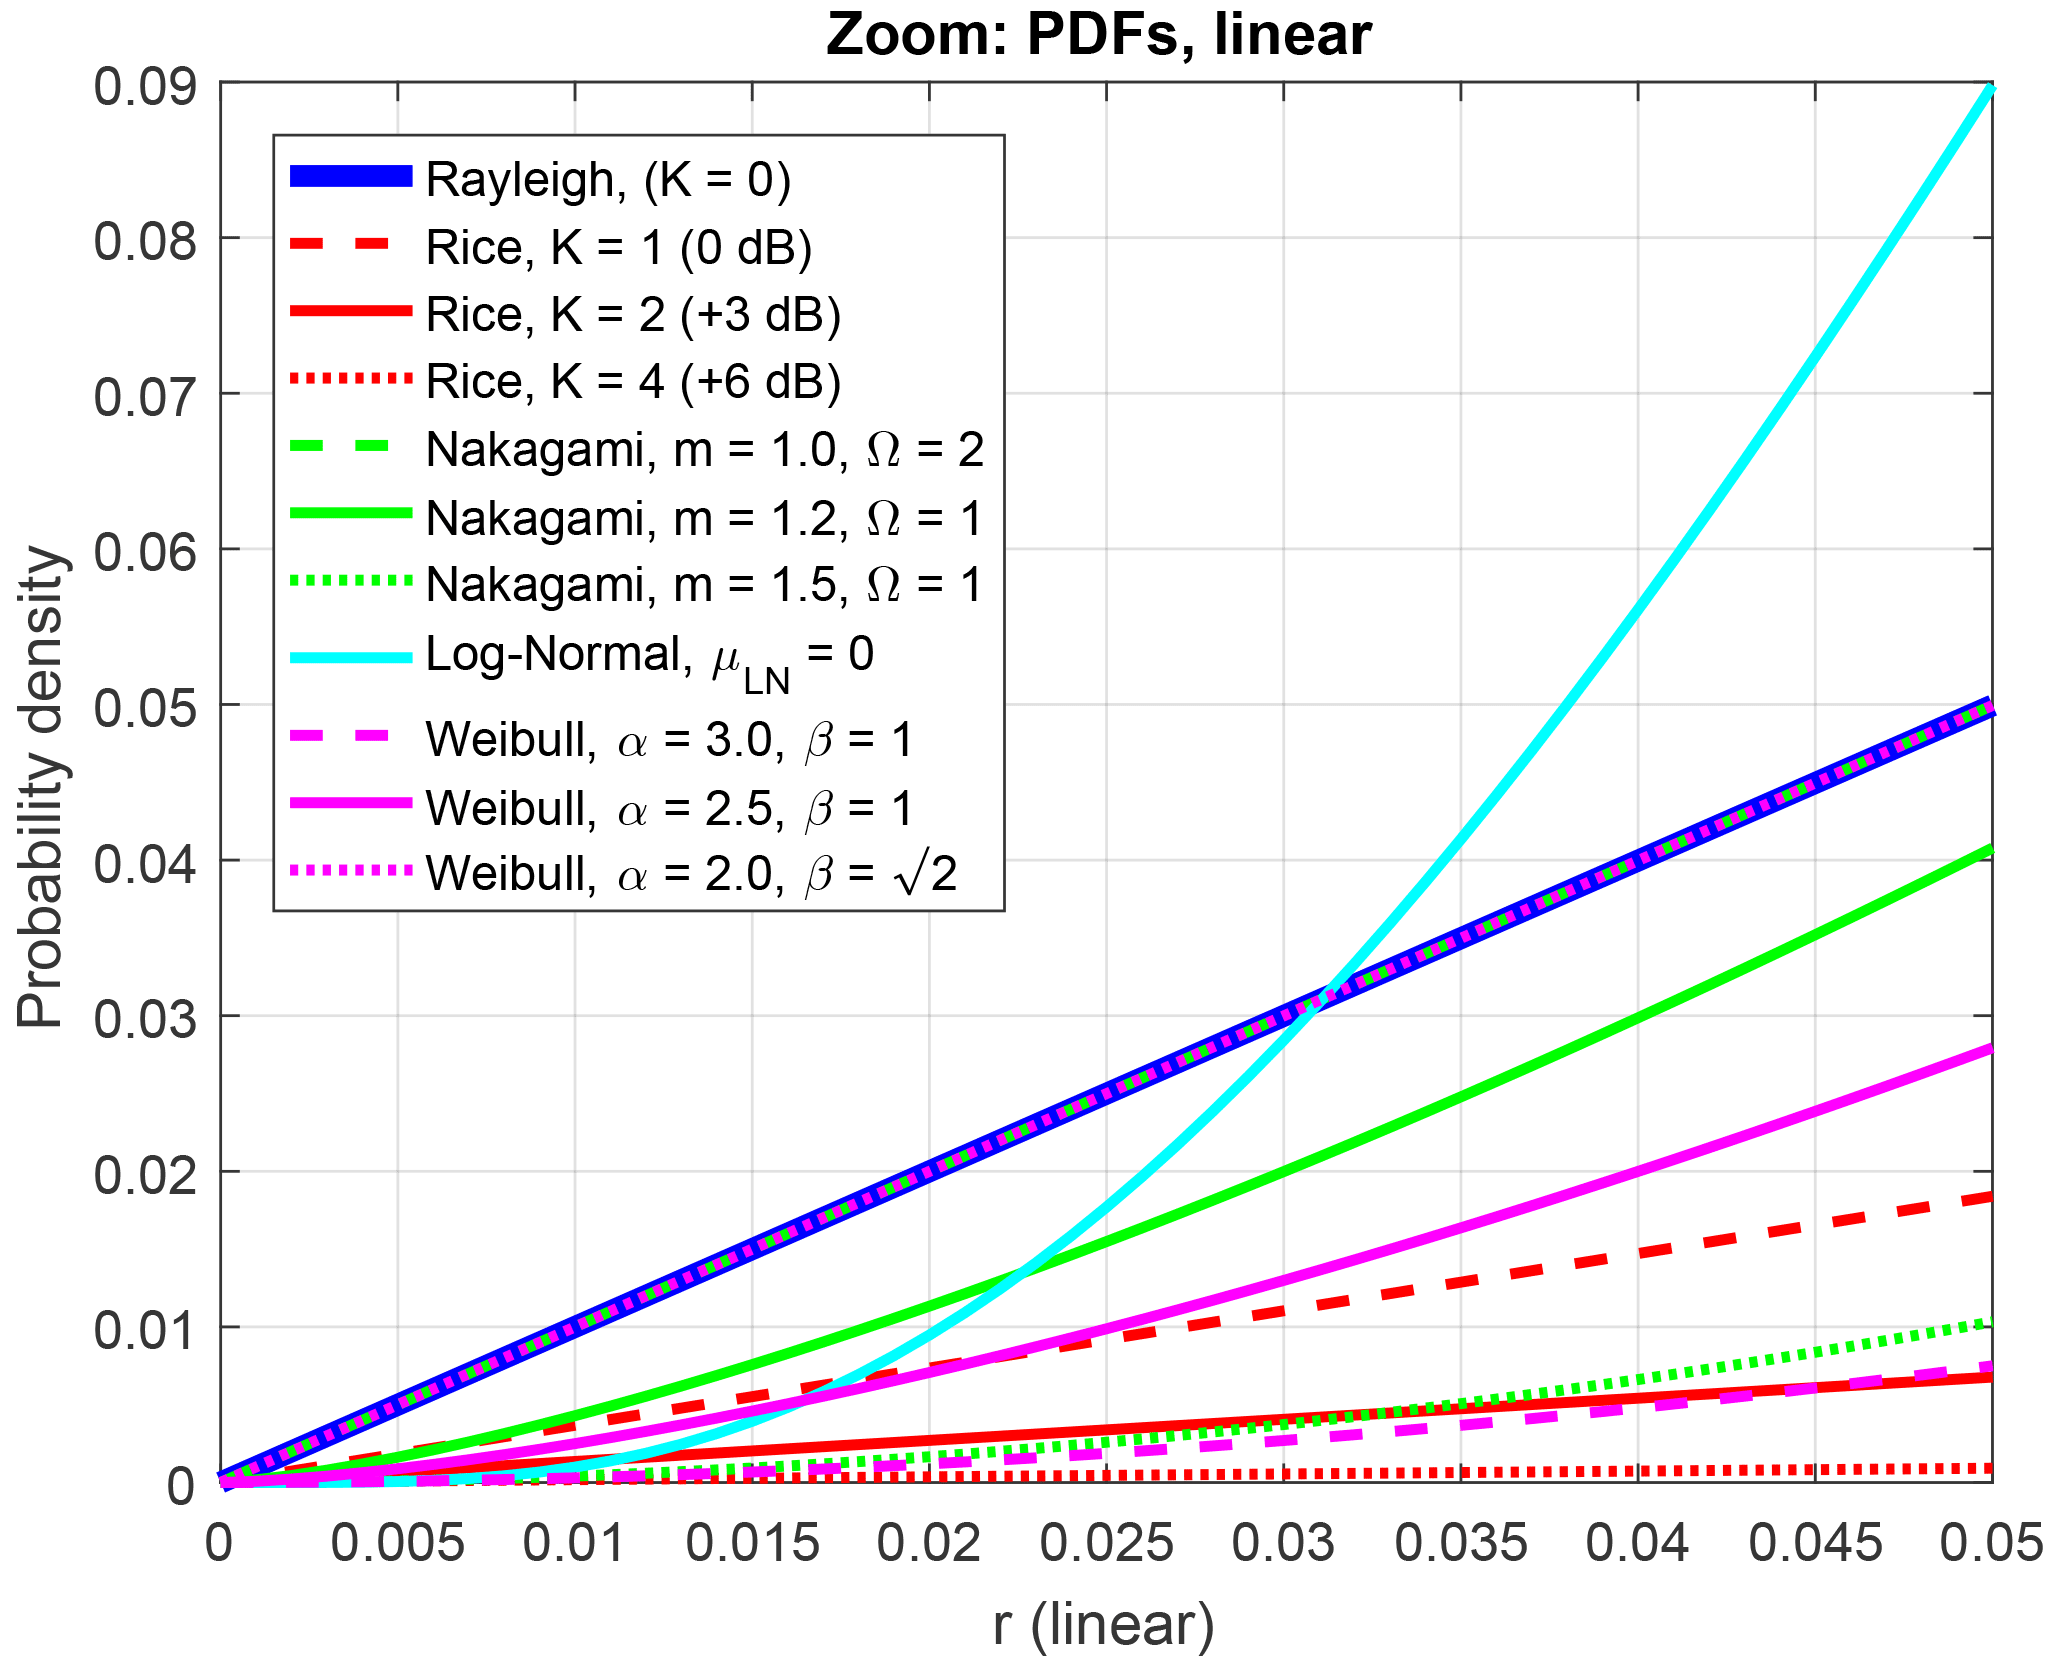
Figure 6PDFs for Rayleigh, Rician, Nakagami and log-normal fading with different parameters for small amplitudes r. Where applicable, the parameter σ was chosen equal to unity.
2.6 Log-normal distribution
The log-normal distribution is commonly used to describe large-scale fading and shadowing (ITU, 2017; Rappaport, 2001; Shankar, 2012). But it is also used to model small-scale fading in factory environments in some cases (Hashemi, 1993; Rappaport, 1989; Rappaport and McGillem, 1989). According to Rappaport and McGillem (1989) and Hashemi (1993), the log-normal distribution fits the measured data well for signal levels below the median. The log-normal distribution
also has two parameters, a shape parameter σ>0 and a scale parameter μLN (Riback et al., 2005).
2.7 Comparison
The PDFs of the distributions considered in this chapter with different parameters are shown in Fig. 5. For the Rayleigh and Rician distribution, the parameter σ was chosen equal to unity.
According to Cox et al. (1984), Stein (1987), Rappaport and McGillem (1989), and Agrawal et al. (2014), the performance of a wireless system during deep fading is predominantly determined by the lower tail region of the distributions. Therefore in Fig. 6 a magnified view of the lower tail region is shown.
The cumulative distribution functions (CDFs) of the previously shown distributions with different parameters are shown in Fig. 7, whereby the graphs are normalized to their median value. For the Rayleigh and Rician distribution the parameter σ was again chosen equal to unity. According to Stein (1987), Rappaport and McGillem (1989), and Agrawal et al. (2014), the probability of deep fading which might cause outage can be derived from this plot. As previously mentioned, the Rayleigh distribution with σ=1 equals the Nakagami distribution with m=1 and Ω=2 and the Weibull distribution with α=2 and .
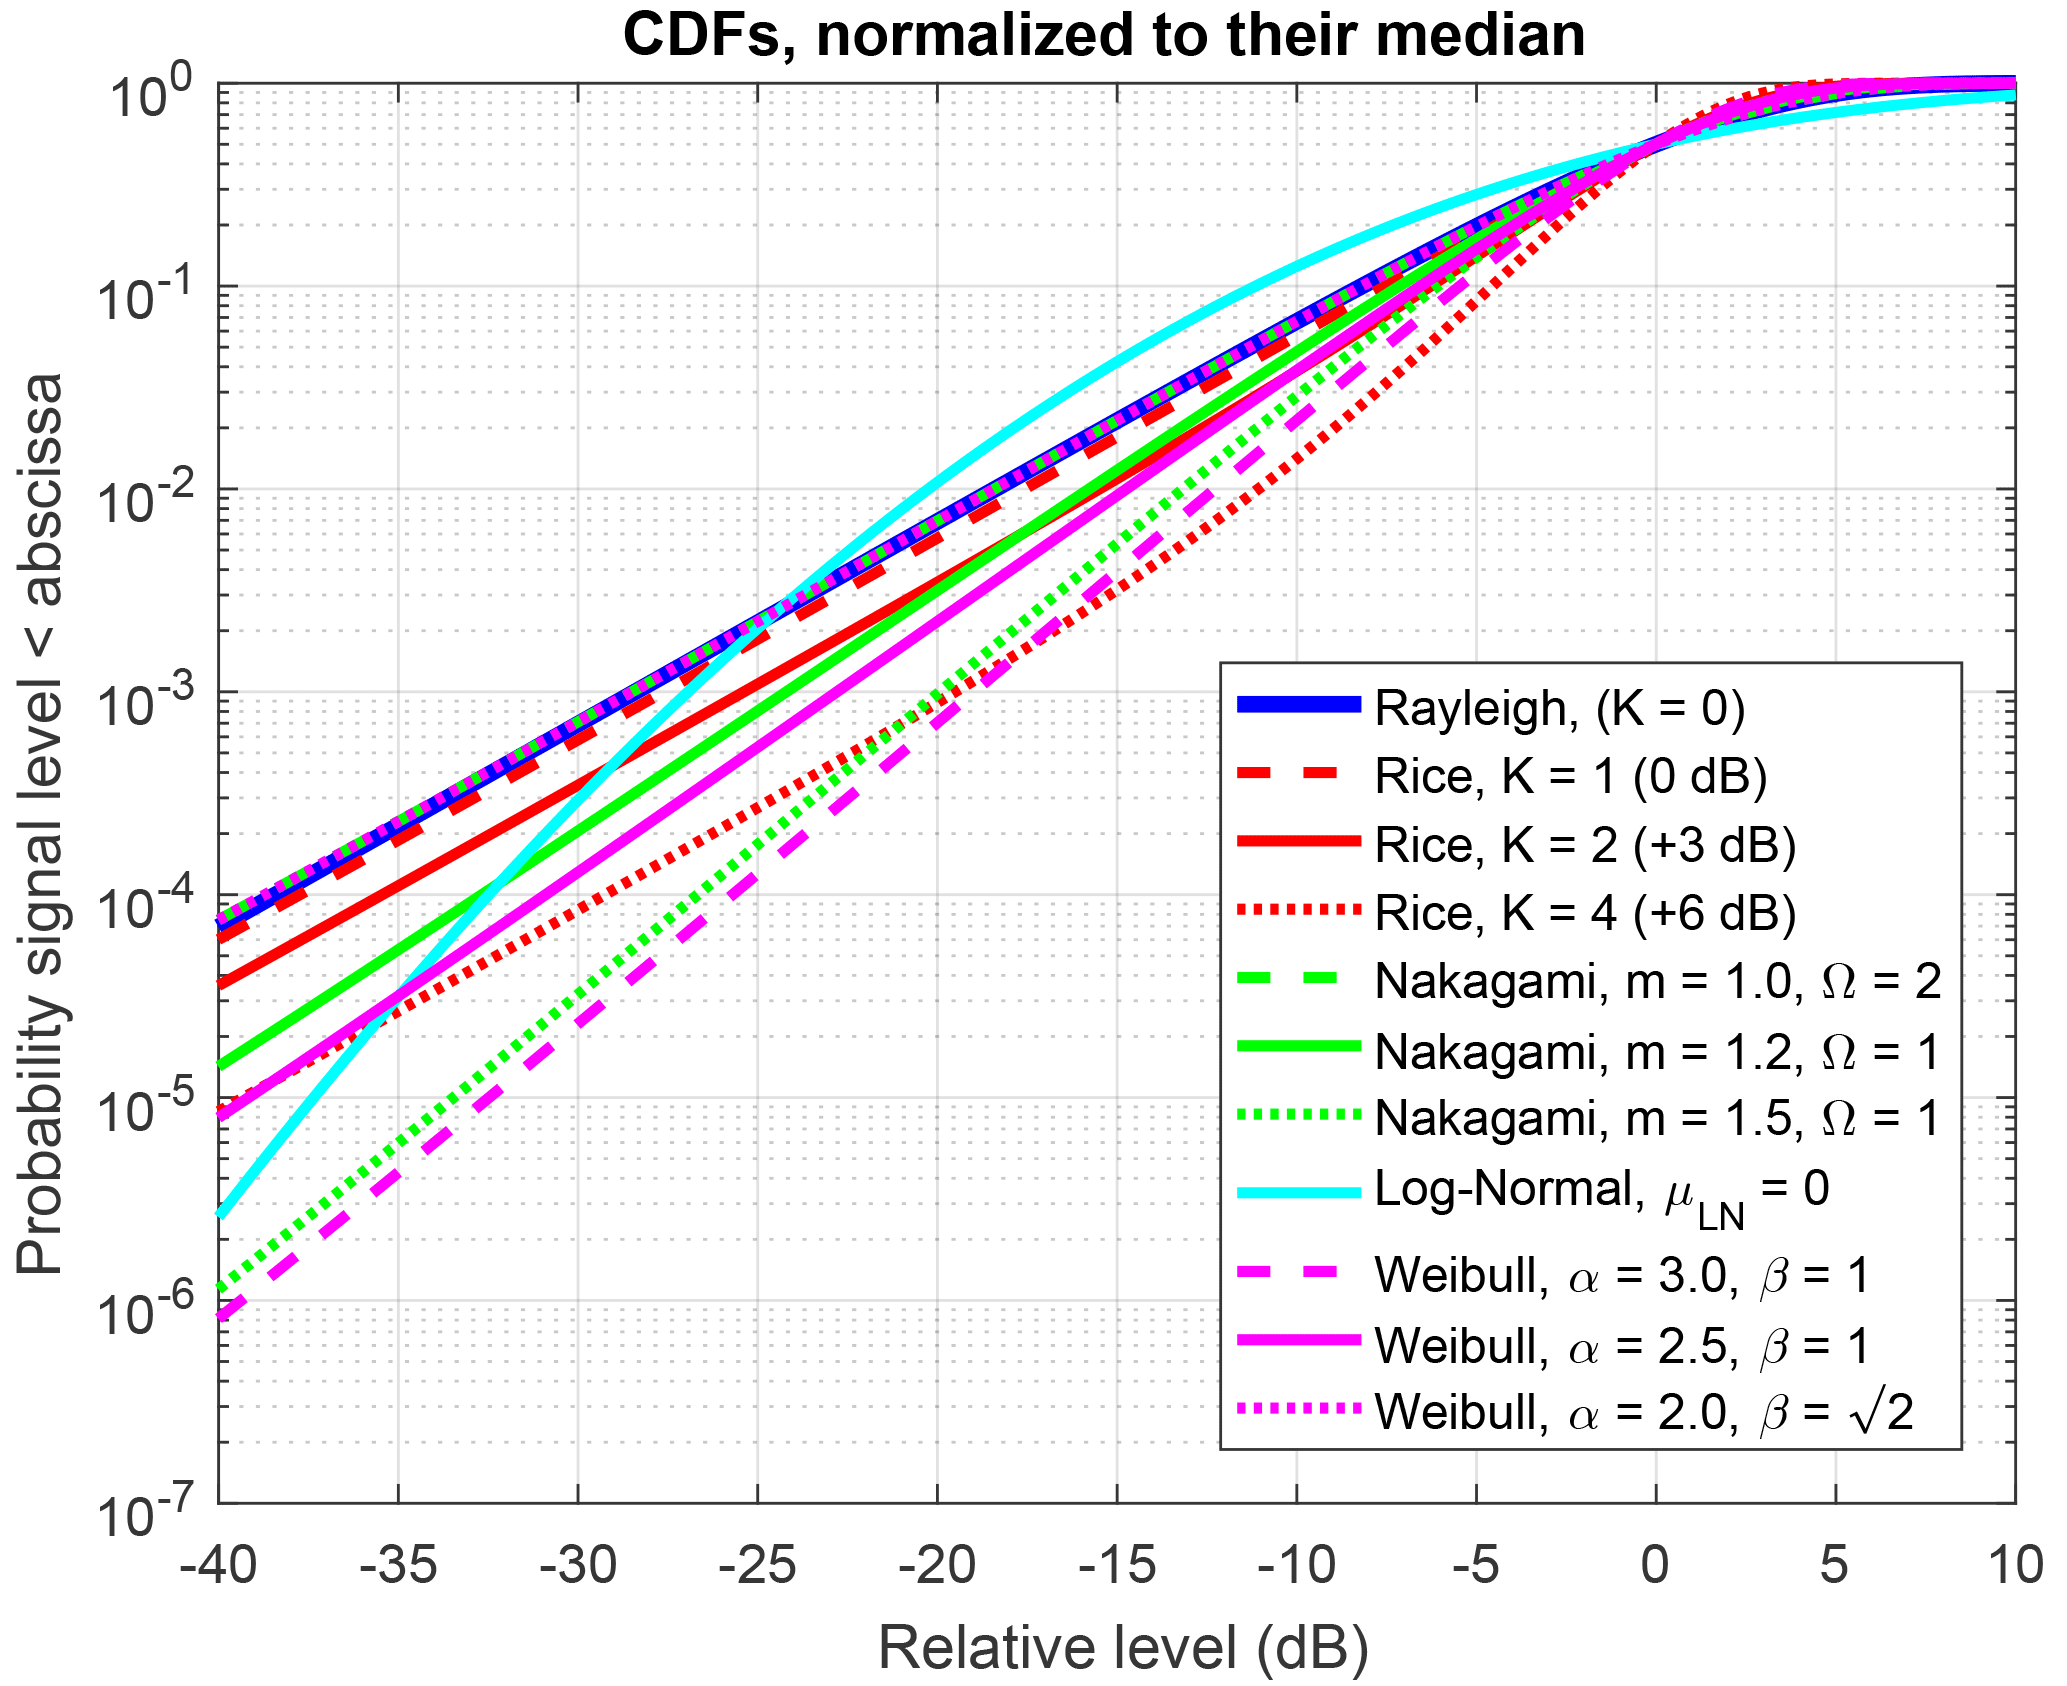
Figure 7CDFs for Rayleigh, Rician, Nakagami and log-normal fading with different parameters. Where applicable, the parameter σ was chosen equal to unity.
The Rice CDFs with any parameter K>0 lie always below the CDF of the Rayleigh distribution for relative levels below the median. This means that deep fading occurs less frequently in a Rice channel than in a Rayleigh channel. This result is equivalent to the statement that if a dominant path (e.g., a direct LOS component) exists between the transmitter and the receiver, deep fading occurs with less probability than in a NLOS or Rayleigh scenario. Measurements have shown that Nakagami's parameter m is significantly larger than unity in many scenarios (e.g., m≈2.5 in Agrawal et al., 2014 or m≈35.7 in Eluma and Arshad, 2013). For m>1 fading dips are also less frequent than for Rayleigh distributed signal amplitudes. As Nakagami and Rice distributions are good approximations of each other, they are most often best fits for the measurements presented in Riback et al. (2005). The measurements in Eluma and Arshad (2013) yield for the Weibull parameter α≈38.1, so the condition α>2 is significantly fulfilled in that case, which results in less deep fading than in a Rayleigh model. According to Riback et al. (2005) the Weibull distribution can imitate other distributions like the Nakagami or Rician distributions very well and furthermore also usually shows better fits than the Rayleigh distribution in the measurements presented there. For relative levels from about −25 to 0 dB below the median, the CDF of the log-normal distribution lies above the Rayleigh's CDF, meaning that fading in these levels occurs more frequently in a log-normal model than in a Rayleigh model. For relative levels lower than about −25 dB below the median, which corresponds to deep fading and usually a high outage, probability fading occurs much less frequently in a log-normal model than in a Rayleigh model. This qualitative outcome is also shown in, e.g., Rappaport and McGillem (1989) and Agrawal et al. (2014). As an interpretation, the log-normal channel model can also be considered to be less severe regarding deep fading than the Rayleigh channel model. As a conclusion the Rayleigh channel model is considered as a worst-case scenario, generally.

Figure 8Generic sketch of a (half-duplex) F/TDMA communication system. The frequencies change between the frames in this example.
Figure 8 shows a generic F/TDMA communication system. Signals from the base station towards the node are denoted as downlink signals DL1 up to DLm, whereas signals from the nodes towards the BS are denoted as uplink signals UL1.1 up to ULm.n. The system in Fig. 8 is a half-duplex system, as DL and UL are transmitted alternatingly. In an F/TDMA scheme, communication is typically arranged in m frequency tracks and n time slots, as shown in Fig. 8. Additionally, a frequency hopping algorithm is often used to mitigate fading effects and to improve coexistence behavior (Cammin et al., 2016; Krush et al., 2016). Although the complete frequency band is used over time, only a few frequency tracks are in use during a specific communication cycle. As the focus is on narrowband systems, which typically also have a packet length well below the coherence time, the transfer function of the radio channel can be simplified to for a particular frequency channel i and a particular time slot j. Therefore one time-variant attenuation associated with each narrowband frequency track is sufficient to emulate the radio channel appropriately.
The concept for the test setup is based on a test equipment (TE), which comprises at least a communication partner for the EUT, a radio channel emulator (CE) to provide time- and frequency-specific attenuation, equipment to generate the signals of other system subscribers (Figs. 9 and 11), and components for RF signal distribution.
The CE emulates fading by applying the specific . To implement the CE, synchronized, fast switching attenuators (ATTs), indicated in Figs. 10 and 12, can be used. The synchronous switching of the ATTs to the protocol of the radio units allows us to reduce the number of ATTs to one ATT per frequency track without oversimplification. When testing a system under full communication load, it is not practical to deploy the maximum allowed number of discrete nodes, e.g., 60 (Cammin et al., 2016) or 100 (Heynicke et al., 2017; Krush et al., 2016) nodes in a test setup. Instead, the signals of the nodes are emulated by the test companion (TC): similar to an ordinary node, the TC receives the DL signal from the BS and configures itself. Thus, the TC emulates other nodes by generating their UL and DL signals. Utilizing protocol synchronization, the same number of narrowband transmitters in the TC as frequency tracks (m in Fig. 8) is sufficient to emulate the full traffic of the communication system. In contrast to alternative implementations on the basis of an arbitrary/vector signal generator or on the basis of high-speed digital signal processing communication testers, this approach allows us to use the same narrowband transceivers as in standard nodes of the communication system. This enables a cost-efficient implementation of the TC.
With combination CE and TC and protocol synchronization, all nodes can be accurately emulated by their specific UL signals and their associated fading radio channel, i.e., . Furthermore, the parallel use of narrowband transceivers has the advantage that they have independent signal chains. In conjunction with an ATT, which has typically an operating bandwidth of several gigahertz, a faded narrowband signal can be generated easily.
Exemplary implementations of this approach, including adaptations to test either a node or a BS, are presented in the following sections.
4.1 Node testing
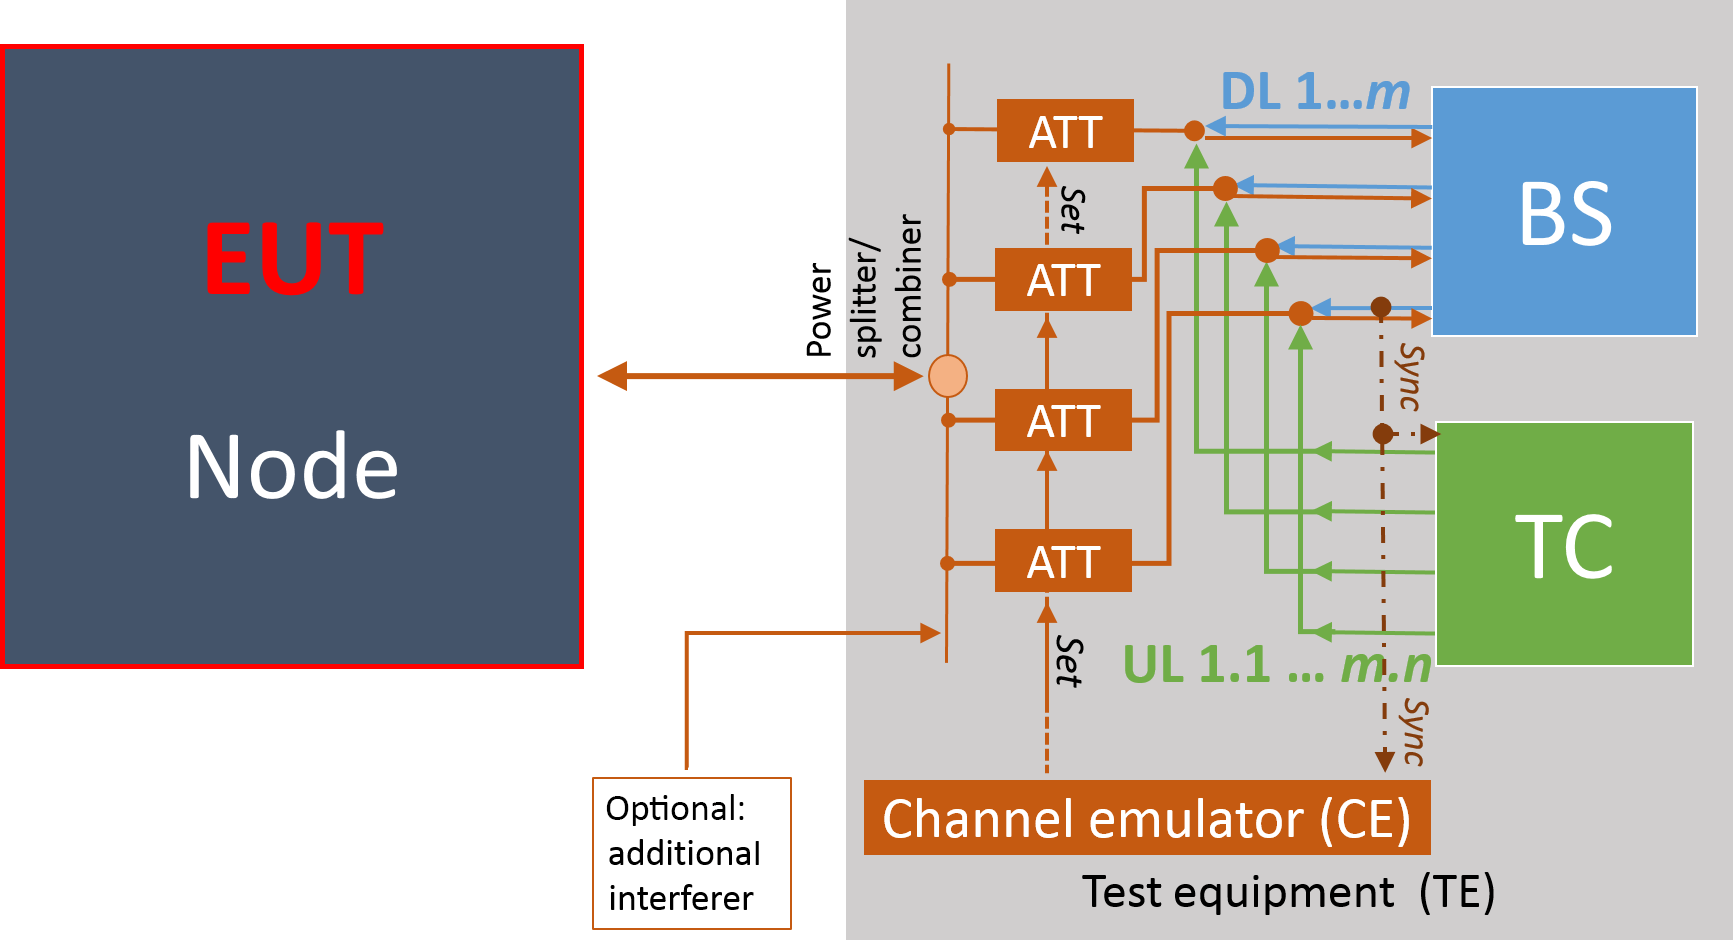
In order to provide a communication partner for the EUT, for node testing (sensor/actuator testing) the TE has to include a BS as well. To test the EUT as a part of the wireless communication system, all other network nodes up to the system capacity limit have to be emulated by the TC, as shown in Fig. 9. In this example the EUT is assigned to frequency track i and time slot j. So all other signals except that particular frequency track i and time slot j are generated by the TE.
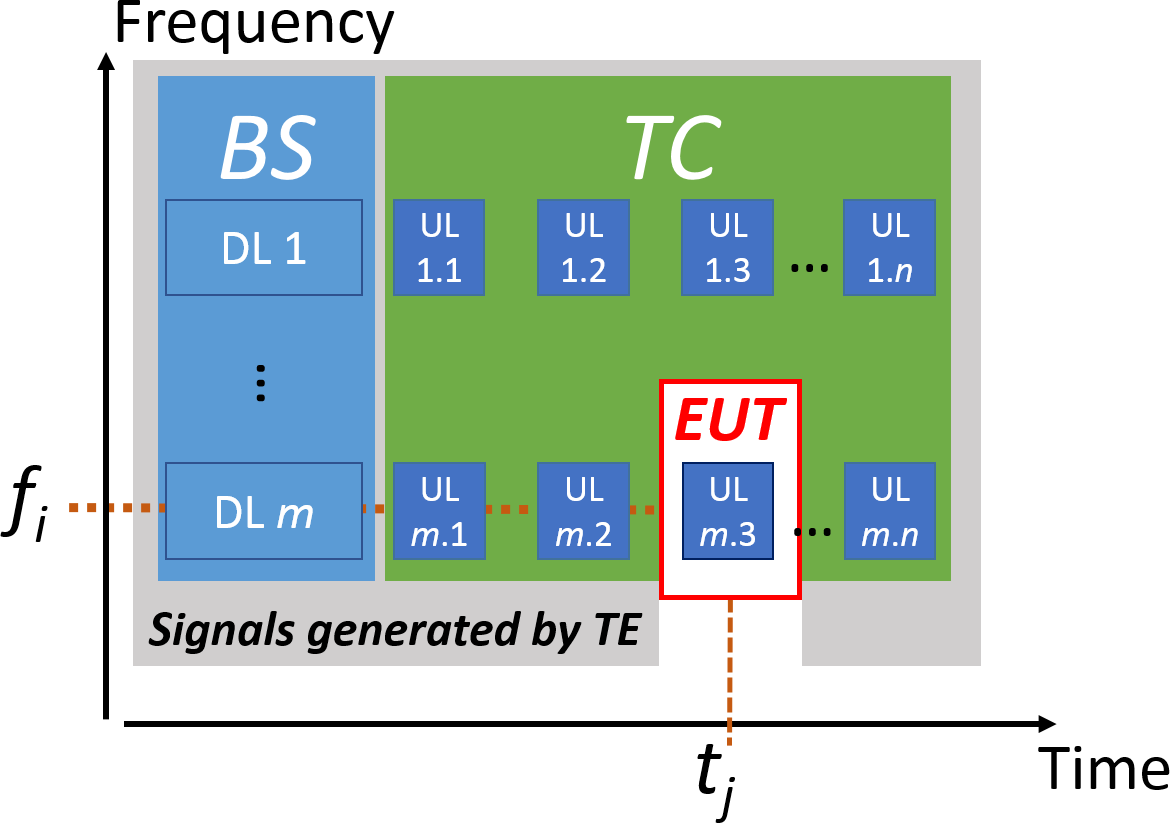
Figure 9Sketch of the DL and UL signals for node testing. The parts of the hardware setup that generate the corresponding signals are denoted in italics.
An exemplary hardware setup for the TE is presented in Fig. 10. For better clarity, control lines are omitted in this block diagram with the exception of the synchronization (Sync) and setting (Set) connections. The TE consists of the subsystems BS, TC and CE. The CE provides the associated attenuation for each UL and DL signal that is applied to the EUT. As the BS represents the master of the communication system, the overall system timing for the TDMA is provided by the BS. Therefore it is convenient to derive the synchronization for the TC and the CE from the DL signal of the BS. Optionally, further interferers (e.g., WLAN) can be added. The whole TE is designed to accurately meet the specification of the standard and can therefore considered golden equipment, according to a golden master in IO-Link Community (2014).
4.2 Base station testing
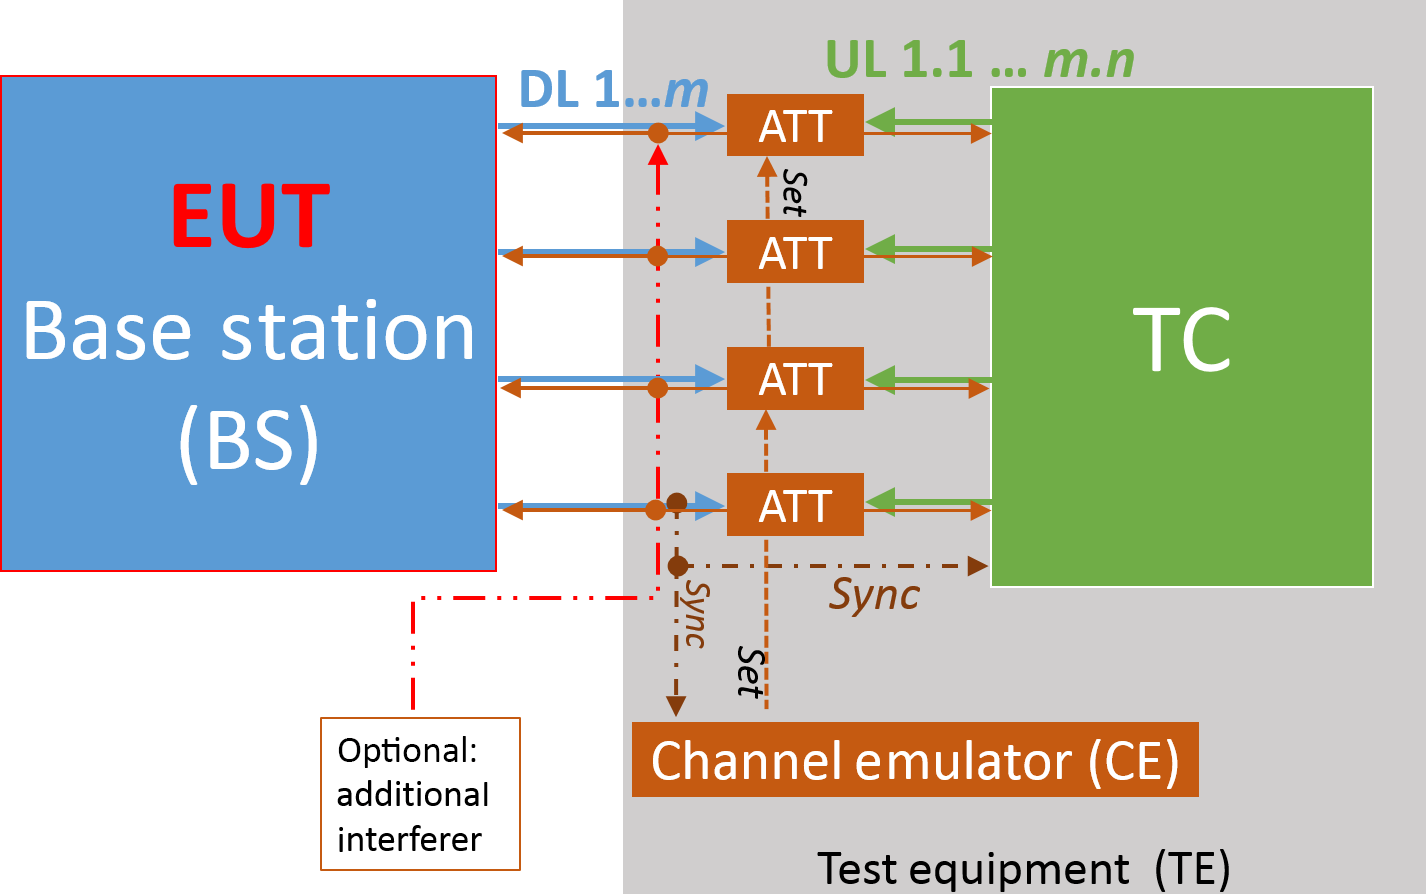
Especially for BS, testing under full communication load is important. At least parts of the data handling in a BS are realized by serial processing, e.g., data processing or the communication over a wired network or fieldbus, and thus possible bottlenecks should be identified. Here the TC is the communication partner for the EUT (BS) emulating the UL signals of all nodes, as shown in Fig. 11.
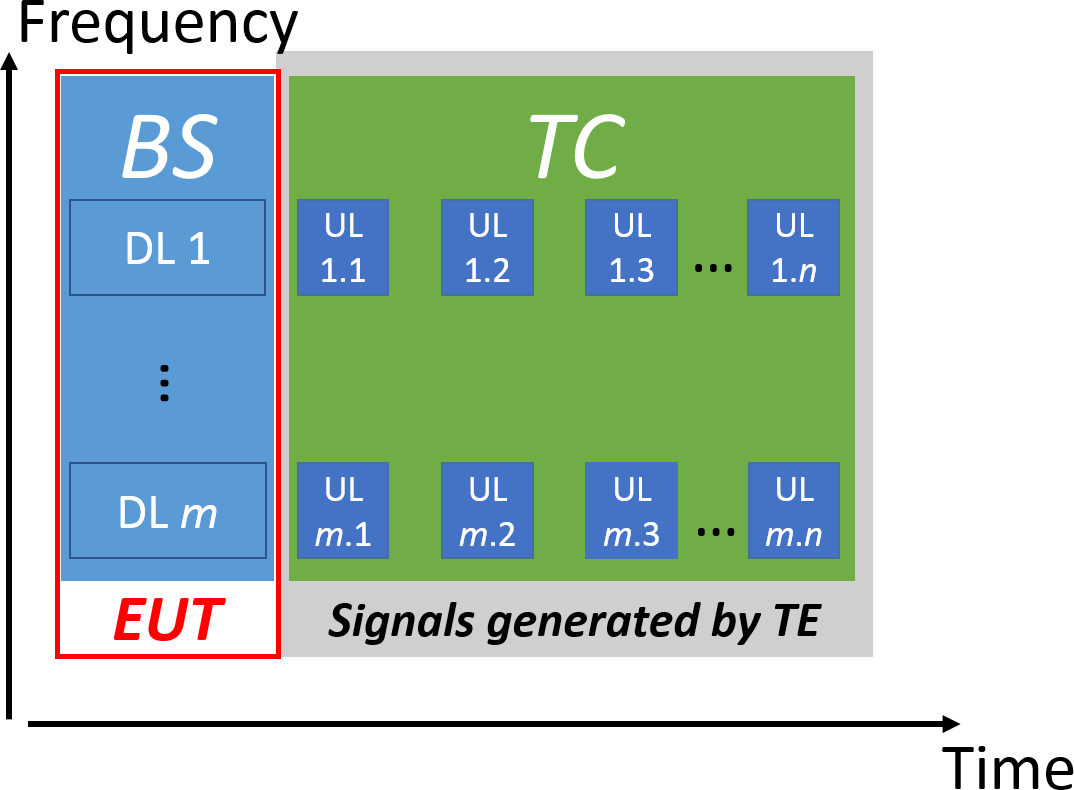
Figure 11Sketch of the DL and UL signals for node testing. The parts of the hardware setup that generate the corresponding signals are denoted in italics.
The hardware test setup for a BS is presented in Fig. 12 where EUT (BS) acts as communication master. For better clarity, control lines are omitted in this block diagram with the exception of the synchronization (Sync) and setting (Set) connections. The TC generates the emulated UL signals from the nodes and the CE provides the specific . Also, the timing accuracy has to be tested by the TC and external measurement instruments. As the TC emulates node signals and provides measurement routines in this symmetric test setup, the TC acts as an inverted BS (BS−1) in this context. Here also the overall TE is designed to accurately meet the specification of the wireless standard and can therefore considered a golden device in accordance with the IO-Link Community (2014).
4.3 EUT with integrated antenna
To couple signals wirelessly into EUT with integrated antennas, several shielded test enclosures (e.g., semi/full anechoic chamber, gigahertz transverse electromagnetic cell, GTEM cell, reverberation chamber, RC) were suggested (Schwab and Kürner, 2011). A RC consists of a shielded volume, which is equipped with mode stirrers. Usually these are rotating or moving plates to stir the electromagnetic fields within the chamber stepwise or continuously (Holloway et al., 2006; Schwab and Kürner, 2011). Besides these mechanical mode stirrers, other types of mode stirrers can also be utilized (Kildal et al., 2015; Moglie et al., 2015; Rosengren et al., 2001).
In contrast to most other test enclosures, RCs provide stochastically isotropic fields (Schwab and Kürner, 2011) and intrinsic radio channels with Rayleigh (or Rician) fading behavior (Chen et al., 2015; Corona et al., 2000; Holloway et al., 2006; Kildal et al., 2012, 2014; Kostas and Boverie, 1991). This means that for a full mode-stirring cycle the corresponding set of measurements results in an isotropic and homogeneous environment for the EUT. Figure 13 shows a test setup including a RC.
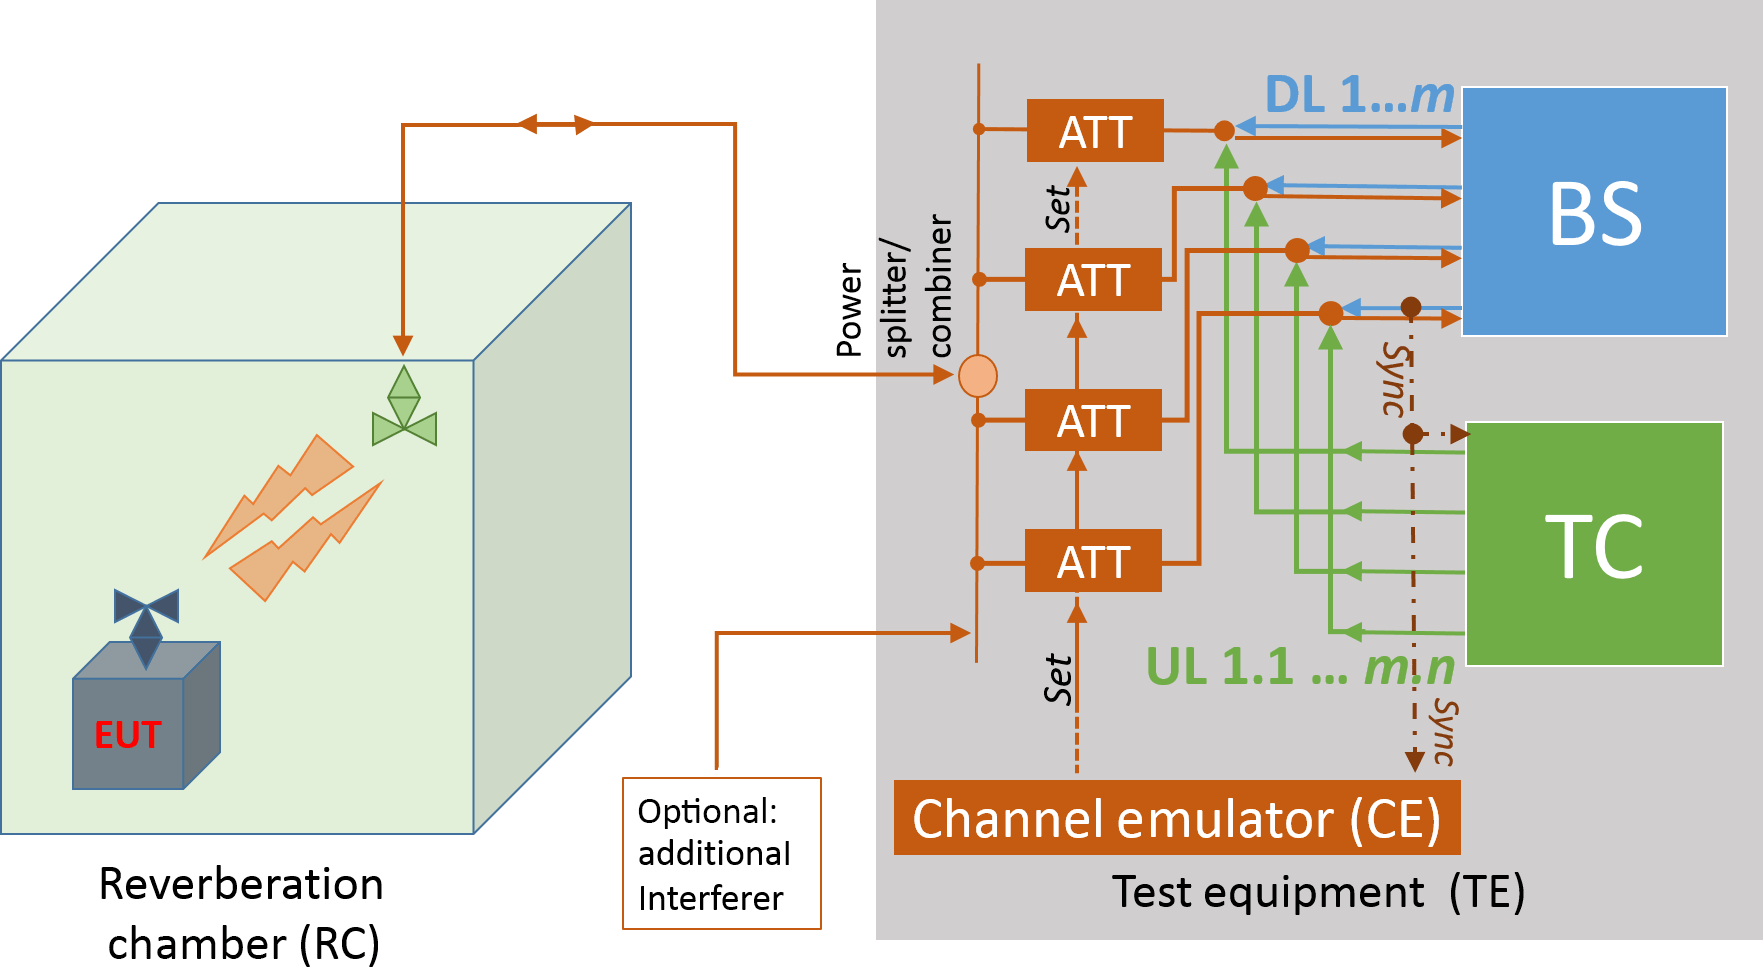
The coherence bandwidth of the RC-Rayleigh channel can be adjusted to the same values as measured in industrial environments (Chen et al., 2011; Coder et al., 2010); i.e., the intrinsic channel can be tuned to emulate a particular environment by loading the RC, e.g., with absorbers (Cammin et al., 2017b; Chen et al., 2011; Coder et al., 2010; Cui et al., 2012; Rajamani et al., 2013; Schwab and Kürner, 2011). This allows us to omit an additional CE, if a Rayleigh channel is desired (Lötbäck et al., 2015).
For quality testing during the production process, a simplified approach is suggested, which is similar to the relative measurements in (ETSI EN 300 328, 2016). First, a prototype of the series product is tested in a RC according to the approach presented above. In a second step the same prototype is mounted in a small absorber chamber, or more specifically, in a test fixture (TF) instead of a RC, and the test is repeated. The measured FEP/BEP obtained in the TF can then be used as reference values. In contrast to a test in a RC, a TF does not provide a (statistically) isotropic and homogeneous field distribution. But the measured reference values can be used if the EUT is always mounted in the same position and orientation within the TF.
4.4 Test equipment design considerations
In the previous Figs. 10, 12, and, 13, block diagrams for test setups are shown. The radio frequency (RF) components, meaning the ATTs, power splitter/combiners and RF connections, are standard components with a good availability on the market. The BS in Figs. 10 and 13 can be a standard BS, augmented by capabilities for FEP/BEP measurements. In addition, further measurement capabilities, e.g., for power/RSSI (received signal strength indicator) or communication retries (in the case of transmission errors), would be beneficial. As indicated before, the realization of the TC as inverted BS (BS−1) employing the same narrowband transceivers used in the communication system can significantly reduce the effort and cost for both the development and hardware of the TC, as the design of the TC is very similar to the ordinary BS. For comparable testing, the CE should contain a standardized (Rayleigh) channel model or a set of channel models. For the BS, TC and CE components, the same software and hardware tools which are employed for the BS and the nodes for standard operation can be used. The complete measurement setup will be controlled by a standard computer with appropriate software tools (e.g., MATLAB, LabVIEW).
A new approach to test wireless subsystems as part of an overall communication system in a fading multipath radio channel environment is presented. Various commonly used channel models are itemized and the Rayleigh channel model is generally considered as a worst-case scenario. Exemplary embodiments for node and BS testing were presented, also for EUT with integrated antenna. Utilizing protocol synchronization, the complete communication system can be efficiently emulated. Thus, complete communication testing becomes technically feasible, even for a high number (tens to hundreds) of nodes. Furthermore, the complexity of the TC and CE can be reduced due to protocol synchronization. In particular for IIoT and wireless communication for factory automation, the expected quantities of sold industrial wireless sensor/actuator devices are orders of magnitudes lower than for consumer applications or mobile communication applications (e.g., smartphones). Therefore the costs for testing and test equipment are very limited. As a consequence, only a very cost-effective approach based on standard components, such as the one presented here, is economical and affordable. In contrast to existing channel emulators used for mobile communication testing, a cost reduction for the test setup by 1 to 2 orders of magnitude can be expected.
The underlying data are not publicly available as there is ongoing product development together with industrial partners.
The authors declare that they have no conflict of interest.
This article is part of the special issue “Sensor/IRS2 2017”. It is a result of the AMA Conferences, Nuremberg, Germany, 30 May–1 June 2017.
The test equipment presented here is patented by Scholl et al. (2016). A shorter
version of this article was previously published at the AMA Conference SENSOR
2017 (Cammin et al., 2017a).
Edited by: Andreas König
Reviewed by: two anonymous referees
Abbas, S. A. and Sheikh, A. U.: A Geometric Theory of Nakagami Fading Multipath Mobile Radio Channel with Physical Interpretations, in: Vehicular Technology Conference, 1996. Mobile Technology for the Human Race, IEEE 46th, Atlanta, GA, USA, USA, 28 April–1 May 1996, IEEE, 2, 637–641, https://doi.org/10.1109/VETEC.1996.501389, 1996. a, b, c, d, e, f, g, h
Agrawal, P., Ahlén, A., Olofsson, T., and Gidlund, M.: Characterization of Long Term Channel Variations in Industrial Wireless Sensor Networks, in: Communications (ICC), 2014 IEEE International Conference on, Sydney, NSW, Australia, 10–14 June 2014, IEEE 1–6, https://doi.org/10.1109/ICC.2014.6883285, 2014. a, b, c, d, e, f, g
Cammin, C., Krush, D., Heynicke, R., Scholl, G., Schulze, C., Thiede, S., and Herrmann, C.: Coexisting wireless sensor networks in cyber-physical production systems, in: Emerging Technologies and Factory Automation (ETFA), 2016 IEEE 21st International Conference on, Berlin, Germany 6–9 September 2016, IEEE, 1–4, https://doi.org/10.1109/ETFA.2016.7733593, 2016. a, b, c, d, e
Cammin, C., Krush, D., Heynicke, R., and Scholl, G.: Test Method for Narrowband F/TDMA-based Wireless Sensor/Actuator Networks, in: AMA Conferences 2017, Nürnberg, Germany, 30 May–1 June 2017, Proceedings Sensor 2017, A8 – Wireless Sensors II, 151–155, https://doi.org/10.5162/sensor2017/A8.4, 2017a. a
Cammin, C., Krush, D., Heynicke, R., and Scholl, G.: Messtechnische Evaluierung einer Modenverwirbelungskammer als Testumgebung für drahtlose Sensor/Aktar-Module, tm – Technisches Messen, 84, 106–115, https://doi.org/10.1515/teme-2017-0049, 2017b. a
Chen, X., Kildal, P. S., and Lai, S. H.: Estimation of Average Rician K-Factor and Average Mode Bandwidth in Loaded Reverberation Chamber, IEEE Antenn. Wirel. Pr., 10, 1437–1440, https://doi.org/10.1109/LAWP.2011.2179910, 2011. a, b
Chen, X., Kildal, P. S., and Carlsson, J.: Verification of the Rician K-factor-based uncertainty model for measurements in reverberation chambers, IET Sci. Meas. Technol., 9, 534–539, https://doi.org/10.1049/iet-smt.2014.0344, 2015. a
Coder, J. B., Ladbury, J. M., Holloway, C. L., and Remley, K. A.: Examining the true effectiveness of loading a reverberation chamber: How to get your chamber consistently loaded, in: Electromagnetic Compatibility (EMC), 2010 IEEE International Symposium on, Fort Lauderdale, FL, USA, 25–30 July 2010, IEEE, 530–535, https://doi.org/10.1109/ISEMC.2010.5711332, 2010. a, b
Corona, P., Ferrara, G., and Migliaccio, M.: Reverberating chamber electromagnetic field in presence of an unstirred component, IEEE T. Electromagn. C., 42, 111–115, https://doi.org/10.1109/15.852404, 2000. a
Cox, D. C., Murray, R. R., and Norris, A. W.: 800-MHz attenuation measured in and around suburban houses, AT&T Tech. J., 63, 921–954, https://doi.org/10.1002/j.1538-7305.1984.tb00030.x, 1984. a
Cui, Y., Wang, S. Y., and Mao, Y.: Study of the effect of chamber shape and loading position on reverberation chamber performance, in: Electromagnetic Compatibility (APEMC), 2012 Asia-Pacific Symposium on, Singapore, Singapore, 21–24 May 2012, IEEE, 773–776, https://doi.org/10.1109/APEMC.2012.6237821, 2012. a
Eluma, G. and Arshad, K.: Indoor statistical channel modelling using Agilent 8960, in: Current Trends in Information Technology (CTIT), 2013 International Conference on, Dubai, United Arab Emirates, 11–12 December 2013, IEEE, 265–269, https://doi.org/10.1109/CTIT.2013.6749515, 2013. a, b, c, d, e, f
ETSI EN 300 328: ETSI EN 300 328 V2.1.1, Wideband transmission systems; Data transmission equipment operating in the 2,4 GHz ISM band and using wide band modulation techniques; Harmonised Standard covering the essential requirements of article 3.2 of Directive 2014/53/EU, available at: http://www.etsi.org/deliver/etsi_en/300300_300399/300328/02.01.01_60/en_300328v020101p.pdf (last access: 20 March 2018), 2016. a
Hashemi, H.: The indoor radio propagation channel, Proceedings of the IEEE, 81, 943–968, https://doi.org/10.1109/5.231342, 1993. a, b, c, d, e
Heynicke, R., Krush, D., Scholl, G., Kärcher, B., Ritter, J., Gaggero, P., and Rentschler, M.: IO-Link Wireless Enhanced Sensors and Actuators for Industry 4.0 Networks, in: AMA Conferences 2017, Nürnberg, Germany, 30 May–1 June 2017, Proceedings Sensor 2017, A8 – Wireless Sensors II, 134–138, https://doi.org/10.5162/sensor2017/A8.1, 2017. a, b, c, d, e
Holloway, C. L., Hill, D. A., Ladbury, J. M., Wilson, P. F., Koepke, G., and Coder, J.: On the Use of Reverberation Chambers to Simulate a Rician Radio Environment for the Testing of Wireless Devices, IEEE T. Antenn. Propag., 54, 3167–3177, https://doi.org/10.1109/TAP.2006.883987, 2006. a, b
ITU (International Telecommunication Union): Recommendation ITU-R P.1238-9: Propagation data and prediction methods for the planning of indoor radiocommunication systems and radio local area networks in the frequency range 300 MHz to 100 GHz, available at: https://www.itu.int/rec/R-REC-P.1238-9-201706-I/en (last access: 20 March 2018), 2017. a
IO-Link Community: IO-Link Test Specification Version 1.1.2, 2014, available at: http://www.io-link.com/share/Downloads/Testspec/IOL-Test-Spec_10032_V112_Jul14.pdf (last access: 20 March 2018), 2014. a, b
Kildal, M. S., Chen, X., Kildal, P. S., and Carlsson, J.: Investigation of mode stirring with plate on platform in a reverberation chamber, in: Antennas and Propagation (EuCAP), 2015 9th European Conference on, Lisbon, Portugal, 13–17 April 2015, IEEE, 1–5, 2015. a
Kildal, P. S., Chen, X., Orlenius, C., Franzen, M., and Patane, C. S. L.: Characterization of Reverberation Chambers for OTA Measurements of Wireless Devices: Physica Formulations of Channel Matrix and New Uncertainty Formula, IEEE T. Antenn. Propag., 60, 3875–3891, https://doi.org/10.1109/TAP.2012.2201125, 2012. a
Kildal, P. S., Glazunov, A. A., Carlsson, J., and Majidzadeh, A.: Cost-effective measurement setups for testing wireless communication to vehicles in reverberation chambers and anechoic chambers, in: Antenna Measurements & Applications (CAMA), 2014 IEEE Conference on, Antibes Juan-les-Pins, France, 16–19 November 2014, 1–4, https://doi.org/10.1109/CAMA.2014.7003428, 2014. a
Koerber, H. J., Wattar, H., and Scholl, G.: Modular Wireless Real-Time Sensor/Actuator Network for Factory Automation Applications, IEEE T. Ind. Inform., 3, 111–119, https://doi.org/10.1109/TII.2007.898451, 2007. a, b, c, d
Kostas, J. G. and Boverie, B.: Statistical model for a mode-stirred chamber, IEEE T. Electromagn. C., 33, 366–370, https://doi.org/10.1109/15.99120, 1991. a
Krush, D., Cammin, C., Heynicke, R., and Scholl, G.: Standardisierung eines schnellen drahtlosen Sensor/Aktor-Netzwerkes für die Fertigungsautomatisierung, tm – Technisches Messen, 83, 201–207, https://doi.org/10.1515/teme-2015-0118, 2016. a, b, c, d, e, f
Krush, D., Cammin, C., Heynicke, R., Scholl, G., and Kaercher, B.: A wireless communication system for energy and environmental monitoring, J. Sens. Sens. Syst., 6, 19–26,https://doi.org/10.5194/jsss-6-19-2017, 2017. a
Lötbäck, C. S. P., Skårbratt, A., and Orlenius, C.: Extending the reverberation chamber using a channel emulator for characterisation of over-the-air performance of multiple-input–multiple-output wireless devices, IET Sci. Meas. Technol., 9, 555–562, https://doi.org/10.1049/iet-smt.2014.0290, 2015. a
Moglie, F., Gradoni, G., Bastianelli, L., and Primiani, V. M.: A mechanical mode-stirred reverberation chamber inspired by chaotic cavities, in: Metrology for Aerospace (MetroAeroSpace), 2015 IEEE, Benevento, Italy, 4–5 June 2015, IEEE, 437–441, https://doi.org/10.1109/MetroAeroSpace.2015.7180697, 2015. a
Rajamani, V., Bunting, C. F., and West, J. C.: Effects of loading on independent samples and uniformity of a reverberation chamber, in: Electromagnetic Compatibility (EMC), 2013 IEEE International Symposium on, Denver, CO, USA, 5–9 August 2013, IEEE, 217–221, https://doi.org/10.1109/ISEMC.2013.6670412, 2013. a
Rappaport, T. S.: Indoor radio communications for factories of the future, IEEE Commun. Mag., 27, 15–24, https://doi.org/10.1109/35.29535, 1989. a, b
Rappaport, T. S.: Wireless Communications: Principles and Practice, 2nd ed. Edn., Prentice Hall, Upper Saddle River, NJ, 2001. a, b, c, d, e, f, g, h, i, j, k, l, m, n
Rappaport, T. S. and McGillem, C. D.: UHF fading in factories, IEEE J. Sel. Area. Commun., 7, 40–48, https://doi.org/10.1109/49.16842, 1989. a, b, c, d, e, f
Riback, M., Asplund, H., Medbo, J., and Berg, J. E.: Statistical analysis of measured radio channels for future generation mobile communication systems, in: Vehicular Technology Conference, 2005. VTC 2005-Spring. 2005 IEEE 61st, Stockholm, Sweden, 30 May–1 June 2005, IEEE, 1, 68–72, https://doi.org/10.1109/VETECS.2005.1543251, 2005. a, b, c, d, e, f, g
Rosengren, K., Kildal, P. S., Carlsson, C., and Carlsson, J.: Characterization of antennas for mobile and wireless terminals by using reverberation chambers: improved accuracy by platform stirring, in: IEEE Antennas and Propagation Society International Symposium. 2001 Digest, Held in conjunction with: USNC/URSI National Radio Science Meeting (Cat. No.01CH37229), 3, 350–353, https://doi.org/10.1109/APS.2001.960105, 2001. a
Scholl, G., Krush, D., Heynicke, R., and Cammin, C.: Channel Emulator and Test System for Communication Participants, https://depatisnet.dpma.de/DepatisNet/depatisnet?action=bibdat&docid=EP000003073655A1, EP3073655A1, 26 pp., 2016. a
Schwab, A. J. and Kürner, W.: Elektromagnetische Verträglichkeit, VDI-Buch, Springer, Berlin, 6th Edn., bearb. und aktualisierte aufl., 2011. a, b, c, d
Shankar, P. M.: Fading and Shadowing in Wireless Systems, 2nd ed. Edn., Springer Science+Business Media, New York Dordrecht Heidelberg London, https://doi.org/10.1007/978-1-4614-0367-8, 2012. a, b, c, d, e, f, g, h, i, j, k
Stein, S.: Fading Channel Issues in System Engineering, IEEE J. Sel. Area. Comm., 5, 68–89, https://doi.org/10.1109/JSAC.1987.1146536, 1987. a, b