the Creative Commons Attribution 4.0 License.
the Creative Commons Attribution 4.0 License.
 | 10 Apr 2018
Crack luminescence as an innovative method for detection of fatigue damage
Ruben Makris
Falk Hille
Marc Thiele
Dirk Kirschberger
Damian Sowietzki
Conventional non-destructive testing methods for crack detection provide just a snapshot of fatigue crack evolution at a specific location in the moment of examination. The crack luminescence coating realizes a clear visibility of the entire crack formation. The coating consists of two layers with different properties and functions. The bottom layer emits light as fluorescence under UV radiation. The top layer covers the fluorescing one and prevents the emitting of light in case of no damage at the surface. Several different experiments show that due to the sensitive coating even the early stage of crack formation can be detected. That makes crack luminescence helpful for investigating the incipient crack opening behavior. Cracks can be detected and observed during operation of a structure, making it also very interesting for continuous monitoring. Crack luminescence is a passive method and no skilled professionals are necessary to detect cracks, as for conventional methods. The luminescent light is clearly noticeable by unaided eye observations and also by standard camera equipment, which makes automated crack detection possible as well. It is expected that crack luminescence can reduce costs and time for preventive maintenance and inspection.
- Article
(3519 KB) - Full-text XML
-
Supplement
(25773 KB) - BibTeX
- EndNote


In structural parts under cyclic and/or vibrational loading fatigue cracks can initiate and grow, which leads to a gradual degradation and eventually to structural failure (Suresh et al., 1994; Pook, 2007). This process can occur in various types of material but is very characteristic for metal, especially steel. Fatigue is a local phenomenon and relevant stresses typically arise at geometrical and material discontinuities at the components' surface or from localized loading (Radaj et al., 2006). Beside others, welds are very prone to fatigue, especially if they are not machine-finished (Lassen and Récho, 2006).
The risk of fatigue damage is given for all cyclically or dynamically stressed structural components in nearly any field of mechanical, automotive or civil engineering and affects the design of aircrafts, ships, vehicles, and cranes, but also bridges and offshore structures like oil and gas platforms or offshore wind turbines (Richard and Sander, 2009). In some cases in the past, insufficient fatigue design and the occurrence fatigue cracks under operation led to disastrous accidents. Examples are first the 1998 train crash in Eschede in Germany, where a fatigue fracture of a wheel rim caused the derailing of a high-speed train with more than 100 casualties, and second, the sinking of the offshore platform Alexander L. Kielland in 1980 in the North Sea with 123 casualties. There, fatigue fracture of a brace at the structure finally led to the capsizing of the complete platform (Radaj and Vormwald, 2007).

Figure 1Intact crack luminescence coating at a welding seam (left) and the emission of light under UV-A radiation when a crack occurs (right) (M. Mehdianpour).
Due to safety issues, structural components under fatigue loading should be observed at an adequate frequency to react in case of crack formation. Principally, the early detection of a crack helps to lower maintenance and repair costs significantly. In the past, several procedures were applied to monitor the fatigue state of structures or structural components. The most common and generally practiced technique is the frequent visual inspection of the components for fatigue cracks, if necessary using magnifying glasses. For reasons of increasing the detectability by visual inspection, generally two methods were adopted to intensify the cracks' recognizability: the dye penetrant testing method (EN ISO 3452-1:2013, 2013) and the magnetic particle testing method (EN ISO 9934-1:2016, 2016). Both methods lead to an acceptable detectability, though their application is associated with a high effort in time and considerable costs for the ingredients.
Other nondestructive testing (NDT) methods for detecting fatigue cracks are ultrasonic, thermographic, radiographic as well as eddy current based. Compared to visual methods they have in common, the inspection intervals have to be defined in dependency of the crack propagation. According to the required safety level, costs for those manual and visual inspections can be significant because well-trained experts need to be deployed.
Unlike the prescribed NDT methods, measurement-based procedures can signalize the occurrence of fatigue cracks right after their formation and can alarm responsible authorities. The variety of sensors for measuring fatigue crack parameters goes from a simple thin wire, breaking at the time point of cracking and signalizing the event up to strain gauge sensors, which observe the strain state locally. Besides classic strain gauge application, crack propagation gauges monitor the propagation of a crack. Principally, the ripping of conductor tracks leads to gradual gain of electrical resistance, which correlates with the crack's length. As before, the application of crack propagation gauges implies exact prior knowledge about the location and direction of a crack. So, accordingly, the major drawback of those measurement methods is that they work locally and require the exact position of the expected fatigue crack. Especially in applications of large civil engineering structures, this is a challenging matter.
To overcome the described drawback, an improved new method, the so-called crack luminescence, was developed at the German Federal Institute for Materials Research and Testing (BAM) (Mehdianpour, 2014), which provides a highly efficient solution for observing fatigue crack propagation on structural components. Crack luminescence utilizes UV-activated fluorescence, which in the past was also examined for protective coatings to signalize corrosion damage (Deardorff, 2009). In this research, one-layer systems with only one fluorescing layer and multilayer systems with an additional non-reactive finish coat were investigated. To detect and repair insufficient coated areas inspection workers either look for darker and less fluorescent spots on the fluorescing surface or for lighter fluorescence spots on the multilayer system which imply defects in the finish coat. Corrosion was detected by black light due to the degrading of the finish coat. In Jang et al. (2013) and Timilsina et al. (2016a, b) a procedure based on mechanoluminescence paint was described to detect and observe cracks in concrete and reinforced concrete samples. Principally, a one-layer system was applied. Cracks were detected by the high luminescence activity in the highly stressed locations of the cracks.
The presented method of crack luminescence is based on a two-layer system with the luminescing first and the covering second layer. In case of crack initialization or propagation both layers break and with the help of UV light the crack is significantly visible. For its easy and safe application crack luminescence has a great potential for fatigue crack observation of large structures like cranes, bridges, pylons, or offshore structures. The paper explains the underlying functionality of the method and describes the extensive study undertaken to show the ability of crack luminescence to detect fatigue damage in an early stage as well as to optimize the method handling.
For the crack luminescence, a special coating of less than 100 µm thickness is applied on the surface of critical locations. That can be welds, joints, locations of existing cracks, crevices, corners or other neuralgic regions at structures. The coating consists of two layers, the luminescing layer and a dark layer which covers the luminescing one (see Fig. 1). The luminescence is enabled by easily excitable molecules. When a crack occurs in the components' surface the two layers rip open at the cracks' edges due to its adhesive properties. The wavelength range of UV radiation is between 100 and 400 nm. The crack luminescence method uses UV-A rays (black light/315–380 nm) with a wavelength of 365 nm. If those energy-intensive rays enter the crack, orbital electrons of the molecules near the boundaries of the luminescing layer get “kicked up” by the UV-A in an excited singlet state and will emit visible radiation (380–780 nm) by relaxing to its ground state after a few nanoseconds. This process is called fluorescence (Lakowicz, 1999). The width of the opened crack edges governs the amount of visible light which is directed towards the observer (see Fig. 1). The dark layer blocks the UV rays and will prevent the fluorescence while the surface is intact.
For the functionality of this method a good adhesive bond between the metal's surface, the fluorescing layer and the cover layer is essential. In addition, the tensile strength properties of both layers must match with that of the metal. This makes the coating capable of adapting the elasticity of the metal and therefore ensuring a high accuracy of the crack detection. A more elastic coating material would result either in a delayed crack detection or would even prevent the detection (Mehdianpour, 2015). Therefore, in a research collaboration between the Bundesanstalt für Materialforschung und -prüfung (BAM) and MR Chemie, a manufacturer of specialized innovative products and devices for surface crack testing, several fluorescence and cover coatings were developed and investigated.
The luminescent indicator consists of an organic luminescent dye wherein the fluorescent dye is selected from the group consisting of perylene compounds and naphthalimide compounds. The polymerizing adhesive is a mixture of the group of acrylates, methyl acrylates, ethylacrylates and cyanoacrylates which is additionally used with a suitable peroxide as a fast-curing adhesive. These are incorporated into a carrier medium of the alcohol group such as 2-propanol or ethanol. The second layer, an opaque layer or cover layer which is intended to achieve complete transmission to the luminescent indicator, consists of one or more black pigments with a proportion of more than 99.5 % carbon, also known as carbon oxides, which is incorporated into one or more binders of the group of methyl acrylate compounds and ethyl acrylate compounds. The used carrier medium is alcohol such as 2-propanol or ethanol. For the examination of various coating materials and compositions, special test bodies were designed which allow a characterization of the sensitivity. The test body is made of steel (RABW / X 45 Ni Cr Mo 4) and “U”-like shaped by water jet cutting, as shown in Fig. 2. An incipient crack at the vertex was induced by cyclic loading. The test bodies allow us to continuously enlarge the crack opening width and the crack's length by compressing the ends with a screw, causing strain especially in the vertex where the incipient crack is located.
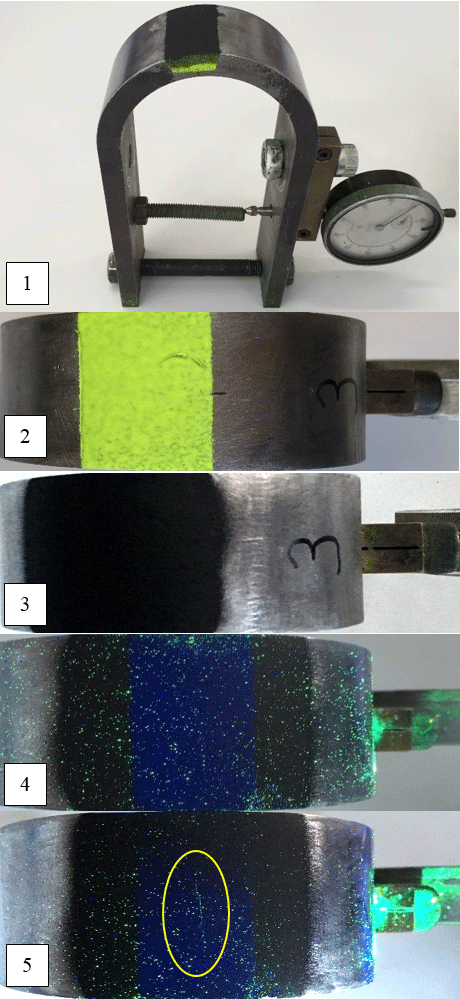
Figure 2Pictures numbered from top: (1) special test body with dial gauge, (2) applied with fluorescent layer, (3) covering layer, (4) under UV rays, and (5) the detected developing crack at a specific strain (Makris et al. 2017).
Figure 2 also shows the test specimen and generally illustrates the steps of the method. These are basically cleaning the surface, applying the fluorescing layer, letting it dry, applying the covering layer, letting it dry and after that inspecting visually with UV-A rays during and after loading of the test object. Figure 2(5) shows the detected crack at a defined crack width. Several test series resulted in one composition of the coating material and the necessary mass fractions of each component. The influences of the coating thicknesses were analyzed, too. The results revealed that a very thin coating of 40–60 µm with a cover layer thickness of about 20 µm leads to the most sensitive detection. However, the thinner the cover layer, the more background noise is noticeable, as seen in Fig. 2(4) and 2(5). The stochastic pattern of this background noise is clearly distinguishable from a crack, but could probably influence the crack detection under operation. Thus, a cover layer thickness of at least 30 µm is intended for further applications.
To reproduce thin coatings in a fast and easy way, MR Chemie developed aerosol cans which support user-friendly handling. The aimed thickness of the sprayed film is 60 to 100 µm. The fluorescing layer makes up 50 to 70 % of the total thickness. To evaluate the adhesive bond and delamination during deformation of the target steel component, the different coatings were examined in a Mandrel bending test. These examinations showed that only high strain values (> 15 %) cause fine fissures in the coating.
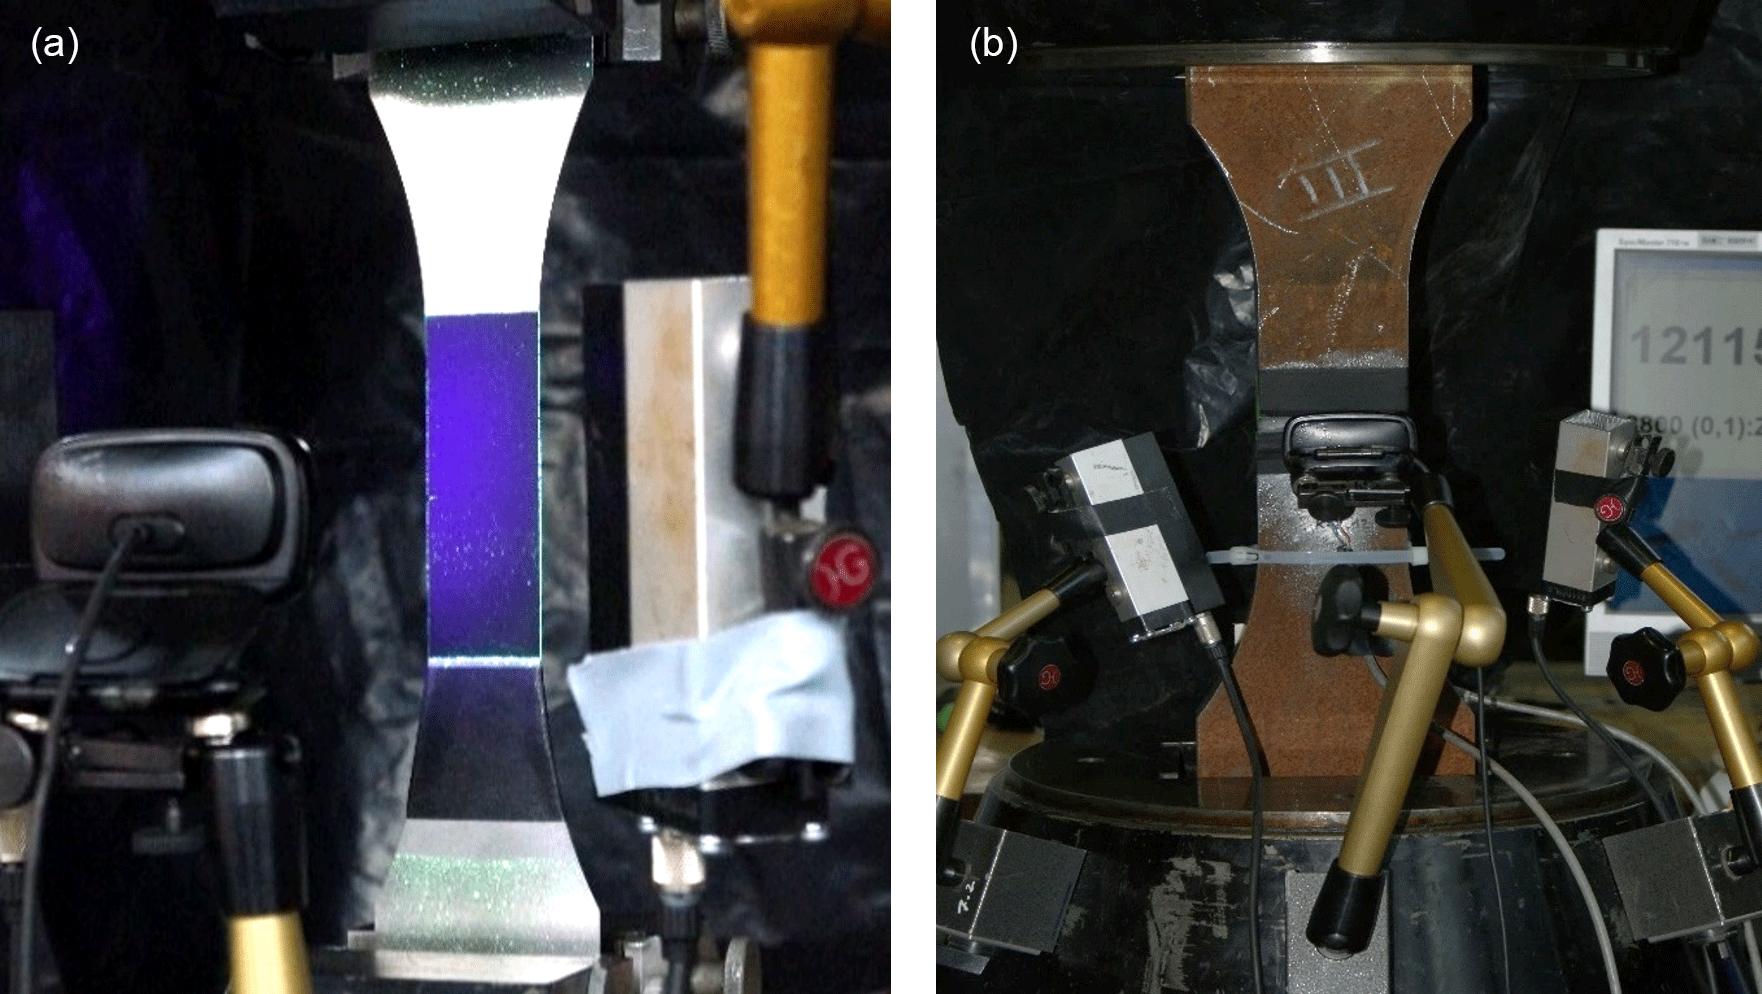
For deeper investigations concerning the sensitivity of the coating at a fatigue crack and for showing the long-life fatigue strength, the coating was applied to both thin metal sheets and welds in specific fatigue test specimens from the Fraunhofer Research Institution. These specimens were investigated by load-controlled cyclic tensile tests. Figure 3 shows the two test setups, where in both a camera and permanent UV illumination were applied. A camera system is important to capture small changes and varying light emissions in the coating for subsequent analysis and evaluation. The video analysis is meant to find the first light emission of the coating and point out significant stages of crack propagation by checking the video frame by frame. For these experiments, a simple commercial 720 p webcam was used and manually focused on the coating. In both experiments strain gauges were applied on the metal's surface to validate results of the luminescence coating regarding crack detection. The gauges had a length of 5 mm, a gauge factor of 2.13 and a resistance of 120±0.5 Ω.
In one of the test series the thin specimens were axially loaded 5 million times in an elastic deformation regime without causing a crack in the specimens to detect any delamination or ripping processes of the coating. The specimens did not show any kind of damage after the test, which indicates a durability of the coating layers against cyclic loading. Within a second test series cyclic loading is applied to metal sheets with a predefined eroded notch of 1 mm and 45∘ at the edge of the plate (see Fig. 4). While loaded cyclically, the formation of a crack will start from this notch. This crack leads to the fracture of the sheet. Strain gauges were applied right beneath the notch to measure the strain near the notch or crack throughout the entire test. To detect a crack, the sensitivity of the strain measurement always depends on the location of the strain gauges. The closer they are to the developing crack, the faster they show changes in strain. Figure 4 shows the position of the strain gauge. The centerline of the gauge has a distance from the tip of the notch of about 2 mm.
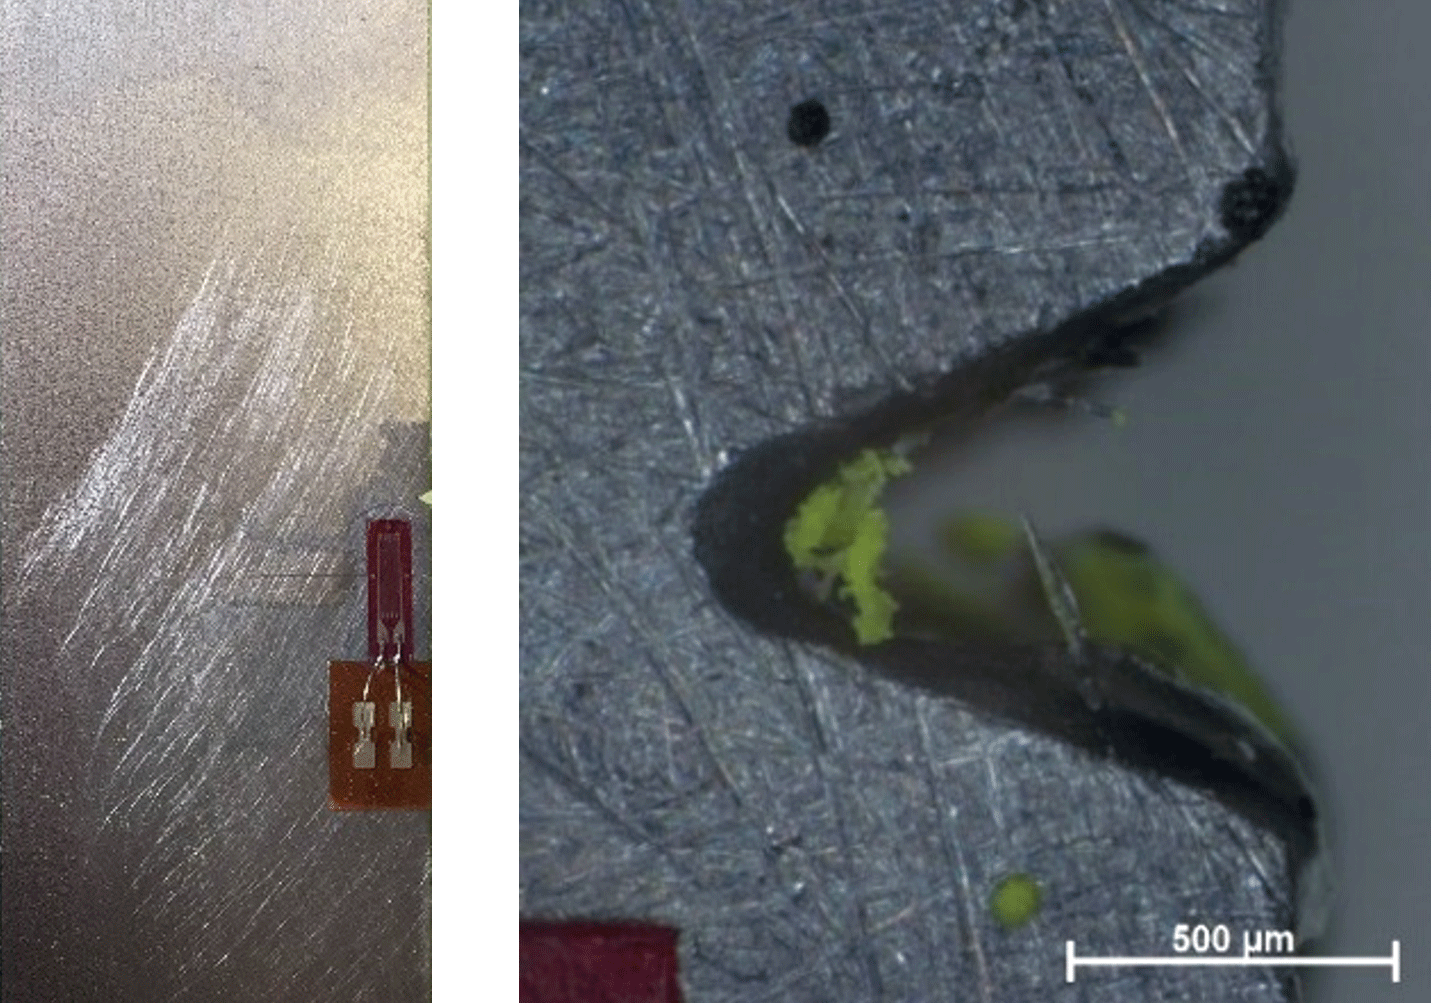
Figure 5 illustrates different stages of the crack's progression as an example. Special attention was paid to the moment when the crack becomes visible for the first time. Stage 1 shows the undamaged specimen after several load alternations. In stage 2, a first very weak gleaming is visible which is very hard to see in the snapshot image but quite noticeable in the motion images due to the blinking. This happens at 48 % of the specimen's lifetime. Stages 3 to 6 show the further growth of the crack.
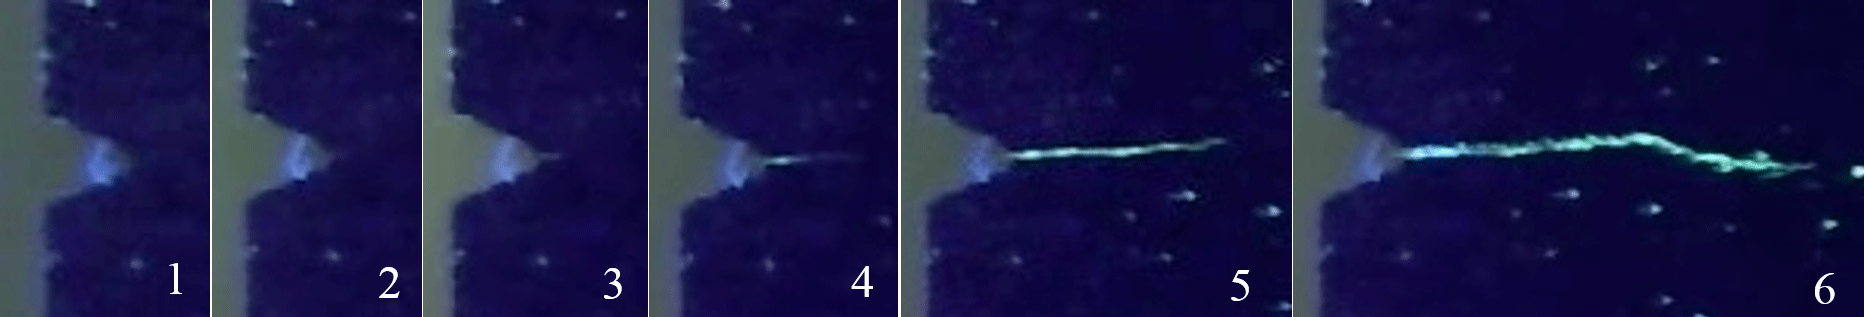
Figure 5Crack formation during a cyclic tensile test of a metal sheet with notch and luminescence coating.
The mentioned stages of Fig. 5 are flagged in the graph of the permanent strain measurement which is shown in Fig. 6. The graph shows the evolution of the maximum and minimum strain. The occurring crack causes a decreasing cross-section area of the specimen which results in an increase in strain on the zone behind the crack tip. The following Eq. (1) clarifies this relation between stress σN, force F and area A.
since the strain gauge is slightly behind the notch and accordingly the predefined crack, as seen in Fig. 4, as the first measured strain values at this point start increasing, which indicates the initiation of a crack. At stage 2, when the first weak gleaming is noticeable, the strain increased by 5 %. With a growing number of load cycles the occurring crack reaches a significant length and crosses the centerline of the gauge, which leads to declining strain values after 61 % of the lifetime caused by the shifts in tension.
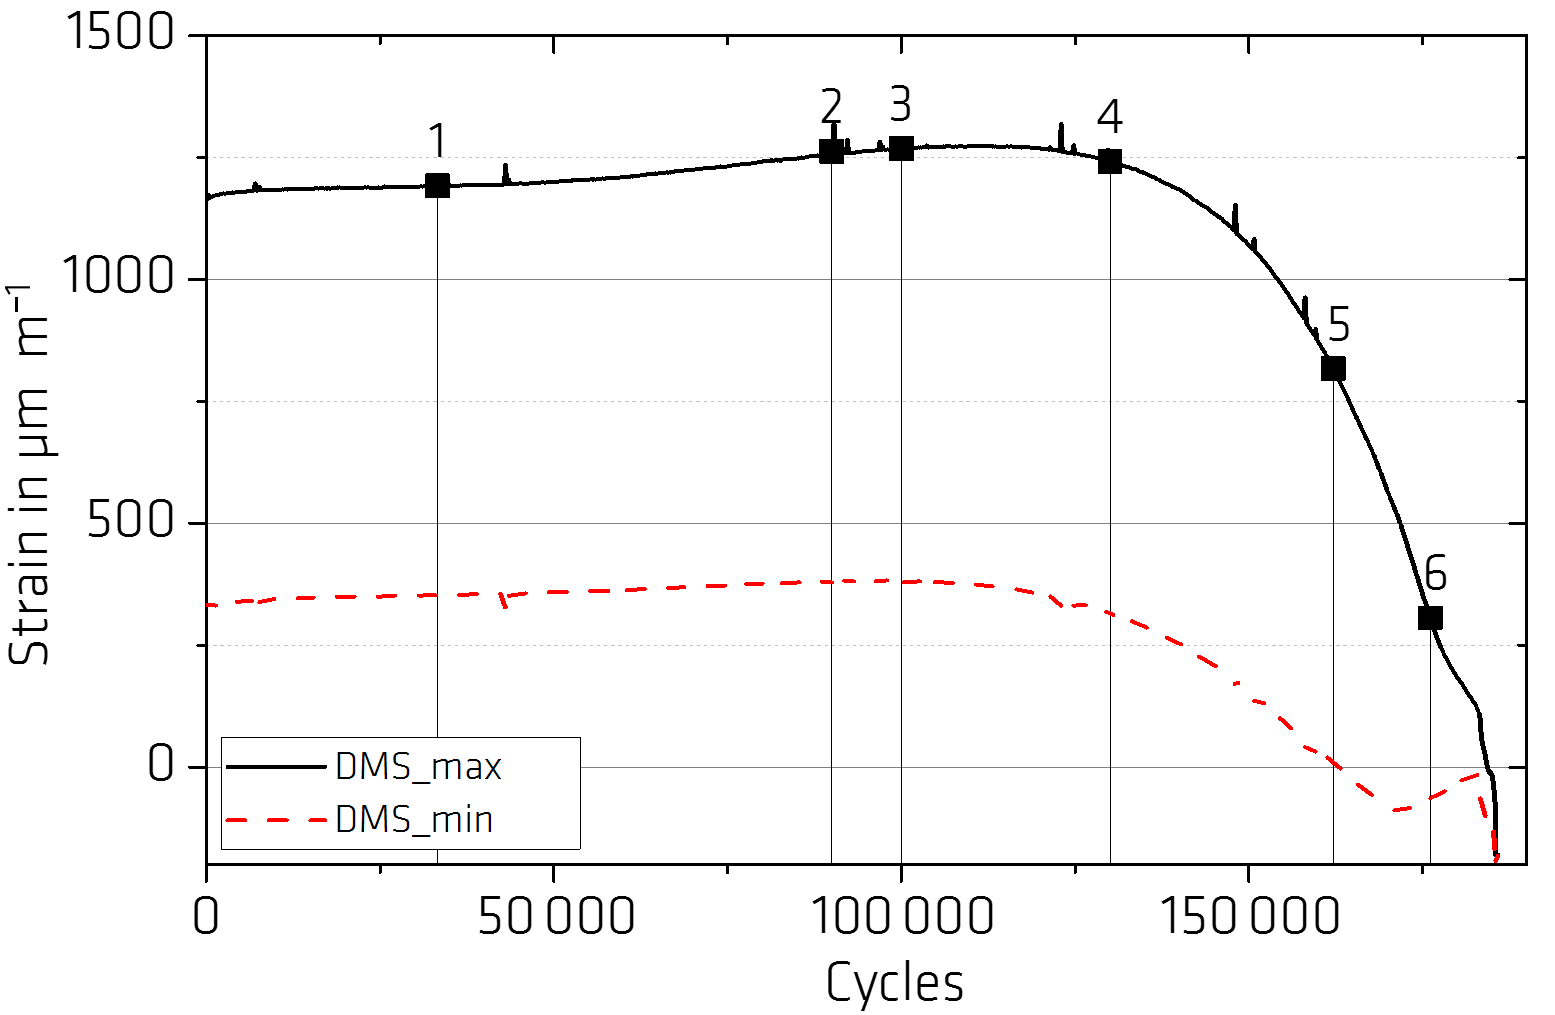
Figure 6Strain curve of maximum and minimum strain, marked with different stages of crack propagation.
In Fig. 7 the evolution of strain of 10 specimens is shown. The number of load cycles until fracture varied between 168 000 and 436 000. Those numbers were used for normalization scaling of the diagram's x-axis. The y-axis presents the strain amplitude, which is the difference between minimum and maximum strain. The markers with their vertical lines represent the moment when a first weak gleaming becomes noticeable, which signals the upcoming crack, like in stage 2 of Fig. 5. On average this point was reached after 63 % of the specimen's lifetime. Only 1 out of 10 specimens showed the crack significantly late at 80 %, but still with declining of the strain values. The delayed detection is explainable with incorrect camera settings. If the crack is not focused correctly, the video analysis and in consequence the determination of the crack opening becomes inaccurate. These tests were also performed on aged specimens (6 months) to show the long-term durability of the coating. The optical inspection did not show any shrinkage causing damage in the coating, and the results of the experiments did not point to a deterioration in the 6-month old coating.
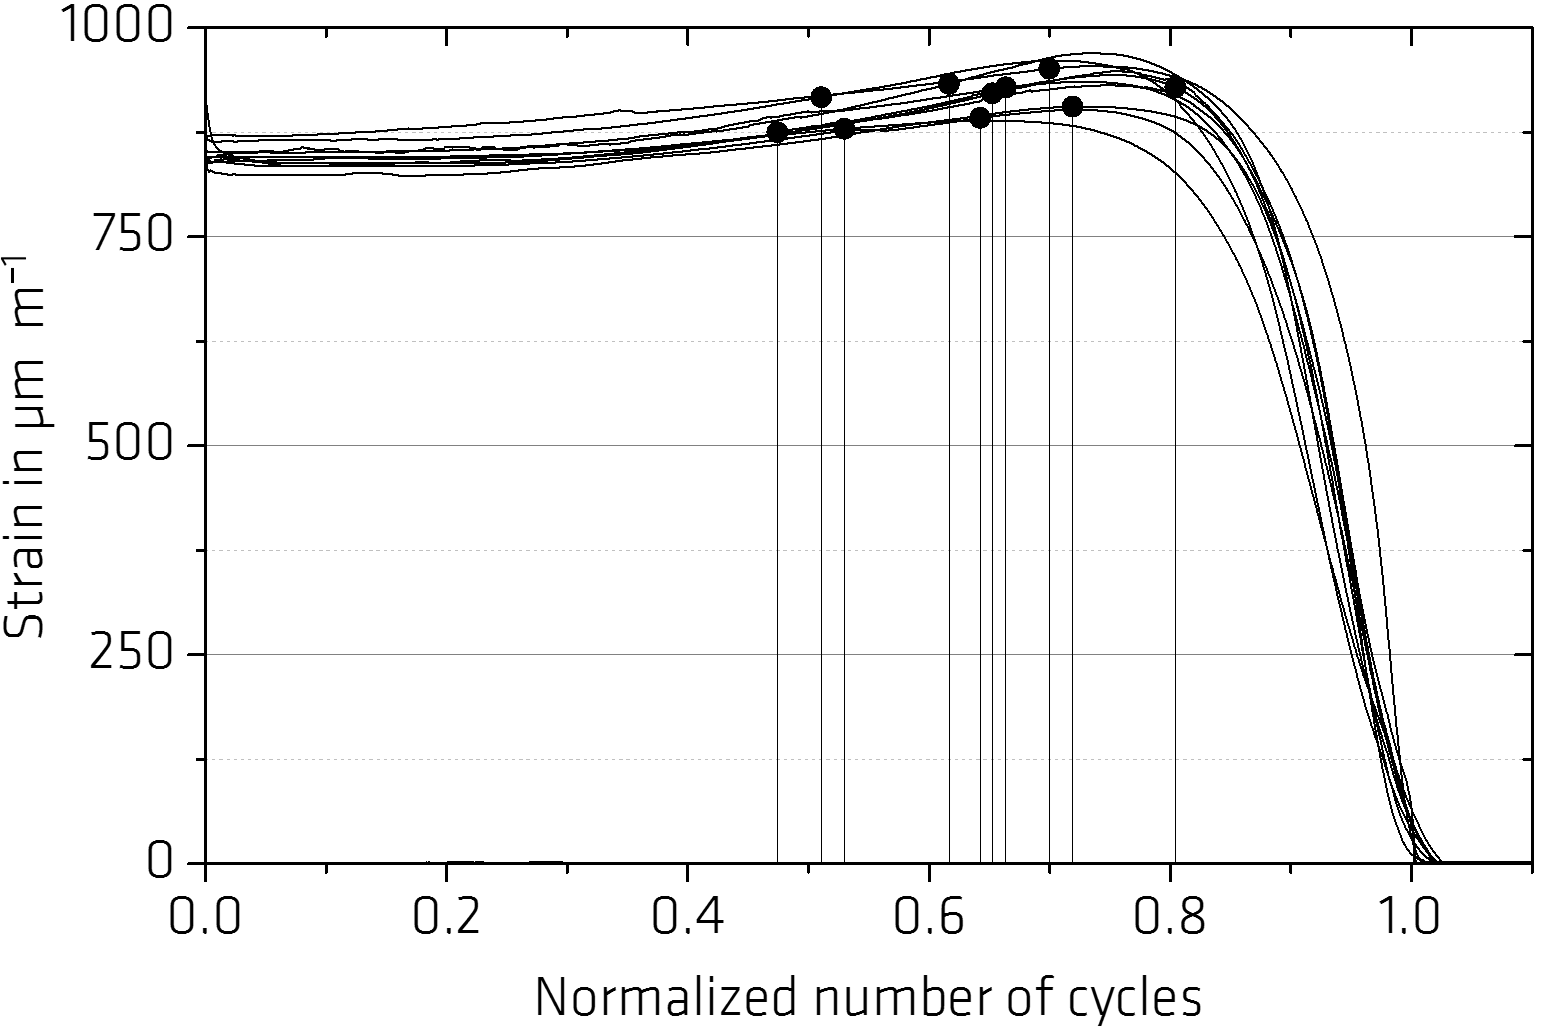
Figure 7Strain evolution of 10 specimens (metal sheets with notches), each with a marked cycle of crack detection by luminescence. The number of cycles was normalized with fracture cycle number on the horizontal axis and strain amplitude on the vertical axis.
Welds almost always cause defects in metal structures. Especially the edges of weld seams are fatigue vulnerable structural zones and the origin of most cracks. Therefore, the crack luminescence method was also tested on butt welds. The cross section of the steel specimen (S355J2+N/unalloyed structural steel) is 80×40 mm2 in dimension at the narrowest part of the specimen. Fatigue damage was caused in cyclic tensile tests as well. The tests were monitored by permanent strain measurement and video capture. Figure 3 shows the test setup. UV lamps permanently irradiated the covering layer of the luminescence coating at the weld. The number of cycles was captured in the video to simplify the synchronization with the measured strain over time. The loading frequency was 10 Hz. In Fig. 8 a butt weld before and after the application of the fluorescing layer is shown. Strain gauges and crack luminescence coating were applied on both sides due to the unpredictable location of the occurring crack. As seen in Fig. 8 the gauges are located across the complete welding. Figure 8 shows four different stages of the crack formation. The first stage is after 27 % of the specimen's lifetime, with no changes in the coating yet.
Due to the wanted low thickness of the covering layer, some light emissions are visible. This affects the crack detection only slightly. The initial blinking occurred after about 380 000 cycles (59 %) at the edge of the weld, the later point of fracture. This early slight light emission was only noticeable in the motion pictures. It became more significant after 400 000 cycles (stage II), but was still hard to see in a snapshot image. After 583 300 (90 %) cycles at stage III the crack reached a significant length and at 647 756 cycles the specimen fractured completely.
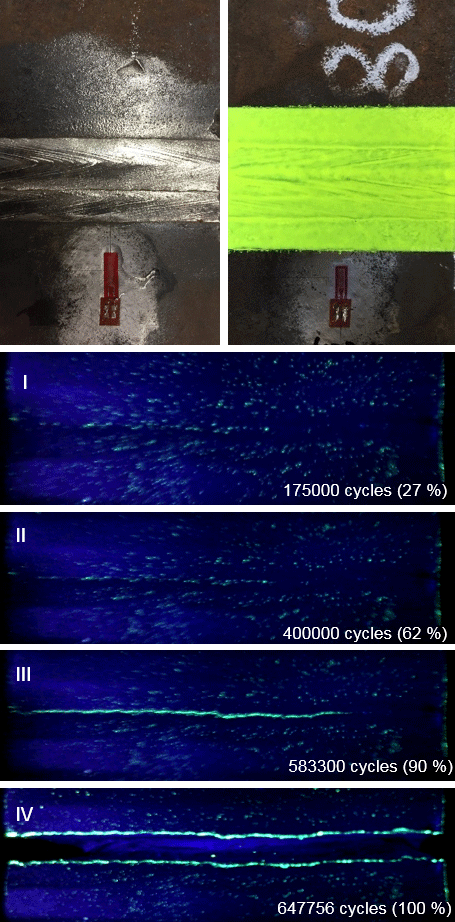
Figure 8Butt weld without (top left) and with (top right) a fluorescence layer and stages I to IV of crack formation.
The evolution of strain during the test measured with the two gauges DMS1 and DMS2 is shown in Fig. 9, where the described four stages of crack detection are also marked. DMS1 is located on the side where the crack occurred and DMS2 on the opposite side. For that reason, the measured strain of DMS1 should decline during crack evolution and strain of DMS2 should increase. At the first stage, the strain values of both gauges increased to a certain value. At mark II (62 %) DMS1_max starts to decrease, which is a sign for the crack formation. The strain of DMS2 did not show any changes at this stage. The brightness and blinking of the crack consistently increase with the number of cycles. The strain of DMS2 first increases at stage III, when the crack is already remarkably clear to see. At this stage (90 %) the maximum strain of DMS1 decreased by 5 %. The increase in DMS2 and the decrease in DMS1 is exponential from the moment of crack formation. After 647 756 cycles the specimen fractured, which is also seen in the evolution of strain at stage IV.
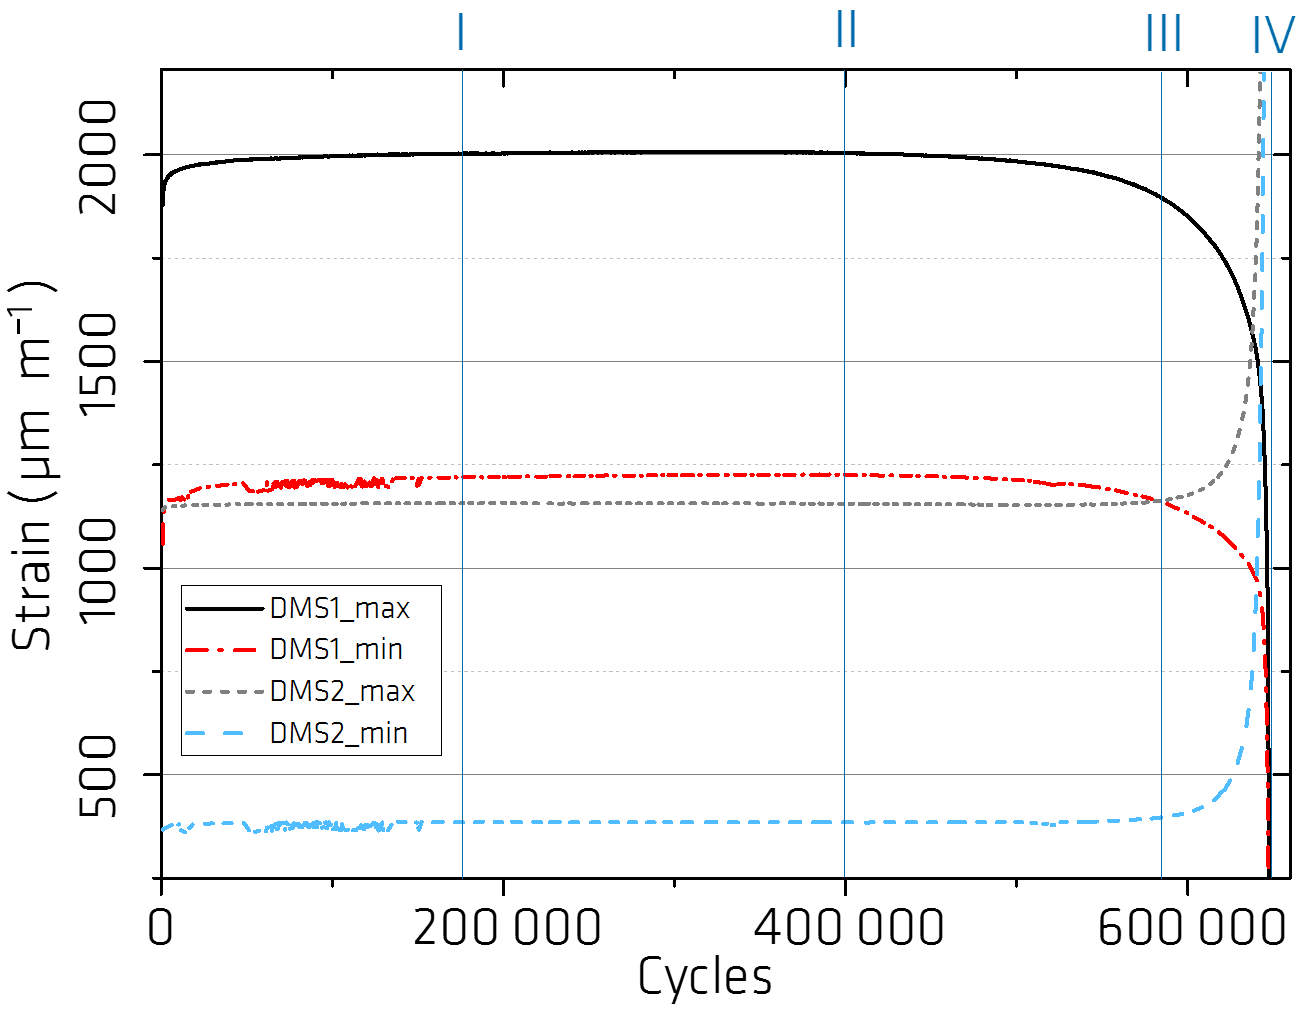
Figure 9Evolution of strain (butt weld) with stages of crack detection: I) no changes in the luminescence coating, II) first weak blinking, III) clearly visible crack, IV) fracture of the specimen.
The described results show a sensitive reaction of crack luminescence. The coating announces the crack due to light emissions even slightly before the decrease in strain at DMS1. In Fig. 10, four similar weld joints are shown which were tested in the same way. The number of cycles is marked at the point of time the crack was detected due to emitting light of the luminescence. Except for specimen S6P08, the luminescence reveals the forming crack before any significant differences in the measured strain were observed.
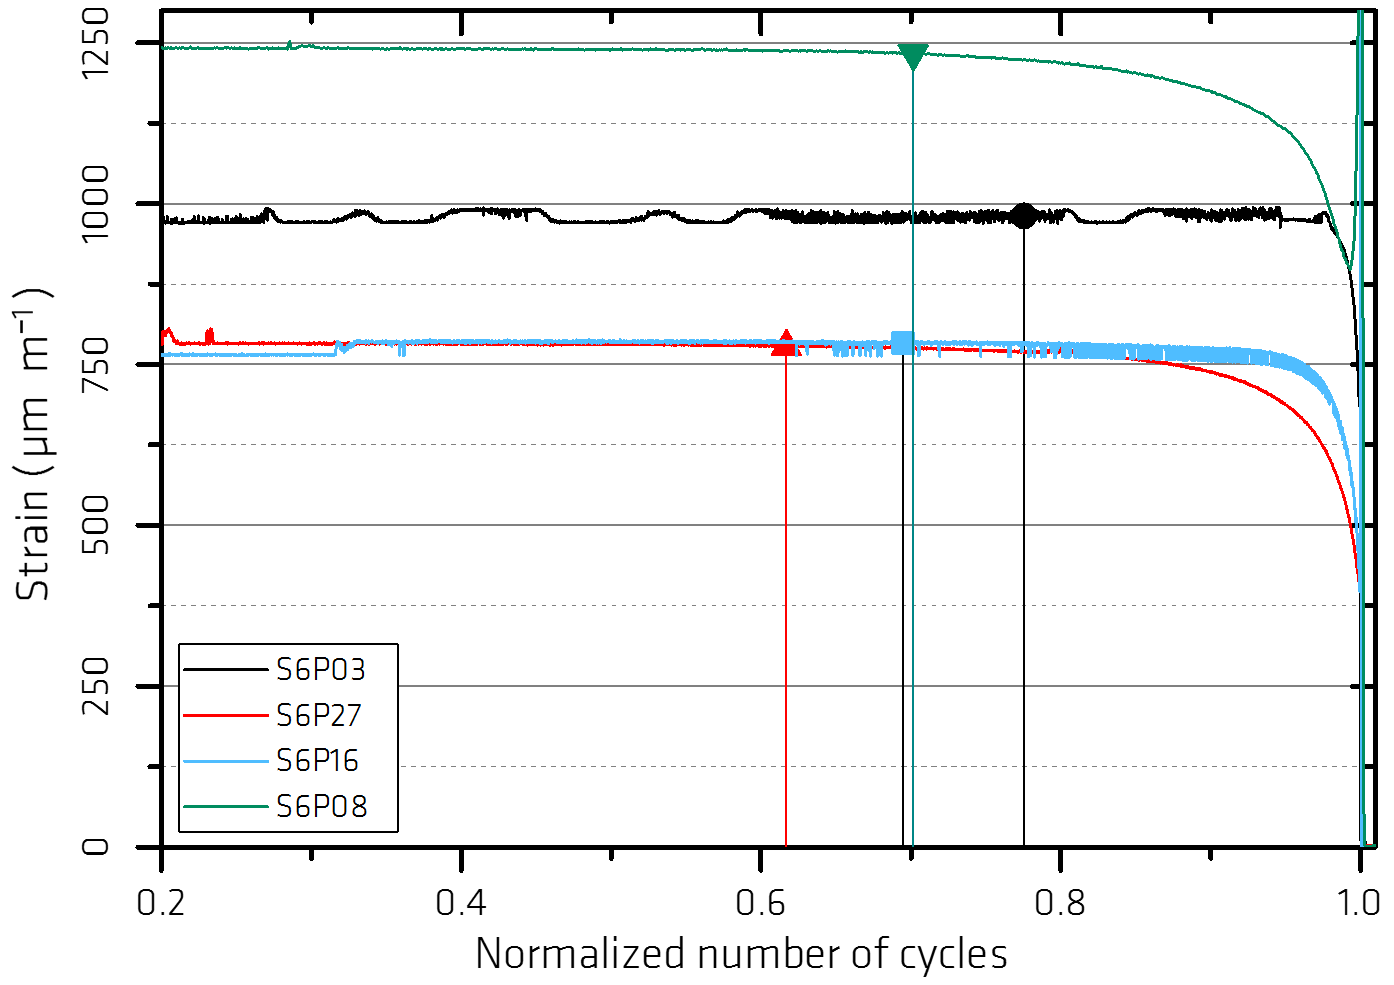
Figure 10Strain evolution of four specimens (welt joint), each with a marked cycle of crack detection by luminescence. The number of cycles was normalized with fracture cycle number on the horizontal axis and strain amplitude on the vertical axis.
The results of the described studies demonstrate a high sensitivity of the crack luminescence method. All tests indicated an early detection of the crack which was in good agreement with the strain measurements or even slightly before significant changes in the measured strain, as seen in Figs. 9 and 10. This shows that the method is very suitable for examinations of crack growth behavior. The experimental procedures also clarify the dependency of measured strain based crack detection from the correct location of the gauges. Especially the tests performed on the welded specimens are good examples of the limitation of crack detection by strain gauges. If only the one gauge, DMS2, has been applied, the incipient crack formation would have been detected too late (see Fig. 9). In future research activities crack propagation gauges (RDS) could improve the monitoring of the crack's evolution to evaluate the luminescence method, for example on specimens where the location of the occurring crack is known, like the notched thin metal sheets.
Using conventional crack detection methods, uneven surfaces cause an increased examination effort, whereas for crack luminescence, the surface quality does not matter. The crack luminescence allows the application on any large and uneven surface without knowing the exact location of the crack in advance. This makes the method ideal for continuous monitoring by using a camera technique which is useful especially at locations hard to access. The proposed approach is promising for supporting inspections of stressed and fatigue loaded structural parts. The method is also and especially helpful for the monitoring of dark areas, where cracks in general are hard to see. Crack luminescence is advantageous not only for application on undamaged structures or components. By applying the coating on possibly damaged parts, it is feasible to notice any further growth of existing cracks or new crack formations. For structure operating companies crack luminescence will have a significant impact on operations and maintenance (O&M) strategies, especially in association with the implementation of automation technology. That can avoid the necessity to shut down operating systems due to inspection issues and might also go along with an extension of the residual lifetime of such structures.
Until now, all investigations about crack luminescence were made in laboratories where the resistance against environmental influences was not analyzed. The multilayer system described in Deardoff (2009) shows that fluorescence coatings may have the ability to detect corrosion. This reveals a possible risk to cross sensitivity of the crack luminescence method. Influences on the sensitivity detecting cracks by corrosion have not been examined up to now. Further studies will focus on industrial applications, the applicability to several materials and the combination of crack luminescence and corrosion prevention paint.
Another way to use luminescence technology as a detection method for fracture and damage is mechanoluminescence (ML) (Timilsina et al., 2017). To be more precise, the used phenomenon is called fracto- or tribo-luminescence, where the breaking of chemical bonds causes the emitting of light. Using paint which includes mechanoluminescent powders, cracks become visible due to the mechanic stimulation of the paint by stress fields, while cracking of the test material causes the emission of light. This makes a UV source unnecessary for inspection, which would be a significant advantage. Mechanoluminescence will be useful for detecting cracks as long as variation of stress is existent as described in Yoshida et al. (2017). In cases in which structures are loaded and damaged in various ways, new cracking and according light emission by ML will effect an undetectability of existing cracks, if they originate from different loading. The advantage of the fluorescence method presented in this article provides light emission (under UV-A light source) also in an unloaded state, which makes the inspections without camera technology more reliable.
The data are not publicly accessible due to confidential information about third-party specimens.
The supplement related to this article is available online at: https://doi.org/10.5194/jsss-7-259-2018-supplement.
The authors declare that they have no conflict of interest.
This article is part of the special issue “Sensor/IRS2 2017”. It is a result of the AMA Conferences, Nuremberg, Germany, 30 May–1 June 2017.
This work was supported by the Federal Ministry for Economic Affairs and
Energy under the Zentrales Innovationsprogramm Mittelstand (ZIM) program
(central innovations program for small and medium sized enterprises), project
KF2201092ZG4. We also thank the Fraunhofer Research Institution for Large
Structures in Production Engineering IGP for the permission to use fatigue
tests on welded steel specimens for extra investigations regarding the
reliability of crack luminescence.
Edited by: Robert Kirchner
Reviewed by: two
anonymous referees
Deardorff, J. R.: Non-destructive Testing for Protective Coatings: Implementing a Lifetime Corrosion Prevention Program, Metal Finishing, 31–39, 2009.
EN ISO 3452-1:2013: Non-destructive testing – Penetrant testing – Part 1: General principles (ISO 3452-1:2013, Corrected version 2014-05-01), 2013.
EN ISO 9934-1:2016: Non-destructive testing – Magnetic particle testing – Part 1: General principles (ISO/FDIS 9934-1:2016), 2016.
Jang, I.-Y., Kim, S.-K., Kim, J.-S., Ann, K.-Y., and Cho, C.-G.: Detection of Reinforced Concrete Crack Using Mechano-Luminescence Paint, Applied Mechanics and Materials, 316–317, 1049–1054, 2013.
Lakowicz, J. R.: Principles of Fluorescence Spectroscopy, Kluwer Academic / Plenum Publishers, ISBN: 978-0-387-31278-1, 1999.
Lassen, T. and Récho, N.: Fatigue life analyses of welded structures, John Wiley & Sons Ltd., ISBN: 978-1-905209-54-5, 2006.
Makris, R.: Crack luminescence as innovative Method for detection of fatigue damage, AMA Conferences 2017 – SENSOR 2017 and IRS2 2017, Nürnberg, 2017.
Mehdianpour, M. (inventor): Bundesanstalt für Materialforschung und -prüfung, assignee., Crack detection and crack monitoring by means of luminescence, European patent EP2693204 A1, 2014.
Mehdianpour, M.: Risslumineszenz – Ein neues Verfahren zur Detektion und Überwachung von Ermüdungsrissen. Tagungsband VSVI Seminar 2015 Brücken- und Ingenieurbau, Vereinigung der Straßenbau – und Verkehrsingenieure in Nordrein-Westfalen e. V., Braunschweig, 2015.
Pook, L.: Metal Fatigue, What it is, Why it Matters, Springer, https://doi.org/10.1007/978-1-4020-5597-3, 2007.
Radaj, D. and Vormwald, M.: Ermüdungsfestigkeit – Grundlagen für Ingenieure, https://doi.org/10.1007/978-3-540-71459-0, 2007.
Radaj, D., Sonsino, C. M., and Fricke, W: Fatigue Assessment of Welded Joints by Local Approaches, Woodhead Publishing Ltd, https://doi.org/10.1002/mawe.200690038, 2006.
Richard, H. A. and Sander, M.: Ermüdungsrisse – Erkennen, sicher beurteilen, vermeiden, 26 ff, ISBN: 978-3-8348-0292-7, 2009.
Suresh, S.: Fatigue of materials, Cambridge University Press, https://doi.org/10.1017/CBO9780511806575, 1994.
Timilsina, S., Kim, J. S., Kim, J., and Kim, G.-W.: Review of State-of-the-Art Sensor Applications Using Mechanoluminescence Microparticles, Int. J. Precis. Eng. Man., 17, 1237–1247, 2016a.
Timilsina, S., Bashnet, R., Kim, S. H., Lee, K. H., and Kim, J. S.: A life-time reproducible mechano-luminescent paint for the visualization of crack propagation mechanisms in concrete structures, Int. J. Fatigue, 101, 75–79, 2016b.
Yoshida, A., Liu, L., Tu, D., Kainuma, S., and Xu, C. N.: Mechanoluminescent Testing as an Efficient Inspection Technique for the Management of Infrastructures, Journal of Disaster Research, 12, 506–514, https://doi.org/10.20965/jdr.2017.p0506, 2017.