the Creative Commons Attribution 4.0 License.
the Creative Commons Attribution 4.0 License.
 | 28 May 2018
Novel method for the detection of short trace gas pulses with metal oxide semiconductor gas sensors
Tobias Baur
Caroline Schultealbert
Andreas Schütze
Tilman Sauerwald
A novel method for the detection of short pulses of gas at very low concentrations, the differential surface reduction (DSR), is presented. DSR is related to the temperature pulsed reduction (TPR) method. In a high temperature phase, e.g., at 400 ∘C, the surface of a metal oxide semiconductor gas sensor (MOS) is oxidized in air and then cooled abruptly down to, e.g., 100 ∘C, conserving the large excess of negative surface charge. In this state reactions of reducing gases with surface oxygen are strongly favored, which increases the sensitivity. Due to the large energy barrier between metal oxide grains caused by the excess surface charge, a highly precise electrical measurement at very low conductance (down to 10−11 S) is a prerequisite for this method. Moreover, the electrical measurement must be very fast to allow a good resolution of retention times. Applying the method to a doped SnO2 detector, gas pulses down to a dosage of 1 ppb times seconds can be detected. The gas transport inside the detector is simulated using the finite element method (FEM) to optimize the gas transport and to keep response and recovery time as short as possible. With this approach, we have demonstrated a detection limit for ethanol of below 47 fg.
- Article
(2051 KB) - Full-text XML
- BibTeX
- EndNote


Gas chromatography (GC) is a very versatile method for the analysis of gases as it allows the separation of different gases over time. For gas analysis, GC combined with mass spectrometry (MS) is the gold standard, but it is restricted to large and relatively high-cost systems mainly for laboratory use. However, the demand for mobile gas analysis systems has steadily increased over the past few years, especially for selective detection of trace gases, e.g., for outdoor (Mead et al., 2013; Spinelle et al., 2015, 2017) or indoor air quality measurement (Geiss et al., 2011; Koistinen et al., 2008) or medical diagnostics (Bajtarevic et al., 2009). For some applications sensors and adaptable sensor arrays have been investigated (Leidinger et al., 2015; Roberts et al., 2014; Sasahara et al., 2007). The classification of various hazardous VOCs at ppb concentration level has been demonstrated by some of us in earlier works using metal oxide sensors combined with temperature cycled operation (TCO) and pattern recognition as well as with novel MOF-based micro-preconcentrators (Leidinger et al., 2014; Wilhelm et al., 2016). Under ideal conditions this facile approach allows low-cost, online measurements with sub-ppb accuracy (Leidinger et al., 2017). However, the training effort for a sensor array approach – independent if a virtual multi-sensor or a physical array approach is used – increases strongly with the number of gases because combinations of gases at various concentrations need to be tested to identify potential interactions between gases. For complex gas mixtures a chromatographic system, therefore, seems to be more adequate. The miniaturization of the chromatographic system is a prerequisite for many applications to ensure mobility and reduce system costs. The miniaturization of GC columns (µGC) (Sanchez et al., 2010; Zampolli et al., 2005) and additional building blocks like injectors and sampling units (Trzciński et al., 2017; Zampolli et al., 2007) has been investigated intensively and proven to be feasible. However, these systems are restricted in the choice of detectors compared to lab equipment. The most common GC detector principles, the flame ionization detector (FID) and the mass spectrometer (MS), cannot be scaled to miniature size without loss of performance, i.e., time of operation due to gas consumption for FIDs or loss of resolution for MS. Detectors for µGC are therefore an important research topic. In addition to the miniaturization of common detector principles like, e.g., TCD (thermal conductivity detector) (Mahdavifar et al., 2015) and PID (photoionization detector) (Narayanan et al., 2014), the combinations with other detector principles, e.g., nanocantilevers (Chapman et al., 2007) or ion mobility spectroscopes (Eiceman et al., 2002), have been demonstrated. The combination with metal oxide semiconductor (MOS) gas sensors also goes back many decades (Bârsan and Ionescu, 1994). MOS sensors are very sensitive (Zampolli et al., 2005), inexpensive and able to detect a broad range of gases. Recently, we have demonstrated that the sensitivity of MOS sensors can be increased significantly by a certain temperature cycled operation (TCO) mode (Baur et al., 2015) and that the quantity of gas can be derived directly from the sensor signal using a simple model for the surface reduction process (Schultealbert et al., 2017). From this starting point, this article demonstrates a new method of using a MOS sensor to detect short trace gas pulses called differential surface reduction (DSR) which shows an unprecedented detection limit and stable detection properties. This method of course is not limited to the use as GC detector, but can also improve the capabilities of sensor-micro-preconcentrator systems.
A GC detector detects the amount of substance during peaks generated by the separation of gas mixtures in the GC column. In the time interval [t0,t] at a constant volume flow , the amount of substance n of one peak passes the sensor. In gas measurements, the concentration c is generally the mole fraction x of the analyte. The relationship between the amount of substance n and the time-dependent concentration c(t) can be written with the molar volume Vm as Eq. (1).
In the case of a constant carrier gas flow, the amount of substance is proportional to the integral of the gas concentration c. In most measurement setups, the volume flow and molar volume are well-known constants. To determine the amount of substance in a peak with a MOS sensor therefore requires a signal proportional to the concentration. A suitable signal is the reverse rate constant of the surface coverage, i.e., the desorption of surface oxygen, due to supplied reducing gas. In a previous work we introduce this process as DSR (Baur et al., 2017). The concept of DSR is based on a model for MOS sensors with temperature-modulated operation (Baur et al., 2015; Schultealbert et al., 2017). In this model, the conductance of MOS sensors is limited by grain–grain boundaries which depend on surface charges that can be modeled by surface state trapping.
A widely accepted model for the conductance of the grain–grain boundaries dates back to Morrison and Madou (1989). A depletion zone near the surface is formed by electrons of the n-type semiconductor being bound to ionosorbed oxygen. Conduction electrons must overcome the resulting energy barrier Eb for a current flow across the grain–grain boundaries. Barsan and Weimar (2001) showed that a similar model can also be used for nanocrystalline sensors in which the whole grain is part of the depletion zone. Therefore, the conductance of the sensor can be described by (Madou and Morrison, 1989)
with the Boltzmann constant kb, the temperature T of the sensor film and a prefactor G0. The energy barrier is defined by (Madou and Morrison, 1989; Schultealbert et al., 2017)
with the donor density Nd, the occupied surface states Ns, the elemental charge q, the permittivity of SnO2 εr and vacuum ε0. is the normalized surface state according to Schultealbert et al. (2017).
We assume that the sensor can be modeled with good accuracy by reducing the complexity of the model to a minimum. The following idealizations can be made.
- ii.
The sensor is described by a single grain–grain boundary.
- i.
The surface charge is caused by a single species of adsorbed oxygen.
- iii.
The adsorbed oxygen reacts in a single step reaction with the reducing gas and the reaction rate is linear to the gas concentration.
A real sensor is normally a granular layer with a multitude of grain boundaries and other transport mechanisms, e.g., necks from strongly sintered grains. However, the conductance of the sintered grain is very high compared to the grain boundaries. Hence, the resistance will be dominated by the serial grain–grain boundaries. According to Eq. (3) all grain boundaries have the same barrier height, and nanocrystalline material with fully depleted grains shows an equivalent behavior. The surface charge can be measured by the thermal activation of the sensor layer. Although assumption (i) seems a strong idealization of the sensor, earlier work on the investigated sensor type AS-MLV (ams AG) did prove that the sensor properties can be modeled quite accurately by this approach measuring the thermal activation of the conductance (Baur et al., 2015).
The types of oxygen species at the sensor surface are discussed controversially in the literature. There is no spectroscopic evidence for the oxygen interaction with metal oxides (Gurlo, 2006). Madou describes two different forms of adsorbed oxygen at the sensor surface (Madou and Morrison, 1989): atomic (O−) and molecular () ions. The formation of O− by dissociation is modeled by him in the form of a mass action law. Some authors attribute a change in sensor behavior over temperature around 350 ∘C to a change in the predominating oxygen species from to O− (Pulkkinen et al., 2001). Other authors expect the double charged atomic ion O2− to be the predominant species in dry air between 350 and 450 ∘C, and a competitive adsorption of O− and O2− around 300 ∘C (Suematsu et al., 2014). In humid air, water vapor is believed to block the O2− adsorption sites, changing the predominant species to O− (Yamazoe et al., 2012). For our model, however, precise knowledge of the dominant species is not necessary. We assume that for a certain temperature, the surface charge is dominated by one species of adsorbed oxygen ion at the surface (ii).
The chemical reaction of the gas with the surface can be either a direct reaction of the gas with the adsorbed oxygen (Eley–Rideal) or a reaction of the pre-adsorbed gas (Langmuir–Hinshelwood). In the second case, the number of adsorbed species may depend on not only the concentration, but also on the number of surface sites. For our experiment, the reducing gases are prevalent at very low concentrations. We assume that the reaction rate is, therefore, linear to the gas concentration. In the case of ethanol at low temperatures of 150 ∘C, a single step oxidation, (iii) namely the dehydration and formation of water, has been reported for SnO2 with various dopants (Cheong and Lee, 2006).
The functional principle of gas sensing with MOS sensors is based on oxidation and reduction on the surface (Ding et al., 2001). It affects an exchange of electrons between the conduction band of the semiconductor and adsorbed oxygen ions. The surface will be oxidized in clean air atmosphere. Reducing gas molecules interact and react with adsorbed oxygen ions. Thus, oxygen ions emit their electrons to the conduction band and the energy barrier will decrease (Ding et al., 2001; Madou and Morrison, 1989). Relating to Eq. (3), this means that the occupied surface states (oxygen ions) Ns will be increased with oxidation and decreased with reduction. Besides the energy barrier in Eq. (2), the temperature of the sensor film is an important factor concerning the conductance. In TCO, the MOS sensor temperature is changed periodically. With fast temperature changes the sensor is in non-equilibrium states with respect to the oxygen coverage on the surface during TCO (Schultealbert et al., 2017). Furthermore, the equilibrium oxygen surface coverage decreases with decreasing temperature. The relaxation of a non-equilibrium state to an equilibrium state takes places by different coupled oxidation and reduction processes. These processes depend on the type of gas and the temperature and can take from milliseconds at high temperatures to hours at low temperatures (Baur et al., 2015). Figure 1 shows a schematic Arrhenius plot of the logarithmic sensor conductance in TCO consisting of two temperature plateaus. Figure 1 also illustrates schematically the single grain to grain boundary in different states during the temperature cycle.
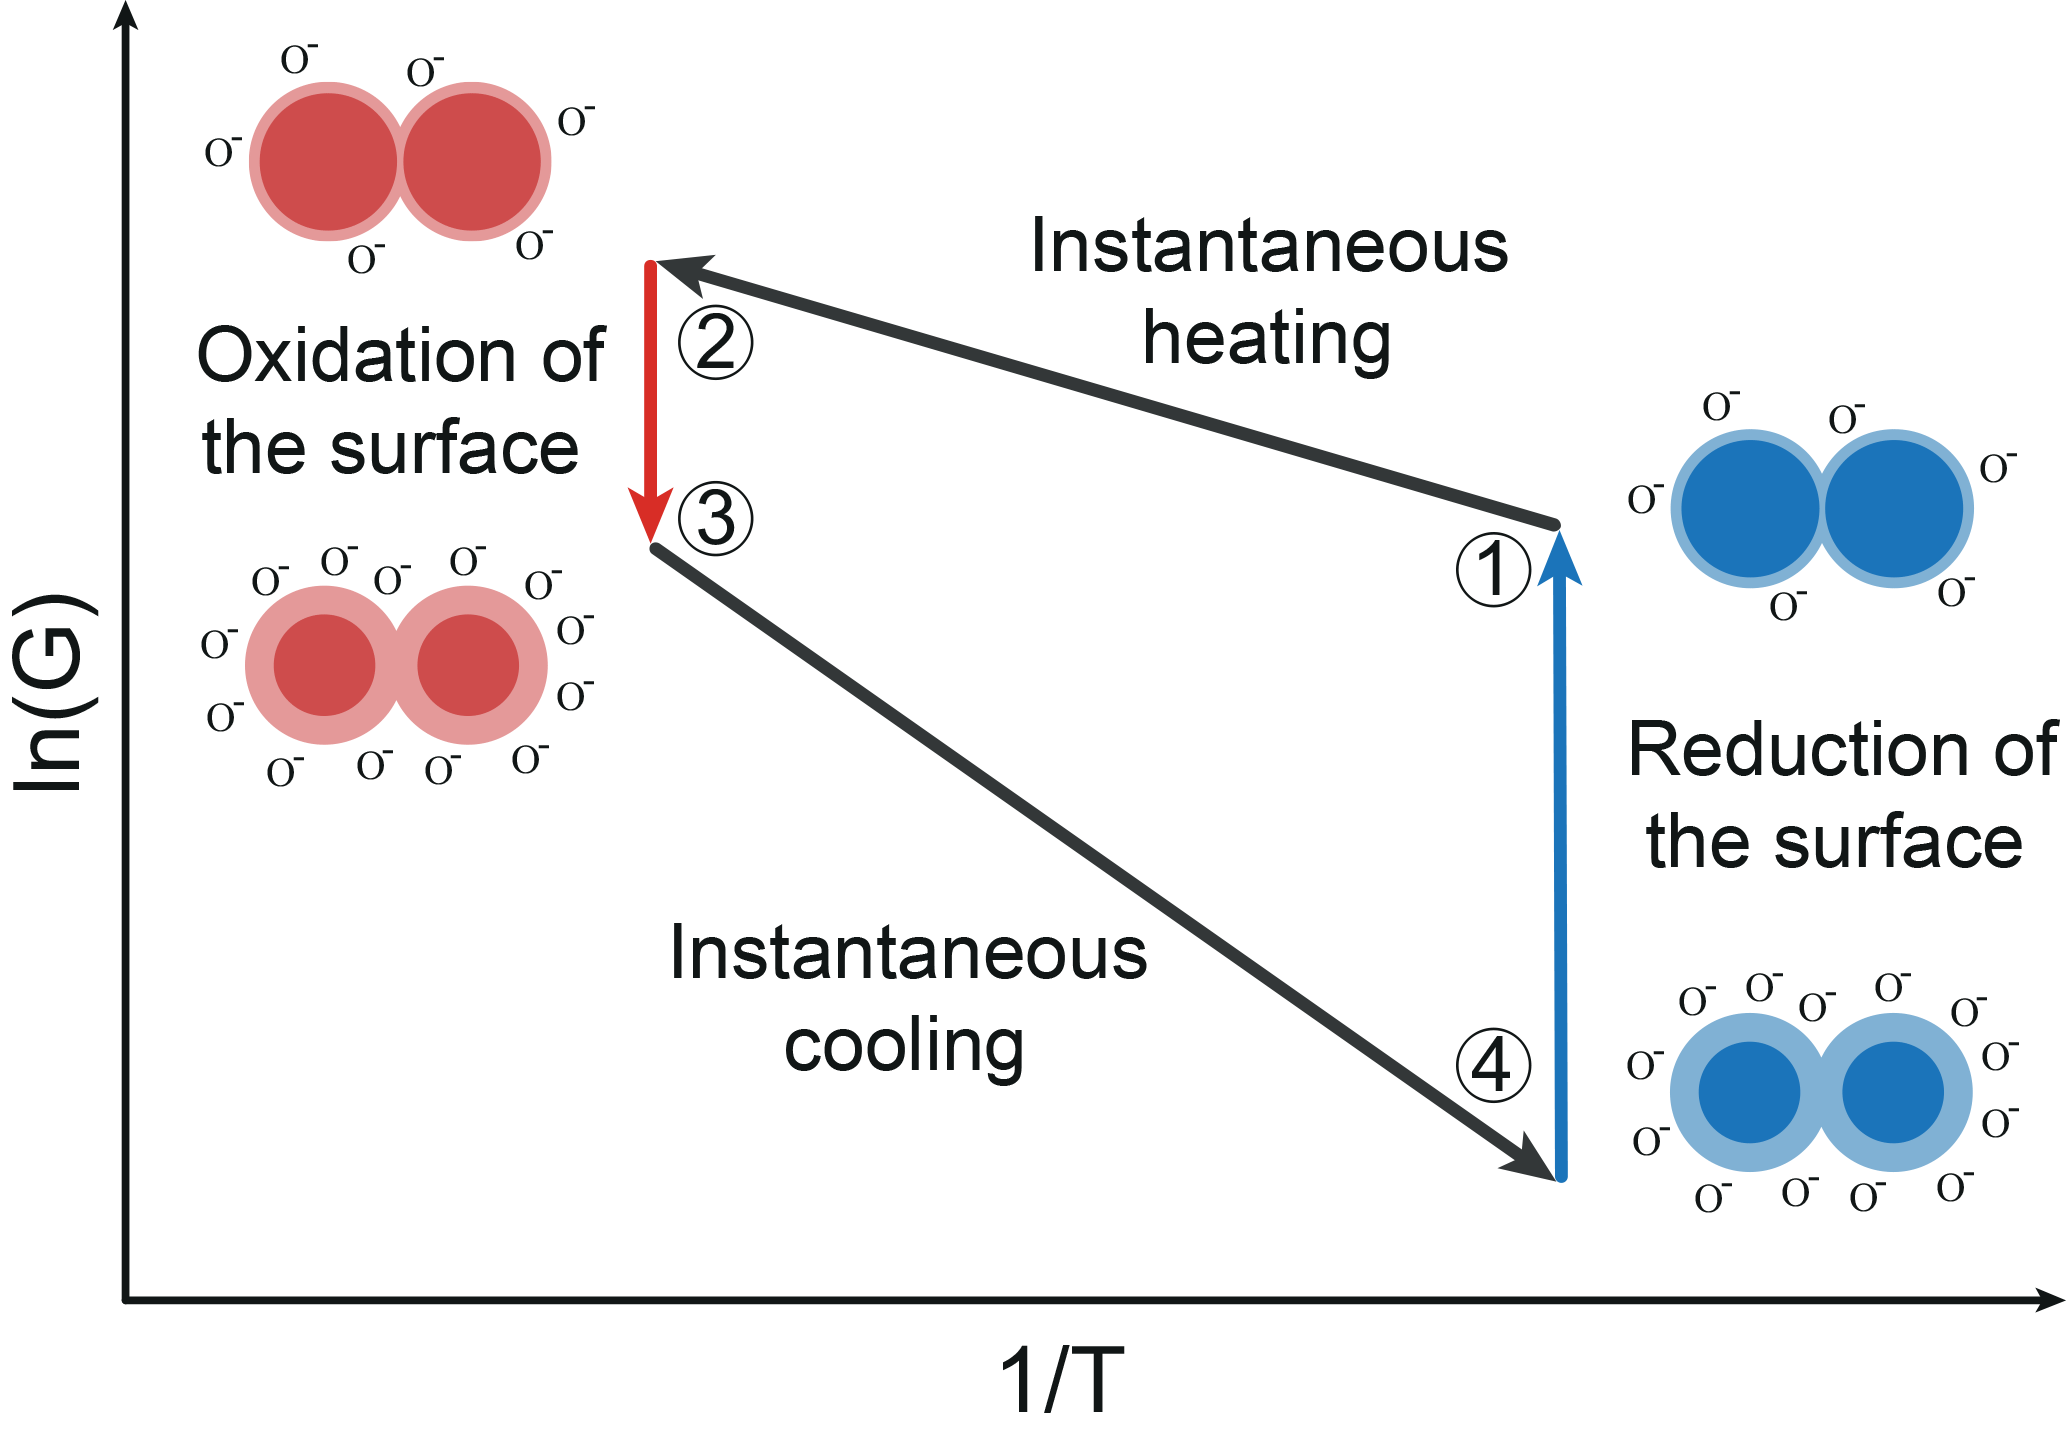
Figure 1Schematic Arrhenius plot of a MOS sensor and a schematic grain–grain boundary during TCO (Baur et al., 2017).
State 1 represents the low temperature equilibrium of the sensor with a low surface coverage. An instantaneous temperature increase from state 1 to 2 results in a non-equilibrium state of the sensor at high temperature. The temperature rise does not affect the surface coverage because of the comparatively slow oxidation and reduction processes (Baur et al., 2015). Regarding Eq. (2), a temperature increase with a constant surface coverage, i.e., a constant energy barrier, leads to a strong increase in the conductance. Then, the surface is slowly oxidized to reach the high temperature equilibrium with a highly covered surface (state 3). This increases the energy barrier and thus reduces the conductance, as shown by Eq. (2) for a constant temperature. An instantaneous temperature decrease from state 3 to 4 results in an abrupt decrease in the conductance in analogy to the change between state 1 and 2. Thus, the surface coverage in state 4 corresponds to the coverage of the high temperature equilibrium (state 3), which results in a high energy barrier and a very low conductance of the sensor. The surface coverage is reduced either by slow desorption of the ionosorbed oxygen or by reactions with reducing gases until the low temperature equilibrium surface coverage is reached. During this process, the conductance rises again until equilibrium is reached (state 4 to 1).
The beginning of the change from state 4 to 1 is the most important time section for the DSR. We have previously shown (Schultealbert et al., 2017) that for a short time (t≪τrelaxation) after a temperature step from state 3 to 4 the oxidation, i.e., additional ionosorption of oxygen, is negligible. The low equilibrium surface coverage at Tlow means that the high surface coverage must be reduced after the temperature step. Especially at low temperatures, this process is very slow in purified air, with time constants of several minutes. The time-resolved variation of the normalized surface states therefore depends mainly on the surface reduction caused by reducing gases. The time differential can be approximated by (Schultealbert et al., 2017)
Here, kd is the reverse reaction rate. For gas concentrations of ppb to low ppm levels, the reverse reaction rate can be split (Schultealbert et al., 2017):
with the combined reaction rate kd resulting from desorption by intrinsic processes, kd,air, and for the reaction with the ith reducing gas being present. If we look at a GC or pre-concentrator application the concentration of the supplied gas is time-dependent. The reaction rate kd,air is time-independent due to a constant background of purified air during a measurement. The solution of the time differential Eq. (4) with Eq. (5) is
The energy barrier is given by Eq. (3) and for short times after a temperature step the exponential function can be approximated with . The energy barrier is approximately
The time derivative of Eq. (7) is
The combination of the time derivative of Eq. (2) with Eq. (8) leads to Eq. (9).
Thus, the reaction rate kd,air is a constant offset during the measurement and can be removed with an offset correction. The energy barrier Eb(t0) at time t0 can be calculated from the conductance change during the temperature decrease, state 3 to 4 in Fig. 1 (Schultealbert et al., 2017). If we look at only one peak from a GC separation caused by a single gas, Eq. (9) can be rewritten as
We can assume that kd,gas(c) is proportional to c for small concentrations (Baur et al., 2015; Schultealbert et al., 2017). The amount of substance in the time interval [t0,t] with Eq. (1) is proportional to
Figure 2 shows a schematic sensor reaction to concentration peaks with different peak widths but the same dosage, i.e., the same concentration–time integral. The sensor jumps from high to low temperature at t0. During the relaxation at the low temperature stage, three different gas “peaks” with different width w=Δt but the same dosage d, i.e., constant concentration c with , are assumed. The slope of the sensor reaction changes due to the concentration change. However, according to Eq. (11) all three different peaks will result in the same shift of the sensor signal; i.e., the operating mode will result in a measured signal directly proportional to the dosage, i.e., the total amount of substance, in the GC peak.
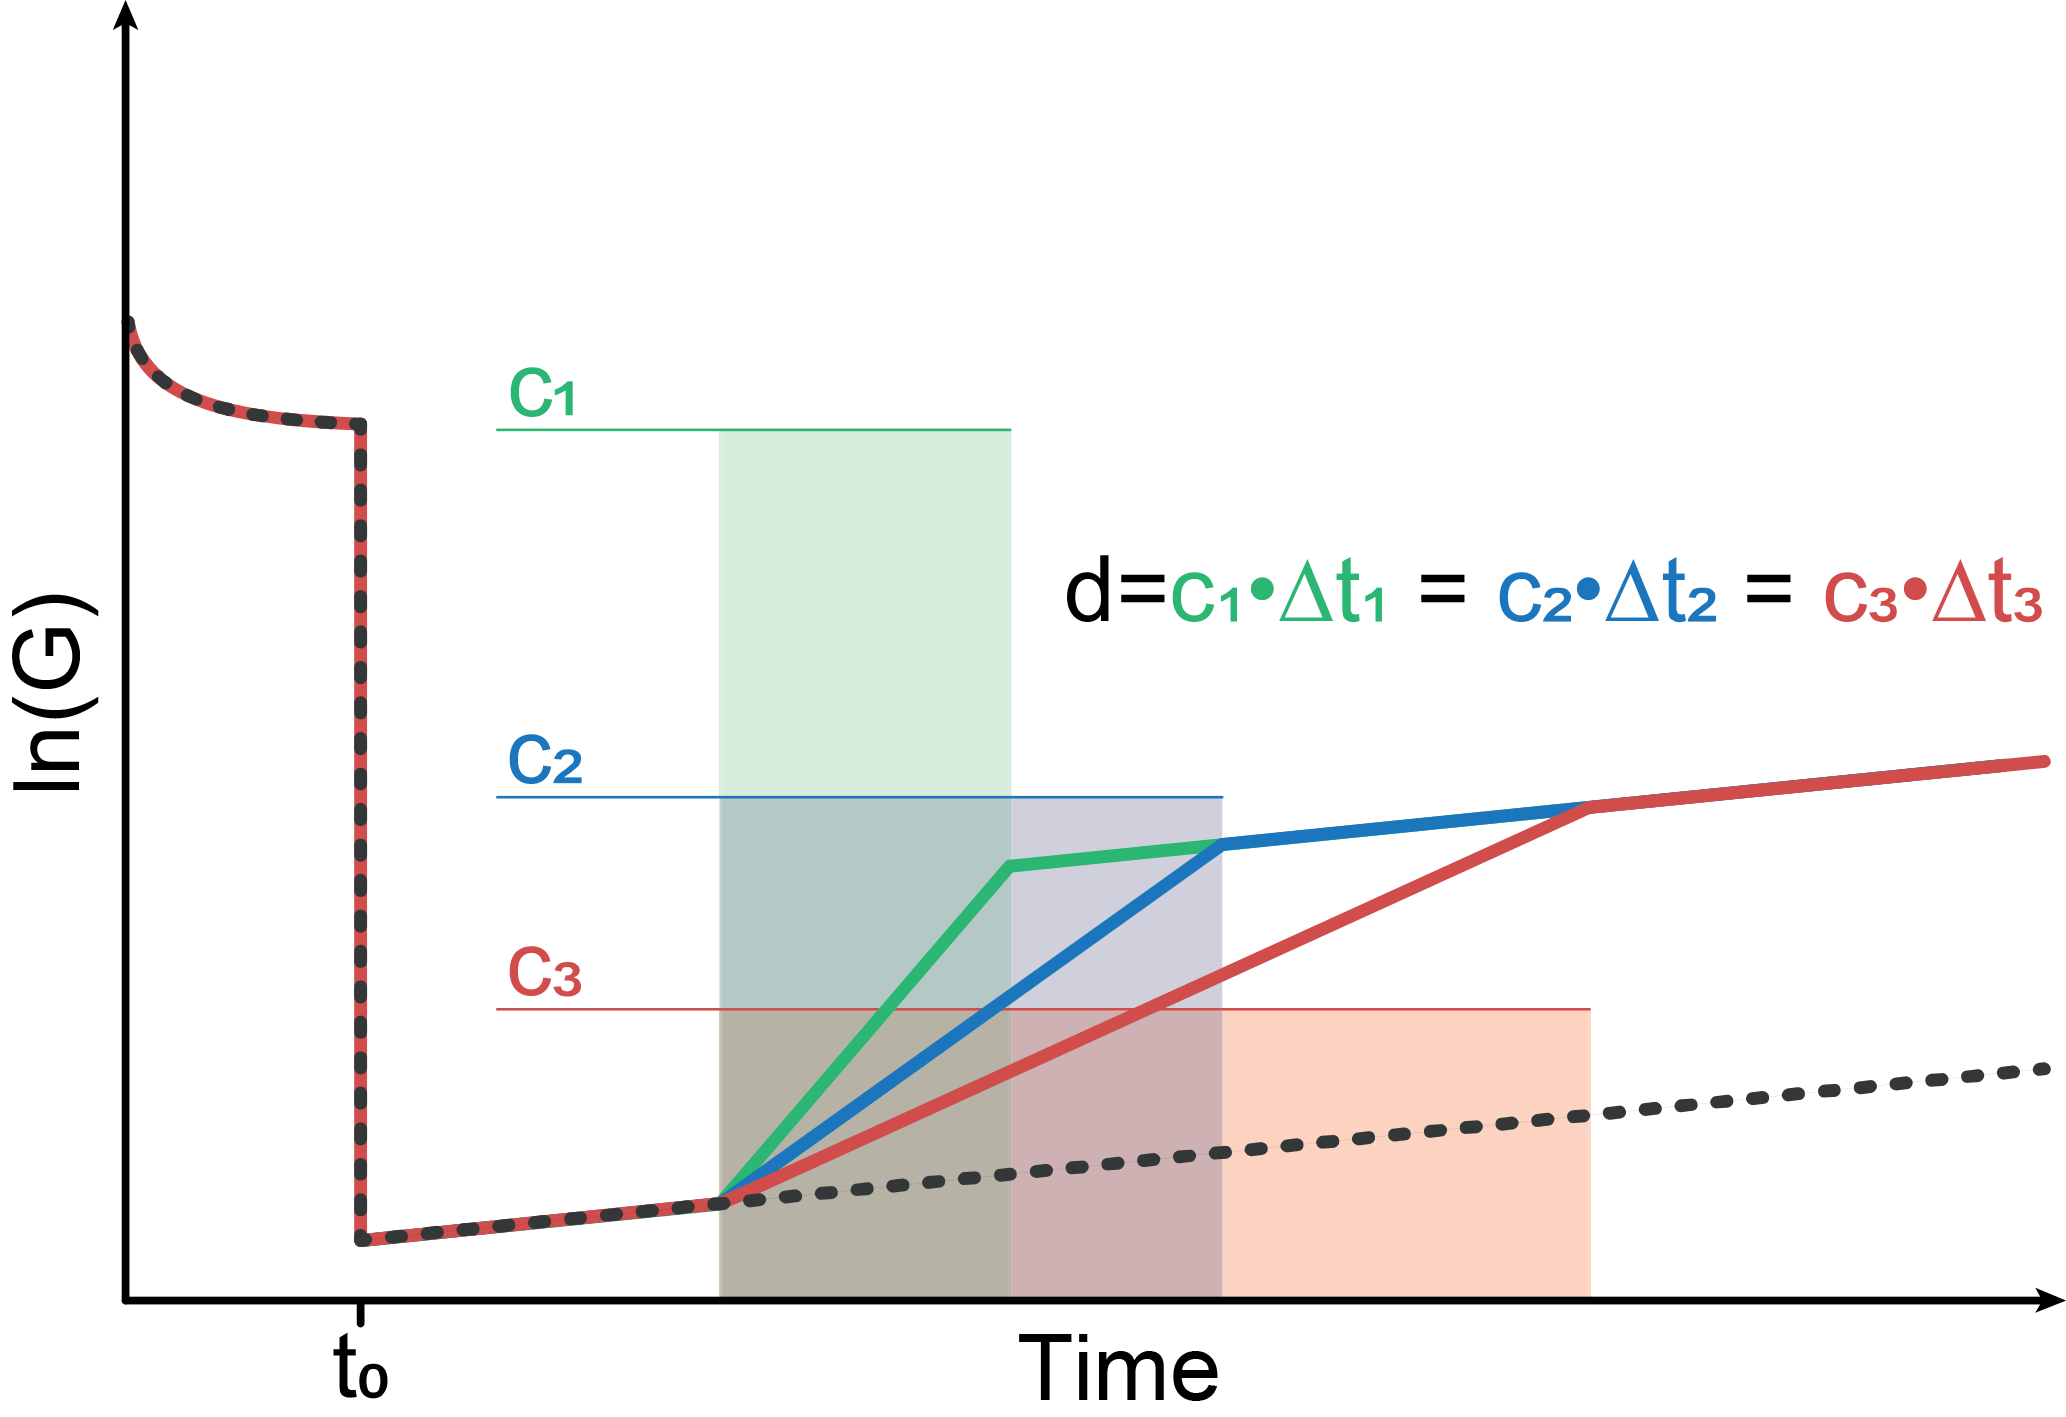
Figure 2Schematic conductance curve with a temperature jump from high to low temperature; during the relaxation at the low temperature stage, three peaks with different peak width and the same gas dosage are assumed.
Measurements were performed with a commercially available SnO2 sensor (AS-MLV, ams Sensor Solutions Germany GmbH) in TCO. The sensor is highly sensitive to VOCs (volatile organic compounds), e.g., for monitoring indoor air quality. The AS-MLV has a large dynamic range in TCO from 0.1 nS (10 GΩ) due to the non-equilibrium states up to 0.1 mS (10 kΩ) due to the high sensitivity. For exact temperature control and fast, high-precision measurement of the sensor conductance we use an electronic board developed in our group (Baur et al., 2018). The sensor temperature is controlled via the heater resistance with a digital PID (proportional–integral–derivative) controller. The time constant of the controller is much smaller than that of the sensor, allowing fast temperature changes from 400 to 100 ∘C within 50 ms. A resolution of 0.1 ∘C is feasible with this closed-loop control (Baur et al., 2018). The sensor signal read-out is based on the conversion of the sensor conductance into a voltage with a logarithmic amplifier. The core of the board is the LOG114 logarithmic amplifier from Texas Instruments (Texas Instruments Inc., 2007), which can measure currents from 100 pA to 10 mA, i.e., over 8 orders of magnitude. This read-out method is well adapted to the sensor model and the measured voltage scales with the change in the energy barrier and the rate constant (Eq. 10). An error in the voltage measurement of the logarithmic amplifier contributes linearly to the error for the rate constant. Over the entire measurement range, the error is dominated by the error of the voltage measurement (Baur et al., 2018).
With this version of the sensor electronic, it is possible to measure conductance in a range from 0.25 mS (4 kΩ) down to 0.25 nS (40 GΩ) with a data acquisition rate of 2 kHz. We achieve a relative resolution of better than 1 % per decade (Baur et al., 2018).
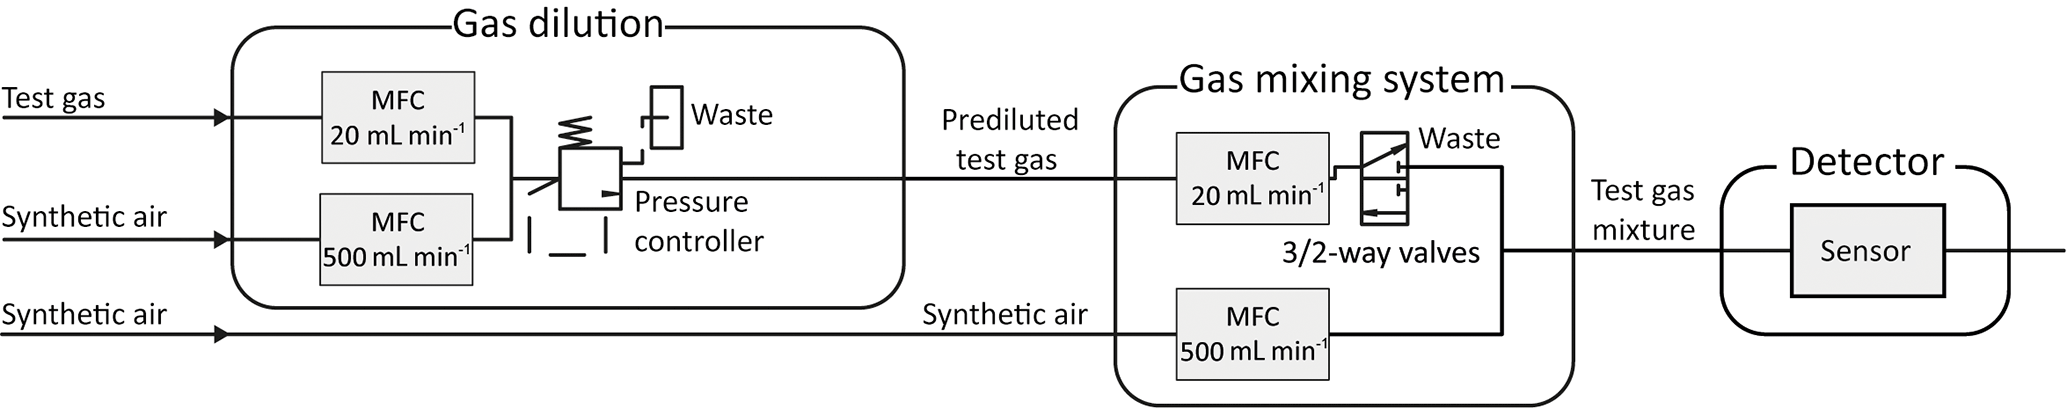
For the characterization of the sensors with trace gases, we use a gas mixing apparatus (GMA) with pre-dilution lines (Helwig et al., 2014). Figure 3 shows the schematic setup of the GMA. The sensitivity and response of various sensors can be tested by passing trace amounts of gas over the sensor in specific test chambers. For this purpose, the GMA uses gas dilution lines consisting of two mass flow controllers (MFC), one (e.g., 20 mL min−1) for the test gas and one (500 mL min−1) for the carrier gas. The outputs of the two pre-dilution MFCs are connected to each other and are kept at a constant pressure by a pressure regulator. According to Helwig et al. (2014), a dynamic concentration range cbootle∕csensor from 5 to 312 750 is reached, where csensor is the concentration over the sensor and cbottle is the concentration in the test gas bottle. Diluted gas is dosed via another MFC (20 mL min−1) and regulated by a 3∕2-way valve. The dilution line and a MFC (500 mL min−1) for dry synthetic air are combined in a mixing block. The carrier gas stream, in this case dry zero air, is automatically readjusted when a gas supply is switched on, so that the total flow across the sensor remains constant. Finally, a mass flow meter (MFM) measures the flow at the outlet. This makes it possible to simulate gas peaks with the same total amount of substance with different shapes. A two-stage cleaning process generates the zero air (Baur et al., 2017). Hydrocarbons (larger than C3) are removed efficiently in the first step with a carbon filter system, while CO2 and humidity are removed with a pressure swing. To remove smaller hydrocarbons as well as hydrogen and carbon monoxide, a catalytic conversion is used in the second step.
The detector (MOS sensor plus sensor chamber) must achieve two important properties for gas chromatography. It must show a high separation performance (low peak broadening and low tailing) and a good reproducibility (the same amount of substance must produce the same signals). As described above, the change in the sensor signal during a low temperature plateau is caused by the temporal concentration gradient at the sensor location. In addition to the concentration in the flow, it also depends on the flow velocity and the diffusion of the gas to the sensitive MOS layer of the sensor. Therefore, it is important to provide a sensor chamber that transports the carrier gas and with it the separated gas sample close to the sensor surface and that does not have any dead volumes or long diffusion paths. The fluidic design of the sensor chamber and the housing or cap of the sensor have a great influence on this. Since we used a commercially available AS-MLV sensor the geometry is limited at this point, but that standard TO5 lid was removed to allow better gas access and shorter diffusion distance. A specific sensor chamber as shown in Fig. 4 was developed, simulated and tested.
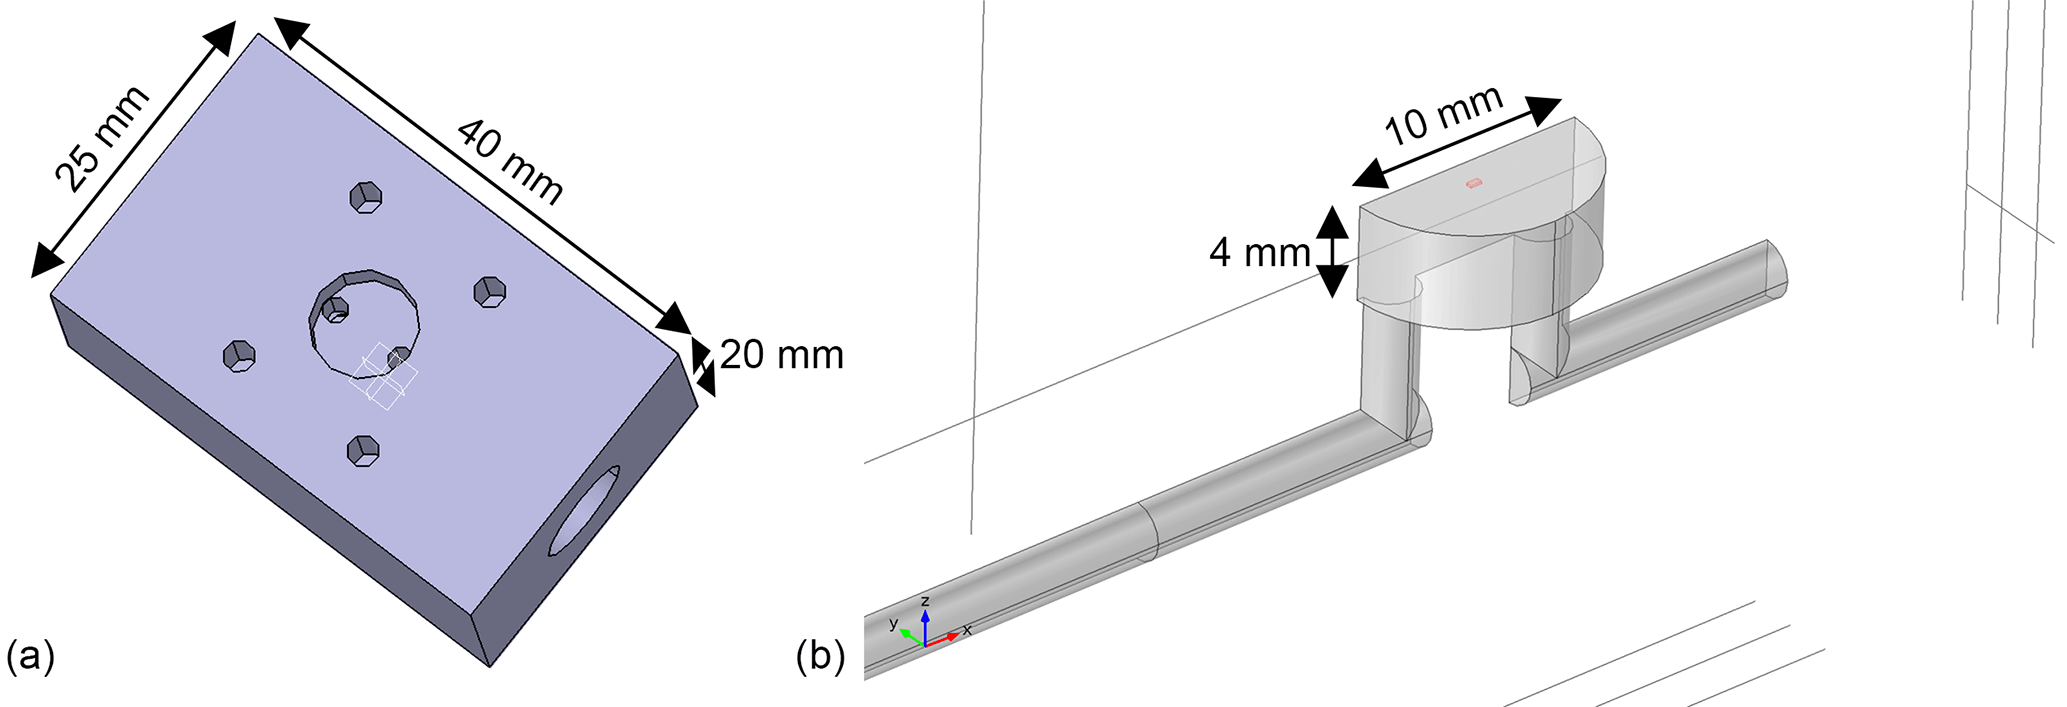
Figure 4Sensor chamber with low dead volumes and short diffusion paths from the carrier gas flow to the sensor surface for fast and sensitive peak detection. (a) CAD model showing the side where the sensor is mounted and fixed with screws. (b) 3-D model (cut in half due to symmetry) of the gas path used for simulations; the position and size of the gas-sensitive layer (500 × 500 µm2) are marked in red.
4.1 FEM simulations
To characterize the detector housing a FEM model using COMSOL Multiphysics was set up. The geometry was already shown in Fig. 4. Using the module Laminar flow and a stationary study the flow conditions inside the chamber are simulated. Applying this flow field to the Transport of diluted species model offers the possibility of investigating the shape evolution of incoming Gaussian peaks and estimating the maximum number of molecules that can reach and therefore react on the sensor surface. The parameters used for the simulation are a total flow rate of 100 mL min−1, a gas pulse with a Gaussian concentration profile with a standard deviation of 0.2 s at the inlet, a channel radius of 1.2 mm and the diffusion constant of the considered molecules (in this case toluene in air) of 8 × 10⁻⁶ m2 s−1. The cavity for the sensor itself has the footprint of a TO5 housing (radius 5 mm) and a height of 4 mm, resulting in a total volume of 0.31 mL. The sensor itself is represented by a rectangle with the estimated size of the sensitive layer (500 µm × 500 µm).
In a first step we investigated whether incoming Gaussian concentration peaks can be correctly detected at the sensor's position. For this purpose, the concentration over time at the entrance and at the sensor are shown in Fig. 5. Obviously, there is a time offset between both curves due to the transport through the channel and chamber. In addition, the maximum concentration is slightly lower (8.6 %) due to the peak broadening at the sensor. The FWHM is increased by the same ratio and thus the integral under the curve, i.e., the amount of substance in Eq. (11), which is measured, remains unchanged. This means that time resolution for GC systems is only slightly reduced with this design. Furthermore, the detector presented here can be improved to some extent by using a sensor without a TO5 footprint and an optimized detector housing and sensor chamber.
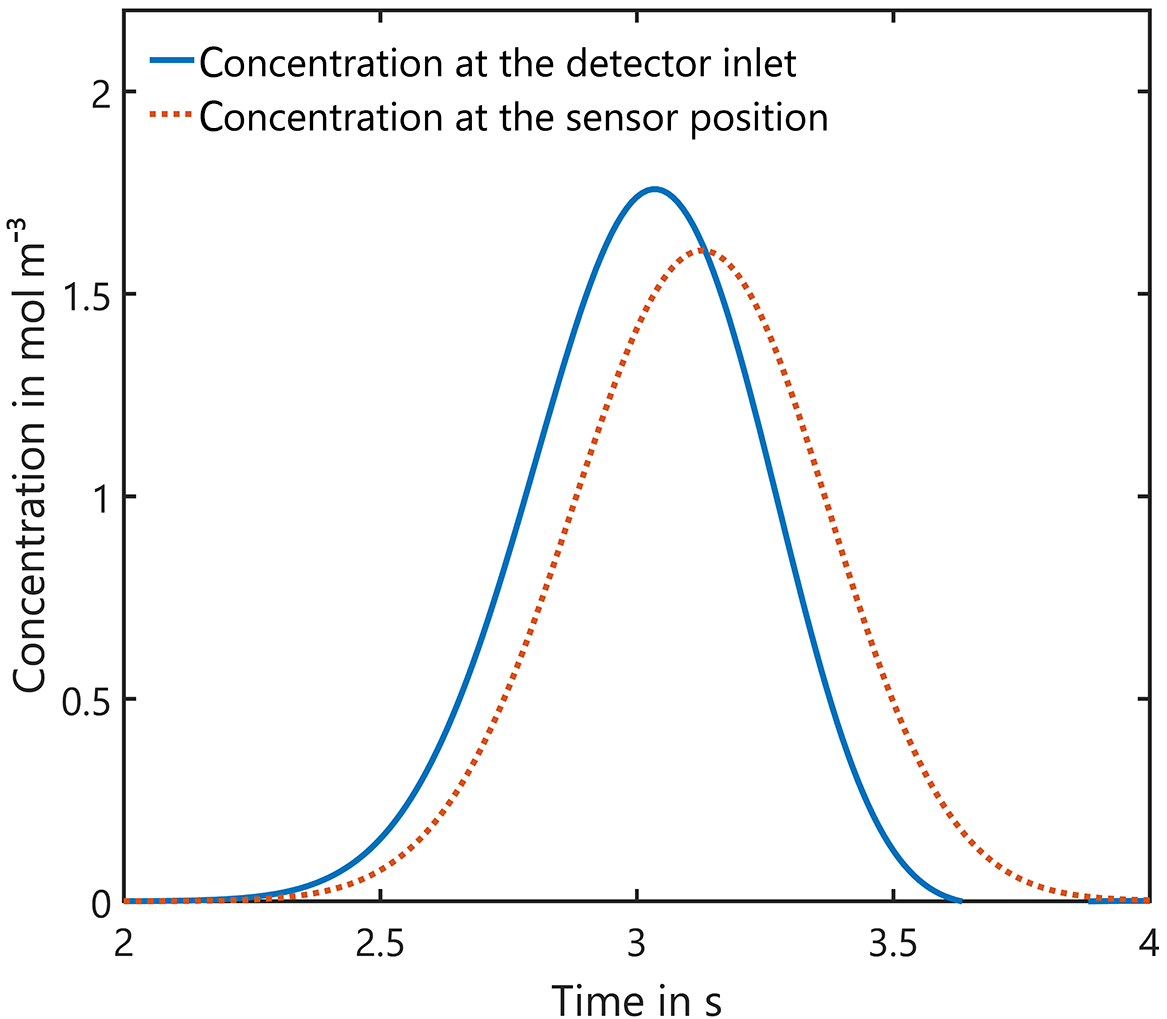
Figure 5Influence of the detector housing on the shape of incoming Gaussian peaks: the peak width of 0.2 s at the entrance is increased by 8.6 % and the maximum concentration is reduced correspondingly, but the integral, i.e., the amount of substance, remains unchanged.
In the current setup with a much wider channel (10 mm) compared to the sensor surface (500 µm), a large percentage of the incoming molecules just pass the detector without reacting on the sensor surface, which means they do not contribute to the sensor signal. To estimate the amount of substance actually required for the measured sensor signal, i.e., the real limit of detection for a system with optimized detector geometry, another simulation is performed. Here, the sensor is assumed to be an ideal gas sink, which means that the concentration is always zero at the position of the sensitive layer, with all molecules reaching the surface being consumed by the sensor reaction, i.e., disappearing in the simulation. By comparing the incoming and outgoing peak areas, the amount of substance that can reach the sensor surface and thus the maximum amount that can contribute to the sensor signal can be estimated. This ratio is mainly dependent on geometry. For our chamber, only 1.6 % of the incoming peak is consumed, which means that up to 60× lower amounts of substance than presented in this paper can be detected, if all molecules in a gas peak are brought to the sensor surface by a more suitable geometry and a lower flow rate.
4.2 Proof of concept
Measurements were performed to evaluate the concept of differential surface reduction regarding high separation efficiency and reproducibility of the total amount of substance in a pulse. The original lid and the protective membrane of the standard AS-MLV sensor were removed for our experiments to obtain an improved flow across the sensor. The programmable temperature cycle was set to a 60 s surface oxidation at 400 ∘C and a 600 s surface reduction phase at 100 ∘C. All measurements with the sensor setup were performed with the gas mixing apparatus described above with a carrier gas flow of dry zero air with a flow rate of 100 mL min−1; 240 s after the start of the reduction phase we tested different dosages (concentration times duration) of ethanol with variation in concentration, duration and dosage to test the reproducibility of the signal for the amount of substance (see Table 1). The gas pulses were generated with valves in the gas mixing unit.
Table 1Concentration and duration combinations for ethanol peaks.
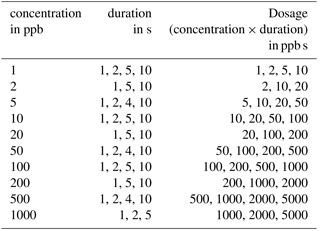
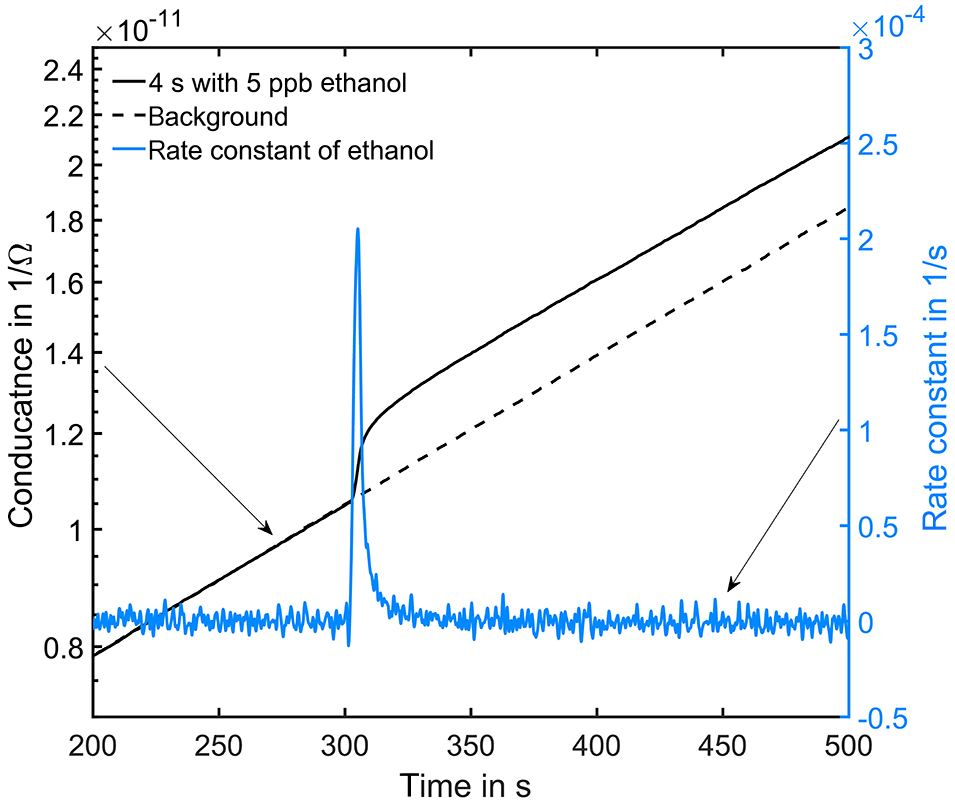
Figure 6Conductance curve in the low temperature plateau in clean air (black dashed line). At 300 s in the cycle a 4 s peak with 5 ppb ethanol was offered (black solid line). The grey line is the calculated rate constant of ethanol.
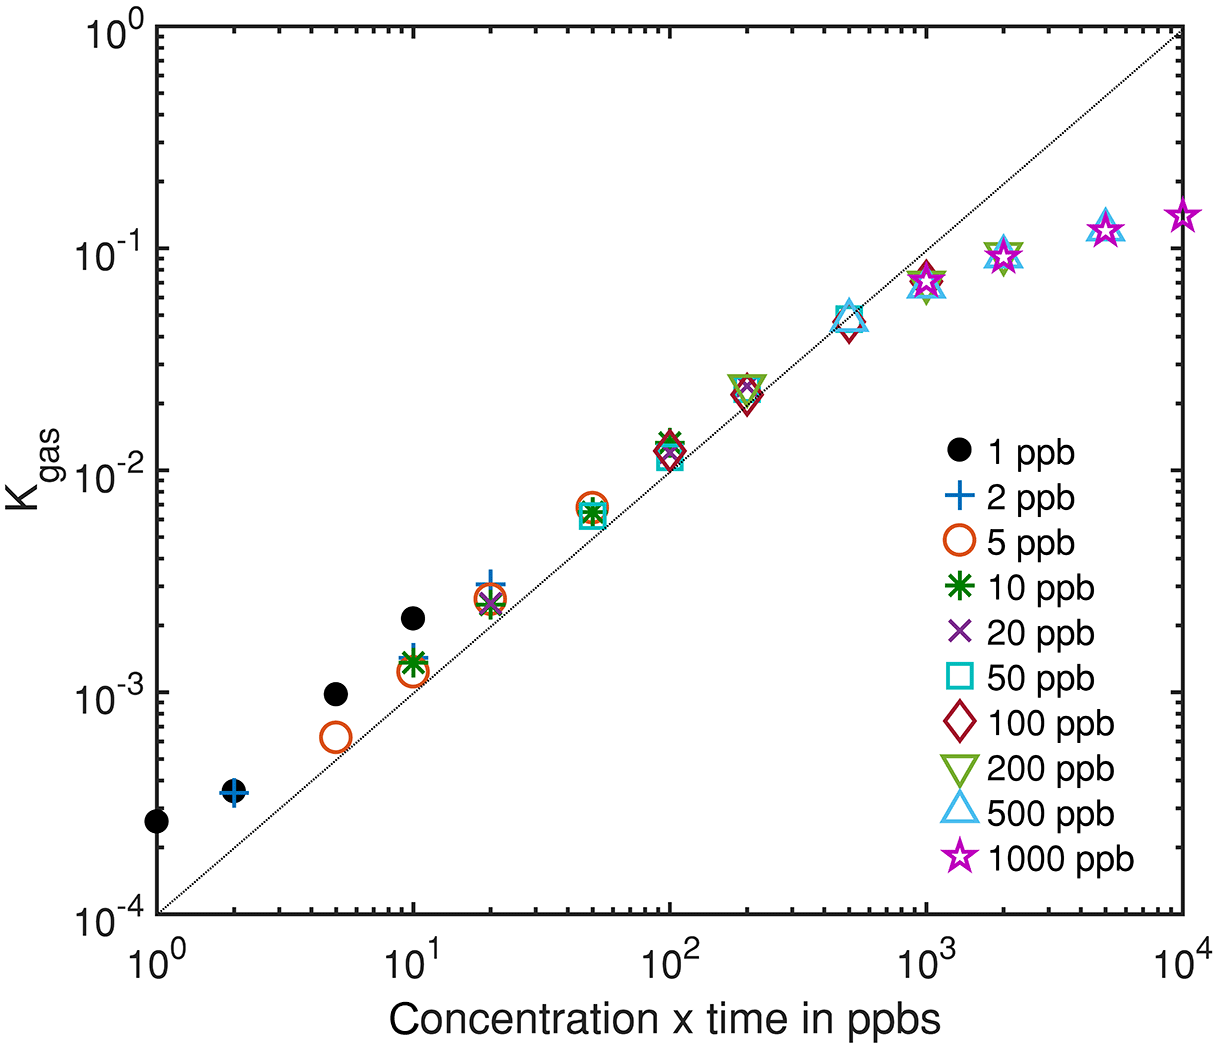
Figure 7Integrated rate constant dependent on the gas dosage, i.e., the product of pulse concentration and duration, which is proportional to the amount of substance for different gas pulses.
Figure 6 shows an exemplary evaluation of the sensor signal in the time range from 200 to 500 s of the cycle with a 20 ppb s (5 ppb for 4 s) ethanol pulse. The black dashed line is the conductance signal of the previous sensor cycle in dry zero air without gas exposure (background). The logarithmic sensor signal is linear over time, as described by our model. The black solid line shows the sensor conductance with ethanol pulse offered at 300 s, when an ethanol concentration of 5 ppm was introduced for 4 s. Immediately, the signal shows a fast increase in the sensor conductance. After the ethanol exposure, the conductance increase continues with an offset parallel to the background. This offset of the conductance curve is proportional to the amount of substance. The grey line is the rate constant calculated according to Eq. (10) for ethanol, which correctly represents the peak shape, with a small tailing effect. To improve the numerical differentiation of the signal a cubic smooth spline and a Savitzky–Golay filter with 1000 points (500 ms) to reduce the noise of the conductance measurement were used before numerical differentiation of the signal. The integrated rate constant Kgas representing the peak area is plotted in Fig. 7 for all 36 ethanol pulses from Table 1. Figure 7 shows the integrated rate constant in dependence on the dosage, i.e., the product of concentration and duration. Different shapes of the marker represent different pulse concentrations. For most concentrations evaluated rate constants with the same dosage are very close to each other, proving the novel detector concept. The integrated rate constant is linear up to approximately 200 ppb s. For higher dosages the curve flattens somewhat, presumably because the assumed linearity of the logarithmic conductance is no longer valid due to the far advanced surface reduction. Nevertheless, reproducible quantification is still possible based on the integrated rate constant. Pulses generated with an ethanol concentration of 1 ppb (black points) show a clear deviation from the trend line. The MFC set point for this concentration is only 2.5 %, which is beyond the recommended range of use according to the manufacturer. Thus, the concentration is probably higher than wanted, which would explain the constant offset from the trend line.
We have demonstrated that a metal oxide semiconductor gas sensor is able to detect and quantify short pulses of reducing gas at very low concentrations using the differential surface reduction mode. A simple model describing the change in the surface charge during temperature changes that was previously developed to improve the sensor performance during temperature cycled operation is used here to evaluate the sensor signal and achieve an output signal proportional to the gas dose. Experimental results over a wide range of gas dosages correspond well to this model and demonstrate a linear behavior of the integrated rate constant over 3 orders of magnitude. For ethanol, the gas pulses are well represented even at 100 ∘C; for other, less reactive reducing gases a higher measurement temperature might be required to achieve sufficient sensitivity. FEM simulations have shown that the sensor consumes at most 1.6 % of the injected gas quantity. This corresponds to a detection limit of below 47 fg for ethanol. This method can be used to realize small and inexpensive micro-detectors for GC systems able to detect and quantify trace gases as well as integrated sensor pre-concentrator systems, e.g., for air quality applications.
The underlying measurement data are not publicly available and can be requested from the authors if required.
The authors declare that they have no conflict of interest.
This article is part of the special issue “Sensor/IRS2 2017”. It is a result of the AMA Conferences, Nuremberg,
Germany, 30 May–1 June 2017.
Edited by: Jürgen Wöllenstein
Reviewed by: two anonymous referees
Bajtarevic, A., Ager, C., Pienz, M., Klieber, M., Schwarz, K., Ligor, M., Ligor, T., Filipiak, W., Denz, H., Fiegl, M., Hilbe, W., Weiss, W., Lukas, P., Jamnig, H., Hackl, M., Haidenberger, A., Buszewski, B., Miekisch, W., Schubert, J., and Amann, A.: Noninvasive detection of lung cancer by analysis of exhaled breath, BMC Cancer, 9, 348, https://doi.org/10.1186/1471-2407-9-348, 2009.
Bârsan, N. and Ionescu, R.: SnO2-based gas sensors as chromatographic detectors, Sensor. Actuat. B-Chem., 19, 470–473, https://doi.org/10.1016/0925-4005(93)01042-3, 1994.
Bârsan, N. and Weimar, U.: Conduction Model of Metal Oxide Gas Sensors, J. Electroceram., 7, 143–167, https://doi.org/10.1023/A:1014405811371, 2001.
Baur, T., Schütze, A. and Sauerwald, T.: Optimierung des temperaturzyklischen Betriebs von Halbleitergassensoren, Tech. Mess., 82, 187–195, https://doi.org/10.1515/teme-2014-0007, 2015.
Baur, T., Schütze, A., and Sauerwald, T.: Detection of short trace gas pulses, in: Proceedings Sensor 2017, Nürnberg, Germany, 30 May–1 June 2017, 87–91, https://doi.org/10.5162/sensor2017/A4.2, 2017.
Baur, T., Schultealbert, C., Schütze, A., and Sauerwald, T.: Device for the detection of short trace gas pulses, Tech. Mess., 0, 0, https://doi.org/10.1515/teme-2017-0137, 2018.
Chapman, P. J., Vogt, F., Dutta, P., Datskos, P. G., Devault, G. L., and Sepaniak, M. J.: Facile hyphenation of gas chromatography and a microcantilever array sensor for enhanced selectivity, Anal. Chem., 79, 364–370, https://doi.org/10.1021/ac061389x, 2007.
Cheong, H.-W. and Lee, M.-J.: Sensing characteristics and surface reaction mechanism of alcohol sensors based on doped SnO2, J. Ceram. Process. Res., 7, 183–191, 2006.
Ding, J., McAvoy, T. J., Cavicchi, R. E., and Semancik, S.: Surface state trapping models for SnO2-based microhotplate sensors, Sensor. Actuat. B-Chem., 77, 597–613, https://doi.org/10.1016/S0925-4005(01)00765-1, 2001.
Eiceman, G. A., Nazarov, E. G., Miller, R. A., Krylov, E. V., and Zapata, A. M.: Micro-machined planar field asymmetric ion mobility spectrometer as a gas chromatographic detector, Analyst, 127, 466–471, https://doi.org/10.1039/b111547m, 2002.
Geiss, O., Giannopoulos, G., Tirendi, S., Barrero-Moreno, J., Larsen, B. R., and Kotzias, D.: The AIRMEX study – VOC measurements in public buildings and schools/kindergartens in eleven European cities: Statistical analysis of the data, Atmos. Environ., 45, 3676–3684, https://doi.org/10.1016/j.atmosenv.2011.04.037, 2011.
Gurlo, A.: Interplay between O2 and SnO2: oxygen ionosorption and spectroscopic evidence for adsorbed oxygen, Chem. Phys. Chem., 7, 2041–2052, https://doi.org/10.1002/cphc.200600292, 2006.
Helwig, N., Schüler, M., Bur, C., Schütze, A., and Sauerwald, T.: Gas mixing apparatus for automated gas sensor characterization, Meas. Sci. Technol., 25, 55903, https://doi.org/10.1088/0957-0233/25/5/055903, 2014.
Koistinen, K., Kotzias, D., Kephalopoulos, S., Schlitt, C., Carrer, P., Jantunen, M., Kirchner, S., McLaughlin, J., Mølhave, L., Fernandes, E. O., and Seifert, B.: The INDEX project: Executive summary of a European Union project on indoor air pollutants, Allergy, 63, 810–819, https://doi.org/10.1111/j.1398-9995.2008.01740.x, 2008.
Leidinger, M., Sauerwald, T., Reimringer, W., Ventura, G., and Schütze, A.: Selective detection of hazardous VOCs for indoor air quality applications using a virtual gas sensor array, J. Sens. Sens. Syst., 3, 253–263, https://doi.org/10.5194/jsss-3-253-2014, 2014.
Leidinger, M., Huotari, J., Sauerwald, T., Lappalainen, J., and Schütze, A.: Nanostructured WO3 Semiconductor Gas Sensor for Selective Detection of Naphthalene, in: Proceedings Sensor 2015, Nürnberg, Germany, 19–21 May 2015, 723–728, https://doi.org/10.5162/sensor2015/E8.2, 2015.
Leidinger, M., Baur, T., Sauerwald, T., Schütze, A., Reimringer, W., Spinelle, L., and Gerboles, M.: Highly sensitive benzene detection with MOS gas sensors, in: Proceedings Sensor 2017, Nürnberg, Germany, 30 May–1 June 2017, 92–97, https://doi.org/10.5162/sensor2017/A4.3, 2017.
Madou, M. J. and Morrison, S. R.: Chemical Sensing with Solid State Devices, Academic Press, Inc., 1989.
Mahdavifar, A., Navaei, M., Hesketh, P. J., Findlay, M., Stetter, J. R., and Hunter, G. W.: Transient thermal response of micro-thermal conductivity detector (µTCD) for the identification of gas mixtures: An ultra-fast and low power method, Microsystems Nanoeng., 1, 15025, https://doi.org/10.1038/micronano.2015.25, 2015.
Mead, M. I., Popoola, O. A. M., Stewart, G. B., Landshoff, P., Calleja, M., Hayes, M., Baldovi, J. J., McLeod, M. W., Hodgson, T. F., Dicks, J., Lewis, A., Cohen, J., Baron, R., Saffell, J. R., and Jones, R. L.: The use of electrochemical sensors for monitoring urban air quality in low-cost, high-density networks, Atmos. Environ., 70, 186–203, https://doi.org/10.1016/j.atmosenv.2012.11.060, 2013.
Narayanan, S., Rice, G., and Agah, M.: A micro-discharge photoionization detector for micro-gas chromatography, Microchim. Acta, 181, 493–499, https://doi.org/10.1007/s00604-013-1146-9, 2014.
Pulkkinen, U., Rantala, T. T., Rantala, T. S., and Lantto, V.: Kinetic Monte Carlo simulation of oxygen exchange of SnO2 surface, J. Mol. Catal. A-Chem., 166, 15–21, https://doi.org/10.1016/S1381-1169(00)00466-0, 2001.
Roberts, T. J., Saffell, J. R., Oppenheimer, C., and Lurton, T.: Electrochemical sensors applied to pollution monitoring: Measurement error and gas ratio bias – A volcano plume case study, J. Volcanol. Geoth. Res., 281, 85–96, https://doi.org/10.1016/j.jvolgeores.2014.02.023, 2014.
Sanchez, J. B., Schmitt, A., Berger, F., and Mavon, C.: Silicon-micromachined gas chromatographic columns for the development of portable detection device, J. Sensors, 2010, 409687, https://doi.org/10.1155/2010/409687, 2010.
Sasahara, T., Kato, H., Saito, A., Nishimura, M., and Egashira, M.: Development of a ppb-level sensor based on catalytic combustion for total volatile organic compounds in indoor air, Sensor. Actuat. B-Chem., 126, 536–543, https://doi.org/10.1016/j.snb.2007.04.001, 2007.
Schultealbert, C., Baur, T., Schütze, A., Böttcher, S., and Sauerwald, T.: A novel approach towards calibrated measurement of trace gases using metal oxide semiconductor sensors, Sensor. Actuat. B-Chem., 239, 390–396, https://doi.org/10.1016/j.snb.2016.08.002, 2017.
Spinelle, L., Gerboles, M., Villani, M. G., Aleixandre, M., and Bonavitacola, F.: Field calibration of a cluster of low-cost available sensors for air quality monitoring. Part A: Ozone and nitrogen dioxide, Sensor. Actuat. B-Chem., 215, 249–257, https://doi.org/10.1016/j.snb.2015.03.031, 2015.
Spinelle, L., Gerboles, M., Kok, G., Persijn, S., and Sauerwald, T.: Review of Portable and Low-Cost Sensors for the Ambient Air Monitoring of Benzene and Other Volatile Organic Compounds, Sensors, 17, 1520, https://doi.org/10.3390/s17071520, 2017.
Suematsu, K., Yuasa, M., Kida, T., Yamazoe, N., and Shimanoe, K.: Determination of Oxygen Adsorption Species on SnO2: Exact Analysis of Gas Sensing Properties Using a Sample Gas Pretreatment System, J. Electrochem. Soc., 161, B123–B128, https://doi.org/10.1149/2.004406jes, 2014.
Texas Instrumens Inc.: LOG114 – Logarithmic Amplifier Features, Datasheet (May 2004), 2007.
Trzciński, J. W., Pinalli, R., Riboni, N., Pedrini, A., Bianchi, F., Zampolli, S., Elmi, I., Massera, C., Ugozzoli, F., and Dalcanale, E.: In Search of the Ultimate Benzene Sensor: The EtQxBox Solution, ACS Senors, 2, 590–598, https://doi.org/10.1021/acssensors.7b00110, 2017.
Wilhelm, I., Rieger, M., Hürttlen, J., Wittek, M., Alépée, C., Leidinger, M., and Sauerwald, T.: Novel Low-Cost Selective Pre-Concentrators Based on Metal Organic Frameworks, in: Procedia Engineering, 168, 151–154, https://doi.org/10.1016/j.proeng.2016.11.186, 2016.
Yamazoe, N., Suematsu, K., and Shimanoe, K.: Extension of receptor function theory to include two types of adsorbed oxygen for oxide semiconductor gas sensors, Sensor. Actuat. B-Chem., 163, 128–135, https://doi.org/10.1016/j.snb.2012.01.020, 2012.
Zampolli, S., Elmi, I., Stürmann, J., Nicoletti, S., Dori, L., and Cardinali, G. C.: Selectivity enhancement of metal oxide gas sensors using a micromachined gas chromatographic column, Sensor. Actuat. B-Chem., 105, 400–406, https://doi.org/10.1016/j.snb.2004.06.036, 2005.
Zampolli, S., Betti, P., Elmi, I., and Dalcanale, E.: A supramolecular approach to sub-ppb aromatic VOC detection in air, Chem. Commun., 2007, 2790–2792, https://doi.org/10.1039/b703747c, 2007.