the Creative Commons Attribution 4.0 License.
the Creative Commons Attribution 4.0 License.
 | 20 Feb 2018
Temperature sensing in underground facilities by Raman optical frequency domain reflectometry using fiber-optic communication cables
Markus Brüne
Wilhelm Furian
Wieland Hill
Andreas Pflitsch
Gaining information on climatic conditions in subway tunnels is the key to predicting the propagation of smoke or toxic gases in these infrastructures in the case of a fire or a terrorist attack. As anemometer measurements are not economically suitable, the employment of alternative monitoring methods is necessary. High-resolution temperature sensing with Raman optical frequency domain reflectometry (OFDR) using optical communication fiber cables shows great potential as it allows the surveillance of several kilometers of underground transport facilities without the need for installing sensing equipment in the tunnels. This paper presents first results of a study using this approach for monitoring subway tunnels. In the Berlin subway, temperature data gathered from newly installed as well as pre-installed communication cables were evaluated and compared to reference data from temperature loggers. Results are very promising as high correlations between all data can be achieved showing the potential of this approach.
- Article
(7915 KB) - Full-text XML
- BibTeX
- EndNote


Correct climatic boundary conditions are fundamental for achieving relevant results from computational fluid dynamic (CFD) simulations. This is of particular importance for predicting the propagation of fire-induced smoke in underground transport facilities. For instance, the velocity and direction of airflow in tunnels of a subway system are quite complex. During operation, running trains push air forward, described as the well-known piston effect (Valensi, 1979). In the case of a subway fire, train traffic is stopped immediately, and the background airflow re-establishes within a few minutes (Brüne et al., 2012). Knowledge on the flow velocity in the adjacent tunnels is required to set up valid CFD simulations for predicting the propagation of smoke and for identifying safe evacuation routes. Gaining the airflow information from anemometer readings is not suitable. Monitoring each tunnel mouth of each station in a subway system would lead to a massive application of anemometers which would incur tremendous costs due to the high number of devices and especially the required wiring and installation work. Airflow, however, can be derived from temperature information along the tunnels by using the distributed temperature sensing (DTS) method, based on the Raman scattering effect (Hill et al., 2010). Subway systems already have a wide network of optical fiber cables installed, so it is a promising idea to use those for temperature sensing. This study focuses on stepping forward to gain airflow information of subway systems for reasonable costs.
The techniques used in this study are based on the method of distributed temperature sensing (DTS). DTS systems rely on the fact that an optical fiber can function as a linear sensor as well as a transmission medium. Thus, DTS devices are an interesting alternative to multiplexed measurement points as one fiber-optic cable can potentially replace thousands of single sensors and therefore reduce the costs for installation, maintenance and readout while simplifying the whole process of data acquisition (Tanner et al., 2011). Physical measurement dimensions change the attenuation of light in the fiber in a way that allows a high-accuracy determination of the location of an external effect like air temperature (LIOS Technology, 2016). Optical fibers consist of silica glass (SiO2) waveguides and, thus, are small, light and insensitive to electromagnetic fields (Li and Bao, 2013). DTS systems use the Raman backscattering effect, which depends on temperature (Albani, 2004; Dakin et al., 1985). The coherent optical frequency domain reflectometry (OFDR), which was used in this study, is characterized by high sensitivity and a large dynamic measurement range. Traditionally, OFDR systems were developed in reference to Rayleigh scattering, whereas the techniques used in this study rely on its application for Raman backscatter measurements. OFDR devices employ lasers in a quasi-continuous wave mode and narrow-band detection of backscattered photons. Raman scatter light and the complex signal processing using the fast Fourier transform (FFT) (Ghafoori-Shiraz and Okoshi, 1986; Hill et al., 2010; LIOS Technology, 2016) The OFDR controller employed in this study uses a three-channel design with an additional reference channel besides the two channels to measure the above-mentioned Stokes and anti-Stokes bands (LIOS Technology, 2008). Its laser continually emits a sinus-shaped frequency, which is connected to the fiber cable through an optical module. This module also filters the backscattered Raman light and converts it into electrical signals using photodetectors. After some transformations, e.g., low-frequency mixing and inverse FFT (Hill et al., 2010), the Raman signal is available as two backscatter curves with amplitudes proportional to the intensity of the Raman backscattering at the observed location. As proposed by Dakin et al. (1985), the temperature of the optical fiber then is obtained from the ratio of the two measurement channels, i.e., the intensities of anti-Stokes and Stokes band. The advantage of using OFDR-DTS temperatures for obtaining airflow information lies in replacing thousands of single temperature loggers or cost-intensive anemometer which needs elaborately wiring for data acquisition and power supply. Installation work inside operating tunnels might not even require the use of pre-installed communication cables.
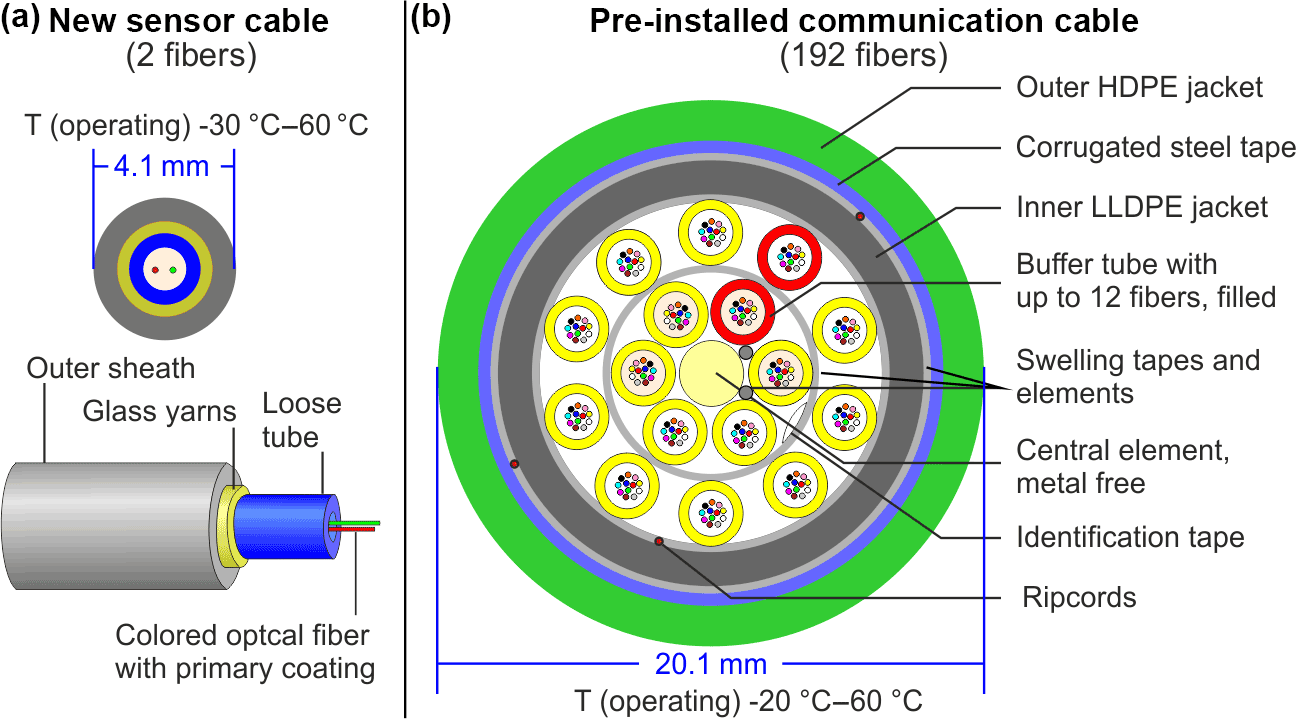
Figure 1Schematic layout of the used sensor cables: (a) new sensor cable and (b) pre-installed communication cable.
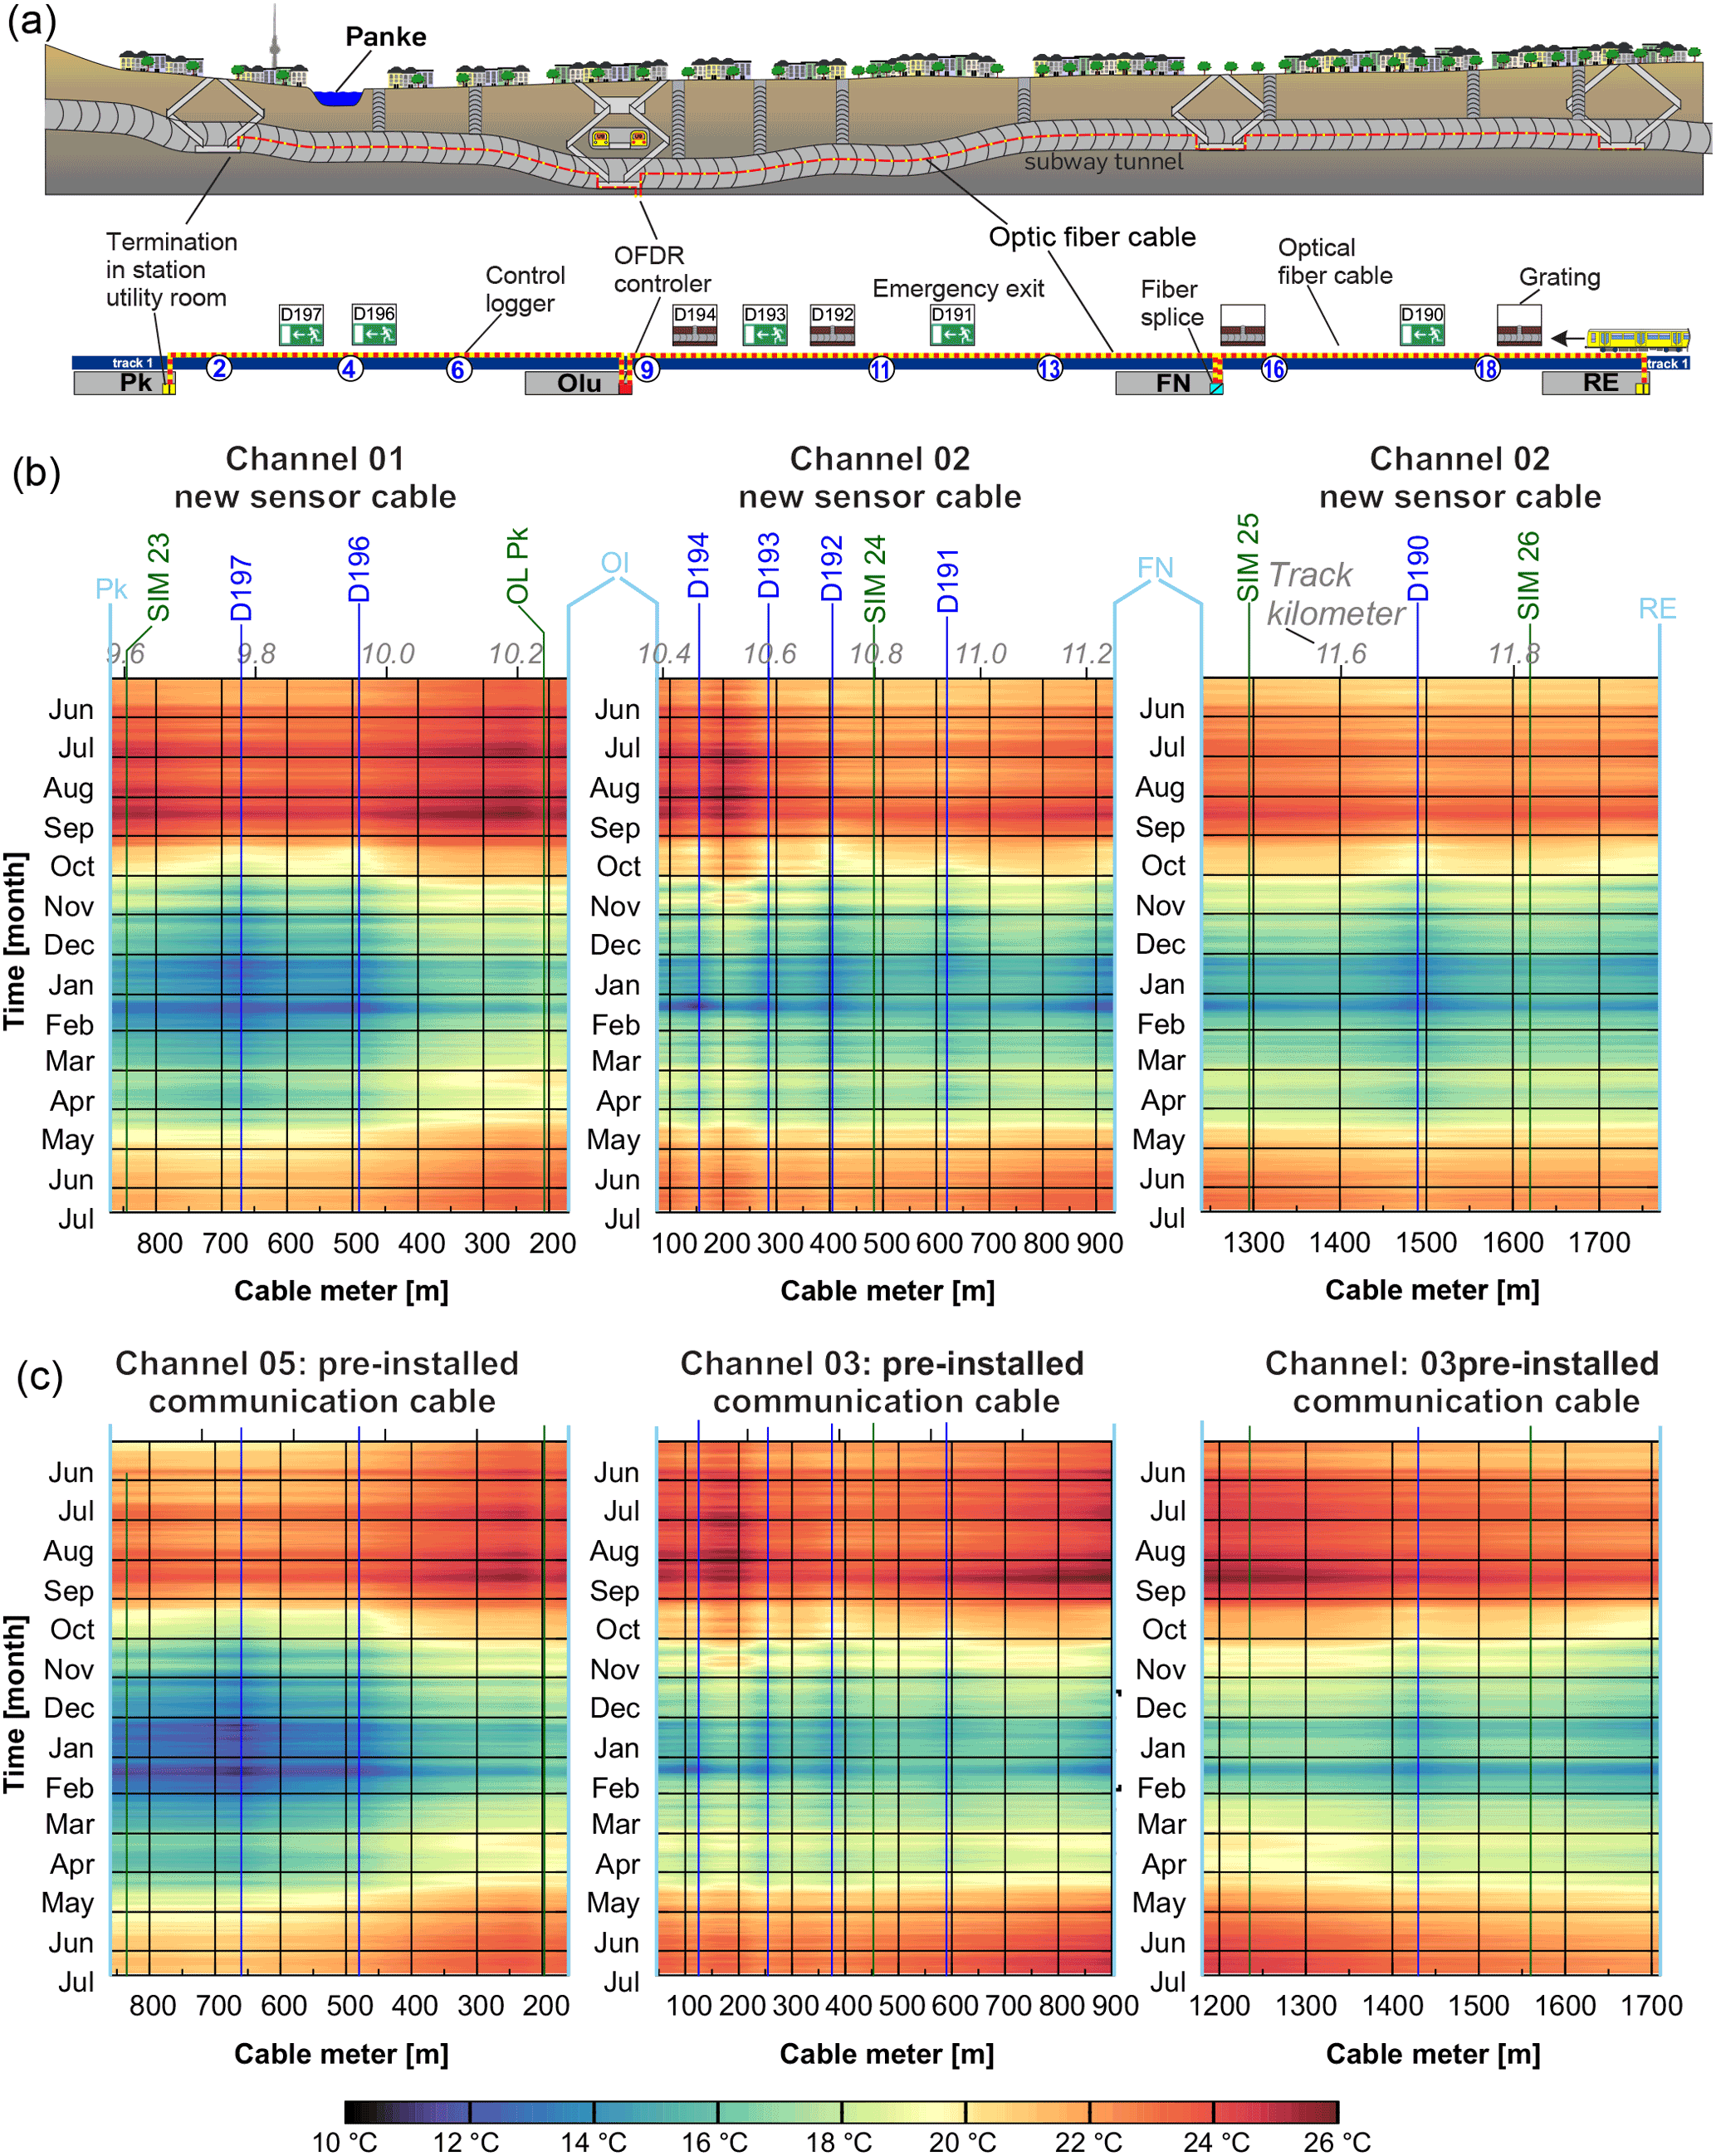
Figure 2Setup of measurements, (a) recorded daily mean temperatures by new sensor cables, (b) and pre-installed communication cables (c) between June 2016 and February 2017. The observed temperatures of the new sensor cable and the pre-installed communication cable are very similar. Cold spots are clearly associated with the emergency exits and gratings. Channels 1 and 6 show a relatively cool tunnel section at about 650 and 700 m, which is related to the above flowing river Panke. Between 100 and 200 m a warm section was observed in Channels 2 and 3, which is exactly the location of siding tracks, where trains park during off-peak and cause additional heat transfer. Inside the station, the cable tray is located underneath the platforms (cooler areas) and inside utility rooms (warmer areas).

Figure 3Localization of exact positions (±0.5 m) by using freezing spray (a) and the response of recorded temperatures of the fiber-optic cable using a measurement configuration with a spatial sample rate of 1 m (b).
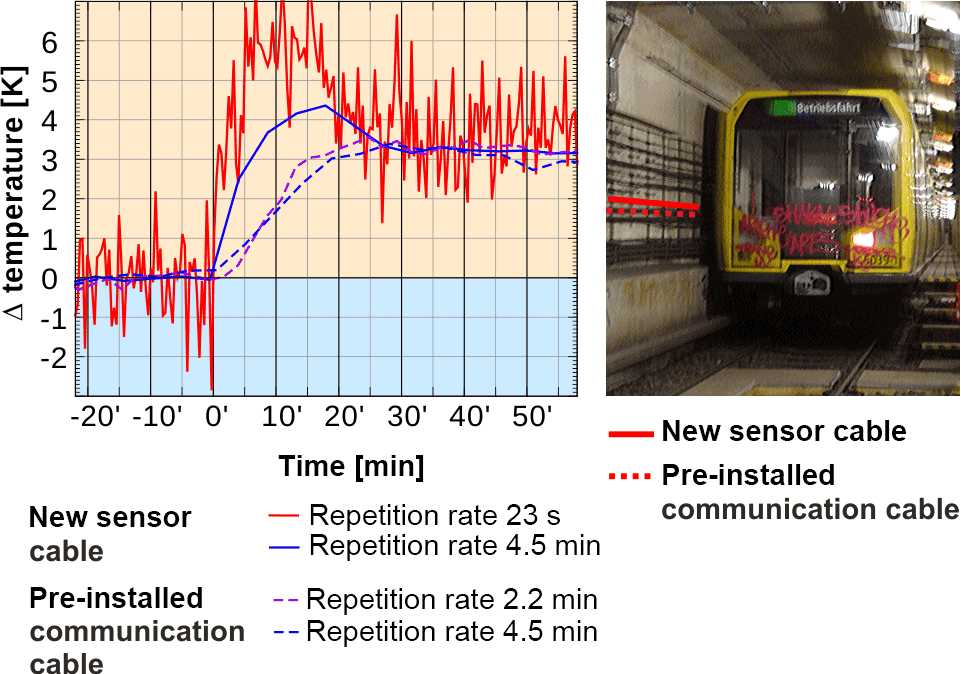
Figure 4Short time response of temperature changes due to the parking of a train close to the tunnel walls with different sample rates. The blue lines represent the observed values on the same date (6 September 2016). The spatial resolution was set to 5 m.
Inside the Berlin subway system, a Raman-OFDR DTS measured temperature profiles along a 1 and a 2 km tunnel route including two subway stations using a dedicated fiber-optic sensor cable with two optical fibers with a diameter of 4.1 mm connected to the OFDR controller device. In addition four fibers of a pre-existing communication cable with up to 192 fibers with a diameter of 20.1 mm were also used for temperature sensing (see Fig. 1). Channel 2 (new sensor cable) and Channel 3 (pre-installed communication cable) connect the subway stations Osloer Straße (Olu) and Residenzstraße (RE), crossing the station Franz-Neumann-Platz (FN), while Channel 1 (new sensor cable) and Channel 5 (pre-installed communication cable) head south to the station Pankstraße (Pk).
The sensor cable has installed with a 10 cm gap from the tunnel walls. As the tunnel walls are mostly cooler than the tunnel air, the heat flux will have a lowering effect on the measured temperature. The influence will increase by a smaller distance to the tunnel wall, high temperature difference between tunnel walls and air, and lower airflow velocity inside the tunnels. Relative temperature changes are of interest and the changes are very slow, so this effect can neglected.
The OFDR controller device can only measure one channel at the same time, so this leads to a temporal repetition rate of 4.5 min. The used measurement configuration results in a temperature uncertainty of 0.1 ∘C (see Table 1). Similar accuracies can achieved by using PT 100-based sensors. Several stand-alone temperature loggers have also been installed along the cable to validate the temperature data (see Fig. 2). The fiber-optic links have patched at every station leading to extra losses. This introduced higher demands for the temperature calibration on each segment. Temperature data were logged at the beginning, termination and patch link of the cables.
Table 1Specifications OFDR measurements during standard measurements.
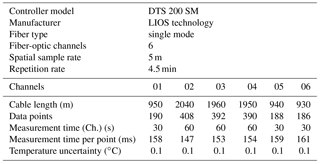
Figure 2 also shows the temperatures from June 2016 to February 2017. At a glance, great similarities between the new sensor cable and the pre-installed communication cable become apparent. Although the data range does not cover a full year, shifted annual variations could be observed. The temperature maxima were recorded in October while the minimum occurs in March. This shifting effect is due to the depths of the tunnels. At closer look cold spots were observed at several distances from the OFDR controller, which correspond quite well to the locations of emergency exits and other openings to the above ground. The sidings north of Osloer Straße are used to park non-operating trains during the night break, causing the hot area observable around 100–200 m in Channel 2 and 3.
In addition to pre-calibration performed by LIOS software, data were calibrated by the authors using data loggers at positions near the ending points of the fiber-optic cables. With these reference temperatures, we could eliminate the effect of differential attenuation between Stokes and anti-Stokes signals increasing with increasing distance from the controller module. To assess the measurement quality of the fiber-optic cables, the exact position in terms of cable meter (±0.5 m) at the location of the stand-alone loggers must be known. This was achieved by cooling the fiber-optic cables using freezing spray and using a measurement configuration with a spatial sample rate of 1 m (see Fig. 3).
As the temperature differences are very low inside the tunnels, a fast response time in temperature changes is not very important. Figure 4 shows a location where subway trains were parked during off-peak times, causing a sudden air temperature change of 3 K. The recorded temperature reflects this within 5 min for quick repetition rates (23 s) measuring each data point in 56 ms and using a spatial sample rate of 1 m and up to 20 min for the standard configuration (see Table 1).
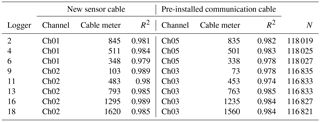
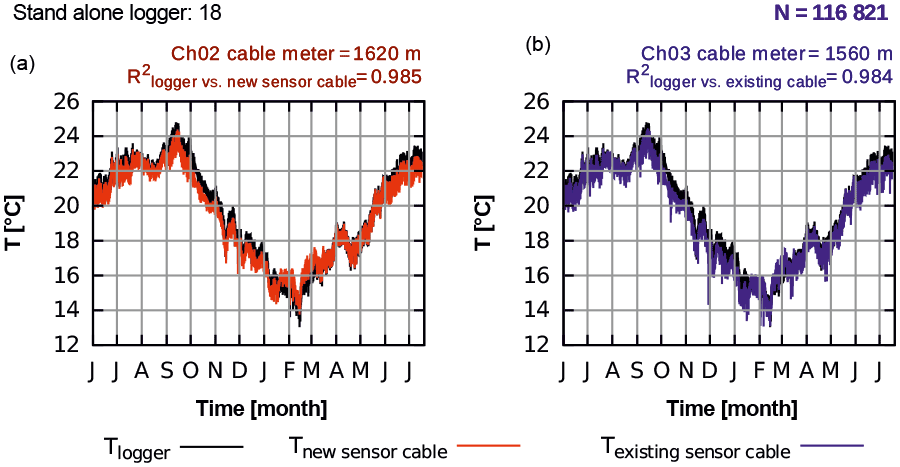
Figure 5Comparison of measured temperatures by new sensor cable (a) and pre-installed communication cable (b) with stand-alone control temperature loggers at the same position (top), and their correlations (bottom).
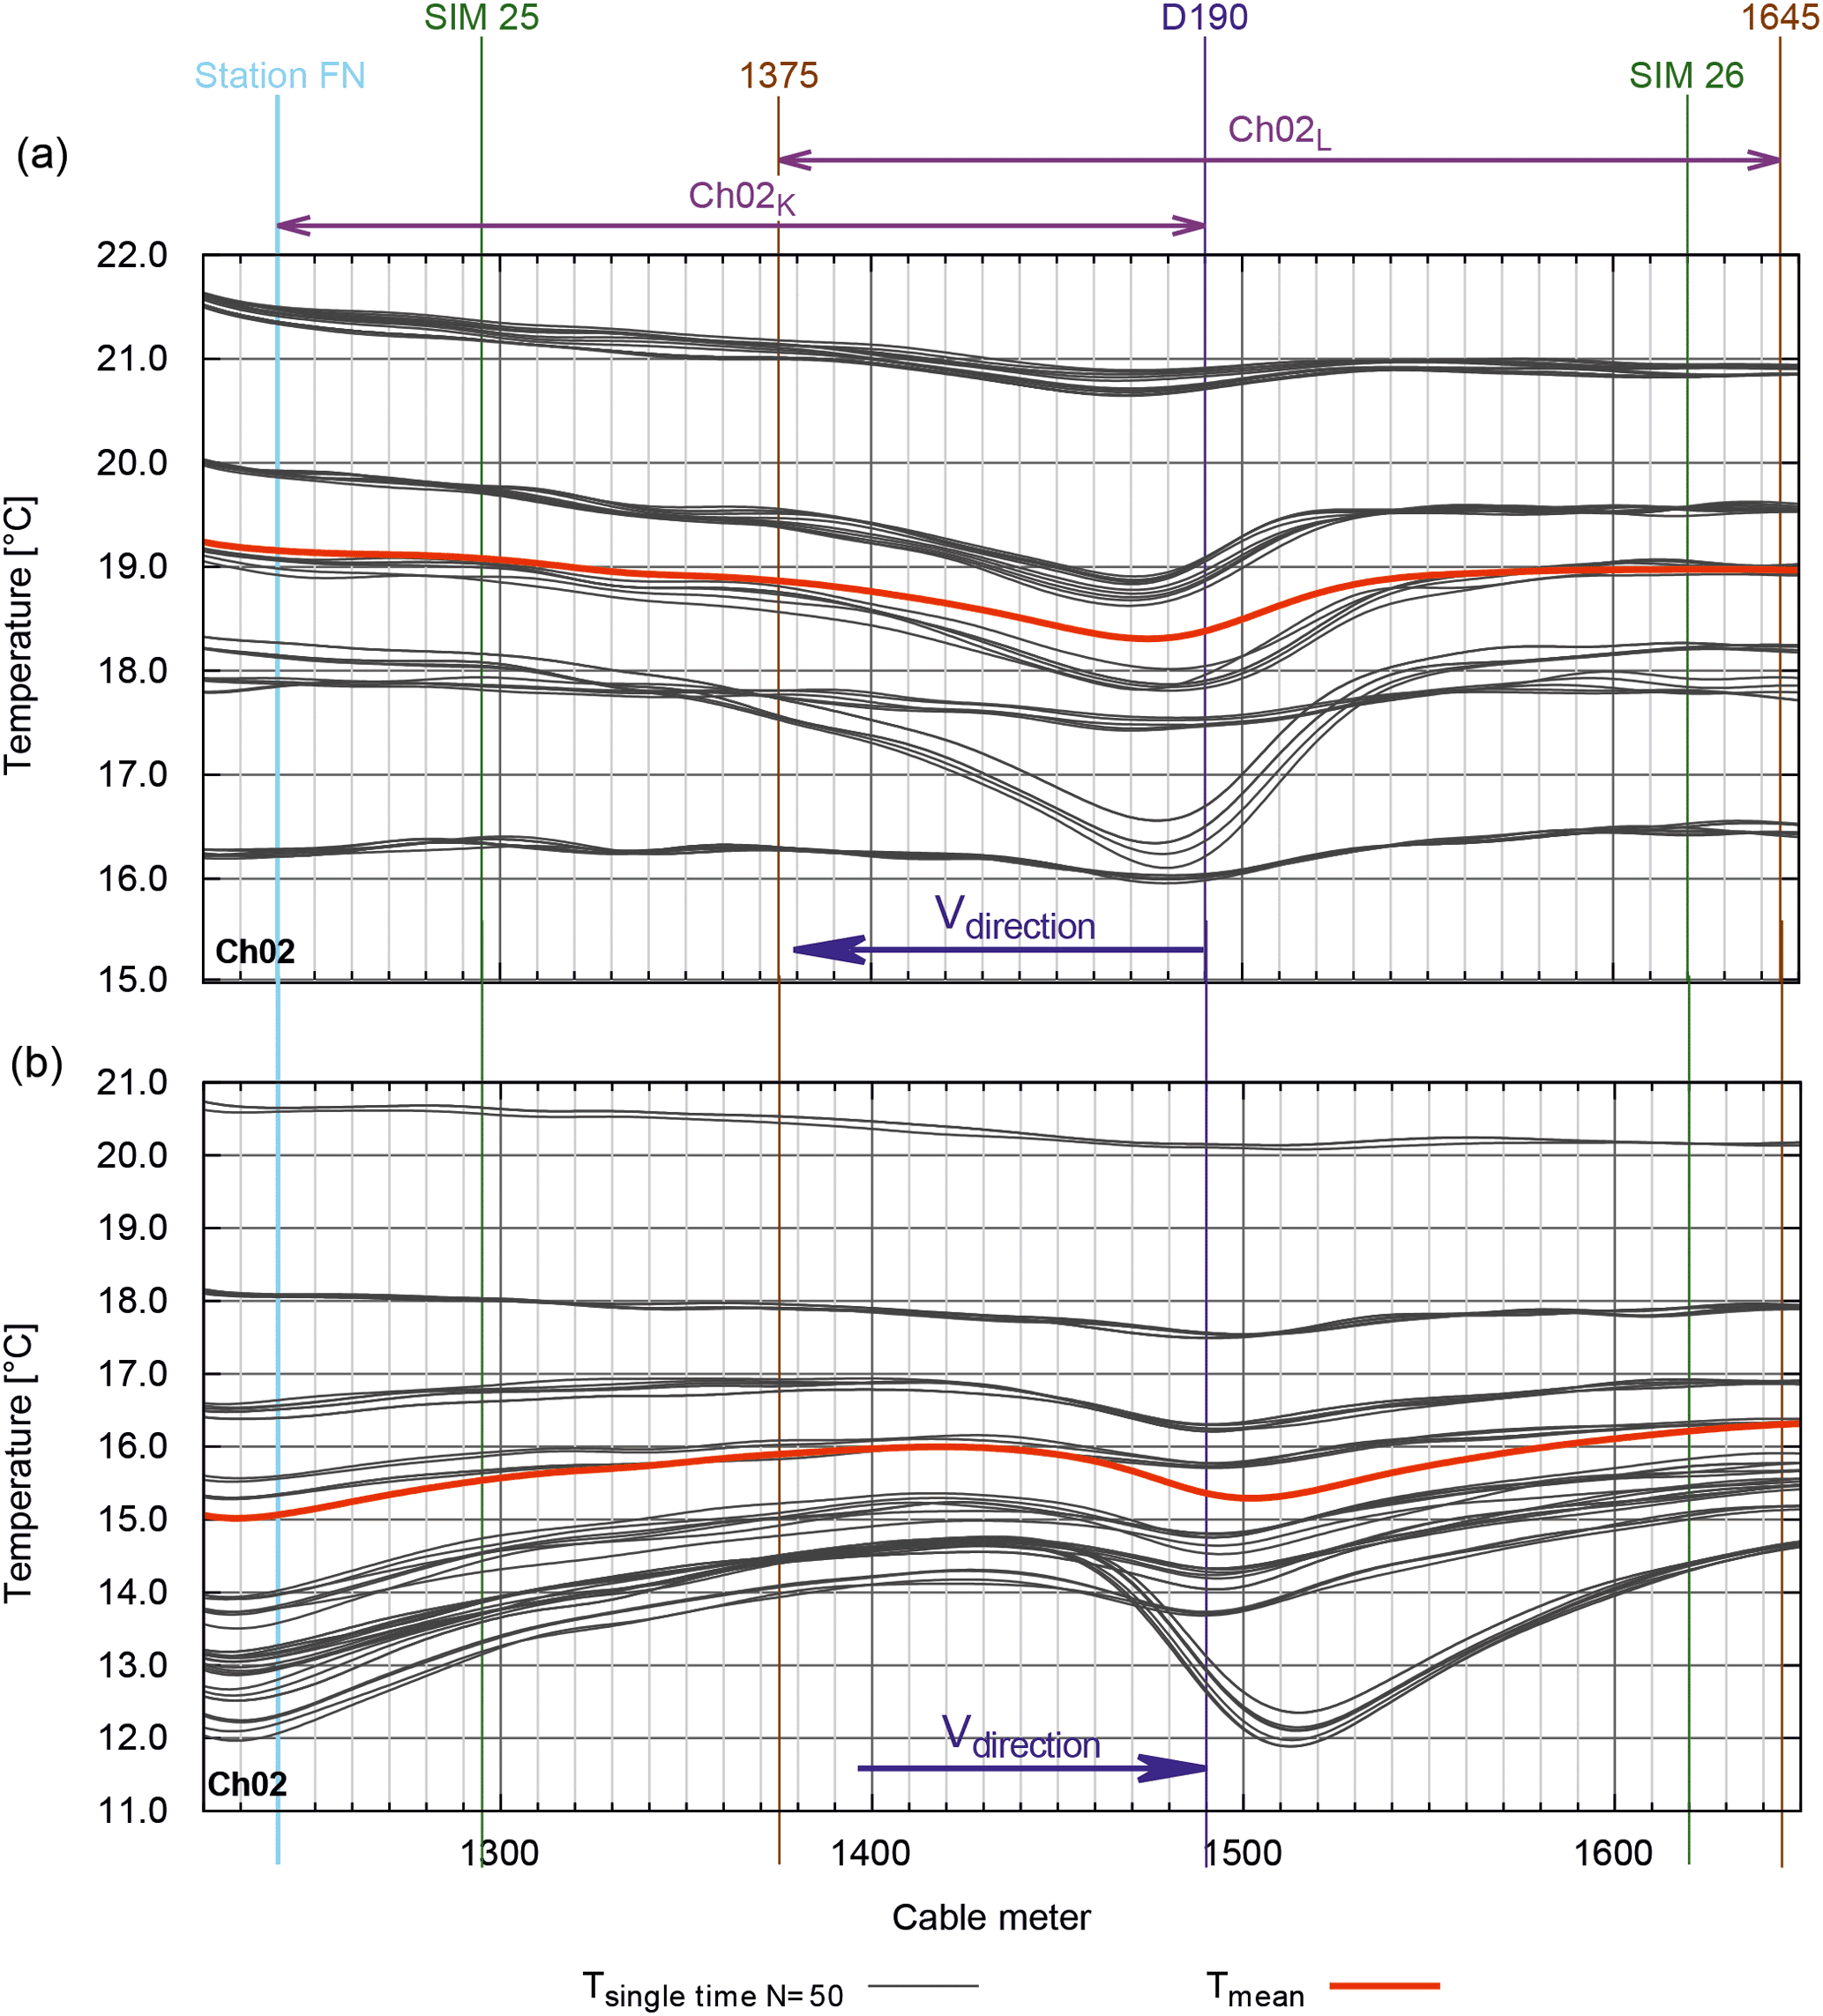
Figure 6Temperature profile around emergency exit D190. (a) Randomly chosen operational breaks with observed wind direction towards station Franz-Neumann-Platz, (b) towards Residenzstraße.
Figure 5 provides an overview of air temperature trends during the measurement period for both used cables types. The graph shows clearly that, using OFDR and newly installed fiber-optic cables, measuring small-scale changes in the air temperature leads to results that are quality-wise comparable to stand-alone logger measurements. Due to the much larger diameter, a higher attenuation would be expected using the pre-installed cable, but the results are promising. Table 2 summarizes the correlation between the stand-alone loggers and the temperature readings from DTS sensing. The weakest correlation coefficient was found with R2=0.978, so it can be assumed that using pre-installed cables for OFDR temperature sensing produces the same results as the new sensor cable does, but it has to be mentioned that the cable length does not exceed 2 km.
The temperature distribution alongside the OFDR-DTS temperature measurements should be related to the airflow in a certain tunnel section. The expectations are that temperature anomalies, which occur naturally inside the subway tunnels, should be shifted into the direction of airflow. The patterns observed for the considered section shown in Fig. 6 meet these expectations. Cooler air falls through the emergency exit D190, located at cable meter 1490 m, into to the subway tunnels. A number of 50 randomly chosen situations of airflow direction with increasing and decreasing cable meters showed a clear shift of the thermal depression towards the direction of airflow. Furthermore, if an outflow from station Franz-Neumann-Platz is observed, the steady flow of warmer air can heat up the tunnel until the emergency exit D190 is reached. If dealing with airflow in the opposite direction, inflowing cold air moves from D190 to the station, causing an observable cooling effect.
The comparison of the temperature data from the dedicated fiber-optic sensor cable and the existing communication cable showed very high correlation with R2>0.97, thus confirming the eligibility of communication cables for temperature monitoring (see Fig. 4). Therefore using pre-installed optical fiber-optic cables for temperature sensing is possible at least up to cable lengths of some kilometers. Available OFDR devices are able to monitor cable lengths of up to 30 km, but it remains to be proven which cable lengths can be reached with pre-installed fiber optics. In addition, future work has to be done to show which temperature resolution is needed in order to derive the airflow inside subway tunnels, in particular extending the cable lengths up to their maxima. Finally, the OFDR temperature sensing using pre-installed communication cables has the potential to derive airflow in subway systems, thus generating realistic margin conditions for many stations, which can be used in numeric simulation for fire scenarios (Schröder et al., 2014).
We cannot provide any data at this stage. This is due to the research contract with the subway operator as we are dealing with safety issues. The project is also still running, and we are still analyzing the data for other research questions, which are quiet sensitive.
The authors declare that they have no conflict of interest.
This article is part of the special issue “Sensor/IRS2 2017”. It is a result of the AMA Conferences, Nuremberg, Germany, 30 May–1 June 2017.
This work is part of the research project “Optimization of smoke exhaust and pedestrian management in underground stations: experiments and simulation”
(ORPHEUS) funded by the Federal Ministry of Education and Research (BMBF) – Germany.
We are grateful to the Berlin subway operator Berliner Verkehrsbetriebe (BVG) for supporting our research and allowing us to use their infrastructure.
Edited by: Werner Daum
Reviewed by: three anonymous referees
Albani, J. R.: Structure and dynamics of macromolecules: Absorption and fluorescence studies, edited by: Albani, J. R., Elsevier, Amsterdam, ISBN 978-0-444-51449-3, 2004. a
Brüne, M., Pflitsch, A., Agnew, B., and Spiegel, J.: Dynamics of natural air flow inside subway tunnels, in: Proceedings from the Fifth International Symposium on Tunnel Safety and Security, edited by: Lönnermark, A. and Ingason, H., 1, 329–337, SP Technical Research Institute of Sweden, Borås and Sweden, 2012. a
Dakin, J. P., Pratt, D. J., Bibby, G. W., and Ross, J. N.: Distributed optical fibre Raman temperature sensor using a semiconductor light source and detector, Electron. Lett., 21, 569–570, https://doi.org/10.1049/el:19850402, https://doi.org/10.1049/el:19850402, 1985. a, b
Ghafoori-Shiraz, H. and Okoshi, T.: Optical frequency-domain reflectometery, Opt. Quant. Electron., 18, 265–272, https://doi.org/10.1007/BF02029871, 1986. a
Hill, W., Kübler, J., and Fromme, M.: Single-mode distributed temperature sensing using OFDR, in: (EWOFS'10) Fourth European Workshop on Optical Fibre Sensors, edited by: Santos, J. L., Culshaw, B., López-Higuera, J. M., and MacPherson, W. N., SPIE Proceedings, p. 765342, SPIE, https://doi.org/10.1117/12.866246, 2010. a, b, c
Li, W. and Bao, X.: High spatial resolution distributed fiber optic technique for strain and temperature measurement in concrete structures, in: International Workshop on Smart Materials and Structures, SHM and NDT for the Energy Industry, available at: http://www.ndt.net/article/ndt-canada2013/presentations/26_Li.pdf (last access: 12 February 2018), 2013. a
LIOS Technology: DTS Systems – Controller Data Sheet, Datasheet Edn.: 18 July 2014, LIOS Technology GmbH, 2008. a
LIOS Technology: Distributed Temperature Sensing, available at: http://www.lios-tech.com/Menu/Technology/Distributed+Temperature+Sensing (last access: 3 April 2017), 2016. a, b
Schröder, B., Arnold, L., Schmidt, S., Brüne, M., and Meunders, A.: High parametric CFD-analysis of fire scenarios in underground train stations using statistical methods and climate modelling, in: 10th International Conference on Performance-Based Codes and Fire Safety Design Methods, edited by: SFPE, 2014. a
Tanner, M. G., Dyer, S. D., Baek, B., Hadfield, R. H., and Nam, S. W.: High-resolution single-mode fiber-optic distributed Raman sensor for absolute temperature measurement using superconducting nanowire single-photon detectors), in: Applied Physics Letters, Melville, NY, https://doi.org/10.1063/1.3656702, 2011. a
Valensi, J.: Piston Effects in the Underground Stations of Marseille Metro, in: The Third International Symposium on the Aerodynamics and Ventilation of Vehicle Tunnels, edited by: BHRA Fluid Engineering, 1, 47–56, Cranfield, 1979. a
- Abstract
- Introduction and motivation
- Temperature sensing method
- Setup of measurements
- Recorded temperatures in the tunnels
- Sensor calibration and localization of control loggers
- Response time
- Correlations of measurements
- Deriving airflow from temperature profiles
- Conclusions
- Data availability
- Competing interests
- Special issue statement
- Acknowledgements
- References