the Creative Commons Attribution 4.0 License.
the Creative Commons Attribution 4.0 License.
Quantitative measurement of combustion gases in harsh environments using NDIR spectroscopy
Christian Niklas
Stephan Bauke
Fabian Müller
Kai Golibrzuch
Hainer Wackerbarth
Georgios Ctistis
The global climate change calls for more environmentally friendly use of energy and has led to stricter limits and regulations for the emissions of various greenhouse gases. Consequently, there is nowadays an increasing need for the detection of exhaust and natural gases. This need leads to an ever-growing market for gas sensors, which, at the moment, is dominated by chemical sensors. Yet, the increasing demands to also measure under harsh environmental conditions pave the way for non-invasive measurements and thus optical detection techniques. Here, we present the development of two optical detection systems using non-dispersive infrared absorption spectroscopy (NDIR). One system is intended for civilian use, capable of detecting both CO as well as CO2 in the range of 4–5 µm. Furthermore, restrictions regarding size and economic viability are put on this sensor so it can compete with existing sensors. For CO2, an estimated resolution of 444 ppm is achieved, which is competitive with established sensors on the market. For CO an estimated resolution of 1401 ppm was achieved, rendering it necessary to improve this sensor to be competitive with other available sensors. The second system is used in an exhaust system and is capable of detecting CO2 at 3.2 µm facing cross-sensitivity with H2O. A data analysis method is described to separate the CO2 and H2O signals, revealing a time resolution of 33 µs.
- Article
(4020 KB) - Full-text XML
- BibTeX
- EndNote
In today's world, climate change is one of the most demanding problems for our modern society, with significant technological challenges in various areas. One of the main species contributing to global warming, carbon dioxide (CO2), has increased from a level of 310 ppm in the year 1972 to 410 ppm today (German Environment Agency, 2017). Therefore, the control and limitation of CO2 are gaining importance, resulting in the need for gas detectors that are able to measure corresponding concentrations with sufficient precision at the location of emissions. Furthermore, besides environmental control, safety as well as process and quality control are also important applications for gas sensors. A well-known safety issue is the control of combustion gases of civilian fireplaces. Here, carbon monoxide (CO) is one of the most relevant gas species besides CO2. The odorless CO is extremely toxic due to its chemical property of binding strongly to hemoglobin and therefore inhibiting oxygen transport (Ernst and Zibrak, 1998). Rooms with concentrations above 30 ppm are deemed hazardous for a person's health for a longer exposure (Federal Institute for Occupational Safety and Health, 2006). Moreover, the detection of CO is also environmentally important due to the fact of seasonal fluctuations and global transport (Zellweger et al., 2009).
Another important area for CO2 detection is exhaust emission control in the automobile and transport sector. Here, forthcoming new limits for CO2 and NOx emission set by the European Union (European Parliament and Council, 2009) are forcing the development of more efficient and cleaner engines. Both are usually achieved by controlling and optimizing the combustion process, i.e., mixture formation prior to ignition (Grosch et al., 2014, Bauke et al., 2018, Golibrzuch et al., 2017). A typical approach to reducing NOx emissions is the use of exhaust gas recirculation (EGR) to lower combustion temperature. EGR rates can be determined by monitoring CO2 concentrations (Grosch et al., 2014). Besides looking into the combustion process inside the engine, one can also analyze the exhaust gas (Muda et al., 2009; Dooly et al., 2012; Mulrooney et al., 2007, 2008; Spelman et al., 2003).
In contrast to sensors for civilian applications requiring low-cost solutions, systems for engine development application are less price-sensitive but have, on the other hand, more demanding requirements. For example, they need to offer µs time resolution to enable crank-angle resolution and resolve single engine cycles (Grosch et al., 2014, Bauke et al., 2018).
To date, electrochemical and resistive sensors dominate the market for gas sensors (Sensor Trends, 2014). Electrochemical sensors use two or three electrodes and reduce or oxidize the target gas and measure the resulting electrical current, allowing a cheap detection method (Stetter et al., 2003). Nonetheless, these sensor types face various problems, e.g., limited durability due to the electrolyte or susceptibility to different gases (Ricco et al., 1997). Here, hydrogen sulfides can influence the measurement of CO2, which is especially dangerous for sewer measurements. Furthermore, electrochemical sensors cannot be used in the environment of an internal combustion (IC) engine, as it is prone to the harsh environment and not capable of a high time resolution needed to analyze the mixture process of the fuel.
Where electrochemical sensors face usage limitations, application of optical sensors is often advantageous. In combustion diagnostics, a frequent approach is the use of laser-induced fluorescence (LIF) for measurements of temperature or fuel concentrations with high spatial resolution. However, LIF measurements require sufficient optical access, do not allow real-time resolution, and are time-consuming due to the complex experimental setup (Schulz and Sick, 2005; Luong et al., 2008). Most importantly, most gas-phase molecules cannot be excited to appropriate electronic states, so measurements rely on the use of fluorescent markers (tracer) that represent the species of interest.
Instead, non-dispersive infrared (NDIR) spectroscopy can be utilized for both civilian fireplaces as well as IC engines, where gas-specific infrared absorption spectra, present in almost any molecule, are used to determine the density of a gas.
In this work, we present the development of two sensors based on NDIR spectroscopy in harsh environments: (1) a low-cost sensor for civilian fireplaces and (2) a high-speed sensor for determination of EGR rates in IC engines. Thereby, the sensors face the following difficulties: simultaneous measurement of two gases at different concentrations and simultaneous measurement of overlapping absorption of the analytes.
Prior to the presentation of details on the respective sensor systems, we introduce the basic principle of NDIR spectroscopy as well as the relevant spectroscopic properties of CO2, CO, and H2O.
The first sensor is intended to be used in civilian fireplaces. Here, the difficulties arise from the simultaneous detection of two different gas species, CO2 and CO, respectively, which are present at largely different concentrations. The intended sensor setup and its optical components are described and explained. Furthermore, exemplary measurements of the setup taken at atmospheric conditions are shown.
The second sensor is intended for monitoring EGR rates in IC engines. Here, CO2, being the major combustion product, is the target gas. So far, CO2 detection in IC engines using NDIR has been limited to empirical approaches, which proves to be valid only under a certain condition, i.e., concentrations <4 % and pressures >4 bar (Vanhaelst et al., 2013). Here, we apply a physically reasonable procedure based on spectroscopic data from the HITRAN database to quantify CO2 as well as H2O. For each sensor, we describe the field of application and give a brief overview of the setup and its optical components. Furthermore, a data analysis strategy is presented. An exemplary measurement at a test engine is shown and compared to known properties to validate the data analysis. The article concludes with a summary and outlook.
The concentration of the greenhouse gases CO and CO2 in combustion processes can be measured by means of non-dispersive infrared (NDIR) absorption spectroscopy. Thereby, infrared radiation is absorbed by the gas molecules as described by the Beer–Lambert–Bouguer law. The measured radiation intensity is then given by
where I0 is the radiation intensity of the source; i.e., without gas in the absorption path, α is the absorption coefficient of the molecules, ν the light frequency, and L the absorption path length. Integration over a frequency interval leads to
Here, is the frequency-, pressure-, and temperature-dependent absorption cross section and ρ the density of the specific gas. To describe real absorption measurements, Eq. (2) needs to accommodate the systems' transfer function, i.e., the systems' transmission:
with τfilter(ν) the transmission spectrum of the filter, Sdetector the sensitivity of the detector, and ILS(ν) the spectral intensity of the light source. These are the most common optical components, and this equation can be further expanded to include other used components such as optical fibers. Combining Eqs. (2) and (3), the normalized transmission τ in NDIR is then given by
The absorption spectra of the desired gases and their interference with other specimens found in combustion processes are first calculated using the HITRAN database (Gordon et al., 2017) and Eq. (2). The results set limits to the wavelength as well as detection range for each gas species and for each setup. The absorption spectra for the most relevant constituents are shown in Fig. 1. The concentrations of the carbon oxides used for the calculations are the upper limits allowed in civilian fireplaces (VDI, 2010). H2O concentration is chosen large enough to see any overlaps; concentrations of water vapor in combustion processes can vary extremely with operation conditions. For the first sensor, intended to be used in civilian fireplaces, the spectral range between 2000 and 2500 cm−1 is chosen, which lies in the mid-infrared (MIR) spectral region, as shown in Fig. 1a.
Here, the rotational–vibrational absorption is very strong; i.e., the absorption coefficients for both CO and CO2 are very large. The dominant excited vibration for CO is the stretch vibration and for CO2 the ν3 antisymmetric stretch vibration (Gerakines et al., 1995). Furthermore, there is little to no interference with other gases. Figure 1b shows the high-frequency spectral region (NIR) of the absorption spectrum, which is the spectral region chosen for the second sensor.
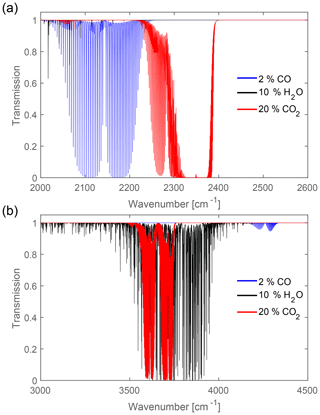
Figure 1(a) Spectra of exhaust gases common in civilian fireplaces in the range 2000–2500 cm−1 at T=300 K and p=1 bar with an absorption length L=6 cm. Both CO and CO2 have strong absorption bands in this part of the infrared spectral region. (b) The spectral response of CO, CO2, and H2O in the near-infrared (NIR) from 3000 to 4500 cm−1. The absorption of CO is too low to be used in NDIR spectroscopy, but CO2 and H2O both have strong but overlapping absorption bands.
As is shown, there is a strong overlap between CO2 and H2O, which has to be accounted for in the data analysis.
4.1 Sensor for use in civilian fireplaces
This sensor is a combined sensor able to simultaneously detect CO and CO2 and is intended to be used by chimney sweepers. Therefore, it has to be durable, cost-effective, low-maintenance, easy-to-use, and compact, and uphold measurement regularities. These regularities demand the detection of the two carbon oxides in different detection ranges: CO needs to be detected in the range up to 2 % vol, and CO2 up to 20 % vol.
In our setup, we first determined the absorption length for both carbon oxides in order to design a compact sensor for both gas components. For this purpose, we simulate the response using the HITRAN database computing the integrated transmission in Eq. (4). The transfer function of the sensor (τsys) is illustrated in Fig. 2a, where the area beneath τsys is the integrated transmission signal. In fact, the recorded signal is very low, which is here a direct result of the emission characteristics of the light source (black-body radiation at 2000 K) and the sensitivity of the detector in this spectral region.
Exemplary, integrated transmissions for different concentrations of CO and CO2 are calculated for an absorption length of 5 cm and shown in Fig. 2b.
From the derived curves one can determine that CO has a much weaker absorption coefficient in comparison to CO2, and thus a higher absorption length (factor of 10) is required for a sufficient sensitivity. Furthermore, a large dynamic range of the CO2 sensor extends only up to concentrations of about 5 % vol, being equivalent to a small absorption length for CO2.
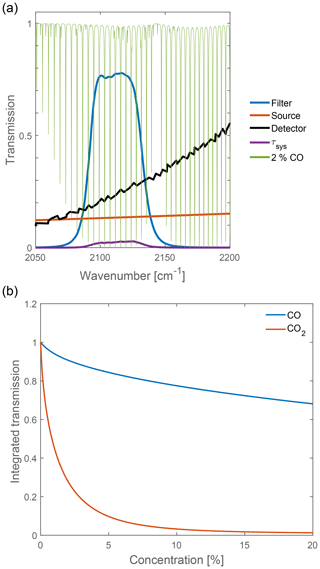
Figure 2(a) Spectral influences on the measured signal. The area beneath τsys is the integrated transmission which is equivalent to the measurement signal. (b) Calculated integrated transmission for CO and CO2 for an absorption length of 5 cm. The difference in the curves shows the need for two different absorption path lengths in the setup to acquire a desirable resolution.
A design for a combined sensor for both carbon oxides has to take the aforementioned differences into account. The main difficulty lies thereby in the combination of the different measurement ranges where the sensor should show a high dynamic response. For typical sensor applications in a civilian environment CO2 concentrations range in the % vol (0.2 % vol–20 % vol), while CO concentrations at the same time lie in the ppm regime (0–200 ppm), as the latter is highly toxic and 30 ppm is the suggested upper limit for working conditions by the BAuA (Federal Institute for Occupational Safety and Health, 2006).
A sketch of a setup for each gas is depicted in Fig. 3.
A larger absorption length for CO may be realized by means of a multi-pass cavity, so the sensor dimensions still remain compact. As a light source we chose a bulb with a tungsten filament emitting black-body radiation at 2000 K. For use as a detector there are two reasonable options: a photo-resistor and a pyroelectric detector. The advantage of the latter is its low price, while the former exhibits the better signal-to-noise ratio. Here, a PbSe photo-resistor has been used. The circuit to achieve a measurable signal is a Wheatstone bridge with an amplifier circuit. Exemplarily, measurements for both gases are shown in Fig. 4.
In panel (a), the CO2 sensor shows a saturation behavior. This is due to the saturation of the CO2 transmission filter for its central wavenumbers, as shown in Fig. 1a, so at higher concentrations only the shoulders of the filter spectrum contribute to the signal change. The regression has the form
The sensitivity s of the sensor can be calculated from the derivative of the regression function:
To give an overview of the sensor attributes, the weighted average of the sensitivity is calculated to . With the standard deviation of the measurement points σmeas. the resolution Δr can be calculated as
which leads to an overall CO2 resolution of ppm. A hazardous workplace environment is defined above 0.5 % vol (Federal Institute for Occupational Safety and Health, 2006), so the resolution is usable for civilian fireplaces.
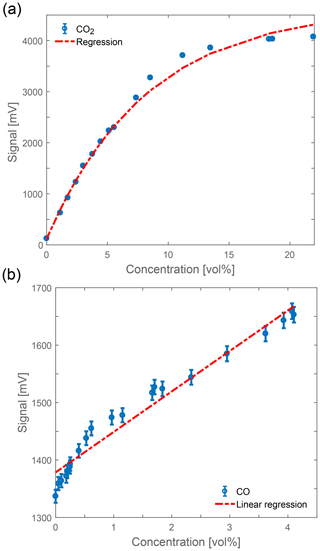
Figure 4Measurements of (a) CO2 and (b) CO at atmospheric conditions (1 bar, 300 K) and a 5 cm absorption path. The slope is positive due to an inverted detector circuit. Included are the regression functions as dotted lines.
In Fig. 4b, the CO sensor shows an approximately linear dependence as expected from Fig. 2b. The fluctuations visible in the measurement are a result of the cooling routine of the sensor. The sensitivity is µV ppm−1, which results in a resolution of ppm. As already mentioned, a CO concentration over 30 ppm is hazardous to be exposed to for a longer time. Therefore, the sensitivity of CO needs to be enhanced to achieve a higher resolution. This can be accomplished on the one hand by the use of better detectors, which would result in more expensive sensors, and, on the other hand, a larger absorption path length. The development of the latter, i.e., a multi-pass configuration for the CO absorption measurements, is a task of current research.
4.2 Exhaust gas sensor for IC engines
While the sensor described above represents a cost-sensitive down-market application, NDIR spectroscopy might also be used in more demanding environments in research and development. In the following section, we present a second sensor capable of quantification of residual gas concentrations in internal combustion (IC) engines. In contrast to the fireplace exhaust sensor described above, an IC engine requires measurements under highly dynamic conditions with pressures and temperatures ranging from 1 to 40 bar and from 300 to 1000 K, respectively. Moreover, the sensor needs to offer a high temporal resolution (at least <1 ms). Since the field of application is less cost-sensitive, the requirements can be met by the use of high-end components. Moreover, an accurate quantification over the wide range of conditions requires a more sophisticated data analysis that uses the well-known spectroscopic properties of the molecules.
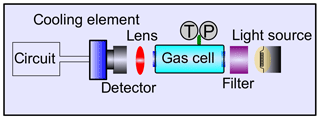
The sensor system used in this work is a modification of the Internal Combustion Optical Sensor (ICOS) from LaVision GmbH. Its working principle and optical design have been described extensively elsewhere (Grosch et al., 2014; Golibrzuch et al., 2017; Bauke et al., 2018). The schematic layout of the system is shown in Fig. 5a.
Briefly, the system consists of a broad-band light source (150 W quartz–tungsten–halide (QTH) lamp), a spark plug sensor probe, and a detection unit. The light from the QTH lamp is modulated by a 30 kHz chopper wheel, which determines the maximum time resolution to about 33 µs, and coupled into a ZrF4 mid-infrared fiber. The time resolution is sufficient to enable crank-angle resolution of single cycles in IC engines up to 5000 rpm. The ZrF4 fibers guide the light to the spark plug probe and back to the detection unit. Inside the probe, sapphire fibers guide the light to the detection volume, where it is reflected back by a concave mirror located in a stainless steel cage holder. The absorption path is 0.96 cm. The sapphire fibers are necessary to withstand the high temperature during fired engine operation, but limit detection to wavelengths λ < 3.6 µm. Inside the detection unit the light passes a cascaded array of mercury–cadmium–telluride (MCT) detectors equipped with different bandpass filters. An overview of bandpass filters used in this work is shown in Fig. 5b. The system consists of a filter for fuel concentration measurements, utilizing the absorption of C–H stretch vibrations of hydrogen carbons around 3100 cm−1 as well as two detection channels for water and CO2 and an “offline” reference filter situated in a spectral range with negligible absorption of any present molecular species. The reference filter serves as a correction for signal disturbances due to, e.g., beam steering or particles in the beam path. Note that the effective transmittance curves differ from the raw ones due to the serial assembly of the filters. Fuel concentration measurements are beyond the scope of this work, but have been demonstrated for gasoline (Grosch et al., 2007, 2010, 2011) as well as methane-fueled engines (Bauke et al., 2017, 2018; Golibrzuch et al., 2017; Kranz et al., 2018), and we will focus on the quantification of residual gas, i.e., CO2 and H2O.
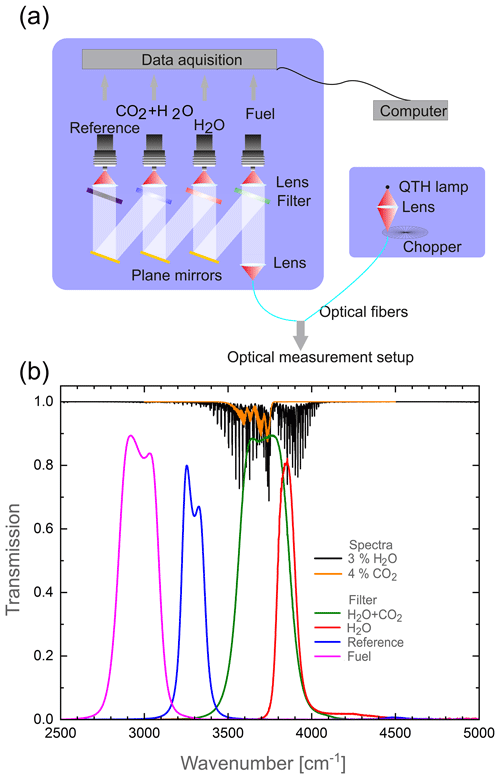
Figure 5(a) Schematic of the ICOS sensor system consisting of different measurement channels. (b) Transmission spectra of the bandpass filters used in the ICOS sensor system as well as the spectra for H2O and CO2. Note that the serial assembly causes the bandpass filter, influencing each other.
Since the extreme conditions in an IC engine require the use of sapphire fiber to guide the light into the combustion chamber, CO2 detection at 2400 cm−1 is impossible. Therefore, the detection is limited to the weaker absorption band around 3700 cm−1 which, however, is completely blended by water absorption. Consequently, a strategy is required to correct the influence of water vapor. As visible from the spectra shown in Fig. 5b, the H2O absorption covers a much larger spectral range than CO2. Therefore, a second filter that is only sensitive to water is used to determine the H2O amount independently. Additional complexity arises, since dynamic changes in pressure and especially temperature need to be accounted for.
4.2.1 Data analysis
In order to enable quantification in the large range of experimental conditions, the data analysis procedure relies on the complete description of the molecule's spectroscopic properties, making use of the HITRAN database (Gordon et al., 2017), as well as the spectral influences of the optical system (see Eq. 4). This procedure has recently been described in more detail in Golibrzuch et al. (2017) and Bauke et al. (2018) for methane and might be applied for CO2 and H2O accordingly.
Briefly, we use the spectroscopic constants from HITRAN to calculate the transmission of the H2O+CO2 and H2O detection channels for different CO2 and H2O concentrations as a function of temperature and pressure ranging from 250 to 1000 K and from 0.1 to 40 bar, respectively. The computed data are then used to build a 3-D look-up table that links the measured transmission to the corresponding molecules' density for different pressures and temperatures.
So far, residual gas concentration measurements using NDIR have been carried out by empirical approaches (Vanhaelst et al., 2013), enabling only quantification of CO2 in concentrations <4 % and pressures >4 bar. In principle, a physically correct description of the spectroscopic properties of the system eliminates these limitations. We emphasize that the HITRAN-based approach has so far only been applied for quantification of methane, where the absorption is well separated from other gas species occurring in IC engines. In contrast, the quantification of CO2 and H2O has to be carried out in a spectral region where the respective absorption bands overlap, requiring a new strategy to disentangle the absorptions caused by the two gas species.
While temperature and pressure information for the civilian fireplace sensor is easily accessible, the IC sensor faces significant problems, especially regarding the temperature in the measurement volume. Time-resolved pressure measurements are usually available at engine test stations, but temperature is usually unknown due to the comparably low speed of standard probes. Moreover, the temperature in the measurement volume, surrounded by a metal cage, can differ strongly from the temperature commonly calculated by thermodynamic models (Golibrzuch et al., 2017; Kranz et al., 2018). Therefore, temperatures need to be estimated from modified thermodynamic models or measured by other spectroscopic techniques (Luong et al., 2008; Werblinski et al., 2017); the latter might however require the use of an additional probe. The possibility of determining temperatures using NDIR probing different spectral regions of an absorption band simultaneously has thereby been demonstrated recently for the case of methane (Golibrzuch et al., 2017; Bauke et al., 2018). In the case of CO2∕H2O, this would however require the use of third filter, which would further raise the complexity of the system and the data analysis procedure. Given that all information for quantification (transmission, pressure, and temperature) is available, the remaining challenge is to disentangle absorption due to CO2 and H2O, respectively.
The sensor system offers transmission information in a spectral region with only H2O absorption lines as well as for a region with combined CO2 and H2O absorption. In a first approximation, we assume that the absorption in the overlapping region can be described as the product of transmission caused by H2O and CO2:
It is important to note here that , , and are broadband transmittance values. While Eq. (8) would be completely valid for frequency-dependent transmittance, it is only an approximation for direct multiplication of integrated broadband values.
Since the water density can be determined from the pure H2O signal in the second detection channel, can be calculated and the CO2 density remains the only unknown variable to be determined. Figure 6 shows a schematic overview of the data analysis procedure applied in this work. Note that the temperature information affects different points of the procedure.
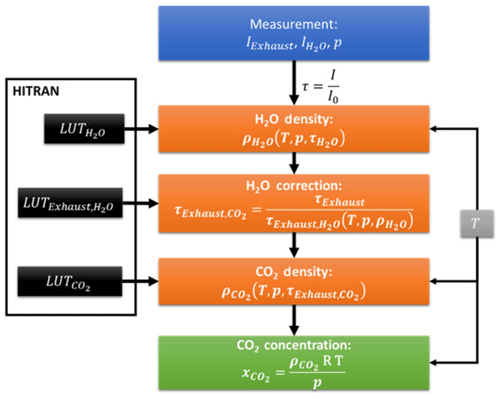
Figure 6Schematic overview of the data analysis procedure for determination of CO2 concentrations in IC engines by NDIR.
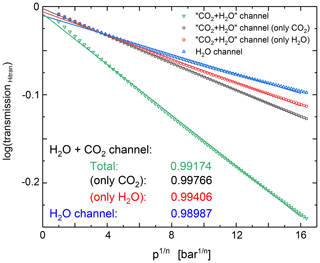
Another important issue is the determination of I0, i.e., the signal without absorption species in the beam path. In contrast to fuel concentration measurements, where I0 can be determined before fuel enters the combustion chamber (Golibrzuch et al., 2017; Kranz et al., 2018), water and CO2 are always present in ambient air as well as exhaust gas. Therefore, the detector signal received at the lowest gas density always contains some absorption. In order to eliminate this effect, we developed a method for I0 determination by extrapolation to p=0. In an IC engine, temperature and pressure usually follow an polytropic compression:
where p0 and T0 are the pressure and temperature prior to compression and n is the polytropic coefficient. Assuming that the Beer–Lambert–Bouguer law (Eq. 2) is also approximately valid for integrated transmission using an “integrated absorption cross section”, σ,
Equation (10) can be linearized to
For a polytropic compression the gas density can be expressed using the ideal gas law as
and with Eq. (9):
Consequently, I0 can be extracted as the intercept of a linear fit to ln (I) as a function of . An accurate I0 determination requires that the approximations of Eq. (11) and the integrated absorption cross section σ being independent of pressure and temperature are valid. Figure 7 shows HITRAN simulation of the signals in the H2O+CO2 and H2O detection signals for a typical polytropic compression. The data show that the approximations made above hold reasonably well for most signals and can be judged from the intercept of the linear fits being close to 0 (I0=1). The best results are expected if only CO2 is present since the respective bandpass filter covers the complete CO2 absorption band. In the case of H2O, the sensor sees only a part of the absorption, and temperature effects due to redistribution of rotational states are more relevant.
4.2.2 Quantification of CO2 and H2O in an IC engine
We test the system and data analysis procedure in a methane-fueled IC engine under motored (pure air) and fired operation under stoichiometric conditions. Details of the engine used in this work are given in Kranz et al. (2018). Figure 8 gives an overview of the respective results averaged over 100 engine cycles. Panel (a) shows the measured transmission signals under motored (dashed lines) and fired (solid lines) conditions for both channels, CO2+H2O (black) and H2O (red), respectively. Panel (b) shows corresponding temperature (black) and pressure (blue) data. Note that the temperature data were obtained in a separate measurement using spectrally resolved water absorption measurement from an ICOS-Temperature system (LaVision GmbH) (Bauke et al., 2018; Werblinski et al., 2016, 2017 for the operation principle). Panels (c) and (d) show the results for CO2 and H2O concentrations obtained using the data analysis described above. Under motored engine operation, we determine a CO2 concentration of about 0.05 %, which is in good agreement with an ambient CO2 concentration of 0.04 % but close the detection limit of the system. The water concentration is determined to approx. 1 % corresponding to about 40 % humidity at 293 K (Wexler, 1976). Consequently, the motored data indicate that the analysis algorithm and modeling yield results over a wide range of pressure and temperature which are consistent with typical ambient conditions. However, more detailed validation experiments in, e.g., static pressure cells or a rapid compression engine are needed in order to evaluate achievable accuracy and precision.
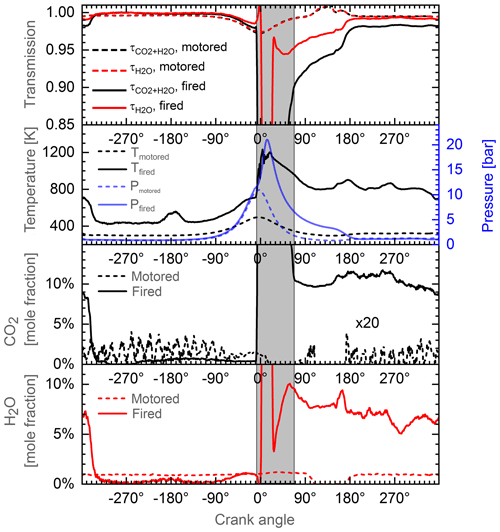
Figure 8Measurements of CO2 and H2O concentrations in a methane-fueled IC engine. Dashed lines: motored operation with laboratory air. Solid lines: fired operation with methane port-fuel injection at a global λ=1 (stoichiometric combustion). The gray area indicates time of combustion, which is excluded from the data interpretation due to partial saturation of the detectors from the flame emissions.
Nevertheless, the promising motored results enable a first evaluation of the system and fired engine operation conditions (solid lines in Fig. 8). The IC engine was operated with methane port-fuel injection under global stoichiometric conditions. At the beginning of the engine cycle at , we obtain CO2 and H2O concentrations of about 9 % and 7 %, respectively. After opening of the intake valves at −334 ∘CA, a mixture of ambient air and methane enters the combustion chamber, leading to a strong decrease in the exhaust gas concentrations. During compression from −180 to CA, air, fuel, and residual exhaust gas undergo a process of mixture formation resulting in final CO2 and H2O concentrations of 0.4 % and 1 %, respectively. After ignition at CA, the transmission signals exhibit a steep decrease due to flame emission partially saturating the detectors (gray area). The region is therefore excluded from the data analysis. After combustion, the temperature remains at about 800 K with CO2 and H2O concentrations of about 10 % and 8 %. From these data, we can estimate the EGR rate to be approximately 5 %. The EGR rate might also be estimated from pressure, temperature, and volume using the ideal gas law. Before opening of the intake valve at −334 ∘CA (pIVO=0.96 bar, TIVO=600 K, VIVO=66.1 ccm), a remaining gas amount of can be estimated. After intake valve closing at −184 ∘CA (pIVC=0.84 bar, TIVC=335K, VIVC=594 ccm), the total gas amount increased to . Comparison nIVO to nIVC gives an EGR rate of 7 %, consistent with the sensor data.
We presented here two gas sensors based on non-dispersive infrared spectroscopy for high and low tech. We outlined the development of these sensors, one intended for civilian fireplaces with the ability to detect CO as well as CO2 and the other for IC engines, capable of CO2 and water vapor detection. Potential spectral regions for the detection of CO2 were identified between 3400 and 4000 and from 2200 to 2400 cm−1, whereas the former strongly overlaps with water absorption bands. This disadvantage leads to the necessity for a water absorption channel and additional calculations to separate CO2 and H2O.
Additionally, in the lower-frequency region from 2200 to 2400 cm−1 CO has absorption bands, which only have a negligible overlap with the CO2 absorption bands. This enables the simultaneous determination of the concentrations in a single sensor, which is suitable for civilian fireplaces based on non-dispersive infrared spectroscopy. The absorption behaviors of CO and CO2 are compared and their optimal absorption lengths were discussed, whereas CO needs a long and CO2 needs a short absorption length. Furthermore, we discussed possible optical components for the sensor. The final main components are a thermal broadband emitter, optical filter, and PbSe photo-resistor. The presented sensor is capable of a resolution of 444 ppm for CO2 and 1401 ppm for CO at an absorption length of L=5 cm. Due to the usage of a PbSe detector, temperature has a tremendous influence on the sensor, which can especially be observed during the CO measurement. Here, the cooling routine of the sensor is visible in oscillations of the measurement points in time. To minimize the influence of temperature and get rid of thermal oscillations, an improved cooling routine has to be implemented. Furthermore, it is advisable to use another material as a detector, as lead (Pb) may be further regulated by the European Union. Here, InAsSb or pyroelectric sensors may be utilized. It is also possible to use a different spectral filter for the detection of CO2, as for higher concentrations oversaturation is encountered. It can be advisable to use a CO2 sensor on the flanks of the CO2 absorption, so a linear measurement might be possible.
The spectral region between 3000 and 4500 cm−1 and its CO2 absorption are utilized for a sensor intended for IC engines due to limitations for mid-infrared fiber guides. To address the overlap of H2O and CO2 in this spectral region, the detector consists of multiple detection channels built like a cascade to achieve a single detection channel of H2O and a compound channel of the mixture of H2O and CO2. A calculation routine utilizing look-up tables is presented to achieve a single water and CO2 signal. This sensor is capable of high time resolutions up to 33 µs and faces huge challenges due to a harsh and highly dynamic (temperature and pressure) environment. We demonstrated an application of the system to an IC engine under motored and fired operation. The results under motored operation were consistent with typical ambient conditions. For fired conditions, these data could be used to calculate the EGR rate which was in agreement with thermodynamic estimations. Nevertheless, further validation of the sensor and data analysis under more controlled conditions (e.g., in static pressure cells or a rapid compression engine) is required to determine its accuracy and precision over a wide range of temperatures and pressures.
The experiments and results shown in this publication are strongly industry-related research. We explain our experimental preparations and analysis steps in great detail in this work and are available for questions. Please understand that therefore we do not publicly provide the underlying data and MATLAB code used for analysis. Given individual requests by fellow researchers, we will of course consider making parts of the data available.
All authors contributed equally to the manuscript preparation. Experiments for civilian fireplaces were performed by CN, FM, HW, and GC. Experiments on IC engines were performed by SB, KG, and HW.
The authors declare that they have no conflict of interest.
This article is part of the special issue “Sensors and Measurement Systems 2018”. It is a result of the “Sensoren und Messsysteme 2018, 19. ITG-/GMA-Fachtagung”, Nürnberg, Germany, from 26 June 2018 to 27 June 2018.
The authors gratefully acknowledge financial support through the Federal
Ministry of Education and Research (BMBF, Germany), FKZ: 13N13035, and the
Federal Ministry for Economic Affairs and Energy (BMWi, Germany), FKZ:
ZF4060502WM6.
Edited by: Ravibabu
Mulaveesala
Reviewed by: two anonymous referees
Bauke, S., Golibrzuch, K., Rotter, F., Wackerbarth, H., Thiele, O., and Berg, T.: Quantitative, time-resolved detection of CH4 concentrations in flows for injection analysis in CNG engines using IR absorption, J. Sens. Sens. Syst., 6, 185–198, https://doi.org/10.5194/jsss-6-185-2017, 2017. a
Bauke, S., Golibrzuch, K., Wackerbarth, H., Fendt, P., Zigan, L., Seefeldt, S., Thiele, O., and Berg, T.: Optical sensor system for time-resolved quantification of methane concentrations: Validation measurements in a rapid compression machine, J. Quant. Spectrosc. Ra., 210, 101–110, https://doi.org/10.1016/j.jqsrt.2018.02.016, 2018. a, b, c, d, e, f, g
Dooly, G., Clifford, J., Leen, G., and Lewis, E.: Mid-infrared point sensor for in situ monitoring of CO2 emissions from large-scale engines, Appl. Optics, 51, 7636–7642, https://doi.org/10.1364/AO.51.007636, 2012. a
Ernst, A. and Zibrak, J. D.: Carbon monoxide poisoning, New Eng. J. Med., 339, 1603–1608, 1998. a
European Parliament and Council: Regulation No 443/2009, setting emission performance standards for new passenger cars as part of the Community's integrated approach to reduce CO2 emissions from light-duty vehicles, available at: http://eur-lex.europa.eu/legal-content/EN/TXT/PDF/?uri=CELEX:02009R0443-20140408&from=EN (last access: 27 February 2019), 2009. a
Federal Institute for Occupational Safety and Health: BArBl, 1, 41–55, 2006 (last update: GMBI 28, 542–545, 2018). a, b, c
Gerakines, P. A., Schutte, W., Greenberg, J., and van Dishoeck, E. F.: The infrared band strengths of H2O, CO and CO2 in laboratory simulations of astrophysical ice mixtures, Astron. Astrophys., 296, 810–818, 1995. a
German Environment Agency: Atmosphärische Treibhausgas-Konzentrationen, available at: https://www.umweltbundesamt.de/daten/klima/atmosphaerische-treibhausgas-konzentrationen#textpart-1 (last access: 1 July 2018), 2017. a
Golibrzuch, K., Digulla, F.-E., Bauke, S., Wackerbarth, H., Thiele, O., and Berg, T.: Optical sensor system for time-resolved quantification of methane densities in CH_4-fueled spark ignition engines, Appl. Optics, 56, 6049–6058, https://doi.org/10.1364/ao.56.006049, 2017. a, b, c, d, e, f, g
Gordon, I., Rothman, L., Hill, C., Kochanov, R., Tan, Y., Bernath, P., Birk, M., Boudon, V., Campargue, A., Chance, K., Drouin, B., Flaud, J.-M., Gamache, R., Hodges, J., Jacquemart, D., Perevalov, V., Perrin, A., Shine, K., Smith, M.-A., Tennyson, J., Toon, G., Tran, H., Tyuterev, V., Barbe, A., Császár, A., Devi, V., Furtenbacher, T., Harrison, J., Hartmann, J.-M., Jolly, A., Johnson, T., Karman, T., Kleiner, I., Kyuberis, A., Loos, J., Lyulin, O., Massie, S., Mikhailenko, S., Moazzen-Ahmadi, N., Müller, H., Naumenko, O., Nikitin, A., Polyansky, O., Rey, M., Rotger, M., Sharpe, S., Sung, K., Starikova, E., Tashkun, S., Auwera, J. V., Wagner, G., Wilzewski, J., Wcisło, P., Yu, S., and Zak, E.: The HITRAN2016 molecular spectroscopic database, J. Quant. Spectrosc. Ra., 203, 3–69, https://doi.org/10.1016/j.jqsrt.2017.06.038, 2017. a, b
Grosch, A., Beushausen, V., Thiele, O., and Grzeszik, R.: Crank Angle Resolved Determination of Fuel Concentration and Air/Fuel Ratio in a SI-Internal Combustion Engine Using a Modified Optical Spark Plug, in: SAE Technical Paper Series, SAE International, https://doi.org/10.4271/2007-01-0644, 2007. a
Grosch, A., Beushausen, V., Wackerbarth, H., Thiele, O., and Berg, T.: Temperature- and pressure-dependent midinfrared absorption cross sections of gaseous hydrocarbons, Appl. Optics, 49, 196–203, https://doi.org/10.1364/ao.49.000196, 2010. a
Grosch, A., Beushausen, V., Wackerbarth, H., Thiele, O., Berg, T., and Grzeszik, R.: Calibration of mid-infrared transmission measurements for hydrocarbon detection and propane concentration measurements in harsh environments by using a fiber optical sensor, J. Quant. Spectrosc. Ra., 112, 994–1004, https://doi.org/10.1016/j.jqsrt.2010.11.016, 2011. a
Grosch, A., Wackerbarth, H., Thiele, O., Berg, T., and Beckmann, L.: Infrared spectroscopic concentration measurements of carbon dioxide and gaseous water in harsh environments with a fiber optical sensor by using the HITEMP database, J. Quant. Spectrosc. Ra., 133, 106–116, https://doi.org/10.1016/j.jqsrt.2013.07.021, 2014. a, b, c, d
Kranz, P., Fuhrmann, D., Goschütz, M., Kaiser, S., Bauke, S., Golibrzuch, K., Wackerbarth, H., Kawelke, P., Luciani, J., Beckmann, L., Zachow, J., Schuette, M., Thiele, O., and Berg, T.: In-cylinder LIF imaging, IR-absorption point measurements, and a CFD simulation to evaluate mixture formation in a CNG-fueled engine, SAE Technical Paper, 2018. a, b, c, d
Luong, M., Zhang, R., Schulz, C., and Sick, V.: Toluene laser-induced fluorescence for in-cylinder temperature imaging in internal combustion engines, Appl. Phys. B, 91, 669–675, https://doi.org/10.1007/s00340-008-2995-5, 2008. a, b
Muda, R., Dooly, G., Clifford, J., Mulrooney, J., Flavia, G., Merlone-Borla, E., Chambers, P., Fitzpatrick, C., and Lewis, E.: Simulation and measurement of carbon dioxide exhaust emissions using an optical-fibre-based mid-infrared point sensor, J. Opt. A-Pure Appl. Op., 11, 054013, https://doi.org/10.1088/1464-4258/11/5/054013, 2009. a
Mulrooney, J., Clifford, J., Fitzpatrick, C., and Lewis, E.: Detection of carbon dioxide emissions from a diesel engine using a mid-infrared optical fibre based sensor, Sensor. Actuat. A-Phys., 136, 104–110, https://doi.org/10.1016/j.sna.2006.11.016, 2007. a
Mulrooney, J., Clifford, J., Fitzpatrick, C., Chambers, P., and Lewis, E.: A mid-infrared optical fibre sensor for the detection of carbon monoxide exhaust emissions, Sensor. Actuat. A-Phys., 144, 13–17, https://doi.org/10.1016/j.sna.2007.12.013, 2008. a
Ricco, A. J., Butler, M. A., Horvai, G., and Silva, A. F.: Chemical and biological sensors and analytical electrochemical methods, The electrochemical Society, Inc., 1997. a
Schulz, C. and Sick, V.: Tracer-LIF diagnostics: quantitative measurement of fuel concentration, temperature and fuel/air ratio in practical combustion systems, Prog. Energ. Combust., 31, 75–121, https://doi.org/10.1016/j.pecs.2004.08.002, 2005. a
Sensor Trends: Trends in future-oriented sensor technologies, AMA Association for Sensor Technology: Berlin, Germany, 2014. a
Spelman, J., Parker, T., and Carter, C.: Fiber-coupled multiple-line infrared emission measurements to determine temperature, CO2, and H2O, J. Quant. Spectrosc. Ra., 76, 309–330, 2003. a
Stetter, J. R., Penrose, W. R., and Yao, S.: Sensors, chemical sensors, electrochemical sensors, and ECS, J. Electrochem. Soc., 150, S11–S16, 2003. a
Vanhaelst, R., Thiele, O., Berg, T., Hahne, B., Stellet, H.-P., Wildhagen, F., Hentschel, W., Joerdens, C., Czajka, J., Wisłocki, K., and Pielecha, I. : Optical infrared-sensor inside the cylinder to determine the EGR-and residual gas rate in diesel engine, Combustion Engines, 154, 3–11, 2013. a, b
VDI: Performance criteria and test procedures for measuring devices for monitoring emissions at small firing installations Measuring devices for the determination of gaseous emissions and flue gas parameters, Beuth Verlag, 2010. a
Werblinski, T., Kleindienst, S., Engelbrecht, R., Zigan, L., and Will, S.: Supercontinuum based absorption spectrometer for cycle-resolved multiparameter measurements in a rapid compression machine, Appl. Optics, 55, 4564, https://doi.org/10.1364/ao.55.004564, 2016. a
Werblinski, T., Fendt, P., Zigan, L., and Will, S.: High-speed combustion diagnostics in a rapid compression machine by broadband supercontinuum absorption spectroscopy, Appl. Optics, 56, 4443, https://doi.org/10.1364/ao.56.004443, 2017. a, b
Wexler, A.: Vapor pressure formulation for water in range 0 to 100 C. A revision, J. Res. Natl. Bur. Stand., 80, 775–785, 1976. a
Zellweger, C., Hüglin, C., Klausen, J., Steinbacher, M., Vollmer, M., and Buchmann, B.: Inter-comparison of four different carbon monoxide measurement techniques and evaluation of the long-term carbon monoxide time series of Jungfraujoch, Atmos. Chem. Phys., 9, 3491–3503, https://doi.org/10.5194/acp-9-3491-2009, 2009. a


