the Creative Commons Attribution 4.0 License.
the Creative Commons Attribution 4.0 License.
 | 18 Apr 2019
Impedance model for a high-temperature ceramic humidity sensor
Henrik Lensch
Manuel Bastuck
Tobias Baur
Andreas Schütze
Tilman Sauerwald
We present an equivalent circuit model for a titanium dioxide-based humidity sensor which enables discrimination of three separate contributions to the sensor impedance. The first contribution, the electronic conductance, consists of a temperature-dependent ohmic resistance. The second contribution arises from the ionic pathway, which forms depending on the relative humidity on the sensor surface. It is modeled by a constant-phase element (CPE) in parallel with an ohmic resistance. The third contribution is the capacitance of the double layer which forms at the blocking electrodes and is modeled by a second CPE in series to the first CPE. This model was fitted to experimental data between 1 mHz and 1 MHz recorded at different sensor temperatures (between room temperature and 320 ∘C) and different humidity levels. The electronic conductance becomes negligible at low sensor temperatures, whereas the double-layer capacitance becomes negligible at high sensor temperatures in the investigated frequency range. Both the contribution from the ionic pathway and from the double-layer capacitance strongly depend on the relative humidity and are, therefore, suitable sensor signals. The findings define the parameters for the development of a dedicated Fourier-based impedance spectroscope with much faster acquisition times, paving a way for impedance-based high-temperature humidity sensor systems.
- Article
(697 KB) - Full-text XML
-
Supplement
(452 KB) - BibTeX
- EndNote


Detection and quantification of humidity as a process parameter are important for many different branches of industry like food processing, medicine, climate control, or industrial drying (Blank et al., 2016). While capacitance measurement is by far the most common sensor principle at room temperature, current capacitance sensors cannot be used at higher temperatures due to their limited temperature stability and their bad sensitivity at low relative humidity (Blank et al., 2016; Lee and Lee, 2005; Wagner et al., 2011). Capacitance sensors in general exploit a permittivity change in the material caused by adsorbed or intercalated water. Ceramic-based sensors are an alternative choice with better temperature stability (Farahani et al., 2014). Titanium dioxide (TiO2) is a ceramic well known for its humidity sensing capabilities as well as its robustness at high temperatures (Blank et al., 2016). Humidity-dependent permittivity changes have been reported for TiO2 (Lee and Lee, 2005), however, with poor sensitivity at low humidity. An alternative read-out method of TiO2-based sensors measures the humidity-dependent conduction, providing better sensitivity at low temperatures. Conduction in TiO2 has been well described by several groups covering several conducting mechanisms (Traversa, 1995; Wang et al., 2011; Wu et al., 2017). These different mechanisms can be identified by impedance spectroscopy, which is a powerful tool to characterize electrochemical systems and therefore a promising method to gain many different, humidity-dependent signals from one physical sensor. This multitude of signals can help in understanding the physical processes on the sensor surface, as well as lead to a more robust sensor system working within a wide temperature range.
A major drawback when using impedance spectroscopy is the measurement time, i.e., the time it takes to record one full spectrum. Since most systems can only measure at one frequency at a time, and often repeat the measurement several times to improve the signal-to-noise ratio, a trade-off between the number of measured frequencies per spectrum and the measurement time must be made (Cooper et al., 2008). Long measurement times are especially problematic as the environmental conditions could change during the measurement, which makes quick measurements a key requirement for impedance spectroscopic measurements not only with chemical sensors (Cooper et al., 2008). A Fourier-based impedance spectroscope (FoBIS) mitigates this issue since the measurement time for a complete spectrum can be reduced to the period time of the lowest measured frequency (Doerr et al., 2018; Schüler et al., 2015). A FoBIS, however, must always be carefully designed with respect to the dynamic frequency and impedance range to obtain the desired resolution and accuracy. To this end, the impedance characteristic of a newly developed TiO2 sensor has been carefully characterized using a highly versatile laboratory impedance spectroscope of the frequency response analyzer type. Based on this characterization, a suitable physical sensor model, which despite its simplifications yields very high accuracy, has been developed. Interesting parts of the impedance spectrogram were identified and will be used in the future to tailor the newly developed FoBIS towards quick measurements which can be fitted with this physical model.
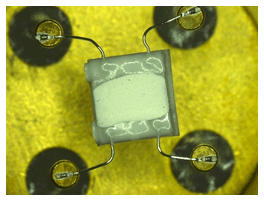
Figure 1Optical micrograph of the sensor. The size of the sensor element is 2 mm × 2.3 mm. The white material is TiO2, whereas the grey material is the alumina substrate.
2.1 Sensor prototype
The measurements were performed with prototype sensor samples from Umweltsensortechnik GmbH, Geschwenda, Germany. The sensor consists of a ceramic carrier substrate (Al2O3) with a micro-structured platinum thin-film layer for the interdigital electrodes and a platinum heater (Pt-10) as well as a humidity-sensitive TiO2 mixed oxide thick film. The sensor substrate is mounted by platinum wires in a four-pin TO39 case. Figure 1 shows an optical micrograph of the sensor.
2.2 Experimental setup
Humidity measurements were carried out in a gas mixing system consisting of two mass flow controllers (MFCs) which provide a defined gas flow ratio between dry and humid air. The dry air is taken from a zero-air generator with catalytic combustion and was fed through a bubbler flask filled with water to generate the humid air stream. This bubbler flask is followed by a second flask filled with glass wool to separate aerosols like water droplets. The whole humidifier system is placed in a climate chamber, which can be set to an elevated temperature to provide high absolute humidity (up to 447 mbar partial pressure of the humidity at 80 ∘C). The sensor is placed outside the climate chamber, for easy access and connections, in a heated sensor chamber. The sensor chamber and the humidifier are interconnected with a heated transfer line (T=120 ∘C) to prevent condensation. The sensor itself will be heated with its platinum heating element (Pt-10) providing quick heating and cool-down times (time constant below 10 s). For room temperature measurements, the heating system is switched off.
The impedance spectra are recorded with a Solartron 1260 frequency response analyzer. Some of the measurements, especially those at high impedances, were performed with the addition of the Solartron 1296 dielectric interface. For high impedance measurements the lower boundary of the investigated frequency was set to 1 mHz. For any other measurements, the lower boundary was set to 1 Hz to reduce the measurement time. The highest measured frequency was 1 MHz in all measurements. The following graphs will, however, in some cases be clipped to lower frequency ranges to highlight the effects in the shown range.
3.1 Electronic conductance
We measured the contribution of electronic conductance at 0 %RH from room temperature (Fig. 2) up to 250 ∘C (Fig. 3). The impedance was completely capacitive over the measured frequency range. This is directly visible in the slope of the magnitude or the absolute value of the phase angle; therefore, Bode diagrams are used instead of the also common Nyquist diagram. The slope of the magnitude in the Bode diagram is approx. −1 with a phase of approx. −90∘. These values represent a single ideal capacitor formed by the electrodes and the dielectric properties of the sensor material between the electrodes and, thus, a geometrical capacitance. Since only the capacitive part of the sensor is visible in the Bode diagram, it can be estimated that the influence of the conductance must be below that of the capacitance, hence below 1.5 pS.

Figure 2Magnitude of the sensor at room temperature in dry air. The outlier represents 50 Hz noise.
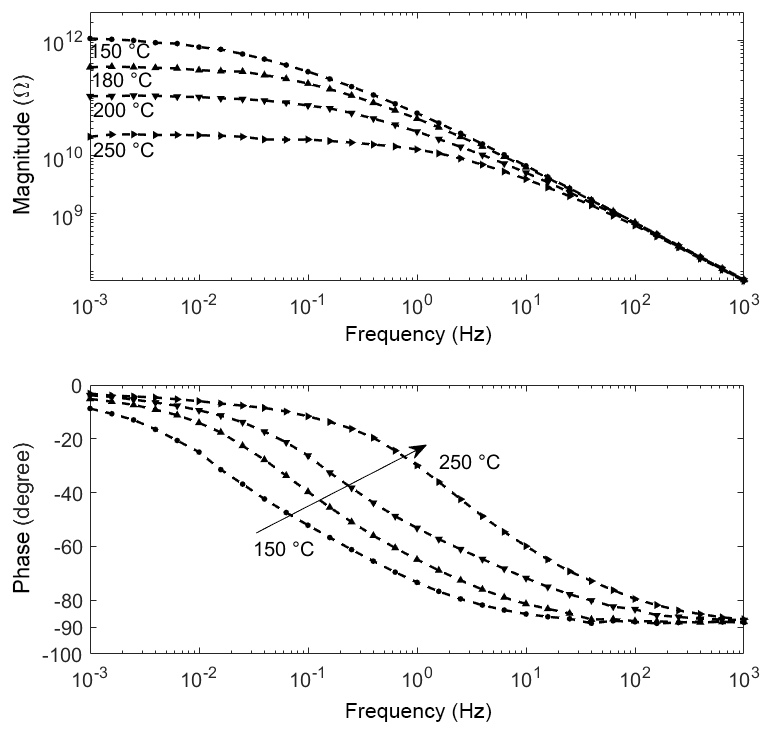
At elevated temperatures (150, 180, 200, 250 ∘C), a different shape for the impedance spectra is observed (Fig. 3). In general, the magnitude decreases, especially at low frequency, with increasing temperature. The near resistor-like behavior (phase at −3∘ except at 150 ∘C) in the low-frequency regime makes the sensor exhibit an behavior together with the geometrical capacitance. Consequently, the phase angle converges to 0∘ for low frequencies. For 180, 200 and 250 ∘C this effect can be observed unambiguously. We presume that for the 150 ∘C spectrum the phase angle would as well converge to 0∘, but at frequencies below 1 mHz.
3.2 Humidity measurements at room temperature
Impedance measurements are taken at room temperature with an increasing relative humidity from 10 %RH to 85 %RH in 5 %RH steps (Fig. 4) at a constant total gas flow of 100 mL min−1. Ten spectra from 100 mHz to 1 MHz were recorded for each humidity concentration. The noisy signal at 10 %RH and 15 %RH is due to the limit of the frequency response analyzer's measurement range. The phase angles below 10 %RH were neither continuous nor below 0∘ and the corresponding measurements are, therefore, not considered in the data evaluation. The magnitude over logarithmic frequency shows two to three domains with different slopes, shifting with humidity. At low humidity the low-frequency domain cannot be observed. This is probably because the respective element simply dominates outside the lower-frequency boundary. All three domains show neither ideal resistor-like nor ideal capacitor-like behavior, but can be described by a constant-phase element (CPE) (Barsoukov and Macdonald, 2005). The complex impedance of a CPE is shown in Eq. (1), where Q is the prefactor of the CPE, j is the complex unit, ω is the circular frequency, and α is the CPE's exponent.
The CPE becomes frequency-independent for an exponent α=0 so that Z behaves like a resistor with a resistance . For an exponent of α=1, Z equals a capacitor with the capacitance C=Q. Hence, the exponent must always be in the range between 0 and 1, and we can determine a resistor-like behavior (α < 0.5) or a capacitor-like behavior (α > 0.5). Consequently, a CPE with lower alpha will be considered to be more resistive-like.
In a Bode plot, where a CPE is the dominant element for the impedance in a certain frequency range, the exponent α resembles the negative slope in this frequency range. This relationship is depicted in Eq. (2), describing the magnitude of a single CPE in a Bode plot. With suitable substitutions, the equation's linear character becomes obvious.
In Fig. 4 a predominant capacitive-like behavior (slope approx. −0.6) is observed only at the lower end of the spectrum for 25 %RH and above. The slope becomes flatter (below −0.06), indicating a more resistive-like behavior, with increasing frequency. This changing point shifts to higher frequencies with increasing relative humidity, from 200 mHz at 25 %RH up to 100 Hz at 85 %RH. All graphs run in parallel in this resistive section. Note the significant drop in magnitude from 15 %RH to 20 %RH, which could indicate a percolation effect (Sauerwald and Russ, 2013). After the resistive plateau, the slope of the amplitude changes again to follow a strong capacitive behavior where, eventually, all spectra collapse to one curve with a slope of −1. At high humidity (70 %RH and above) the upper frequency boundary of 1 MHz is not sufficient anymore to observe this collapse.
The information in the phase plot is consistent with the magnitude plot. In the low-frequency domain, the lowest phase angle is −55∘ at approx. 1 Hz at 85 %RH. Below 55 %RH the phase angle has not reached the inflection point yet. An angle below −45∘ represents a predominantly capacitive behavior. Ignoring the outliers due to the noise in the first two humidity levels, we observe a maximum phase angle of −7∘ which corresponds to the slope of the resistive-like section in the magnitude plot. The gap between 15 %RH and 20 %RH represents the visible drop in magnitude. In the high-frequency domain, the phase angle changes to −90∘ and we can see that the upper limit of 1 MHz is not sufficient to see all humidity levels change to −90∘.
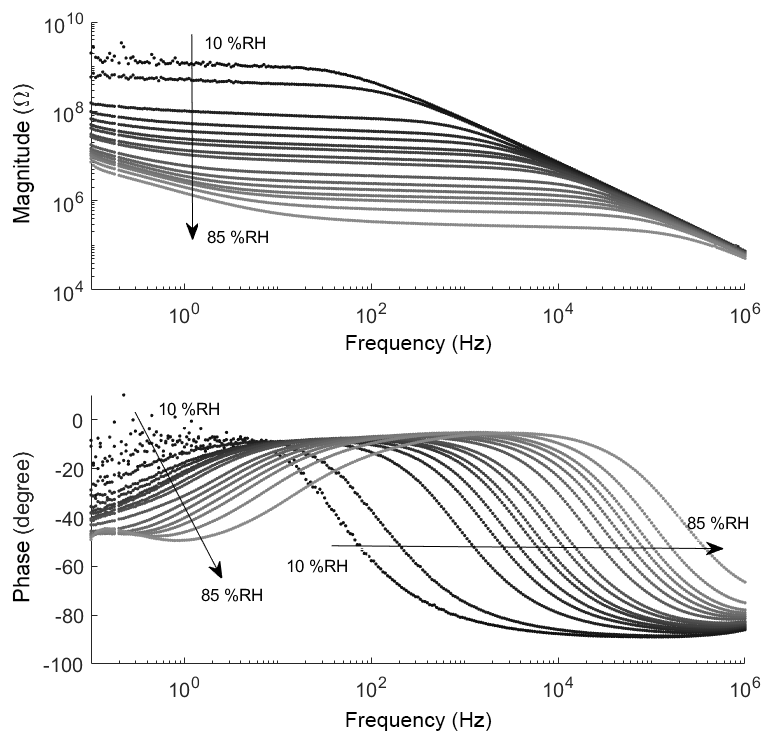
Figure 4Bode diagram of the sensor at different relative humidity levels at room temperature. The missing datapoint at 188.4 mHz in each spectrum is a systematic error and is therefore not plotted for better clarity.
3.3 Humidity measurements at elevated temperature
High-temperature measurements were carried out with the humidifier and sensor chamber heated to 80 ∘C to create high absolute humidity (up to 447 mbar). Simultaneously, the sensor itself was heated to 320 ∘C to create a high-temperature environment on the sensor surface (the change in relative humidity at an absolute humidity of 82 to 447 mbar ranges from 0.07 %RH to 0.38 %RH at a surface temperature of 320 ∘C). Preliminary measurements had shown a frequency range from 1 Hz to 1 MHz to be enough. The plots in this section were clipped to highlight the contribution of non-geometric effects below 100 kHz.
The amplitude plot exhibits two distinct slope domains at high temperature instead of the three at room temperature. The first slope (−0.07) indicates a resistive-like behavior, whereas the second slope is the geometrical capacitance as in the room-temperature measurements before. The phase plot shows an intersection at 3 Hz and a phase angle of −6.3∘. On the low-frequency end, the phase rises towards 0∘ in low humidity and decreases in high humidity (Fig. 5). On the high-frequency end, all measurements collapse, again, at the minimum phase angle of about −90∘.
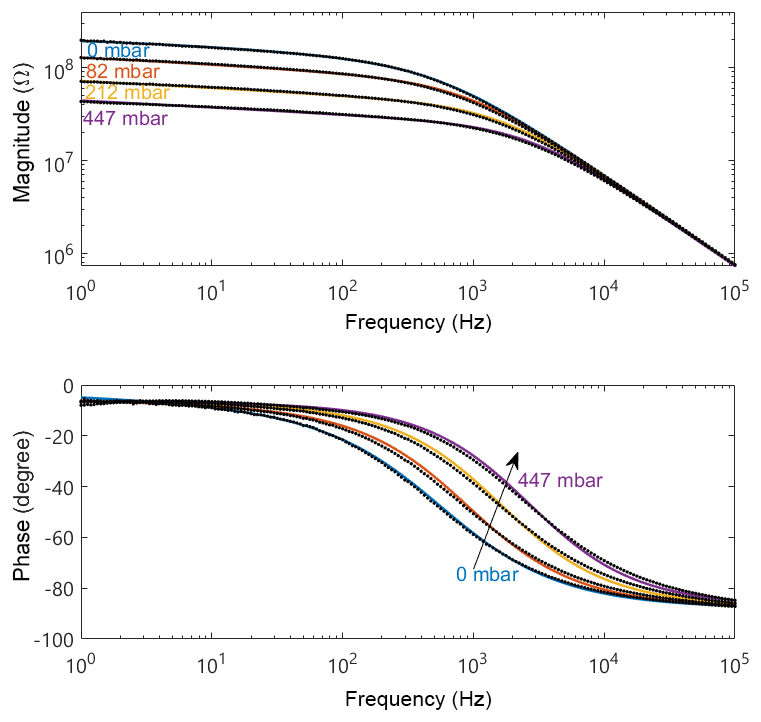
Figure 5Bode diagram of the sensor at different relative humidity levels at elevated temperature. The colored dots represent the experimental data to which the model was fitted (colored lines).
3.4 Impedance model for room temperature measurements
The general principle of ceramic humidity sensors is based on adsorption of water molecules on the material surface (Farahani et al., 2014). Depending on temperature and coverage, they change the sensor's impedance characteristics in certain frequency ranges distinctively (Faia et al., 2009). The most commonly used sensor effect is the humidity-dependent change in the permittivity of the sensor material, i.e., a porous ceramic like TiO2, between the sensor electrodes. At high temperature and, therefore, low relative humidity, the change in capacitance is negligible and the dominant humidity-dependent mechanism is the adsorption of ionic species at the sensor surface (Faia et al., 2009; Farahani et al., 2014). At low relative humidity, the surface oxygen vacancies of TiO2 promote the dissociation of water to hydroxyl groups which adsorb at the vacancies and provide protons as charge carriers (Xie et al., 2015). When this first, chemisorbed layer has completely covered the sensor surface, subsequent layers will physisorb on the chemisorbed layer and build clusters of hydroxyl groups which promote proton hopping between these clusters and a proton transfer between adjacent hydronium and water molecules within the clusters (Traversa, 1995). At a certain level of humidity this physiosorbed layer forms a closed path between the electrodes of the sensor, causing a sudden increase in conductance (Wang et al., 2011).
However, the blocking nature of the electrode towards ionic charge carriers will cause a specific conduction mechanism at the electrode–electrolyte interface. Charge carriers move to the charged electrode and create a double-layer capacitance (Traversa, 1995). The phase angle of this capacitance differs from the ideal capacitor due to the fractal level of the sensor material. This effect is usually modeled as a constant-phase element (Faia et al., 2005). Depending on the nature of the charge-transfer process, the electrodes are either fully blocking (no charge transfer) or porous (charge transfer), which is then modeled through an additional charge-transfer resistance (Rdl) in parallel to the capacitance (Cdl) (Barsoukov and Macdonald, 2005).
These different conduction models of water can be represented as elements in an electrical equivalent circuit as shown in Fig. 6. Since the electronic conductivity of TiO2 at room temperature is negligible (Fig. 2), we can assume that only ionic charge carriers are present at the electrode–electrolyte interface and, therefore, we use a blocking electrode (Rdl=∞) in the model. Because diffusion takes place on the sensor surface (and not in the bulk) it is a kind of nonlinear diffusion and should have a phase angle which differs from an ideal capacitor or a linear diffusion element (Bisquert and Compte, 2001). This can be modeled as a constant-phase element CPEdl. We propose that this double-layer capacitance is the predominant capacitance visible at the low-frequency domain of the Bode plot in Fig. 4.
The ionic conductance is dependent on the location of the oxygen vacancies of the sensor (Pan et al., 2013) and, therefore, on the morphology of the sensor material. For porous and especially for fractal geometries this can be modeled as one CPEion (Ruiz and Felice, 2015). The high-frequency domain of the spectrum in Fig. 4 shows the capacitance between the electrodes. This element is visible independent of the surface conductivity and is an almost ideal capacitor Cgeo in parallel with all other elements.
3.5 Impedance model for elevated temperature measurements
The easiest identified element is the already discussed geometrical capacitance Cgeo. In humid air, hydroxyl groups can still be found on the sensor surface at the sensor temperatures (320 ∘C) applied in this work (Trimboli et al., 2006; Wu et al., 2017). This means that the humidity-dependent conduction mechanism is still an ionic pathway between the electrodes on the sensor surface, as already discussed for room temperature. Therefore, we can use the previously discussed elements to model the double-layer capacitance and ionic conductivity. At elevated temperature the sensor material's electronic conductance cannot be neglected and must be considered to be an additional influence on the sensor impedance (Wahlström et al., 2004). TiO2 is an n-type semiconductor with deep donors 3 eV below the conduction band (Pan et al., 2013). Therefore, most donors are not ionized at 320 ∘C, leading to a temperature dependence of the electronic conductance. This can be described by an ohmic resistor, which can be seen in the phase plots of Figs. 3 and 4, since the maximum phase angle of the sensor in dry air collapses at about −0.1∘, whereas all humid measurements show a common maximum phase at around −6.25∘. This angle represents a strongly resistive CPE, the ionic pathway, which does not exist at 0 mbar humidity.
4.1 Equivalent circuit
The resulting equivalent circuit is a superposition of the conductivity mechanisms described above forming three parallel pathways.
The first path (i) describes the ionic conductance through the double-layer capacitance (CPEdl) in series with the ionic conductance (CPEionic).
The second path (ii) is the geometric capacitance. At higher frequencies the geometric capacitance which is independent of the surface conductance becomes the dominant element and must, therefore, be in an additional, parallel branch (ii) of the equivalent circuit. When modeled as a CPE, the fitted exponent lies above 0.93 in all measurements, which makes the CPE resemble a near-ideal capacitance.
A third path (iii) represents electronic conductance which is only visible at elevated temperatures as seen by the pure capacitive behavior in Fig. 2 and the beginning of the resistor-like behavior in Fig. 3. Therefore, it cannot be modeled for the room temperature measurements.
The resulting equivalent circuit is depicted in Fig. 6. Because of the low relative humidity at elevated temperature (0.07 %RH and 0.38 %RH at 320 ∘C dew point) in contrast to the high relative humidity at room temperature (10 %RH to 85 %RH), the double-layer capacitance in path (ii) cannot be visible in the observed frequency range in Fig. 4. To make it visible the lowest measured frequency would have to be far below 1 mHz, which would result in an unreasonably long measurement time, or the dew point of 80 ∘C must be increased to achieve higher relative humidity at the sensor surface. Thus, CPEdl is modeled as short in the elevated temperature model.
The electronic path (iii) is regarded as open in the low temperature model and consequently Relectronic has been omitted for all fits of low-temperature measurements, since the sensor is purely capacitive at 0 %RH at room temperature (Fig. 2). Even for high temperatures, the electronic path (iii) only dominates the conductance at very low humidity and in the range of low frequencies. As the CPEionic is very resistor-like, the discrimination between path (ii) and (iii) from the spectra would require measurements at very low frequencies. To avoid cross-related wrongful determinations of Relectronic and CPEionic, we set Relectronic to a constant value of 2.4 GΩ in the fit algorithm for measurements at 320 ∘C, making use of the fact that Relectronic is not humidity-dependent. The value of 2.4 GΩ is taken from a measurement at 0 %RH in which no ionic conductance is prevalent.
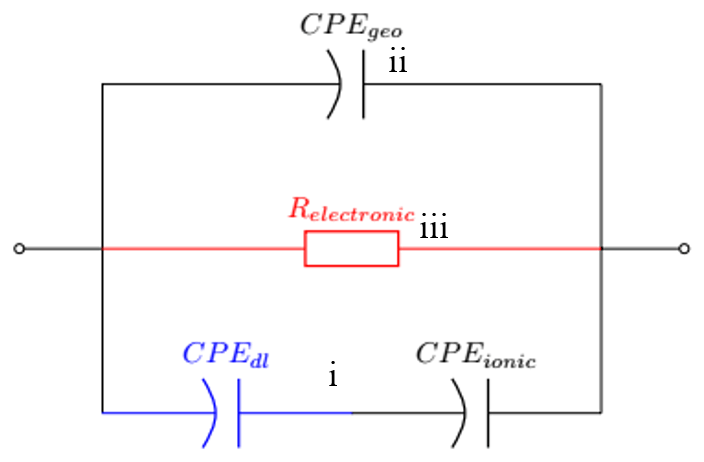
Figure 6Proposed equivalent electrical circuit for humidity sensing in a broad temperature range. CPEdl is highlighted in blue because it can only be fitted at room temperature. At high temperature this element is shorted. Relectronic is highlighted in red because its only visible in the elevated temperature model.
4.2 Results of fits
All measurements have been fitted with the EES as described above with the following results for the parameters.
4.2.1 Ionic path
As already mentioned in Sect. 3.4 the diffusion process of ions at this interface is bound to the geometry of the sensor material and is, therefore, nonlinear. The CPEdl can only be observed at low temperatures in the humidity range at and above 20 %RH. The exponent is in the range of 0.6, indicating a nonlinear diffusion element (Bisquert and Compte, 2001). Below 20 %RH, CPEdl is not visible in the Bode diagram (in the observed frequency range) and, therefore, cannot be fitted properly. Consequently, this effect is never visible at high temperatures and, thus, the element is shorted in the model, leaving CPEionic to be the only element in the pathway. The exponent of CPEionic is in the range of 0.1, indicating a resistor-like but not ideal conductance. At both investigated temperatures, i.e., room temperature and 320 ∘C, CPEionic becomes more resistive-like with increasing humidity. This could be due to the hydroxyl clusters on the surface growing in size, decreasing the distance between them. This, in turn, leads to more conductive and less capacitive behavior. With the start of multilayer adsorption, the increase in conduction is even larger, providing more ionic pathways for the ionic charge carriers. The exponent αionic is much higher at elevated temperature than at room temperature. It drops from 0.26 to a close to ideal resistive behavior of 0.09. Since the relative humidity on the sensor surface is extremely low due to its high temperature, a closed chemisorbed layer cannot be built, which hinders the hopping of protons between the hydroxyl clusters. This leads to an increased capacitive-like behavior (α=0.27 at 0 mbar and α=0.15 at 82 mbar) which changes to a near resistive-like behavior with increasing humidity as the distance between the clusters becomes smaller (α gets below 0.1 with increasing humidity).
4.2.2 Geometrical (capacitive) path
For the room temperature measurement, the exponent αgeo is always close to 1 and slightly decreasing with increasing humidity (Fig. 7). Since the phase angle of −90∘ in Fig. 4 moves out of the observed frequency range with increasing humidity, the exponent will also move away from an ideal capacitor. At high temperature the exponent (Fig. 8) shows a near-ideal capacitive behavior over the entire measurement range. Based on these measurements, we strongly presume that CPEgeo is an ideal capacitor and that the decrease at high relative humidity is simply due to the fact that a small part of the ionic conductance is wrongly attributed to CPEgeo.
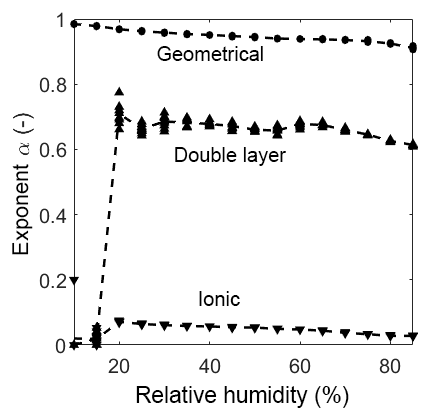
Figure 7Exponents of every CPE over relative humidity at room temperature. The dots represent the value of the fit of each measurement. The dashed lines represent the mean of the dots.
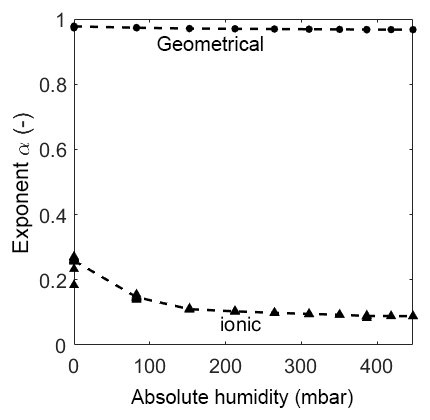
Figure 8Exponents of every CPE over absolute humidity at 320 ∘C. The dots represent the value of the fit of each measurement. The dashed lines represent the mean of the dots.
As described in the model in Sect. 3.4 the geometric capacitance increases almost linearly with relative humidity in the range from 10 %RH to 60 %RH (Fig. 9). At about 75 %RH the capacitance starts to increase more than linearly. This increase depends on the same effect as the slow decrease in the exponent αgeo. Hence, CPEgeo cannot be fitted properly in this regime, which is obvious from the increasing variation of the fit above 75 %RH. These results strongly suggest that at humidity levels below 60 %RH the adsorption can be seen as a multi-layer physisorption as described in Faia et al. (2005) linear to the partial pressure (according to Henry's law), while for humidity higher than 75 %RH a multilayer adsorption with additional pore condensation is dominant.
At elevated temperature the capacitance also increases, but as expected, the change is rather small and not linear. Please note that the change in relative humidity on the sensor surface is too small (between 0 %RH and 0.4 %RH) to cause a strong adsorption of humidity with a following strong effect on the capacitance.

Figure 9Prefactor of CPEgeo over relative humidity at room temperature. The dots represent the value of the fit of each measurement. The dashed line represents the mean of the dots.
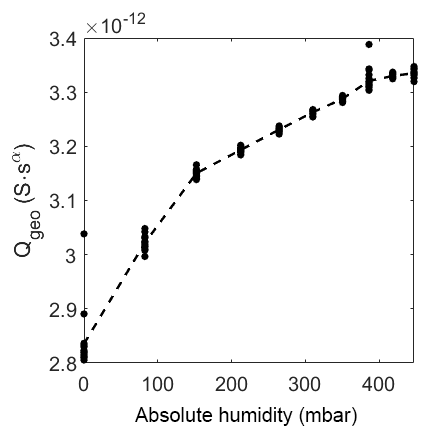
Figure 10Prefactor of CPEgeo over absolute humidity at 320 ∘C. The dots represent the value of the fit of each measurement. The dashed line represents the mean of the dots.
Figure 11 shows the behavior of the ionic conductivity at different humidity levels. At low humidity levels, the signal is very noisy, and the fit will, therefore, exhibit large errors. However, a strong tendency to a low ionic conductance can still be found. After the drop in magnitude between 15 %RH and 20 %RH, the impedance becomes measurable with a near resistive-like, linearly increasing behavior. With high relative humidity (above 55 %RH) the slope gets more than linear, indicating a sudden increase in possible ionic pathways, like multilayer adsorption.
The prefactor of CPEion (Fig. 12) increases linearly with increasing humidity, as opposed to the room temperature measurement where it increases more than linearly at high relative humidity (above 20 %RH). This high relative humidity is not present at high temperatures.
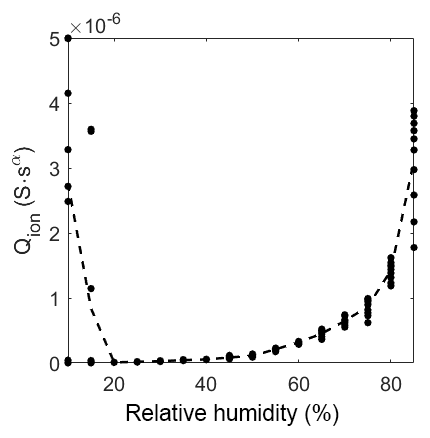
Figure 11Prefactor of CPEion over relative humidity at room temperature. The dots represent the value of the fit of each measurement. The dashed line represents the mean of the dots.
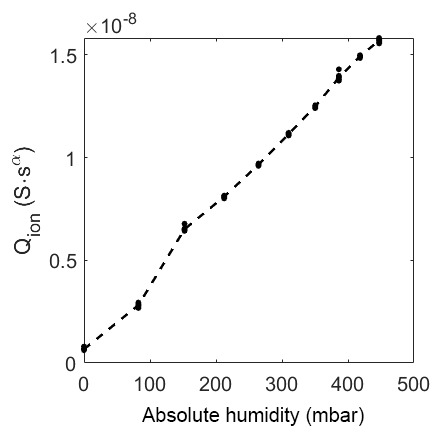
Figure 12Prefactor of CPEion over absolute humidity at 320 ∘C. The dots represent the value of the fit of each measurement. The dashed line represents the mean of the dots.
As seen in Fig. 4 the slope of the double-layer capacitance does not appear at low humidity levels within the investigated frequency range. At 20 %RH it becomes measurable and increases linearly with increasing humidity (Fig. 13). This is consistent with the presence of more ionic charge carriers on the sensor surface increasing the capacitance at the electrode–electrolyte interface. At elevated temperatures this feature is not present at all and, therefore, CPEdl is shorted in the equivalent circuit.

Figure 13Prefactor of CPEdl over relative humidity at room temperature. The dots represent the value of the fit of each measurement. The dashed line represents the mean of the dots.
We were able to demonstrate that the impedance of a TiO2-based sensor can conclusively be described by a universal model at different humidity levels at room temperature and an elevated temperature of 320 ∘C. Even though a very limited number of electrical equivalent elements have been used, the accuracy of the fit is very high. Based on known physical models for electric and ionic conductance mechanisms of TiO2, an electrical equivalent circuit with four free parameters at elevated temperature and six free parameters at room temperature was modeled. The measurements taken at room temperature and elevated temperature were fitted to this equivalent circuit. The results show that multiple humidity-dependent conductance mechanisms are suitable for detecting humidity at room temperature as well as a temperature of 320 ∘C; i.e., the sensor is reliable in a broad temperature range. In the future, the significantly shorter measurement times achieved with a Fourier-based impedance spectroscope will make the sensor system fit for continuous humidity monitoring in environments with highly variable temperature. Shorter measurement times would also allow us to determine the response and recovery times of the sensor. So far this is not possible due to the long time the impedance analyzer needs (several minutes) to measure one spectrum. Another point that will be discussed in the future is the selectivity of the sensor on humidity and the effect of interferences (i.e., reducing gas) on the sensor and the elements of the equivalent circuit, respectively.
Research data are available upon request to the authors.
The supplement related to this article is available online at: https://doi.org/10.5194/jsss-8-161-2019-supplement.
HL and TS designed the experiments and developed the model for humidity sensing. HL performed and evaluated most of the measurements and wrote the fitting software. TB and MB supported the experimental setup and performed some of the data evaluation. HL, AS and TS discussed the results of the experiments. HL wrote the manuscript with contributions from all authors. All authors contributed to the discussions.
The authors declare that they have no conflict of interest.
This article is part of the special issue “Sensors and Measurement Systems 2018”. It is a result of the “Sensoren und Messsysteme 2018, 19. ITG-/GMA-Fachtagung”, Nürnberg, Germany, from 26 June 2018 to 27 June 2018.
This research has been funded by the federal ministry of education and research of Germany (BMBF) in the framework of HT-HUMISENS (project number: 16ES0485).
We thank the project partners for their vivid discussion and support and for the supplied sensor samples.
This paper was edited by Gerhard Fischerauer and reviewed by two anonymous referees.
Barsoukov, E. and Macdonald, J. R.: Impedance Spectroscopy: Theory, Experiment, and Applications, 2nd Edn., Wiley-VCH-Verlag, 2005.
Bisquert, J. and Compte, A.: Theory of the electrochemical impedance of anomalous diffusion, J. Electroanal. Chem., 499, 112–120, https://doi.org/10.1016/S0022-0728(00)00497-6, 2001.
Blank, T. A., Eksperiandova, L. P., and Belikov, K. N.: Recent trends of ceramic humidity sensors development: A review, Sensor. Actuat. B-Chem., 228, 416–442, https://doi.org/10.1016/j.snb.2016.01.015, 2016.
Cooper, K. R., Smith, M., and Johnson, D.: Development and demonstration of measurement-time efficient methods for impedance spectroscopy of electrode and sensor arrays, Sensors, 8, 1774–1796, https://doi.org/10.3390/s8031774, 2008.
Doerr, J., Nienhaus, C., Selke, M., Kunze, M., and Dreyer, M.: Ein modulares System zur fourier-basierten Impedanzspektroskopie an Sensoren, Sensoren und Messsyst, Beiträge der 19. ITG/GMA-Fachtagung 26–27 Juni 2018 Nürnberg, 176–180, 2018.
Faia, P. M., Furtado, C. S., and Ferreira, A. J.: AC impedance spectroscopy: A new equivalent circuit for titania thick film humidity sensors, Sensor. Actuat. B-Chem., Vol. 107, Elsevier, 353–359, 2005.
Faia, P. M., Ferreira, A. J., and Furtado, C. S.: Establishing and interpreting an electrical circuit representing a TiO2-WO3 series of humidity thick film sensors, Sensor. Actuat. B-Chem., 140, 128–133, https://doi.org/10.1016/j.snb.2009.04.016, 2009.
Farahani, H., Wagiran, R., and Hamidon, M. N.: Humidity sensors principle, mechanism, and fabrication technologies: A comprehensive review, Sensors (Switzerland), 14, 7881–7939, https://doi.org/10.3390/s140507881, 2014.
Lee, C.-Y. and Lee, G.-B.: Humidity Sensors: A Review, Sens. Lett., 3, 1–15, https://doi.org/10.1166/sl.2005.001, 2005.
Pan, X., Yang, M.-Q., Fu, X., Zhang, N., and Xu, Y.-J.: Defective TiO2 with oxygen vacancies: synthesis, properties and photocatalytic applications, Nanoscale, 5, 3601, https://doi.org/10.1039/c3nr00476g, 2013.
Ruiz, G. A. and Felice, C. J.: Electrochemical-fractal model versus randles model: A discussion about diffusion process, Int. J. Electrochem. Sci., 10, 8484–8496, 2015.
Sauerwald, T. and Russ, S.: Percolation Effects in Metal Oxide Gas Sensors and Related Systems, Gas Sensing Fundamentals, 247–278, https://doi.org/10.1007/5346_2013_53, 2013.
Schüler, M., Sauerwald, T., Walter, J., and Schütze, A.: High speed impedance spectroscope for metal oxide gas sensors, in: Lecture Notes on Impedance Spectroscopy, CRC Press, 111–122, 2015.
Traversa, E.: Ceramic sensors for humidity detection: the state-of-the-art and future developments, Sensor. Actuat. B-Chem., 23, 135–156, https://doi.org/10.1016/0925-4005(94)01268-M, 1995.
Trimboli, J., Mottern, M., Verweij, H., and Dutta, P. K.: Interaction of water with titania: Implications for high-temperature gas sensing, J. Phys. Chem. B, 110, 5647–5654, https://doi.org/10.1021/jp0551519, 2006.
Wagner, T., Krotzky, S., Weiß, A., Sauerwald, T., Kohl, C. D., Roggenbuck, J., and Tiemann, M.: A high temperature capacitive humidity sensor based on mesoporous silica, Sensors, 11, 3135–3144, https://doi.org/10.3390/s110303135, 2011.
Wahlström, E., Vestergaard, E. K., Schaub, R., Rønnau, A., Vestergaard, M., Lægsgaard, E., Stensgaard, I., and Besenbacher, F.: Electron Transfer-Induced Dynamics of Oxygen Molecules on the TiO2(110) Surface, Science, 303, 511–513, https://doi.org/10.1126/science.1093425, 2004.
Wang, Z., Shi, L., Wu, F., Yuan, S., Zhao, Y., and Zhang, M.: The sol-gel template synthesis of porous TiO2 for a high performance humidity sensor, Nanotechnology, 22, 275502, https://doi.org/10.1088/0957-4484/22/27/275502, 2011.
Wu, C.-Y., Tu, K.-J., Deng, J.-P., Lo, Y.-S., and Wu, C.-H.: Markedly Enhanced Surface Hydroxyl Groups of TiO2 Nanoparticles with Superior Water-Dispersibility for Photocatalysis, Materials, 10, 566, https://doi.org/10.3390/ma10050566, 2017.
Xie, T., Sullivan, N., Steffens, K., Wen, B., Liu, G., Debnath, R., Davydov, A., Gomez, R., and Motayed, A.: UV-assisted room-temperature chemiresistive NO2 sensor based on TiO2 thin film, J. Alloys Compd., 653, 255–259, https://doi.org/10.1016/j.jallcom.2015.09.021, 2015.