the Creative Commons Attribution 4.0 License.
the Creative Commons Attribution 4.0 License.
Measurement of the absolute spectral responsivity in the mid-infrared based on the cryogenic electrical substitution radiometer and an optimized thermopile detector
Tobias Pohl
Peter Meindl
Uwe Johannsen
Dieter Taubert
Lutz Werner
The Physikalisch-Technische Bundesanstalt (PTB) expanded its capabilities of the absolute measurement of radiant power to the spectral range of the mid-infrared (MIR) by implementing additional MIR laser radiation sources at one of the PTB's cryogenic electrical substitution radiometer facilities. This extension enables absolute calibrations of the spectral responsivity of detectors in the MIR traceable to the International System of Units (SI).
The thermopile detector TS-76 was characterized and calibrated in view of its spectral responsivity s(λ) in the wavelength range between 1.5 and 10.6 µm at the expanded cryogenic electrical substitution radiometer facility. The relative standard measurement uncertainty was significantly reduced to 1.4 % by developing an optimized and thermally stabilized detector housing design. The TS-76 was established as a mid-infrared transfer detector for the SI traceable measurement of radiant power and the dissemination of the spectral responsivity s(λ) in the MIR.
- Article
(1814 KB) - Full-text XML
- BibTeX
- EndNote
Radiation detectors for the near-infrared (NIR) and mid-infrared spectral range are widely needed for different applications, e.g. remote sensing (Allison et al., 2016) or measurement of climate-relevant atmospheric molecules (Rothman et al., 2013). Some of these applications, e.g. the radiometric measurement of thermodynamic temperatures (Gutschwager et al., 2013), require high-accuracy traceability of the radiometric measurements to the International System of Units (SI), which is realized by national metrology institutes like the Physikalisch-Technische Bundesanstalt (PTB) by operating primary radiometric detector standards such as electrical substitution radiometers. Furthermore, the PTB uses different types of transfer detectors which have been calibrated in view of their spectral responsivity s(λ) against these national radiometric standards for the dissemination of the radiometric quantities. The spectral responsivity s(λ) is defined by the ratio between the output signal of the detector – usually voltage or current – and the received radiant power Φ. The transfer standards are typically calibrated at selected wavelengths, and an interpolation of the spectral responsivity is performed between these supporting points.
Existing calibration facilities at the PTB with cryogenic electrical substitution radiometers as primary standards offer absolute calibration capabilities in the spectral range from X-ray, extreme UV (EUV), ultraviolet (UV), visible (VIS) to NIR (Gottwald et al., 2006; Meindl et al., 2006; Noulkow et al., 2009; Werner et al., 2000, 2009, 2014). Transfer standards are mainly based on quantum detectors in these spectral ranges due to their high spectral responsivity. Measurements of the spectral responsivity of detectors with a relative uncertainty down to and even below 10−4 are realized at the PTB (Müller, 2013). Figure 1 shows the spectral responsivity of typical photon detectors which are calibrated at the PTB. The corresponding measurement uncertainty realized at the PTB is given in Table 1.
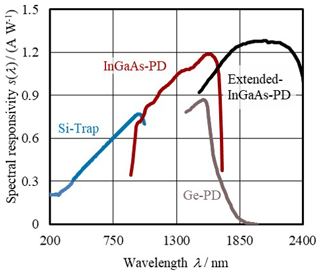
Figure 1Spectral responsivity of transfer detectors in the UV, VIS and NIR (PD: photodiode; trap: detector made of three photodiodes in a “trap design”).
Table 1Transfer detectors in the UV, VIS and NIR and typical relative standard uncertainties of the spectral responsivity realized at the PTB (Hartmann et al., 2010; Meindl et al., 2006; Noulkow et al., 2009; Werner et al., 2000, 2014).

The wavelength range of the mid-infrared (i.e. 3 to 50 µm) is currently of increasing interest and market importance for research and industrial applications; therefore, the dissemination of radiometric units, e.g. of the spectral responsivity s(λ) of radiation detectors with high accuracy is of rising need as well in this spectral range. But in contrast to the UV, VIS and NIR, the determination of the absolute spectral responsivity s(λ) of semiconductor detectors in the mid-infrared (MIR) is more difficult. The spectral responsivity – which has a distinct dependence on the wavelength (Fig. 1) – has to be calibrated absolutely at discrete wavelengths and to be interpolated over the applicable wavelength range with an appropriate physical or mathematical model. This is possible with low uncertainties only if the separation between the discrete wavelengths is small enough. Hence, an interpolation of the spectral responsivity of semiconductor detectors in the MIR would require a large number of absolute calibrations against the cryogenic electrical substitution radiometer. Therefore, the PTB's approach for the dissemination of the spectral responsivity in the MIR is based on thermal detectors. It is expected that an interpolation of the spectral responsivity based on fewer supporting points is possible with a sufficiently low uncertainty due to the spectral flatness of their responsivity in a wide wavelength range. Consequently, one electrical substitution radiometer facility of the PTB has been expanded for absolute calibrations in the MIR wavelength range by suitable laser radiation sources that provide sufficient radiant power. Furthermore, a disadvantage of semiconductor detectors in the MIR is typically their small sensitive area. Thus, they are usually used for irradiance instead of radiant power measurements where the sensitive area of the detector has to cover the whole extent of the beam profile. In contrast, thermal detectors with larger sensitive areas offer the possibility of radiant power measurements.
In the following sections the cryogenic electrical substitution radiometer facility, its expansion for the MIR and the optimization, and calibration of the thermopile detector TS-76 to be used as a transfer detector will be described.
The PTB uses cryogenic electrical substitution radiometers for absolute calibrations of the spectral responsivity s(λ) of radiation detectors. These substitution radiometers are primary detector standards for the measurement of radiant power (Martin et al., 1985) because the measurement of radiant power realized is traceable to the International System of Units by substitution of the absorbed radiant power with electric heating power. Electric power can be measured with low uncertainty traceable to the PTB realizations of the electrical quantities voltage and resistance.
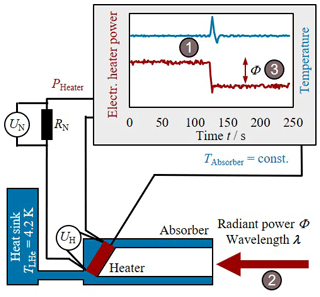
The cryogenic electrical substitution radiometer (Fig. 2) consists of an absorber cavity that is thermally linked to a heat sink at the temperature of liquid helium. In addition, the absorber is slightly electrically heated to a certain temperature. This electric heating power is controlled to hold the absorber at a constant temperature (1 in Fig. 2). If radiant power Φ is additionally heating the absorber (2 in Fig. 2), the electric heating power of the absorber has to be reduced to remain at this temperature (3 in Fig. 2). The radiant power Φ is then – considering that all radiant power is absorbed in the absorber – equivalent to the change in the electric heating power. The heating power can be calculated from the heater voltage UH and the heating current. The heating current is measured by the voltage drop UN across a normal resistor with resistance RN:
By running the electrical substitution radiometer in a vacuum and at the cryogenic temperature of liquid helium (TLHe = 4.2 K), the sensitivity of the radiometer is considerably increased and the uncertainty is reduced.
The PTB uses different types of radiation sources such as laser sources, synchrotron radiation sources, or thermal radiation sources (e.g. tungsten halogen lamps) at their measurement facilities to cover different spectral ranges for absolute calibrations of the spectral responsivity of radiation detectors against the cryogenic electrical substitution radiometers. One of these measurement facilities (Meindl et al., 2006) has recently been expanded for the MIR by implementing additional MIR lasers:
-
a quantum cascade laser (QCL) for 3.96 and 9.45 µm and
-
a CO2 laser for 10.6 µm.
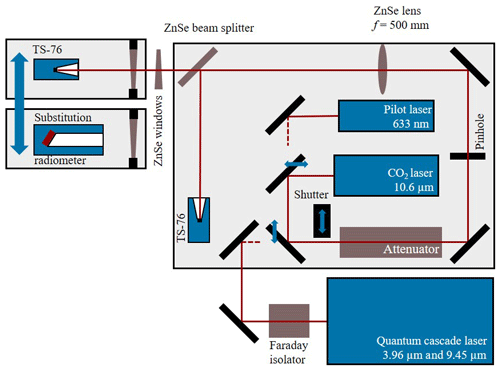
The optical path including the necessary implementations of MIR-suitable mirrors and radiation preparation devices is depicted in Fig. 3. Via moveable mirrors, either the QCL or the CO2 laser can be inserted into the optical path. Furthermore, a HeNe pilot laser (633 nm) can be used for setting up the optical path and for controlling the adjustments of the mirrors and other optical elements. This is helpful because of the invisibility of the IR radiation.
The QCL requires a Faraday isolator to prevent back reflections into the laser, which would cause damage to the laser system. The radiant power can be reduced significantly by using a variable attenuator with up to 36 dB attenuation to avoid damage to the detectors and to conduct measurements at different power levels, e.g. for the verification of the linearity of tested detectors. A radiant power incident on the detector between less than 1 µW and more than 1 mW is available using this setup. A shutter for the automated measurement of the dark signal is placed in front of the attenuator. A ZnSe lens (f=500 mm) images a pinhole of 2.4 mm diameter onto the sensitive area of the detectors. About half of the radiation is deflected onto another detector in the same distance via a beam splitter for monitoring the laser power.
The absorber of the cryogenic electrical substitution radiometer is run under a vacuum and therefore equipped with a ZnSe window which is wedge-shaped with an angle of 3∘ to avoid inter-reflections of monochromatic radiation. The thermopile detector TS-76 itself is windowless and operated in air behind a similarly wedged ZnSe window, which is mounted in front of the detector to obtain the same optical path. The difference of the transmittances of these two windows has to be measured and corrected. Due to the wedge shape, another identically constructed window with the opposite orientation is needed to compensate for the refraction.
A calibration of a thermopile detector called TS-76 in view of its spectral responsivity has been realized at selected wavelengths by using the MIR expanded cryogenic electrical substitution radiometer facility at the PTB. This determination of the spectral responsivity is the basis for establishing the TS-76 as an MIR transfer detector.
3.1 Characteristics of the TS-76
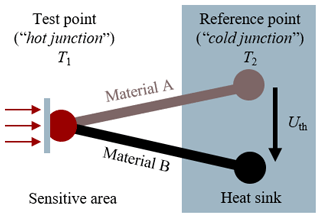
The thermopile detector TS-76 has been chosen as a possible MIR transfer detector. This type of thermal detector is manufactured by the Leibniz-Institut für Photonische Technologien e.V. (IPHT) Jena for radiometric purposes (Holstenberg et al., 1995). Thermopile detectors are thermal detectors based on several thermocouples in series connection. A thermocouple (Fig. 4) consists of a conductor of material A connected to a conductor of material B. A temperature difference ΔT between the test point and reference point causes a thermoelectric voltage Uth due to the Seebeck effect. The amount of this voltage depends on the material pairing A-B, which is described by the Seebeck coefficient αA-B:
The temperature of the reference point is supposed to be stable and therefore connected to a heat sink. The temperature increase at the test point is caused by the received and absorbed thermal radiation at the sensitive area.
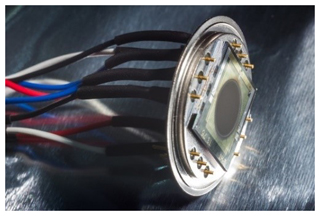
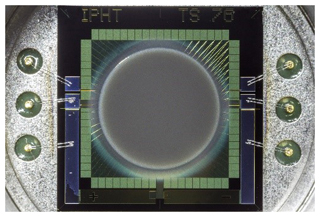
The multi-junction thermopile detector TS-76 (Fig. 5) is based on 76 BiSb-Sb thermocouples arranged circularly around the sensitive area of 7 mm in diameter (Fig. 6). The sensitive area of the detector consists of a membrane with a thickness of 800 nm and is coated with the absorber material metallic silver–black. The reference points of the thermocouples are connected to the silicon frame which serves as a heat sink. The Seebeck coefficient αBiSb-Sb of this material pairing is about 135 µV K−1 (Völklein and Kessler, 1987, 1990; Budzier and Gerlach, 2010).
The spectral responsivity s(λ) is in the range between 1 and 14 V W−1. The specific value depends – among other influencing factors – on whether the detector is windowless or equipped with a window and gas filling. Although the window – e.g. a calcium fluoride window – offers a higher responsivity and lower noise level due to reduced convection, windowless detectors have been chosen for the purpose of an MIR transfer detector. This decision is based on three reasons:
-
to not limit the spectral range of the detector by the absorptance of the window,
-
to avoid a spectral dependency of the responsivity due to the spectral transmittance of the window, and
-
to avoid interferences of laser radiation at the window.
The response time of the TS-76 is about 0.5 s. The TS-76 is equipped with an integrated thermistor for temperature monitoring of its heat sink. An additional thermal equalizing silver layer with a thickness of 2.8 µm is located beneath the absorbing layer to improve the homogeneity: Holstenberg et al. (1995) found out that the spatial distribution of the spectral responsivity is homogeneous within 5 % over the whole sensitive area and homogeneous within 3 % in its centre with a diameter of 5 mm, which is used in the calibration process described in this paper.
Deviations from a linear response are below 0.5 % for input powers <1 mW (Müller et al., 1999). The radiant power used for the calibrations amounts to between 10 and 100 µW, hence far below the critical value. The noise equivalent power (NEP) of the TS-76 was determined by Müller et al. (1999) at <5 nW.
3.2 Spectral responsivity of the TS-76
The measurement of the spectral responsivity s(λ) of the TS-76 has been performed at the MIR expanded cryogenic electrical substitution radiometer facility by using the mentioned MIR lasers at 3.96, 9.45 and 10.6 µm, and furthermore with monochromatized radiation of a supercontinuum laser in the wavelength range between 1.5 and 2.4 µm. The latter measurements have been summarized to a mean value assigned to a mean wavelength of 1.925 µm. The measured spectral responsivity slightly increases with wavelength (Table 2). The observed change in responsivity stays within the expanded measurement uncertainty, however.
The measurements of the spectral responsivity at the QCL wavelengths 3.96 and 9.45 µm have been performed in an earlier state with a less optimal housing of the TS-76 and therefore a worse stability of the detector signal. The measurement uncertainty of these measurements is larger for this reason. Hence, these calibrations have only been used for a proof of plausibility but not as supporting points for an interpolation.
Former measurements of the relative spectral responsivity (Taubert et al., 2017) and of the reflectivity of the absorber material metallic silver–black suggest that the spectral changes in the responsivity of this detector, if any, will be minimal. Having this in mind, the dependence of the spectral responsivity on the wavelength can most likely be expressed with a linear interpolation:
When neglecting the results at QCL wavelengths 3.96 and 9.45 µm due to the larger measurement uncertainty, and only using the results at 1.925 and 10.6 µm, the coefficients of this interpolation can be calculated as
Following the rules of the “Guide to the Expression of Uncertainty of Measurement (GUM)” (BIPM, 1995), the combined measurement uncertainty uc for multiple input parameters has to be calculated as
The combined measurement uncertainty is between 0.3 % and 2.5 % in the wavelength range between 1.5 and 10.6 µm. It has to be mentioned that the measurements of the spectral responsivity at the QCL wavelengths 3.96 and 9.45 µm are completely consistent with this interpolation; see the red markers in Fig. 7.
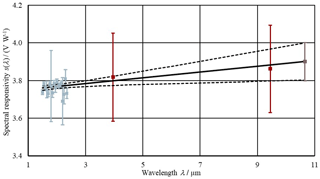
Figure 7Spectral responsivity of the TS-76 in the MIR: absolute calibrations with a supercontinuum laser in the range 1.5 to 2.4 µm and a CO2 laser at 10.6 µm have been used as supporting points for a linear interpolation. The interpolation is consistent with further absolute calibrations with a QCL at 3.96 and 9.45 µm.
The experiences of the measurements with the TS-76 have given clear evidence of the necessity of stabilizing the TS-76 in view of fluctuating thermal influences of the surroundings. Therefore, an optimized detector design for the TS-76 has been developed and realized for the establishment of the thermopile detector as an MIR transfer detector for the dissemination of the spectral responsivity to offer flexible measurements in view of place and ambient conditions.
4.1 Realization of the optimized detector housing
A signal of the thermopile detector is caused by a temperature difference ΔT between the sensitive area and the heat sink of the TS-76 (Eq. 2). Such a temperature difference ΔT is supposed to be only generated by received and absorbed measurement radiation and not by other disturbing influencing factors. Hence, the goal of the optimized detector housing is to minimize thermal disturbances of the heat sink and the sensitive area of the TS-76. This thermal stabilization is achieved by
-
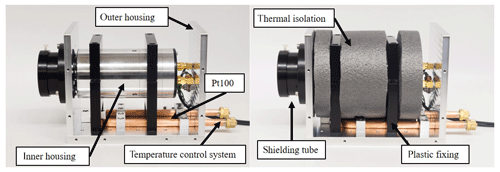
a separation of the housing into an inner detector housing – holding the TS-76 thermopile itself – and an outer housing for thermal and radiation shielding (Fig. 8),
-
thermal decoupling and isolation of inner and outer detector housing to avoid any thermal instabilities and unwanted heat flow through the inner housing,
-
an additional water-cooled temperature control system of the outer housing, including a Pt100 sensor for temperature monitoring,
-
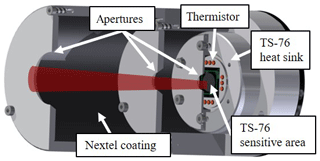
a limitation of the field of view via a baffle of three apertures in front of the TS-76 detector (Fig. 9) with an angle of acceptance of 7∘,
-
reduction of air convection near the sensitive area due to this baffle, and
-
coating the inner surfaces with IR absorber material Nextel (Adibekyan et al., 2017) to reduce stray radiation.
The sensitive area is not protected by a window (see Fig. 5) and is therefore in direct contact with the surrounding air. The effect of thermal fluctuations of the air near the sensitive area can be calculated from the Seebeck coefficient αBiSb-Sb of BiSb-Sb thermocouples of about 135 µV K−1, the number of thermocouples being 76, and the spectral responsivity of the TS-76 of roughly 4 V W−1: short-term temperature fluctuations of the air of 100 mK correspond to an incident optical radiation of 250 µW. Therefore, the dark signal of a windowless and uncased TS-76 could easily fluctuate by an amount of the same dimensions as the signal caused by the radiation which is to be measured. The concrete value of these fluctuations depends on how directly the air – e.g. coming out of the air conditioning outlets – reaches the sensitive area.
4.2 Dark signal comparison and lower detection limit
Measurements of the detector dark signal have been performed to validate the optimized detector design. Figure 10 shows the dark signal of the TS-76 at different iterations of the development of the detector housing: as might be expected, the TS-76 without housing did not offer measurement possibilities due to overly high signal noise (see the left panel in Fig. 10). In contrast, the dark signal has substantially been reduced and stabilized by mounting the detector into an appropriate housing and thus reducing and stabilizing the fluctuating temperature difference ΔT between the sensitive area and the heat sink of the detector (see the right panel in Fig. 10). The noise is no longer overlaid by any drift corresponding to thermal instabilities of the ambient conditions. It has been found that this remaining noise is caused by air pressure instabilities in the laboratory because the windowless TS-76 is slightly sensitive to air pressure changes. These air pressure fluctuations are induced by the air conditioning which pumps a certain amount of air through the laboratory.
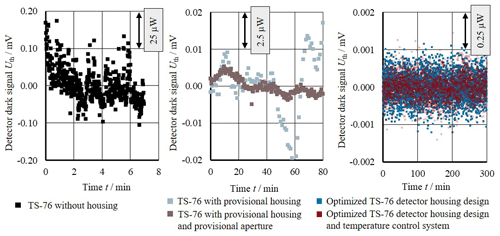
Figure 10Measurement of the dark signal of the TS-76 at different iterations of the housing development. The fluctuations of the dark signal correspond to an equivalent power value given for each panel considering the spectral responsivity of the TS-76 of roughly 4 V W−1.
The noise equivalent power of the detector system consisting of TS-76, housing, active temperature stabilization, and amplifier under the given laboratory conditions has been determined based on the measurements of the spectral responsivity and of the noise of the dark signal of the TS-76. The standard deviation of the dark signal (measured for 120 min) can be transformed into a corresponding radiant power by using the measured spectral responsivity. The result of about 90 nW is equivalent to the lower detection limit of the complete system under the given laboratory conditions.
4.3 Use of the external temperature control system
Under laboratory conditions, no further improvement to the signal stability has been found by using the active temperature control system; see the right panel in Fig. 10. Further measurements have been conducted with additional thermal disturbances of the detector housing to simulate rough environmental conditions.
A thermal interference has been simulated by touching the outer detector housing for 1 min by hand – an incident that for example could happen while aligning the optical components. Figure 11 shows the temperature progression at the inner housing (measured via the thermistor of the TS-76) and at the outer housing (measured with the Pt100). The experiment has been conducted twice, first without the temperature control system and afterwards with the temperature control system turned on. The following results have been found.
-
The influence of the thermal disturbance on the temperature of the outer and inner housing is significantly decreased almost by half when using the temperature control system.
-
The temperature of the outer housing stabilizes in half the time when using the temperature control system.
-
The active temperature control system additionally balances the temperature in case of changes in the surrounding temperature such as at t=75 min in panel (a) in Fig. 11.
-
Furthermore, these experiments demonstrate the thermal decoupling between the outer and inner detector housing because the change in the temperature of the inner detector housing is only about one-third of the temperature change in the outer detector housing.
-
Additional comprehensive FEM simulations confirm the realized thermal stabilization with the optimized detector housing design (Pohl, 2018).
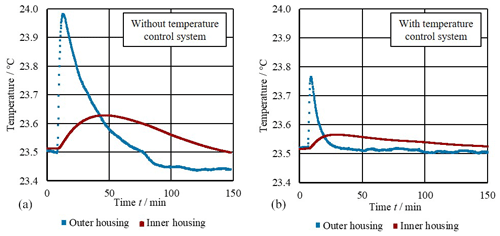
Figure 11Recorded temperature of outer and inner housing for a thermal disturbance at time t=10 min. The thermal disturbance is simulated by touching the outer housing cover for 1 min by hand. The experiment has been conducted with a disabled (a) and activated external temperature control system (b). The temperature of the outer housing has been measured with a Pt100 sensor and the temperature of the inner housing with the thermistor at the TS-76.
4.4 Thermal isolation between inner and outer detector housing
The thermal isolation between the inner and outer housing has been measured by applying a persistent rise in the outer housing temperature (ΔT=0.8 K) and monitoring the temporal change in the inner detector temperature (Fig. 12). This temperature step has been realized by using the temperature control system. The change in the inner housing temperature over time can be fitted by using an exponential function. The time constant which reflects the quantity of the thermal isolation has been found to be about 63 min.
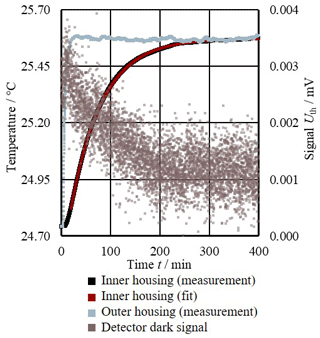
Figure 12Temperature of the TS-76 measured at the outer housing with the Pt100 and at the inner housing with the thermistor. The outer housing temperature has been increased by about 0.8 K with the temperature control system at t=0 min. Furthermore, the detector dark signal, which correlates with the temperature of the inner detector, and an exponential fit of the measurement of the inner housing temperature are depicted.
Based on this measurement, an effective thermal resistance Rth of the isolation between outer and inner housing can be determined. The thermal resistance is defined as the ratio between the temperature difference ΔT between outer and inner housing and the correspondent heat flow :
The heat Q that has been flown into the inner detector housing at the time ti can be calculated by
The temperature increase Ti−T0 in the inner detector housing has been measured by using the thermistor of the detector (Fig. 12), the mass of the inner detector housing is m=0.38 kg and the specific heat capacity of aluminium is approximately c≈900 J kg−1 K−1. The heat flow can be determined numerically during the heating process for each time increment i in approximation as
The thermal resistance has been averaged over the time increments during the heating process:
The calculation of the effective thermal resistance Rth enables us to calculate the temperature increase in the inner detector housing due to received radiant power. The result of a thermal resistance of about 11 K W−1 implies that a continuous radiant power of 100 µW – which is typically the maximum radiant power used during measurements – theoretically heats up the inner detector housing only by about 1.1 mK, an amount that is completely negligible. Additionally, the detector is typically only exposed to radiation for a few minutes and not permanently. Therefore, it is not necessary to remove heat from the inner housing at these power levels, e.g. via an additional thermostat for the inner detector housing. Furthermore, it is helpful to avoid an active temperature stabilization of the inner detector housing because the heat flow within the inner housing is then reduced to a minimum. Any heat flow through this housing would otherwise lead to temperature gradients and consequently to detector signals caused by temperature differences over the thermocouples.
Additionally, the thermoelectric voltage Uth of the TS-76 has been measured during the temperature increase in the housing. This voltage has decreased by about 2 µV during the heating process (Fig. 12) due to the related increase in the temperature of the detector heat sink. This corresponds to a background signal sensitivity of about 0.65 µW K−1. Obviously, this sensitivity can be neglected considering that typical temperature fluctuations of the stabilized housing are less than 0.1 K (compare Fig. 11).
4.5 Measurement uncertainty obtained with optimized detector housing
The measurement of the spectral responsivity of the thermopile detector TS-76 has been repeated at a wavelength of 10.6 µm by using the optimized detector housing. As expected, the uncertainty contribution due to the detector noise has been reduced by the thermal stabilization of the thermopile detector. The relative statistical uncertainty due to noise of the TS-76, of the radiant power, and of the cryogenic radiometer is about 0.35 %. This contribution can furthermore be reduced by repeating the measurement a convenient number of times. Additionally, the optimized housing is equipped with an aperture of the same size compared to the aperture of the cryogenic radiometer. The effect of stray radiation on the measurement of the spectral responsivity is therefore reduced to a minimal level. For this reason, the relative uncertainty contribution due to stray radiation has been reduced from 2 % to 0.19 %. The limiting contribution to the measurement uncertainty is now given by the uncertainty due to the measurement of the ZnSe window transmittances.
Table 3Contributions to the relative measurement uncertainty for the measurement of the spectral responsivity of the thermally stabilized TS-76 against the cryogenic electrical substitution radiometer at 10.6 µm.
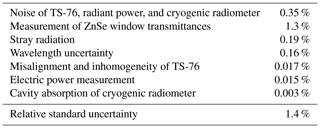
The wavelength of the CO2 laser is constrained to a certain number of laser lines around 10.6 and 10.25 µm. Assuming a wavelength uncertainty of 0.4 µm and considering the measured wavelength sensitivity 0.015 V W−1 µm−1 of the TS-76, the uncertainty contribution due to the wavelength uncertainty is only about 0.16 %. Furthermore, the wavelength uncertainty of the QCL is below 0.01 µm, as specified by the manufacturer. This specification of the QCL has been verified by using the tuneable radiation of this QCL for the measurement of the known transmission curve of a bandpass filter. Finally, the wavelength uncertainty of the monochromatized radiation of the supercontinuum laser is below 0.001 µm. In this case, the wavelength scale of the monochromator has been calibrated traceable to the SI by using the radiation of a HeNe laser at 633 nm. The uncertainty contributions caused by the wavelength uncertainty can therefore be neglected.
Finally, the combined relative standard uncertainty for the calibration of the spectral responsivity of the thermally stabilized TS-76 against the cryogenic electrical substitution radiometer has been reduced from about 2.5 % to 1.4 % at 10.6 µm (see Table 3). It has to be mentioned that the relative standard uncertainty of the measurement of the window transmittance is much lower in the spectral range below 2.4 µm because windows made of fused silica have been used in this spectral range.
Calibrations of the spectral responsivity s(λ) with reduced measurement uncertainties in the spectral range between 1.5 and 10.6 µm will be realized by using the optimized TS-76 detector housing design. The interpolation of the spectral responsivity in the MIR will be improved based on these calibrations. This allows a deeper characterization of the slight increase in the spectral responsivity with increasing wavelength (see Fig. 7) as well.
The traceability of radiometric physical quantities to the International System of Units (SI) is realized by national metrology institutes like the Physikalisch-Technische Bundesanstalt by operating radiometric detector standards like cryogenic electrical substitution radiometers. This traceability is furthermore important for SI traceable measurements in radiation thermometry or in photometry. Such a cryogenic electrical substitution radiometer facility at the PTB has recently been expanded for measurements in the MIR spectral range by implementation of additional mid-infrared laser radiation sources. This enables us to perform SI traceable calibrations of the spectral responsivity s(λ) of MIR detectors in the wavelength range up to at least 10.6 µm.
The thermopile detector TS-76 has exemplarily been established as a transfer detector standard for the measurement of optical radiant power in the mid-infrared spectral range that can be used for the dissemination of the spectral responsivity s(λ) at other measurement facilities. The development of an optimized detector housing design for the TS-76 significantly reduces the measurement uncertainty of the calibration of the spectral responsivity. The instability of the TS-76 is no longer the main contribution of the measurement uncertainty.
The PTB will also characterize other types of mid-infrared detectors (e.g. pyroelectric detectors) at the expanded cryogenic electrical substitution radiometer facility in the near future. This work will also include semiconductor detectors which usually have much smaller sensitive areas in the MIR. Furthermore, a new comparator facility will be built to calibrate customer detector devices with respect to their absolute and relative spectral responsivity traceable to the SI.
All relevant measurement results are shown in the publication. However, the underlying measurement data are not publicly available and can be requested from the authors, if required.
TP, PM, UJ, and LW designed the calibration setup, performed the measurements, and evaluated the measurement results. DT contributed to characterization measurements of the detectors. TP and PM designed the temperature-stabilized detector housing and wrote the manuscript with contributions from all the authors.
The authors declare that they have no conflict of interest.
The component producers/suppliers are mentioned for identification purposes only. Such identification does not imply recommendation or endorsement by the PTB, nor does it imply that the producers/suppliers identified are necessarily the best available for the purpose.
This paper was edited by Bernhard Jakoby and reviewed by two anonymous referees.
Adibekyan, A., Kononogova, E., Monte, C., and Hollandt, J.: High-Accuracy Emissivity Data on the Coatings Nextel 811-21, Herberts 1534, Aeroglaze Z306 and Acktar Fractal Black, Int. J. Thermophys., 38, 1–14, 2017.
Allison, R. S., Johnston, J. M., Craig, G., and Jennings, S.: Airborne Optical and Thermal Remote Sensing for Wildfire Detection and Monitoring, Sensors-Basel, 16, 1310, https://doi.org/10.3390/s16081310, 2016.
BIPM (Bureau International des Poids et Mesures): Guide to the expression of uncertainty in measurement (GUM), International Organization for Standardization, Sèvres, 1995.
Budzier, H. and Gerlach, G.: Thermische Infrarotsensoren – Grundlagen für Anwender, Wiley-VCH Verlag GmbH & Co. KGaA, Weinheim, 2010.
Gottwald, A., Kroth, U., Krumrey, M., Richter, M., Scholze, F., and Ulm, G.: The PTB high-accuracy spectral responsivity scale in the VUV and x-ray range, Metrologia, 43, S125–S129, 2006.
Gutschwager, B., Theocharous, E., Monte, C., Adibekyan, A., Reiniger, M., Fox, N. P., and Hollandt, J.: Comparison of the radiation temperature scales of the PTB and the NPL in the temperature range from −57 ∘C to 50 ∘C, Meas. Sci. Technol., 24, 065002, https://doi.org/10.1088/0957-0233/24/6/065002, 2013.
Hartmann, J., Hollandt, J., Meindl, P., Taubert, D., and Werner, L.: Traceable Radiometric Calibration of Semiconductor Detectors and their Application for Thermodynamic Temperature Measurement. MAPAN, J. Metrol. Soc. India, 25, 3–10, 2010.
Holstenberg, H. C., Pawlak, M., Möstl, K., and Metzdorf, J.: Charakterisierung elektrisch kompensierbarer Dünnschichtthermosäulen hinsichtlich ihrer Eignung als Transfernormale, Innovation der Mikrosystemtechnik, 26, 15–128, 1995.
Martin, J. E., Fox, N. P., and Key, P. J.: A Cryogenic Radiometer for Absolute Radiometric Measurements, Metrologia, 21, 147–155, 1985.
Meindl, P., Klinkmüller, A. E., Werner, L., Johannsen, U., and Grützmacher, K.: New UV spectral responsivity scale of the PTB based on a cryogenic radiometer and an argon plasma arc radiation source, Metrologia, 43, S72–S77, 2006.
Müller, I., Johannsen, U., Linke, U., Socaciu-Siebert, L., Smîd, M., Porrovecchio, G., Sildoja, M., Manoocheri, F., Ikonen, E., Gran, J., Kübarsepp, T., Brida, G., and Werner, L.: Predictable quantum efficient detector: II. Characterization and confirmed responsivity, Metrologia, 50, 395–401, 2013.
Müller, J. E., Kessler, E., Diller, U., Ratz, P., Pawlak, M., Holstenberg, H. C., Stock, K. D., and Metzdorf, J.: Large-size high-sensitive thermopile as a radiometric standard. Thematic Network for Ultraviolet Measurements, Newsletter, 2, 32–35, 1999.
Noulkow, N., Taubert, R. D., Meindl, P., and Hollandt, J.: Infrared Filter Radiometers for Thermodynamic Temperature Determination below 660 ∘C, Int. J. Thermophys., 30, 131–143, 2009.
Pohl, T.: Entwicklung und Charakterisierung eines Transfernormals für die Messung optischer Strahlungsleistung im infraroten Spektralbereich auf Grundlage eines Thermosäulendetektors, Master thesis, TU Berlin, Berlin, 2018.
Rothman, L. S., Gordon, I. E., Babikov, Y., Barbe, A., Chris Benner, D., Bernath, P.F., Birk, M., Bizzocchi, L., Boudon, V., Brown, L. R., Campargue, A., Chance, K., Cohen, E .A., Coudert, L. H., Devi, V. M., Drouin, B. J., Fayt, A., Flaud, J.-M., Gamache, R. R., Harrison, J. J., Hartmann, J.-M., Hill, C., Hodges, J. T., Jacquemar, D., Jolly, A., Lamouroux, J., Le Roy, R.J., Li, G., Long, D. A., Lyulin, O. M., Mackie, C. J., Massie, S. T., Mikhailenko, S., Müller, H. S. P., Naumenko, O. V., Nikitin, A. V., Orphal, J., Perevalov, V., Perrin, A., Polovtseva, E.R., Richard, C., Smith, M.A.H., Starikova, E., Sung, K., Tashkun, S., Tennyson, J., Toon, G. C., Tyuterev, V. G., and Wagner, G.: The HITRAN2012 molecular spectroscopic database, J. Quant. Spectrosc. Ra., 130, 4–50, 2013.
Taubert, R. D., Meindl, P., Monte, C., Werner, L., Pohl, T., and Hollandt, J.: Absolute Mid-infrared Spectral Responsivity Scale Based on Thermal Detectors and the Cryogenic Radiometer, AMA-Konferenz SENSOR/IRS2, 2017.
Völklein, F. and Kessler, E.: Thermoelectric properties of BsSb films with , Thin Solid Films, 155, 197–208, 1987.
Völklein, F. and Kessler, E.: Thermal Conductivity of Thin Autimony Films, Phys. Status Solidi B, 158, 521–529, 1990.
Werner, L., Fischer, J., Johannsen, U., and Hartmann, J.: Accurate determination of the spectral responsivity of silicon trap detectors between 238 nm and 1015 nm using a laser-based cryogenic radiometer, Metrologia, 37, 279–284, 2000.
Werner, L., Hübers, H.-W., Meindl, P., Müller, R., Richter, H., and Steiger, A.: Towards traceable radiometry in the terahertz region, Metrologia, 46, S160–S164, 2009.
Werner, L., Johannsen, U., Linke, U., Meindl, P., Schirren, J., and Müller, I.: Reducing the uncertainties of detector calibrations against the cryogenic electrical-substitution radiometer, Proceedings of NEWRAD, 207–208, 2014.
- Abstract
- Introduction
- Absolute calibration of the spectral responsivity of radiation detectors
- Calibration of the spectral responsivity of the thermopile detector TS-76
- Evolution of an optimized, temperature-stabilized detector housing for the TS-76
- Conclusion and outlook
- Data availability
- Author contributions
- Competing interests
- Disclaimer
- Review statement
- References


