the Creative Commons Attribution 4.0 License.
the Creative Commons Attribution 4.0 License.
 | 23 May 2019
Amplitude–phase calibration of tri-axial accelerometers in the low-frequency range by a LDV
Antonella Gaspari
Emanuela Natale
A method for amplitude–phase calibration of tri-axial accelerometers in the low-frequency range (0 to 20 Hz) is proposed, based on a linear slide, used to excite all the axes of the accelerometer at the same time, and a laser Doppler vibrometer (LDV) as a reference. For the phase evaluation different methods, like cross-correlation analysis and cross-spectrum analysis, have also been used for validation purposes. The procedure includes many further validation actions in order to verify the correctness of modelling of the systems being tested, of the data processing and to reduce the calibration uncertainty.
Results show that the phase is a critical aspect to consider in calibration, more than the amplitude, and the comparison with the theoretical model is useful to verify the hypotheses. Different behaviours result depending on the elements of the measurement chain and not only on the type of accelerometer.
- Article
(1906 KB) - Full-text XML
- BibTeX
- EndNote


Among all the accelerometers, the capacitive (and in particular Micro-Electro-Mechanical System – MEMS capacitive) and the piezoelectric ones are the most widespread and commonly used kinds of accelerometers, often conveniently integrated in practical applications.
MEMS accelerometers have been receiving particular attention because of their low cost and small size (Son et al., 2016). In facts, MEMS capacitive accelerometers have the benefits of low power consumption, low sensitivity to temperature changes and low cost, and they are suitable for measuring low-frequency acceleration but suffer from a limited bandwidth and a low signal-to-noise ratio.
On the other hand, piezoelectric accelerometers are characterized by low noise output and a wide frequency range, but their cost is significantly higher and they are unable to measure static and quasi-static acceleration (Lu et al., 2018).
For this reason, they could be in crisis in the lower side of their frequency bandwidth, and the information from data sheets is not always comprehensive in this regard.
In the literature, the integration of these kinds of accelerometers is proposed, to combine the best features of both (Lu et al., 2018).
In the field of seismic and civil structure monitoring, the combination of these kinds of sensors could be useful. In fact, the need to cover wide areas through a multi-sensor network sets the requirement of low-cost solutions suitable in the low-frequency range (Sabato et al., 2017), like capacitive MEMS accelerometers do. Piezoelectric accelerometers are reliable and stable sensors and could be used as a reference for the MEMS sensors.
According to these guidelines, a low-cost sensing unit for seismic applications, based on MEMS accelerometers, performed a long series of tests and was compared with a reference station (Pierleoni et al., 2018).
However, many other applications arise in different fields of engineering, where a single accelerometer or a network of accelerometers are used, to monitor the system of interest in the low-frequency range such as, for instance, energy production (Ripper et al., 2017), geotechnical applications (Czech and Gosk, 2017), human vibration and bio-dynamics (Griffin, 2014).
For all these reasons, micro accelerometers (Kavitha et al., 2012, 2016) and calibration methods (D'Emilia et al., 2018a, b) have been specifically designed for the low-frequency range, but they are limited to the amplitude evaluation.
The phase evaluation is important in such applications, in which the overlapping effects of the waves can produce very different consequences (Pierleoni et al., 2018).
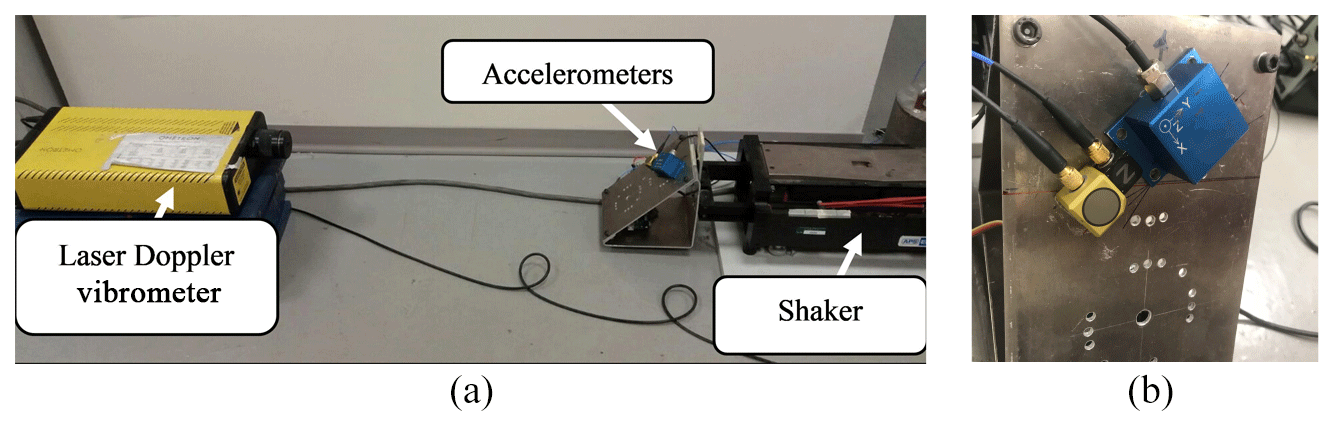
Figure 1(a) Picture of the calibration bench. (b) Accelerometers being tested, mounted on the clamp.
Therefore, knowing the behaviour of these sensors in the low-frequency range, in terms of amplitude and phase, could be useful information for the design and the use of a distributed sensor network.
Using new sensors requires new supply and conditioning units; therefore the behaviour of the whole measuring chain should be studied. It should to be pointed out that many components exist in the measuring chain to be characterized from a dynamic point of view, in particular at frequencies near 0 Hz. A four-pole Butterworth high-pass filter with a cut-off frequency equal to 0.2 Hz is used in Pierleoni et al. (2018), to better calculate the so-called “strong-motion” parameters for characterization of an earthquake starting from acceleration data; in this way the problems in the integration of data are reduced.
For piezoelectric accelerometers, the low-frequency response of the measuring set-up depends primarily on the amplifier used in the measuring system. The output of a piezoelectric accelerometer should be corrected by eliminating gain and phase shift caused by the amplifier (Link et al., 2006).
Alternatively, the behaviour of the entire measurement chain could be experimentally investigated, taking into account the contribution of all its elements and this is not a trivial task.
In fact, if a very innovative application is considered, the filter optimization of the piezoelectric tri-axial accelerometer is the basis of a displacement measurement method, which is piezoelectric accelerometer based, allowing very accurate measurements for driving a CNC machine: the attention to the sensor phase shift is mandatory in order to reduce the bias error due to the double integration for positioning of the operating device (Abir et al., 2016).
Based on the above considerations, there are many applications where a calibration of both amplitude and phase is particularly important for a reliable vibration analysis (Albarbar et al., 2009; Badri et al., 2011); it could be useful for MEMS accelerometers in particular, in comparison to high-performance piezoelectric transducers, since they typically exhibit lower accuracy.
Despite this requirement, even though a calibration is done, information about sensor behaviour in the very low frequency (near 0 Hz) range is not completely exhaustive, in particular for the phase shift (Lu et al., 2018; Pierleoni et al., 2018). That problem could result in a reduction in the measuring range of the earthquake monitoring station, in terms of measurable magnitude (Pierleoni et al., 2018). The working principle could be made useless (Abir et al., 2016).
As for calibration, it must be pointed out that the Standard ISO 16063-21, which deals with the vibration calibration by comparison to a reference transducer, suggests the optional use of a phase meter but does not consider the phase shift measurement as mandatory. Anyway, some authors (Badri et al., 2011) suggest the cross-spectrum as a method to evaluate the frequency response function (FRF) between the accelerometer being tested and the reference one, in order to obtain both the amplitude ratio and phase relation between the two sensors. Also in this case, information about the phase behaviour of the MEMS accelerometer being tested is not completely satisfactory (Badri et al., 2011).
Finally, the proposed method, in order to be considered useful, should be simpler than the standard one, to be used for in-line and on-line calibration (D'Emilia et al., 2018a, b). An uncertainty evaluation, according to a Procedure for Uncertainty Management (PUMA) (ISO 14253-2:2011), should be carried out in order to easily find a solution able to achieve a suitable trade-off between calibration uncertainty and calibration procedure complexity and cost.
Based on these considerations, the goal of this paper is to investigate the behaviour of tri-axial piezoelectric and capacitive MEMS accelerometers in the lower limit of the operating frequency range, from the point of view of sensitivities and phases, considering all of the measuring chains.
For this purpose, a calibration method is proposed, based on a linear slide, used to excite the accelerometer being tested in the low-frequency range, and a LDV, used as a reference. A similar approach has been already demonstrated to be very promising for the amplitude calibration of accelerometers (D'Emilia et al., 2018a, b). A similar approach was used in Abir et al. (2016), even though a laser interferometer was the displacement measurement reference.
The amplitude–phase behaviour of different measuring chains will be analysed, at very low frequencies, by experimental data.
The phase shifting, in particular, will be calculated by cross-correlation and cross-spectrum analysis, between the accelerometer and the reference signals. A comparison of these approaches will be also carried out for validation purposes. The low-frequency behaviour of the LDV, to be used as a reference, is also a key aspect to be considered (Sun et al., 2018), and an experimental procedure to evaluate the phase contribution of the LDV will be also discussed in the paper. An uncertainty evaluation is carried on by the uncertainty budget method and it will allow both the results to be assessed and the range of possible utilization of the proposed method to be defined.
This paper aims to investigate the behaviour, in terms of sensitivity and phase, of capacitive MEMS and IEPE (integrated electronics piezoelectric) accelerometers in the frequency range 0.5 to 20 Hz, considering the whole measuring chains.
For this purpose, a calibration bench is designed, based on a LDV VS 100, by Ometron, as a reference (Fig. 1), and a simple procedure is developed, requiring a single set of tests to excite all the axes at the same time, and based on a data processing algorithm implemented in a MATLAB environment.
The test bench used is a vibrating table with a horizontal linear slide, the APS 113 ELECTRO-SEIS shaker. It is a long-stroke, electro-dynamic force generator specifically suitable for low-frequency vibration testing. The slide is moved according to a sinusoidal law.
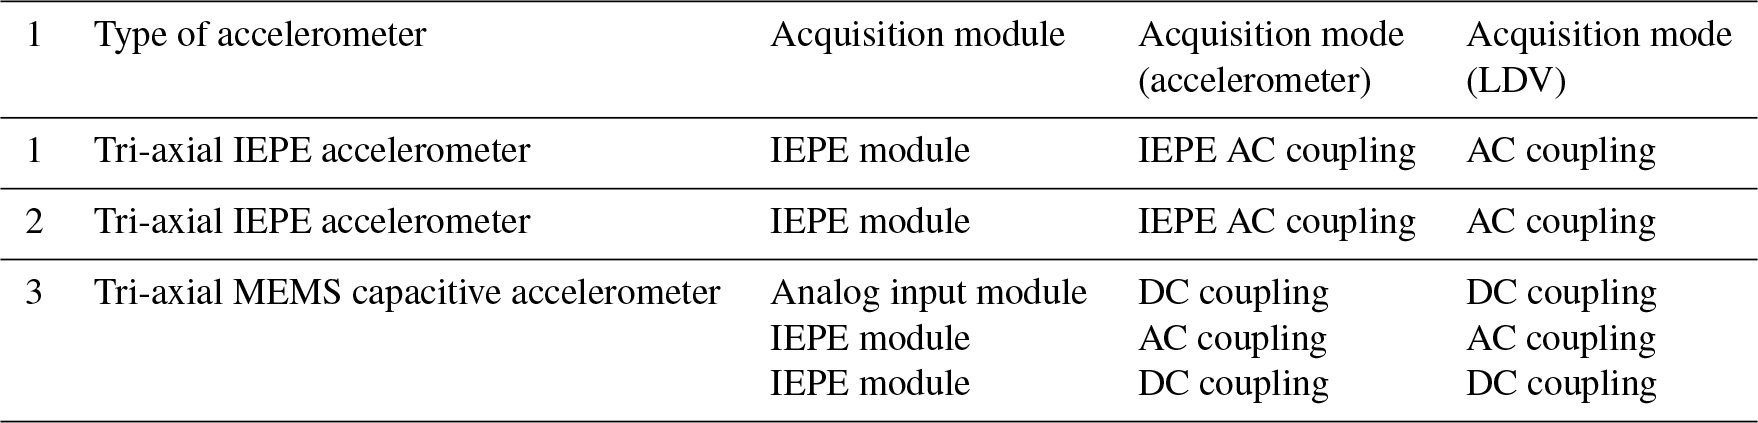
Table 1Accelerometers being tested and their measuring chains.
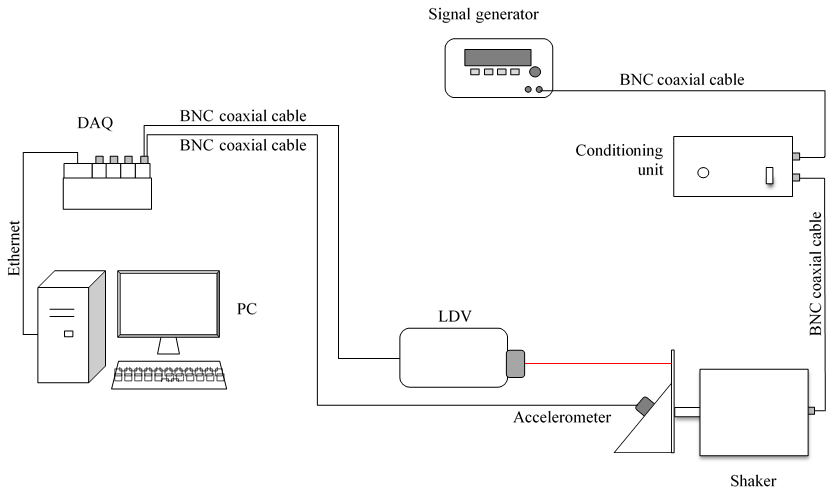
The data acquisition system (DAQ) is the Compact RIO 9004 by National Instruments, together with the module NI 9234 for both IEPE and non-IEPE sensors, and the analog input module NI 9215.
The accelerometers tested and their measuring chains are shown in Table 1. The first two accelerometers are of the same type, but they have different sensitivities.
Each acquisition module (NI 9234 and NI 9215) is equipped with 4 input channels. So, in each test, the three axes of the accelerometer under calibration are acquired by the first three channels of the module, and the LDV output is acquired by the fourth channel of the same module, to guarantee the synchronism of the acquisitions.
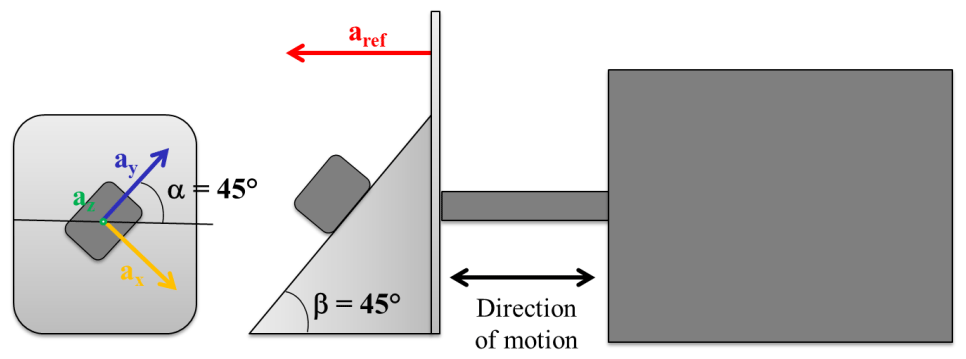
The accelerometer being tested is mounted on an inclined plate at an angle of 45∘ with respect to the horizontal plane on which the motion is realized. Furthermore, the accelerometer is rotated on the clamp surface with an angle of 45∘, in order to simultaneously excite the three axes, with a single horizontal sinusoidal acceleration (Fig. 2).
The whole test bench is shown in Fig. 3.
2.1 Sensitivity evaluation
Considering that the LDV output is proportional to the velocity, it must be differentiated to obtain the acceleration signal.
This acceleration, indicated as aref in Fig. 2, has to be projected along the directions of the axes. So, the reference accelerations along the three axes are obtained as follows:
The sensitivities are estimated by dividing the amplitudes of the x, y and z outputs, by the amplitudes of the reference signals, all evaluated by an FFT analysis:
The transversal sensitivities are neglected in this analysis, based on the hypothesis that they are less than 5 %, but their effects are considered in the uncertainty budget.
2.2 Phase evaluation
With regard to the phase evaluation, the reference signals and the outputs of the accelerometer being tested have been compared by a cross-correlation analysis, executed in MATLAB environment by the “finddelay” function.
In this way, the phase delay of the whole measuring chain with respect to the reference one is tested.
In the phase evaluation, the phase of the reference is a critical aspect to consider (Sun et al., 2018). As a first approximation, the LDV phase behaviour has been considered ideal (i.e. negligible phase effect of the frequency of vibration). That hypothesis will be discussed in the Results section.
2.3 Validation
Validation actions are necessary to confirm the correctness of the procedure and of data processing (D'Emilia et al., 2015, 2017).
In particular, the following controls have been carried out:
-
the same signal acquired contemporaneously by different channels, both in DC coupling or AC coupling mode – in this case, the finddelay function provides a null delay;
-
couples of signals with different delays are digitally built – the finddelay algorithm provides the set delay;
-
agreement of results with the indications of Lissajous figures;
-
systematic comparison between experimental results and theoretical models;
-
Phase delay computation by different methods and comparison of results – in particular, the cross-spectrum between couples of signal has been extensively used.
2.4 Uncertainty evaluation
In Table 2 the uncertainty budget for the sensitivity estimation is shown. It can be seen that the main contributions are represented by the uncertainty of the positioning angles of the accelerometers and the transversal sensitivities, whose uncertainty is of the order of 2 % in the hypothesis that they are less than 5 % with respect to the main sensitivities. The complete description of these contributions and of the method for their evaluation is in D'Emilia et al. (2018b). Repeatability, reproducibility and reference uncertainty are evaluated on experimental data.
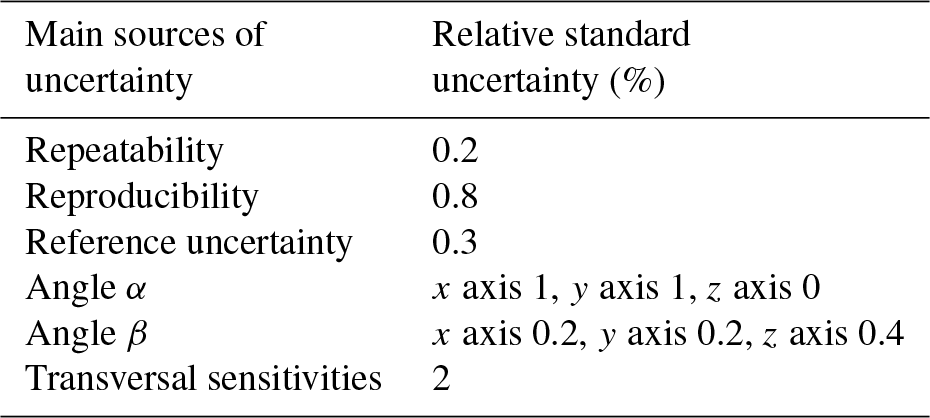
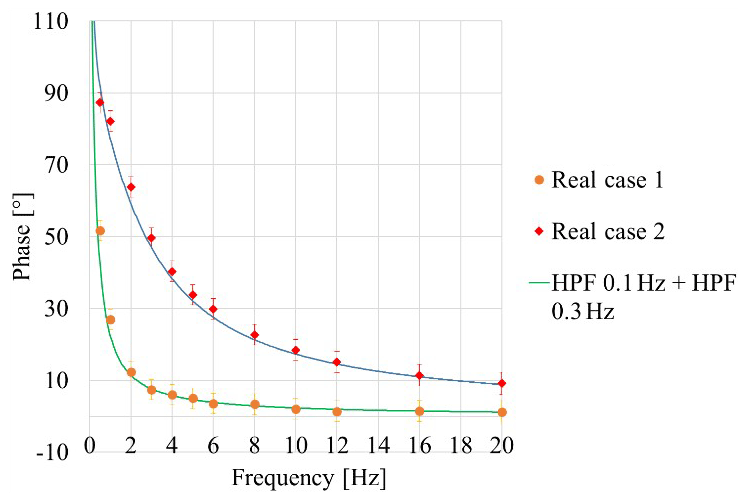
Figure 4Comparison between theoretical curves modelling two high-pass filters (HPFs) in cascade and experimental data.
The uncertainty budget for the phase evaluation is shown in Table 3. In this case, the positioning angles do not influence the results. The main contributions are the repeatability, and the resolution linked to the sampling rate and the reference uncertainty. The repeatability is calculated from experimental data, the resolution is evaluated as indicated in Table 3, on the basis of the sampling rate and the oscillation frequency; finally, the phase uncertainty of the reference is obtained from the instrument's data sheet. This contribution to the uncertainty budget is obviously greater than that requested by the Standard ISO 16063-21 (2∘ for the phase shift, using a coverage factor of 2 at pre-defined frequencies).
3.1 Preliminary hypothesis and their validation
As a first approximation, the LDV phase behaviour has been considered ideal (i.e. negligible phase effect of the frequency of vibration due for example to internal high-pass filters).
Table 3Uncertainty budget for the phase evaluation. fc is the sampling rate, f is the oscillation frequency.
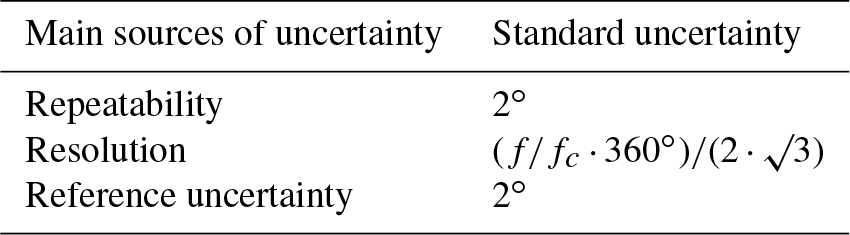
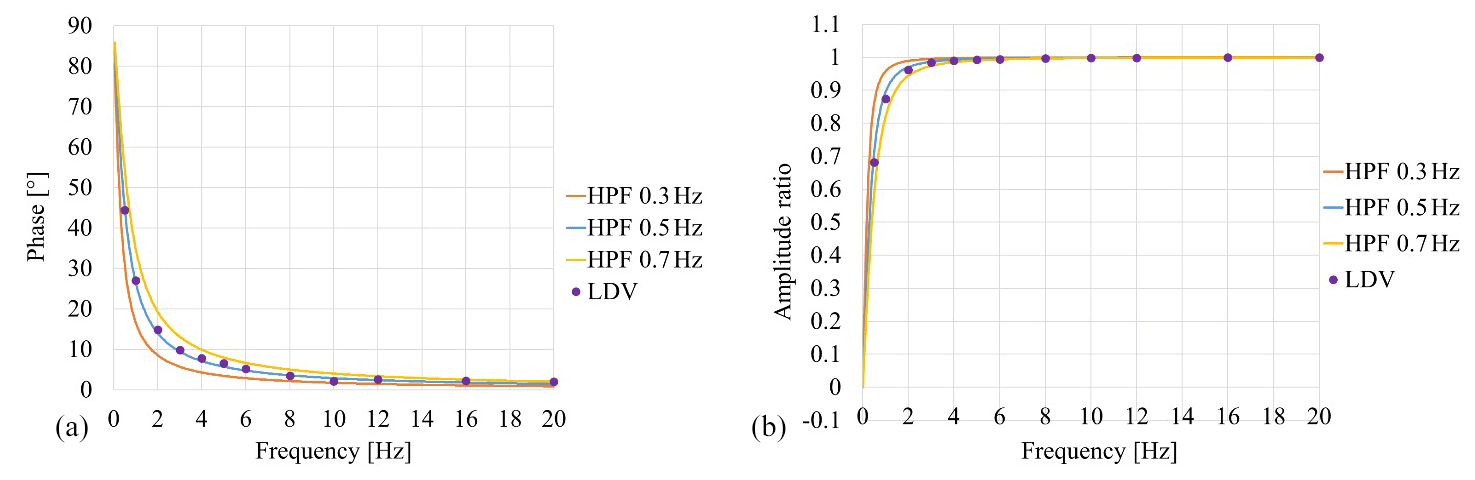
Figure 5Comparison between phase theoretical curves of a first-order high-pass filter (HPF) with cut-off frequency in the range 0.3–0. Hz and experimental data for (a) phase and (b) amplitude.
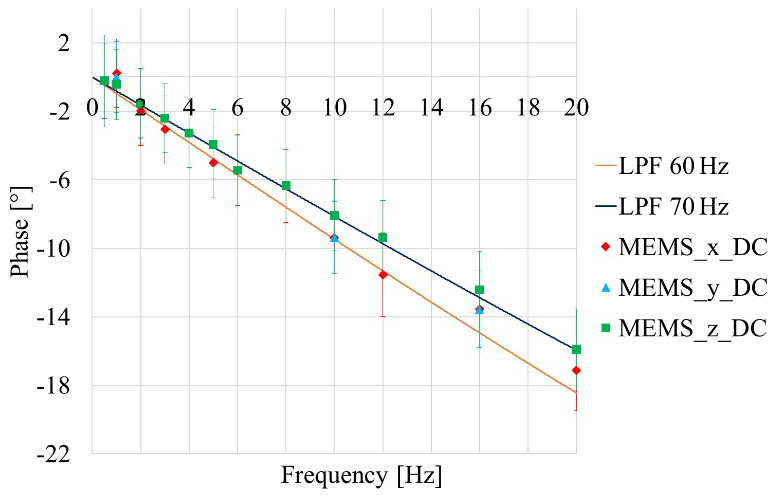
Figure 6Comparison between phase theoretical curves of first-order low-pass filters (LPFs) with cut-off frequencies 60 and 70 Hz and experimental data from the MEMS accelerometer, acquired in DC mode.
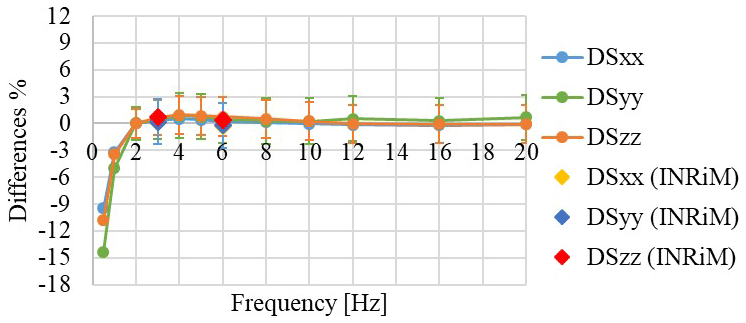
Figure 7Sensitivity differences for the IEPE accelerometer, acquired by the IEPE module, in IEPE AC coupled mode.
A simple modelling of the whole measuring chain of a piezoelectric accelerometer, with external amplifier, allowed us to confirm this approximation by comparing it with the experimental phase delay of the piezoelectric accelerometer, evaluated with respect to the LDV, both acquired in AC coupling mode.
The model considers two first-order high-pass filters in cascade, one inside the accelerometer and one inside the amplifier. The cut-off frequency of the amplifier can be set.

Figure 8Sensitivity differences for the MEMS capacitive accelerometer: (a) analog input module; (b) IEPE module, DC coupled mode; (c) IEPE module, AC coupled mode.
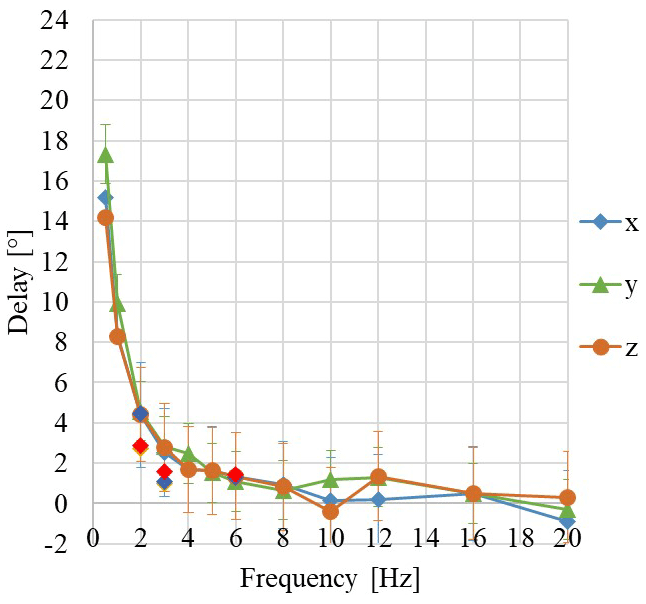
Figure 9Experimental delay for the IEPE accelerometer, acquired by the IEPE Module, in IEPE AC coupled mode.
Figure 4 describes the results, comparing the following:
- a.
two high-pass filters in cascade with cut-off frequencies 0.1 and 0.3 Hz respectively (theoretical model, indicated as HPF 0.1 Hz + HPF 0.3 Hz), and the experimental phase delay of a measuring chain based on a piezoelectric accelerometer (internal cut-off frequency 0.1 Hz) and an amplifier (cut-off frequency 0.3 Hz), indicated as Real Case 1;
- b.
two high-pass filters in cascade with cut-off frequencies 0.1 and 3 Hz respectively (theoretical model, indicated as HPF 0.1 Hz + HPF 3 Hz), and the experimental phase delay of a measuring chain based on a piezoelectric accelerometer (internal cut-off frequency 0.1 Hz) and an amplifier (cut-off frequency 3 Hz), indicated as Real Case 2.
The good agreement between experimental data and theoretical curves suggests that no significant phase shift due to the LDV should be present, almost down to 0.5 Hz; the phase shift at different frequencies only depends on the sensor and on the amplifier characteristics.
As a further validation of the simple modelling of the filter and coupling behaviour, the IEPE acquisition module, set in AC coupled mode, has been also considered.
Figure 5a shows the phase differences between the output of the LDV when coupled with either AC or DC. The experimental points are placed near the theoretical curve modelling the phase of a first-order high-pass filter with a cut-off frequency of 0.5 Hz (indicated as HPF 0.5 Hz). This result confirms that the cut-off frequency of the acquisition module is 0.5 Hz in AC coupled mode, according to the data sheet.
Similar considerations can be made with regard to the amplitude behaviour (Fig. 5b).
Figure 6 shows the phase behaviour of the MEMS capacitive accelerometer being tested. The three measuring axes exhibit low-pass cut-off frequencies in the range 60 to 70 Hz, by comparison with theoretical indications (indicated as LPF 60 Hz and LPF 70 Hz). The low-frequency good behaviour of the LDV is confirmed.
3.2 Sensitivity evaluation
The results for sensitivities will be represented as percentage differences with respect to the value at 2 Hz. For instance, for the x axis,
The results are similar, for both the IEPE accelerometers considered. The sensitivities for all axes decrease by 15 % compared to the values obtained at 2 Hz, when the frequency is reduced to 0.5 Hz (Fig. 7).
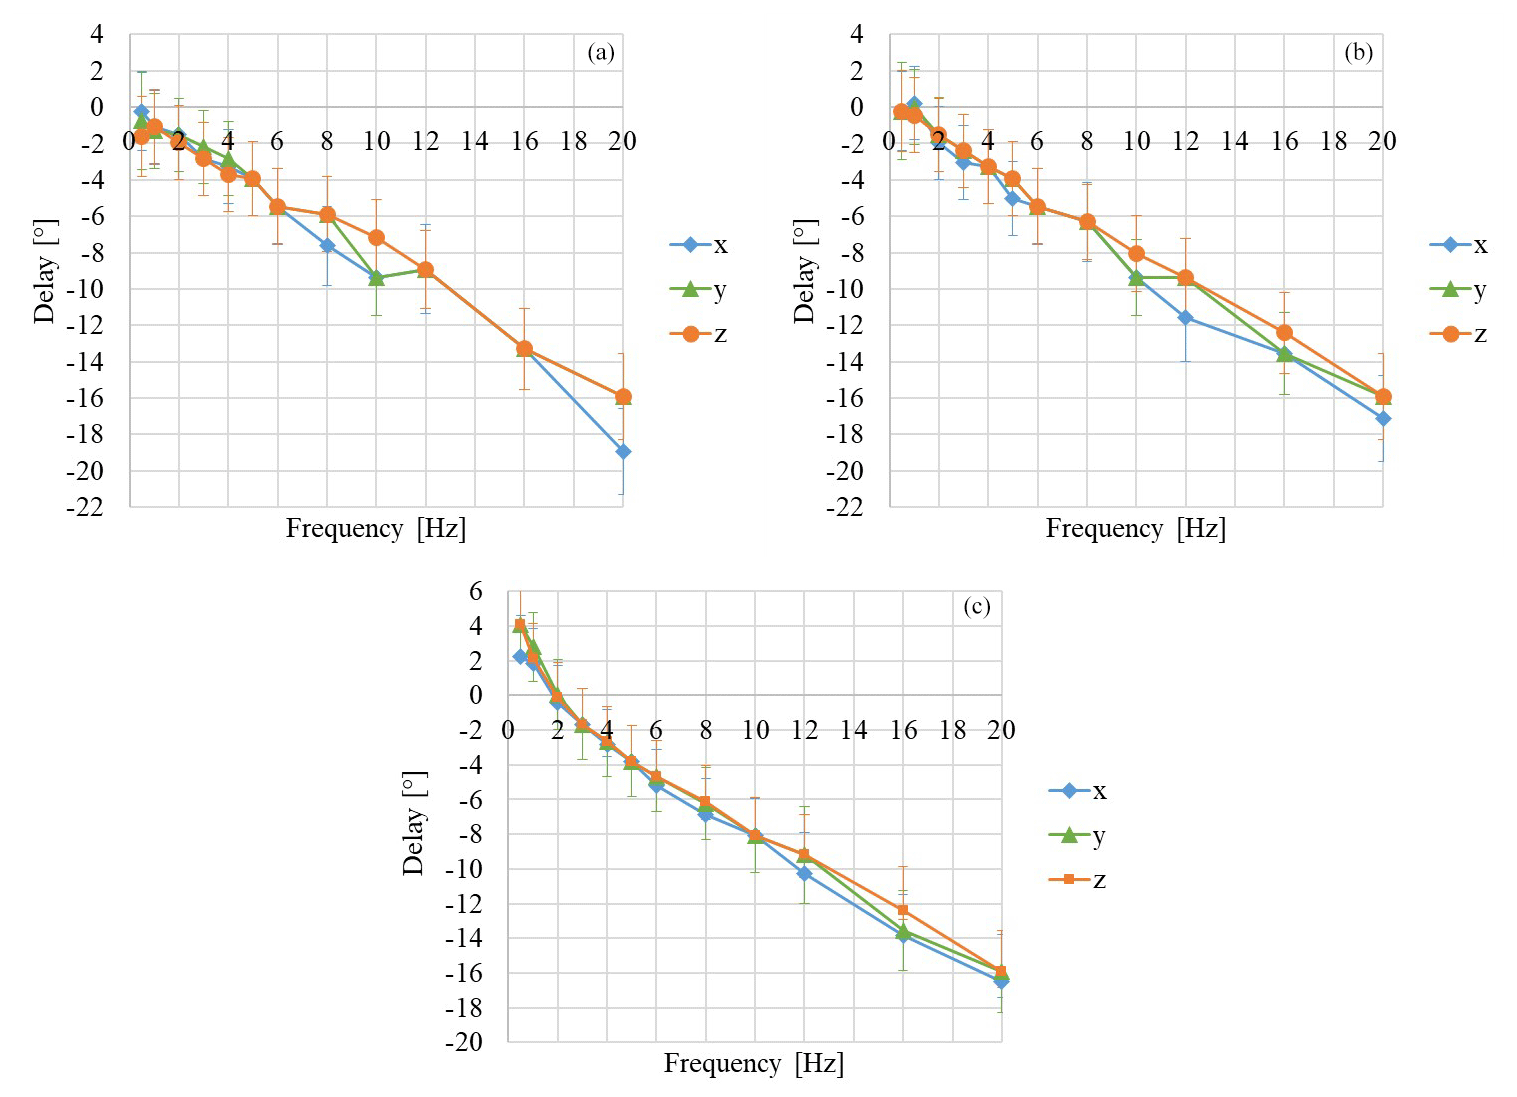
Figure 10Experimental delay for the MEMS capacitive accelerometer: (a) analog input module 9215; (b) module 9234, DC coupled mode; (c) module 9234, AC coupled mode.
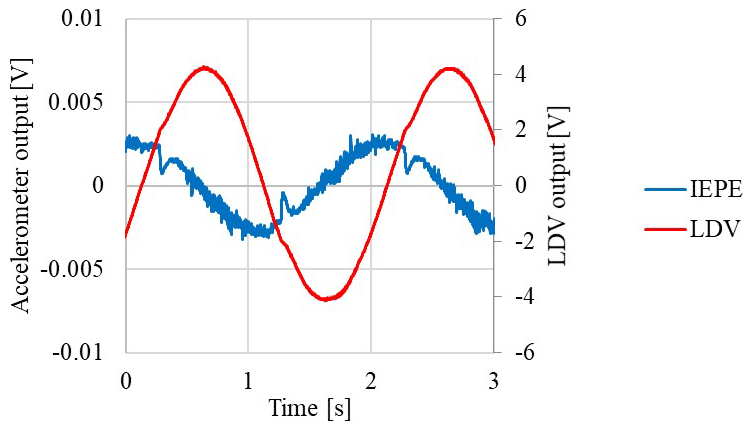
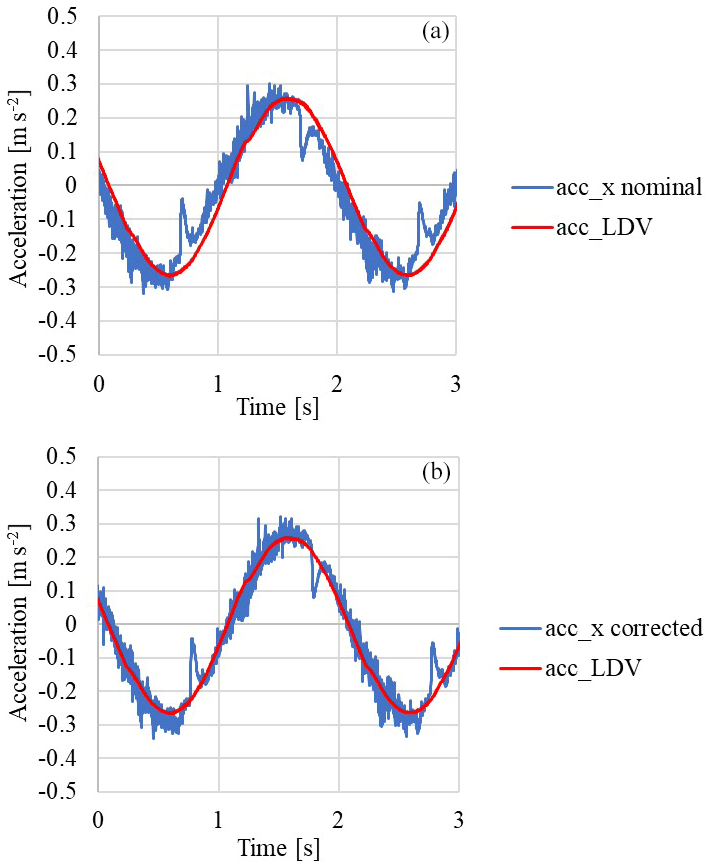
Figure 12Comparison between the reference acceleration from the LDV (acc_LDV), and the acceleration from the IEPE accelerometer (a) using the nominal sensitivity (acc_x nominal) and (b) corrected in phase and amplitude by means of the calibration (acc_x corrected).
The results are consistent with those obtained by a calibration bench of the National Institute of Metrological Research (INRiM), Italy, when processed for phase shift evaluation (D'Emilia et al., 2018a, b).
If the capacitive sensor is in coupled DC mode, the differences with respect to 2 Hz remain within ±3 % for both an analog input module and an IEPE module (Fig. 8a–b).
If acquired in AC coupled mode (Fig. 8c), the sensitivities decrease by 6 % compared to the values obtained at 2 Hz, when the frequency is reduced to 0.5 Hz.
3.3 Phase evaluation
In the following results, it should be noticed that when the AC coupling is realized on both channels (reference LDV and accelerometer being tested) the effect of AC coupling is compensated for.
The results are similar, for both the IEPE accelerometers considered. The phase difference with respect to the reference rapidly increases for frequencies < 2 Hz (Fig. 9).
The results are consistent with those obtained by a calibration bench of the INRiM, when processed for phase shift evaluation (D'Emilia et al., 2018a, b).
If the capacitive sensor is in coupled DC mode, the differences with respect to LDV are in the range ±4∘ up to 5 Hz for all configurations (Fig. 10a–c).
It must be considered that the tested MEMS is a very good quality one. It would be interesting to examine the behaviour of other types of MEMS accelerometers, in particular the very low-cost ones.
A final remark refers to the use of the finddelay function for phase shift evaluation. Comparison between finddelay and cross-spectrum indications show very good agreement in the whole frequency range examined, being differences less than 1∘. It has to be pointed out that the accuracy of finddelay approach is reduced at higher frequency, due to the resolution effect, while frequency resolution is a problem for cross-spectra at lower frequencies.
3.4 Evaluation of the calibration results
The results of calibration, in terms of sensitivity and phase, have been applied to correct the accelerometer signals obtained in independent experiments, in order to test them.
As an example, Fig. 11 shows voltage raw data from the IEPE accelerometer and from the LDV in a test at 0.5 Hz. Experimental delay of the accelerometer has been evaluated, by considering the reference acceleration as a derivative of the velocity signal from the LDV, shifted in advance by a quarter of period with respect to the velocity output itself.
Figure 12a shows the acceleration signal obtained from the LDV output, acc_LDV, and the acceleration signal from the IEPE accelerometer, considering the nominal sensitivity, acc_x nominal and neglecting any phase shift correction. According to the data of Figs. 8 and 9, the experimentally estimated sensitivity and a phase delay of 15∘ (time delay is 0.084 s) with respect to acc_LDV are applied to the accelerometer data, which are converted into acc_x corrected, as shown in Fig. 12b.
Figure 12b shows acc_x corrected, corrected in sensitivity and phase by means of the calibration results, overlapping the reference signal.
The root mean square (RMS) of the differences between accelerometer data and reference ones has been calculated during a period. When acc_x corrected and acc_LDV are considered, a reduction of about 25 % is obtained with respect to the case when acc_x nominal and acc_LDV are considered; this reduction means that only the unavoidable random variability of the sensor is still present. For better sensors, i.e. with reduced random error, the percentage improvement of calibration will be further increased.
A simple method to calibrate accelerometers in the low-frequency range has been presented, in order to get information on both amplitude and phase behaviour in the frequency range of interest (0 to 20 Hz).
The information describing the all of the measuring chains has been obtained by using a single set of tests, realized by mounting the accelerometer on an inclined plate, rotated on the clamp surface by a known angle.
Validation actions have been carried out at every stage of data processing, including the model assessment of the measuring chain, of the accelerometer and of the algorithms for both amplitude and phase shift calculation. The whole uncertainty of measurements has been also estimated, according to the uncertainty budget approach. The phase shift uncertainty is of the order of ±4∘; higher uncertainty occurs at frequency values less than 1 Hz.
Results show that different behaviours, not completely predictable, can occur, depending on the elements of the measurement chain and not only on the type of accelerometer.
In fact, the phase is a critical aspect to consider, which can strongly affect the evaluations in some applications, so a quantitative estimation could be useful.
The availability of a complete, simple and low-cost calibration method for tri-axial accelerometers, in particular of MEMS type, is expected to make a worthy contribution to the assessment of measurements of networks of low-cost accelerometers.
Data are not publicly accessible but they are available on request by directly contacting the corresponding author.
The authors declare that they have no conflict of interest.
This paper was edited by Qingquan Sun and reviewed by two anonymous referees.
Abir, J., Longo, S., Morantz, P., and Shore, P.: Optimized estimator for real-time dynamic displacement measurement using accelerometers, Mechatronics, 39, 1–11, https://doi.org/10.1016/j.mechatronics.2016.07.003, 2016.
Albarbar, A., Badri, A., Sinha, J. K., and Starr, A.: Performance evaluation of MEMS accelerometers, Measurement, 42, 790–795, https://doi.org/10.1016/j.measurement.2008.12.002, 2009.
Badri, A., Sinha, J. K., and Albarbar, A.: Badri, A., Sinha, J. K., and Albarbar, A.: A method to calibrate the measured responses by MEMS accelerometers, Strain, 47, 242–257, https://doi.org/10.1111/j.1475-1305.2010.00764.x, 2011.
Czech, K. R. and Gosk, W.: Measurement of surface vibration accelerations propagated in the environment, Procedia Eng., 189, 45–50, https://doi.org/10.1016/j.proeng.2017.05.008, 2017.
D'Emilia, G., Di Gasbarro, D., and Natale, E.: A simple and accurate solution based on a laser sheet system for on line position monitoring of welding, J. Phys. Conf. Ser., 658, 012006, https://doi.org/10.1088/1742-6596/658/1/012006, 2015.
D'Emilia, G., Di Gasbarro, D., Gaspari, A., and Natale, E.: Validation of signal processing techniques for vibration measurements, IMEKO 4th TC22 Int. Conf., Helsinki, 2017.
D'Emilia, G., Gaspari, A., Mazzoleni, F., Natale, E., and Schiavi, A.: Calibration of tri-axial MEMS accelerometers in the low-frequency range – Part 1: comparison among methods, J. Sens. Sens. Syst., 7, 245–257, https://doi.org/10.5194/jsss-7-245-2018, 2018a.
D'Emilia, G., Gaspari, A., Mazzoleni, F., Natale, E., and Schiavi, A.: Calibration of tri-axial MEMS accelerometers in the low-frequency range – Part 2: Uncertainty assessment, J. Sens. Sens. Syst., 7, 403–410, https://doi.org/10.5194/jsss-7-403-2018, 2018b.
Griffin, M. J.: 2014 Handbook of human vibration, St. Louis: Elsevier Science, 2014.
Kavitha, S., Daniel, R. J., and Sumangala, K.: Design and analysis of bulk micromachined piezoresistive MEMS accelerometer for concrete SHM applications, Sensors Transducers J., 144, 62–75, 2012.
Kavitha, S., Daniel, R. J., and Sumangala, K.: High performance MEMS accelerometers for concrete SHM applications and comparison with COTS accelerometers, Mech. Syst. Signal Pr., 66–67, 410–424, https://doi.org/10.1016/j.ymssp.2015.06.005, 2016.
Link, A., Täubner, A., Wabinski, W., Bruns, T., and Elster, C.: Calibration of accelerometers: determination of amplitude and phase response upon shock excitation, Meas. Sci. Technol., 17, 1888–1894, https://doi.org/10.1088/0957-0233/17/7/030, 2006.
Lu, Y. S., Hsuan-Wen, W., and Sheng-Hao, L.: An integrated accelerometer for dynamic motion systems, Measurement, 125 471–475, https://doi.org/10.1016/j.measurement.2018.05.019, 2018.
Pierleoni, P., Marzorati, S., Ladina, C., Raggiunto, S., Belli, A., Palma, L., Cattaneo, M., and Valenti, S.: Performance Evaluation of a Low-Cost Sensing Unit for Seismic Applications: Field Testing During Seismic Events of 2016–2017 in Central Italy, IEEE Sens. J., 18, 6644–6659, https://doi.org/10.1109/JSEN.2018.2850065, 2018.
Ripper, G. P., Ferreira, C. D., Dias, R. S., and Micheli, G. B.: Improvement of the primary low-frequency accelerometer calibration system at INMETRO, IMEKO 4th TC22 Int. Conf., Helsinki, 2017.
Sabato A., Niezrecki, C., and Fortino G.: Wireless MEMS-based accelerometer sensor boards for structural vibration monitoring: a review, IEEE Sens. J., 17, 226–35, https://doi.org/10.1109/JSEN.2016.2630008, 2017.
Son, J. D., Ahn, B. H., Ha, J. M., and Choi, B. K.: An availability of MEMS-based accelerometers and current sensors in machinery fault diagnosis, Measurement, 94, 680–691, https://doi.org/10.1016/j.measurement.2016.08.035, 2016.
Sun, H., Liang, Z., Yang, J., Zhang, D., and Li, H.: Both the phase shift and delay evaluation on FM electrical signal calibration of laser vibrometers, 13th Intl Conference on Vibration Measurements by Laser and Noncontact Techniques, Ancona, 2018.