the Creative Commons Attribution 4.0 License.
the Creative Commons Attribution 4.0 License.
 | 08 Jan 2019
Validation of three-component wind lidar sensor for traceable highly resolved wind vector measurements
Stefan Oertel
Michael Eggert
Christian Gutsmuths
Paul Wilhelm
Harald Müller
Helmut Többen
Conventional monostatic wind lidar (light detection and ranging) systems are well-established wind speed remote sensing devices in the field of wind energy that provide reliable measurement results for flat terrain and homogeneous wind fields. These conventional wind lidar systems use a common transmitting and receiving unit and become unacceptably inaccurate as the wind fields become increasingly inhomogeneous due to their spatial and temporal averaging procedure (large measurement volume) that is inherent to the monostatic measurement principle. The new three-component fiber laser-based wind lidar sensor developed by the Physikalisch-Technische Bundesanstalt (PTB) uses one transmitting unit (fiber laser) and three receiving units to measure the velocity vector of single aerosols in a spatially highly resolved measurement volume (with diameter d and length l) in heights from 5 m (d=300 µm, l=2 mm) to 250 m (d=14 mm, l=4 m) with a resolution of about 0.1 m s−1. Detailed comparison measurements with a 135 m high wind met mast and a conventional lidar system have proven that the high spatial and temporal resolution of the new, so-called bistatic lidar leads to a reduced measurement uncertainty compared to conventional lidar systems. Furthermore, the comparison demonstrates that the deviation between the bistatic lidar and the wind met mast lies well within the measurement uncertainty of the cup anemometers of the wind met mast for both homogeneous and inhomogeneous wind fields. At PTB, the aim is to use the bistatic wind lidar as a traceable reference standard to calibrate other remote sensing devices, necessitating an in-depth validation of the bistatic lidar system and its measurement uncertainty. To this end, a new, specially designed wind tunnel with a laser Doppler anemometer (LDA) as flow velocity reference has been erected on a platform at a height of 8 m; this allows the new wind lidar to be positioned below the wind tunnel test section to be validated for wind vector measurements that are traceable to the SI units. A first validation measurement within the wind tunnel test section is presented, showing a deviation between the bistatic lidar system and the LDA clearly below 0.1 %.
- Article
(5639 KB) - Full-text XML
- BibTeX
- EndNote


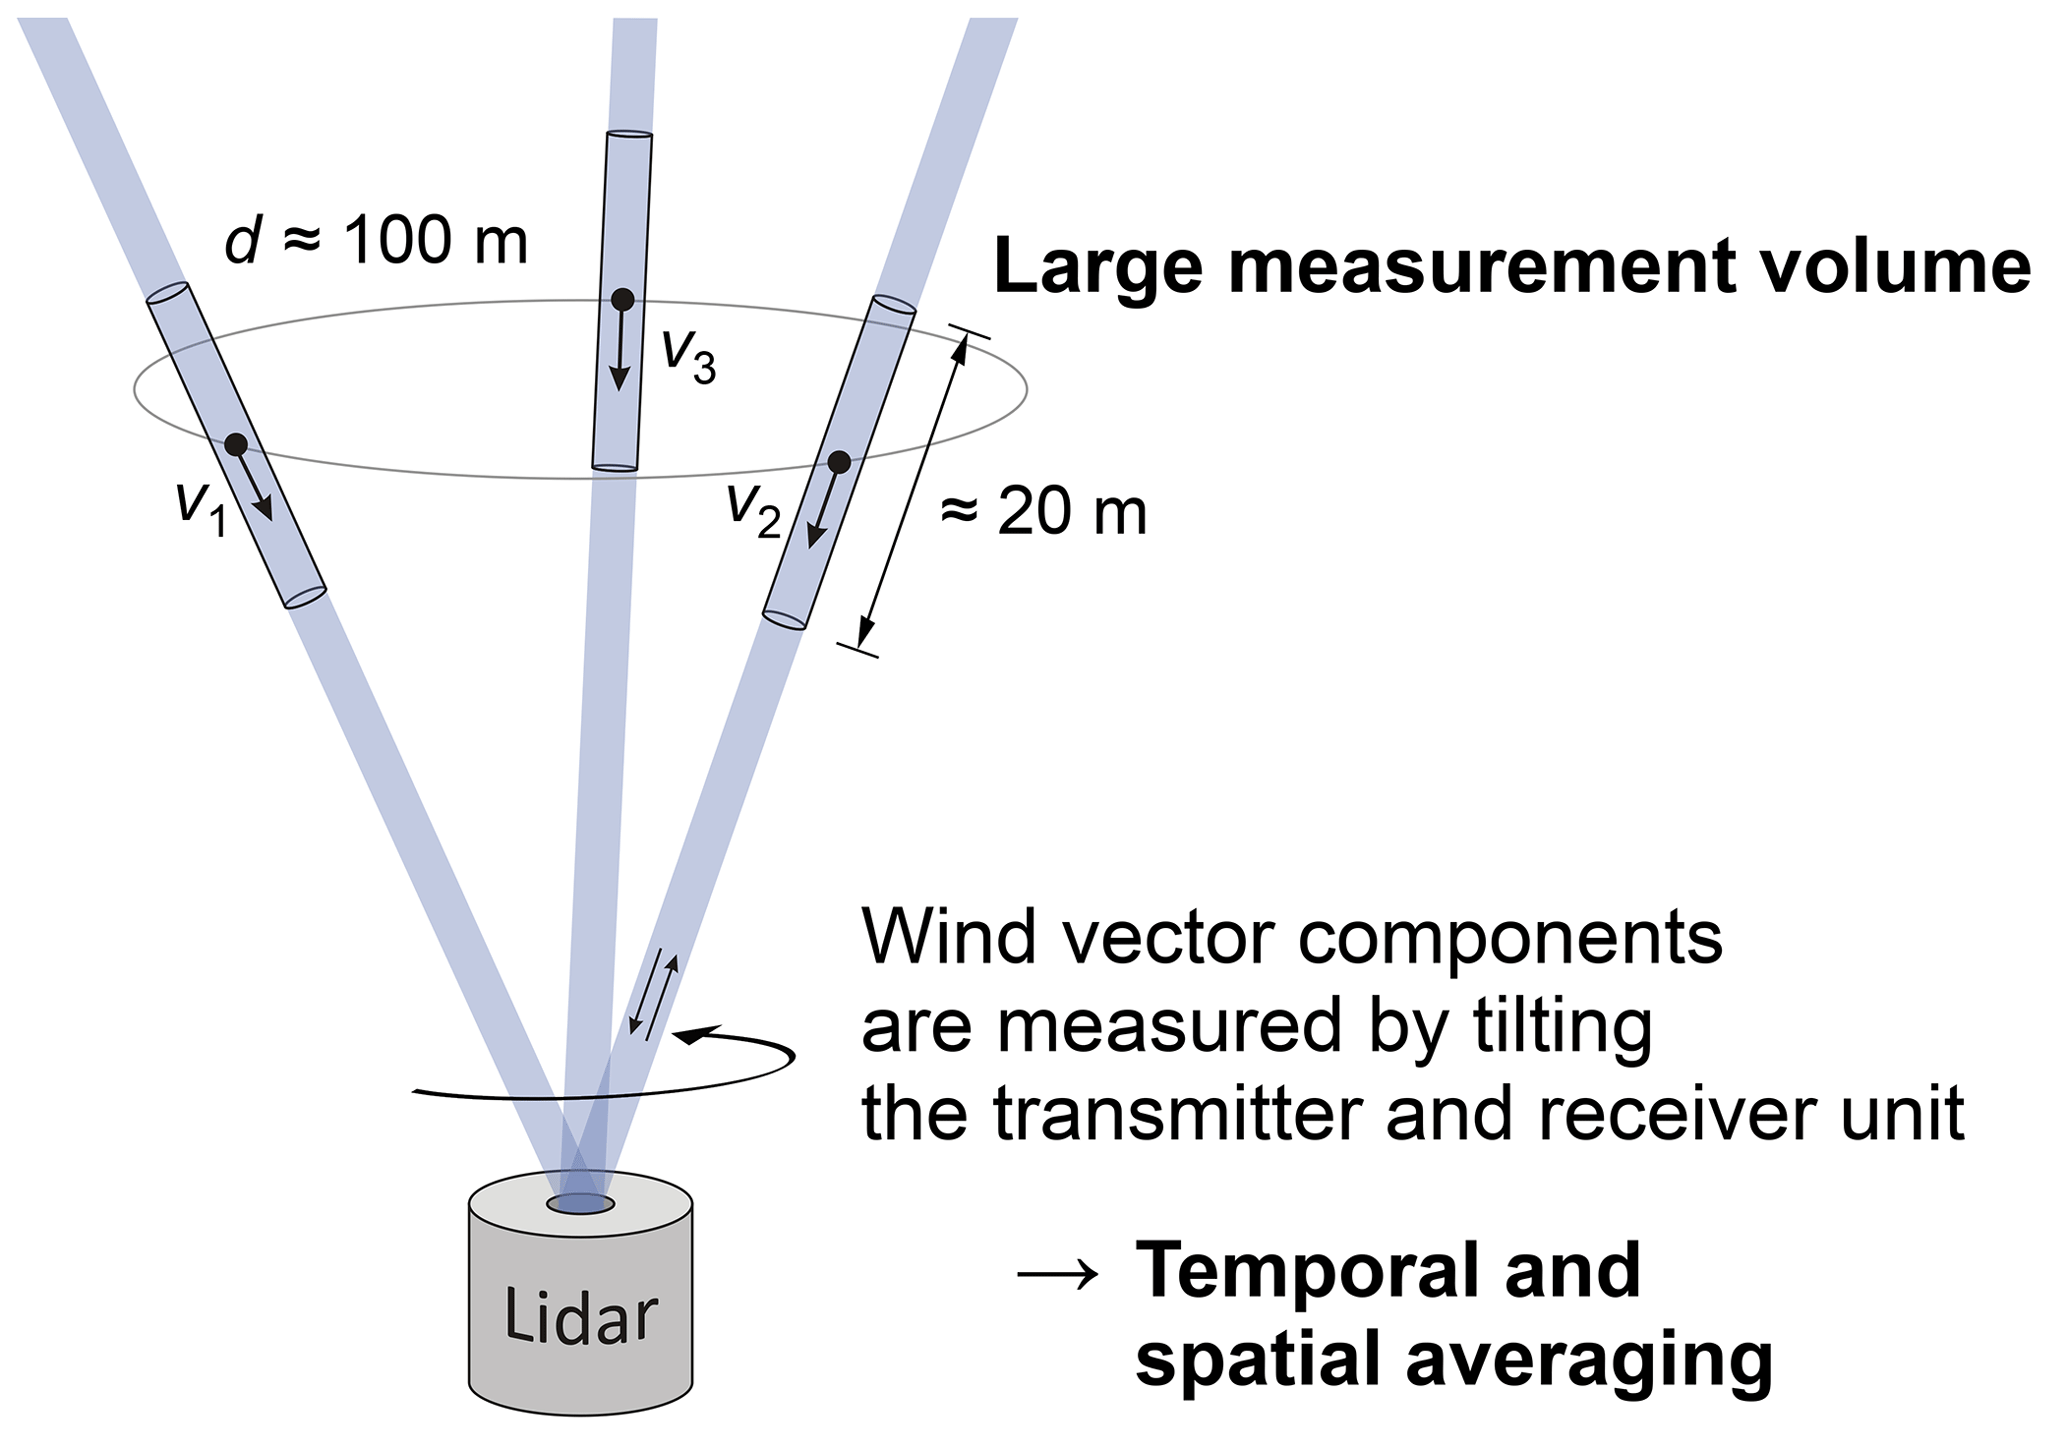
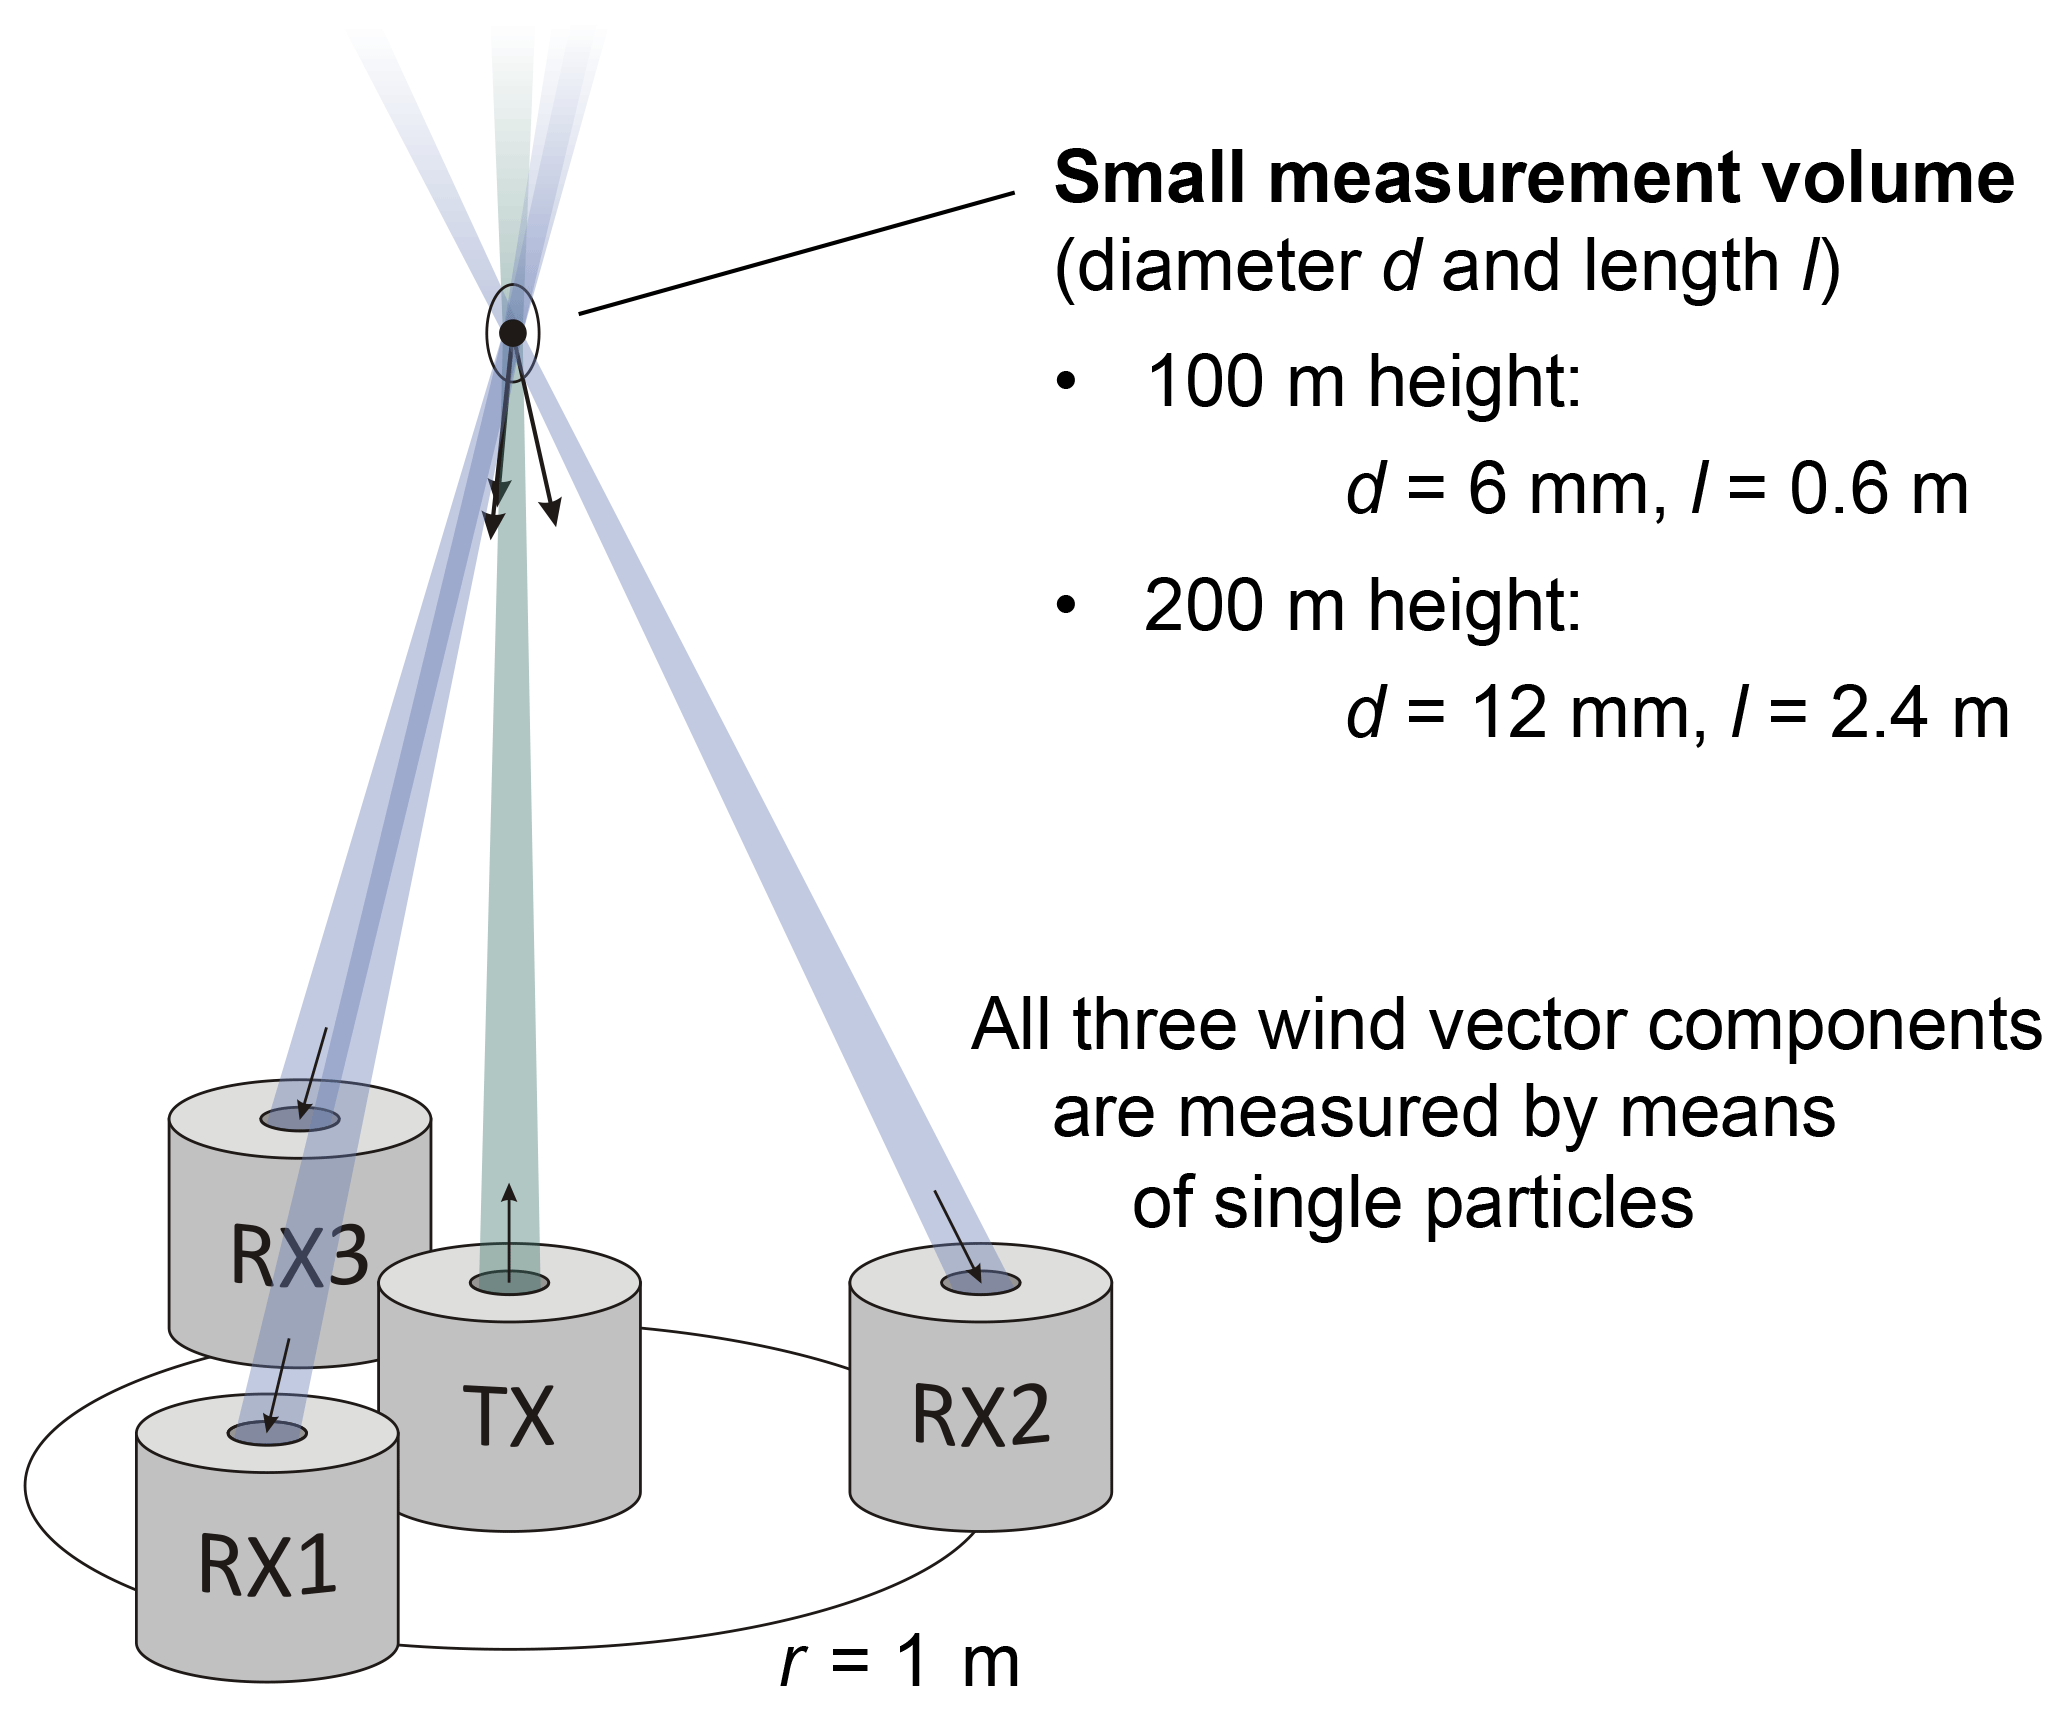
Figure 2Principle of the novel bistatic lidar consisting of one transmitting unit TX (green beam) and three receiving units RX (blue beams).
The accurate determination of the wind velocity vector is a key factor in the field of wind energy. For example, the site assessment of prospective wind farms requires an accurate wind potential analysis in which the wind velocity at the site is recorded for at least 1 year (MEASNET Procedure, 2016). As the power derived from the wind is proportional to the cube of the wind velocity, the measurement uncertainty of the wind speed measuring device used for the potential analysis strongly influences the reliability of the power output forecast of projected wind farms. Another example is the power curve evaluation of wind turbines. The shape of the wind shear profile across the complete rotor area of the wind turbine should be determined with highest accuracy, since it has an influence on the prediction of the energy production of the turbine (Scheurich et al., 2016). Therefore, preferably highly resolved wind vector measurements of the incoming flow across the entire rotor will be a contribution for a better prediction of the annual energy production of wind turbines.
Wind met masts with cup anemometers are at the moment the most precise wind speed measuring devices for traceable wind velocity measurements (IEC 61400 12-1, 2017). However, tall masts covering modern hub heights of more than 100 m are very expensive and will exceed mechanical and financial limits at future hub heights (Emeis et al., 2007). Ground-based wind speed remote sensing by means of acoustical or optical methods represents an alternative to overcome this disadvantage of tall masts.
The most widely used wind remote sensing devices are conventional monostatic wind lidar systems (Slinger and Harris, 2012) that were established in wind energy applications in the recent years (Albers et al., 2010). Such systems utilize a common transmitting and receiving beam that measures the wind velocity component in beam direction via a Doppler shift of the received scattering light from aerosols passing the transmitting laser beam (Drain, 1980). To measure the complete wind vector, the common beam is tilted in different directions (Fig. 1). Provided that the wind field is almost homogeneous within the measurement volume, these systems deliver reliable measurement results (Gottschall et al., 2012; Peña et al., 2009). However, leaving flat terrain and having to consider the inhomogeneous wind conditions that predominate on complex terrain, significant errors for the wind speed measured arise (Bradley, 2008) and can be on the order of 10 % (Bingöl et al., 2009). Thus, in the case of unidentified and complex wind fields, the reliability of monostatic lidar measurements becomes questionable without considering any other reference measurements. For instance, annex L of IEC 61400 12-1 specifies, in relation to wind turbine power curve testing, only deployments where a remote sensing device is monitored by a calibrated cup anemometer mounted on a wind met mast, and in case of power performance assessments, a limitation to flat terrain (IEC 61400 12-1, 2017).
Sophisticated methods and models are engaged to compensate for the measurement errors of monostatic lidar systems in complex terrain by means of assisting high-resolution numerical flow calculations. However, these methods are very costly and time consuming (Bradley et al., 2015). Another approach to determine the wind velocity in complex terrain with high precision using optical remote sensing is to combine multiple monostatic lidar systems that are focused to one point (Pauscher et al., 2016; Sørensen et al., 2018). With this multi-lidar technique higher accuracy can potentially be achieved, but the measurement setup is spacious, and the superposition of multiple lidar beams in one point is intricate.
In this article we present a novel three-component lidar system (Eggert et al., 2011, 2014; Gutsmuths et al., 2015) that is aimed at overcoming the present limitation to almost homogeneous wind fields given by the monostatic working principle. The basic idea of the novel system relies on utilizing a bistatic measurement setup (Harris et al., 2001), i.e., on the use of one transmitting laser beam and three detection beams (spatial separation), in order to determine the three components of the wind vector simultaneously in a small measurement volume by means of single aerosols (Fig. 2). After summarizing the setup in Sect. 2 detailed comparison measurements with a wind met mast and a conventional monostatic lidar system are presented in Sect. 3. As the bistatic lidar shall be used as a new traceable reference standard for other remote sensing devices in the future, a detailed analysis and validation of the bistatic lidar system is necessary. Therefore, a specially designed wind tunnel (Sect. 4) with a laser Doppler anemometer (LDA) as flow velocity reference was constructed that serves as test facility for the bistatic lidar system. A detailed characterization of the flow quality in the wind tunnel test section is presented in Sect. 4.1. Finally a first validation measurement of the bistatic lidar by means of the wind tunnel test facility is shown (Sect. 4.2), followed by a conclusion.
Similar to monostatic lidar systems, the bistatic system designed by the Physikalisch-Technische Bundesanstalt (PTB) comprises a narrow bandwidth (<1 kHz) master laser with a wavelength of 1550 nm, an acousto-optic modulator (AOM) for signal conditioning and a high-power (up to 30 W), erbium-doped fiber amplifier (EDFA) to generate the laser light transmission (Fig. 3a). However, in contrast to monostatic systems, which typically use a common transmitting and receiving unit and an optical circulator to separate the received scattering light, the bistatic system is based on one transmitter and three discrete, spatially separated receivers. The receivers are positioned at a radius of 1 m around the transmitter to ensure both sufficient particle-scattering light intensity (quasi-backward direction) and sufficient resolution for the determination of the horizontal velocity component. Three heterodyne receivers convert the particle scattering light (three receiving beams) after the generation of optical beat signals into three electrical signals by differential photodetectors (PD). The transmitter beam as well as the beams of the three receivers are focused into a small measuring volume by the use of motor-controlled lenses and mirrors (see Fig. 3b), forming Gaussian beams with a diameter of about 35 mm at the lenses and thereby centering the beam waists in the measuring volume. The resulting measuring volume is locally highly resolved and depends on the measuring distance. Typical measurement volume dimensions calculated according to Gaussian beam optics are shown in Fig. 2. An optical time-of-flight measurement and correlation techniques between the three detection channels are applied to ensure that wind vector measurements are based on the scattering light from the same particles in the selected measuring distance between 5 and 250 m. To ensure a mobile operation with stable working conditions in the field, especially with respect to requirements on the mechanical setup and the optoelectronics, the bistatic lidar system has been enclosed in a temperature-controlled housing unit mounted on a trailer (see Figs. 4 and 9).
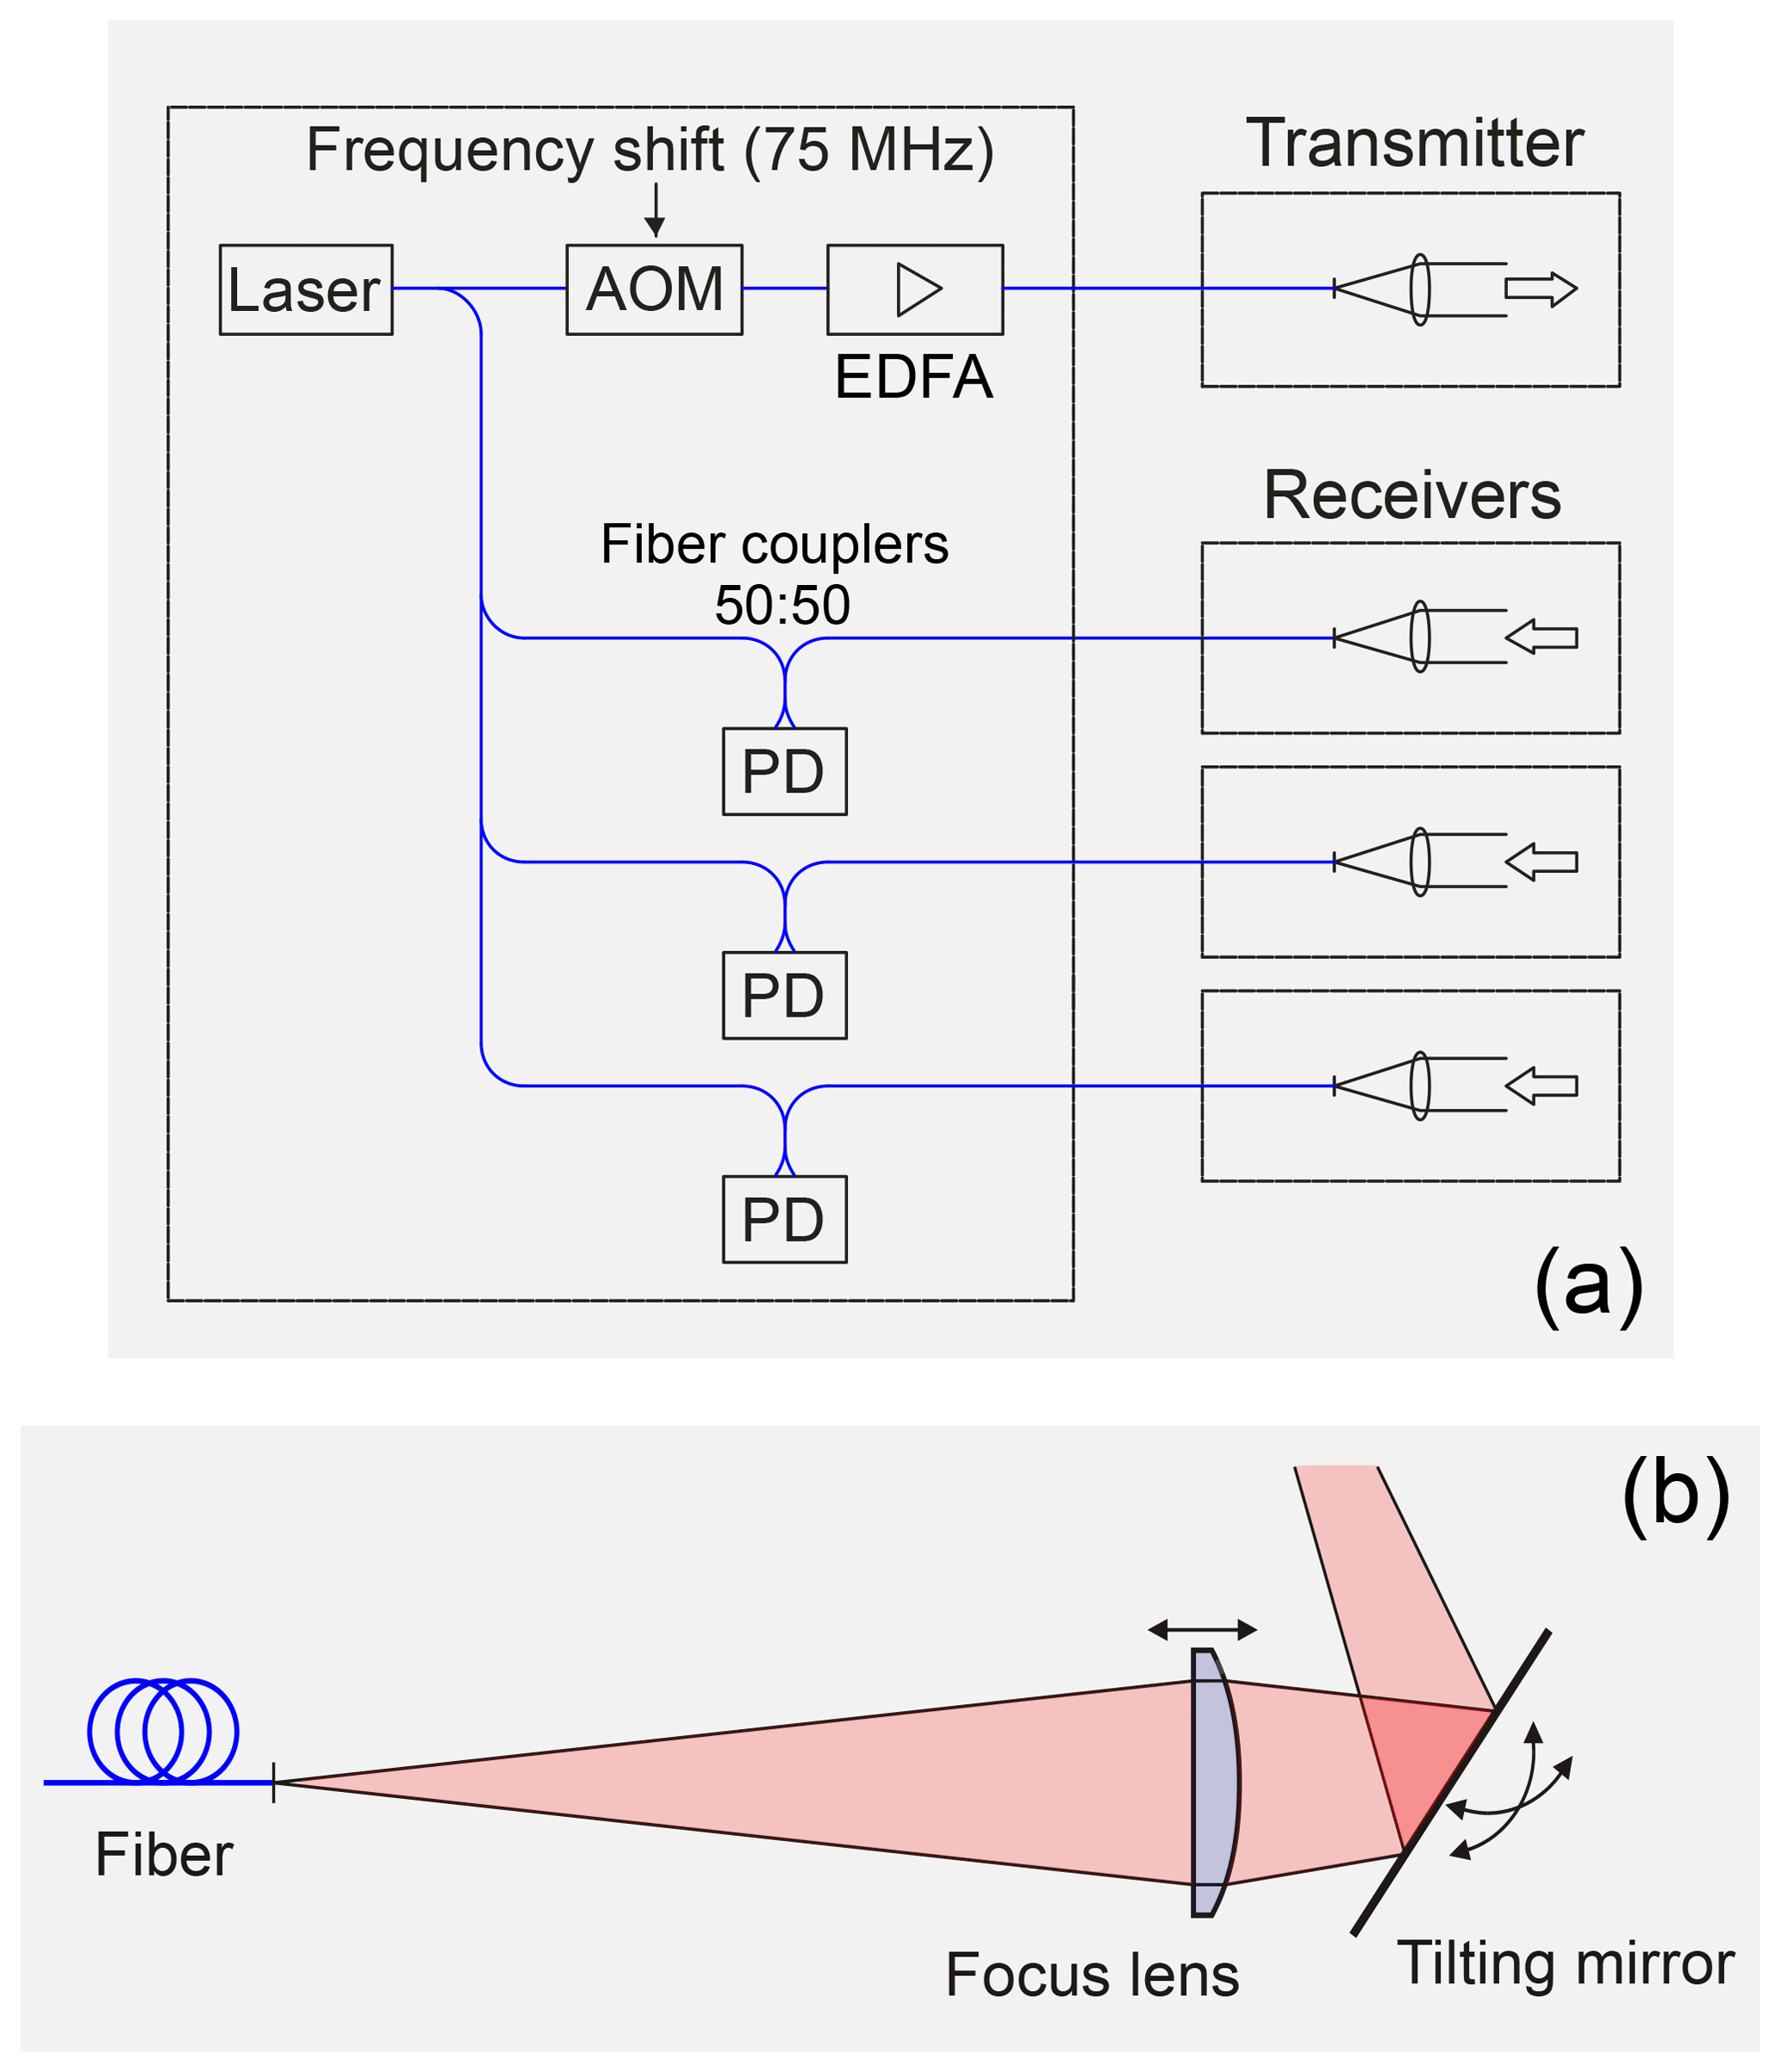
Figure 3(a) Block diagram of the bistatic lidar system. (b) Sketch of the transmitter and receiver optics. The arrows indicate the motor-controlled degrees of freedom.
The first validation tests of the bistatic PTB lidar system performed under real operation conditions took place in two comparison measurement campaigns that were compared to calibrated cup anemometers (Thies Clima – First Class Advanced) mounted on a 135 m high wind met mast located in the wind energy test field of Deutsche WindGuard Consulting GmbH in Aurich, Germany (Fig. 5). In the first measurement campaign, a comparison took place to a cup anemometer mounted on a met mast cantilever at a height of 100 m (Level 3 – 100 m). During the measurement time of this campaign, the cup anemometer and the lidar measurement volume were located in the wake of a wind turbine, due to the prevailing wind direction (disturbed wind conditions). A second campaign was carried out under undisturbed wind conditions with the met mast's top-mounted, single cup anemometer (Level 1 – 135 m); this constitutes the ideal configuration of the met mast to achieve the lowest possible flow distortion created by the met mast itself in wind speed measurements. Furthermore, during the second campaign, the wind speed was also recorded by a conventional monostatic wind lidar system (Windcube) located nearby.
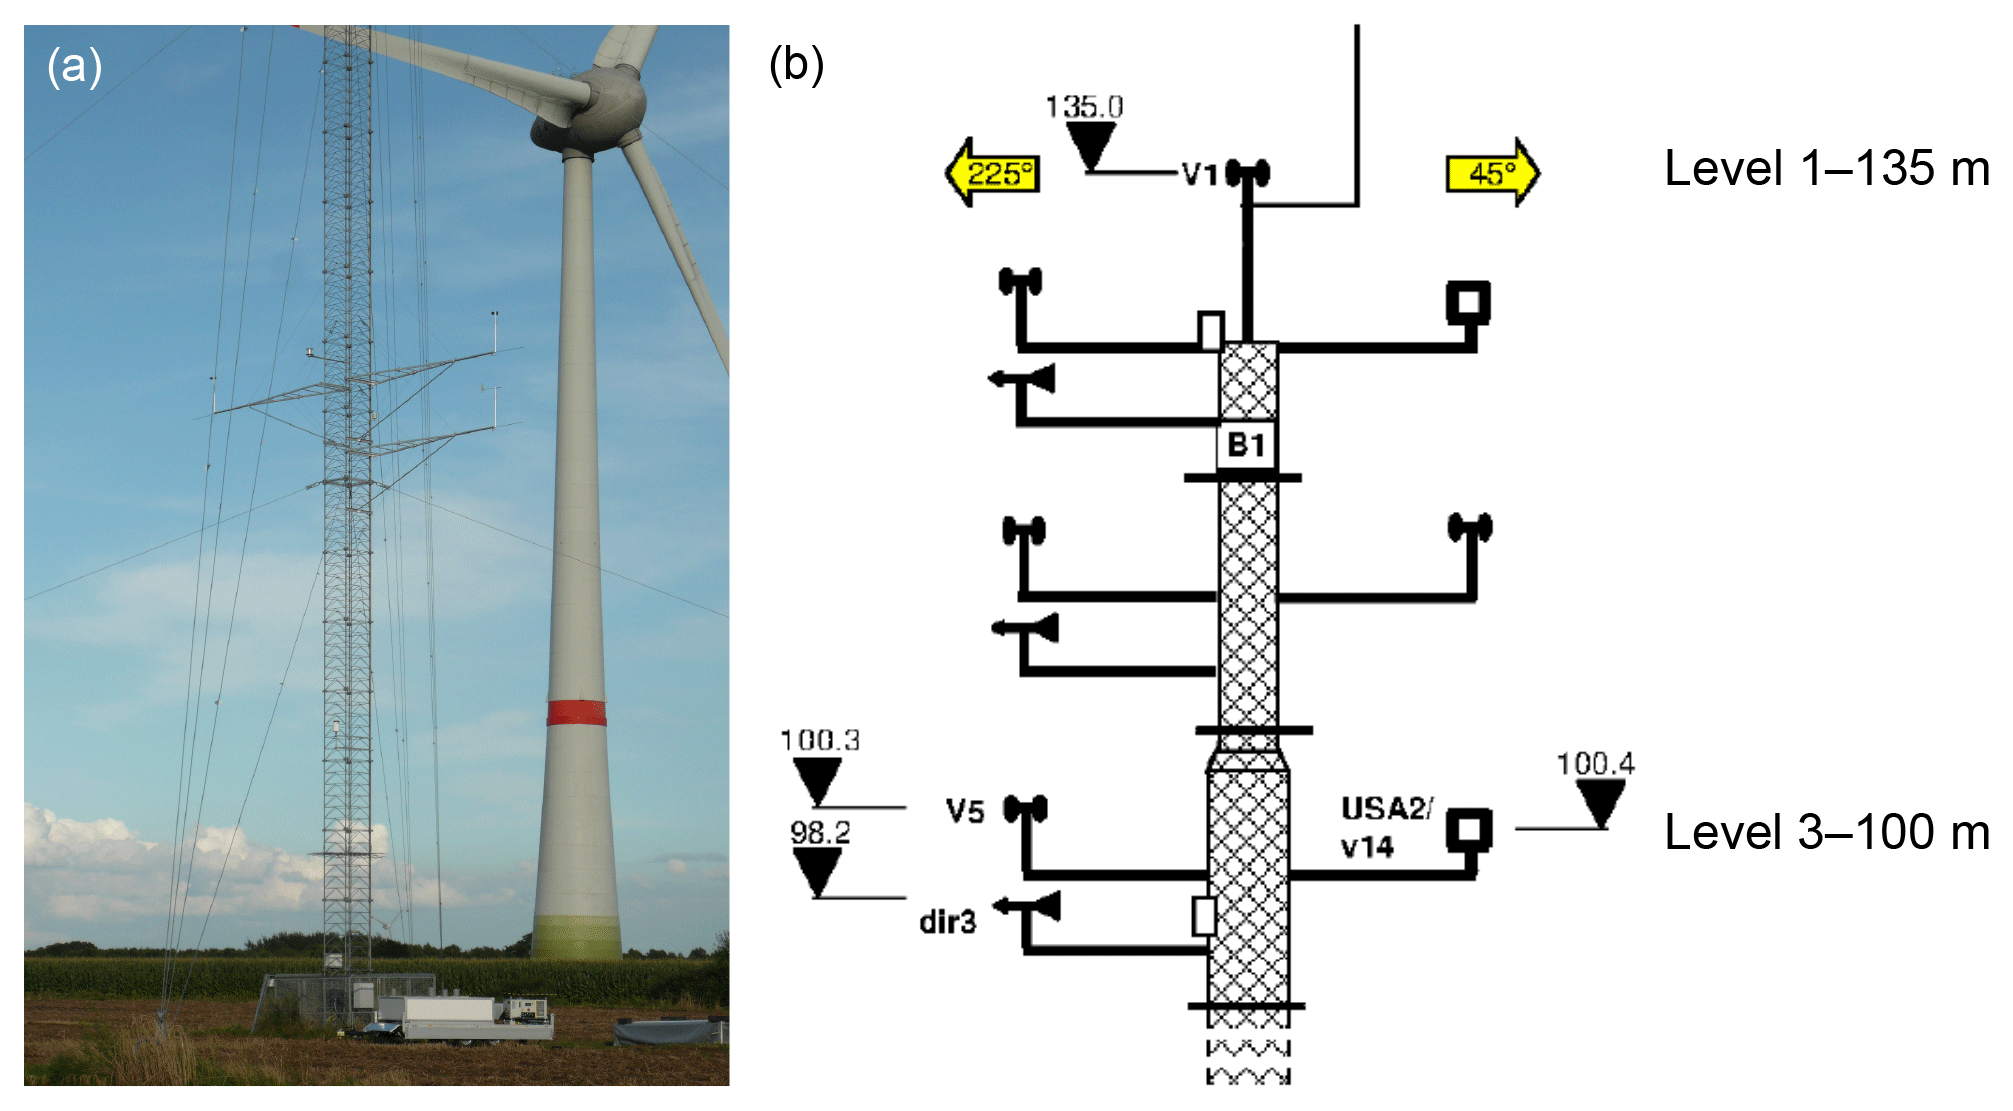
Figure 5(a) Wind energy test field in Aurich (Germany) with wind met mast, wind turbine and PTB lidar trailer. (b) Outline of the three upper measurement levels of the 135 m wind met mast.
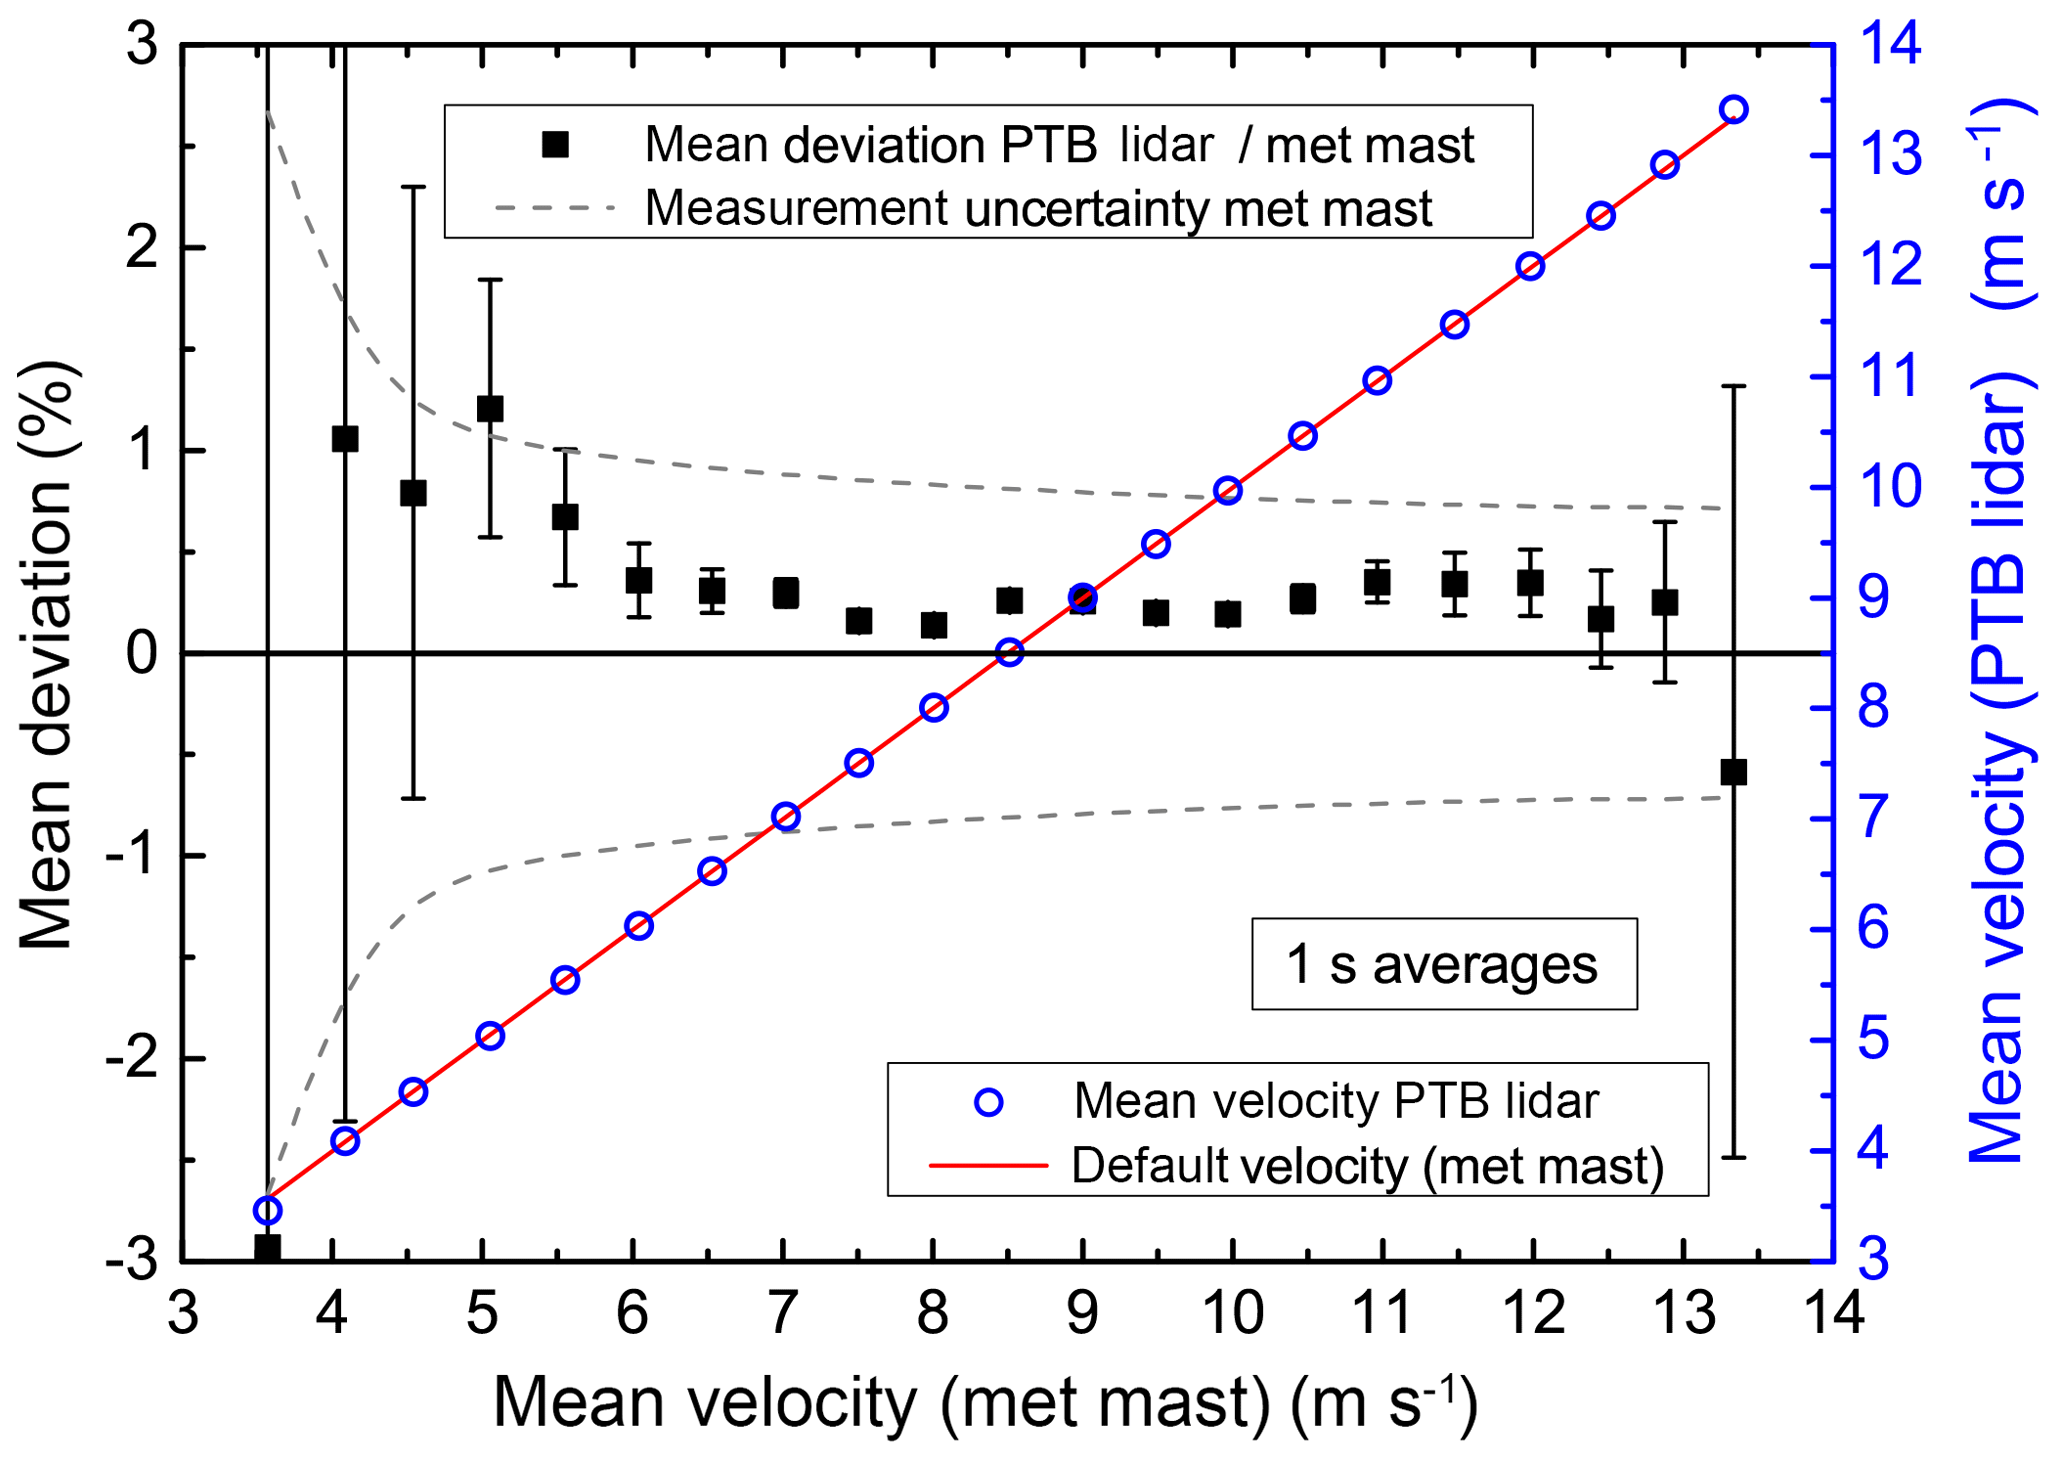
Figure 6Comparison of PTB lidar with wind met mast for undisturbed wind conditions (campaign 2).
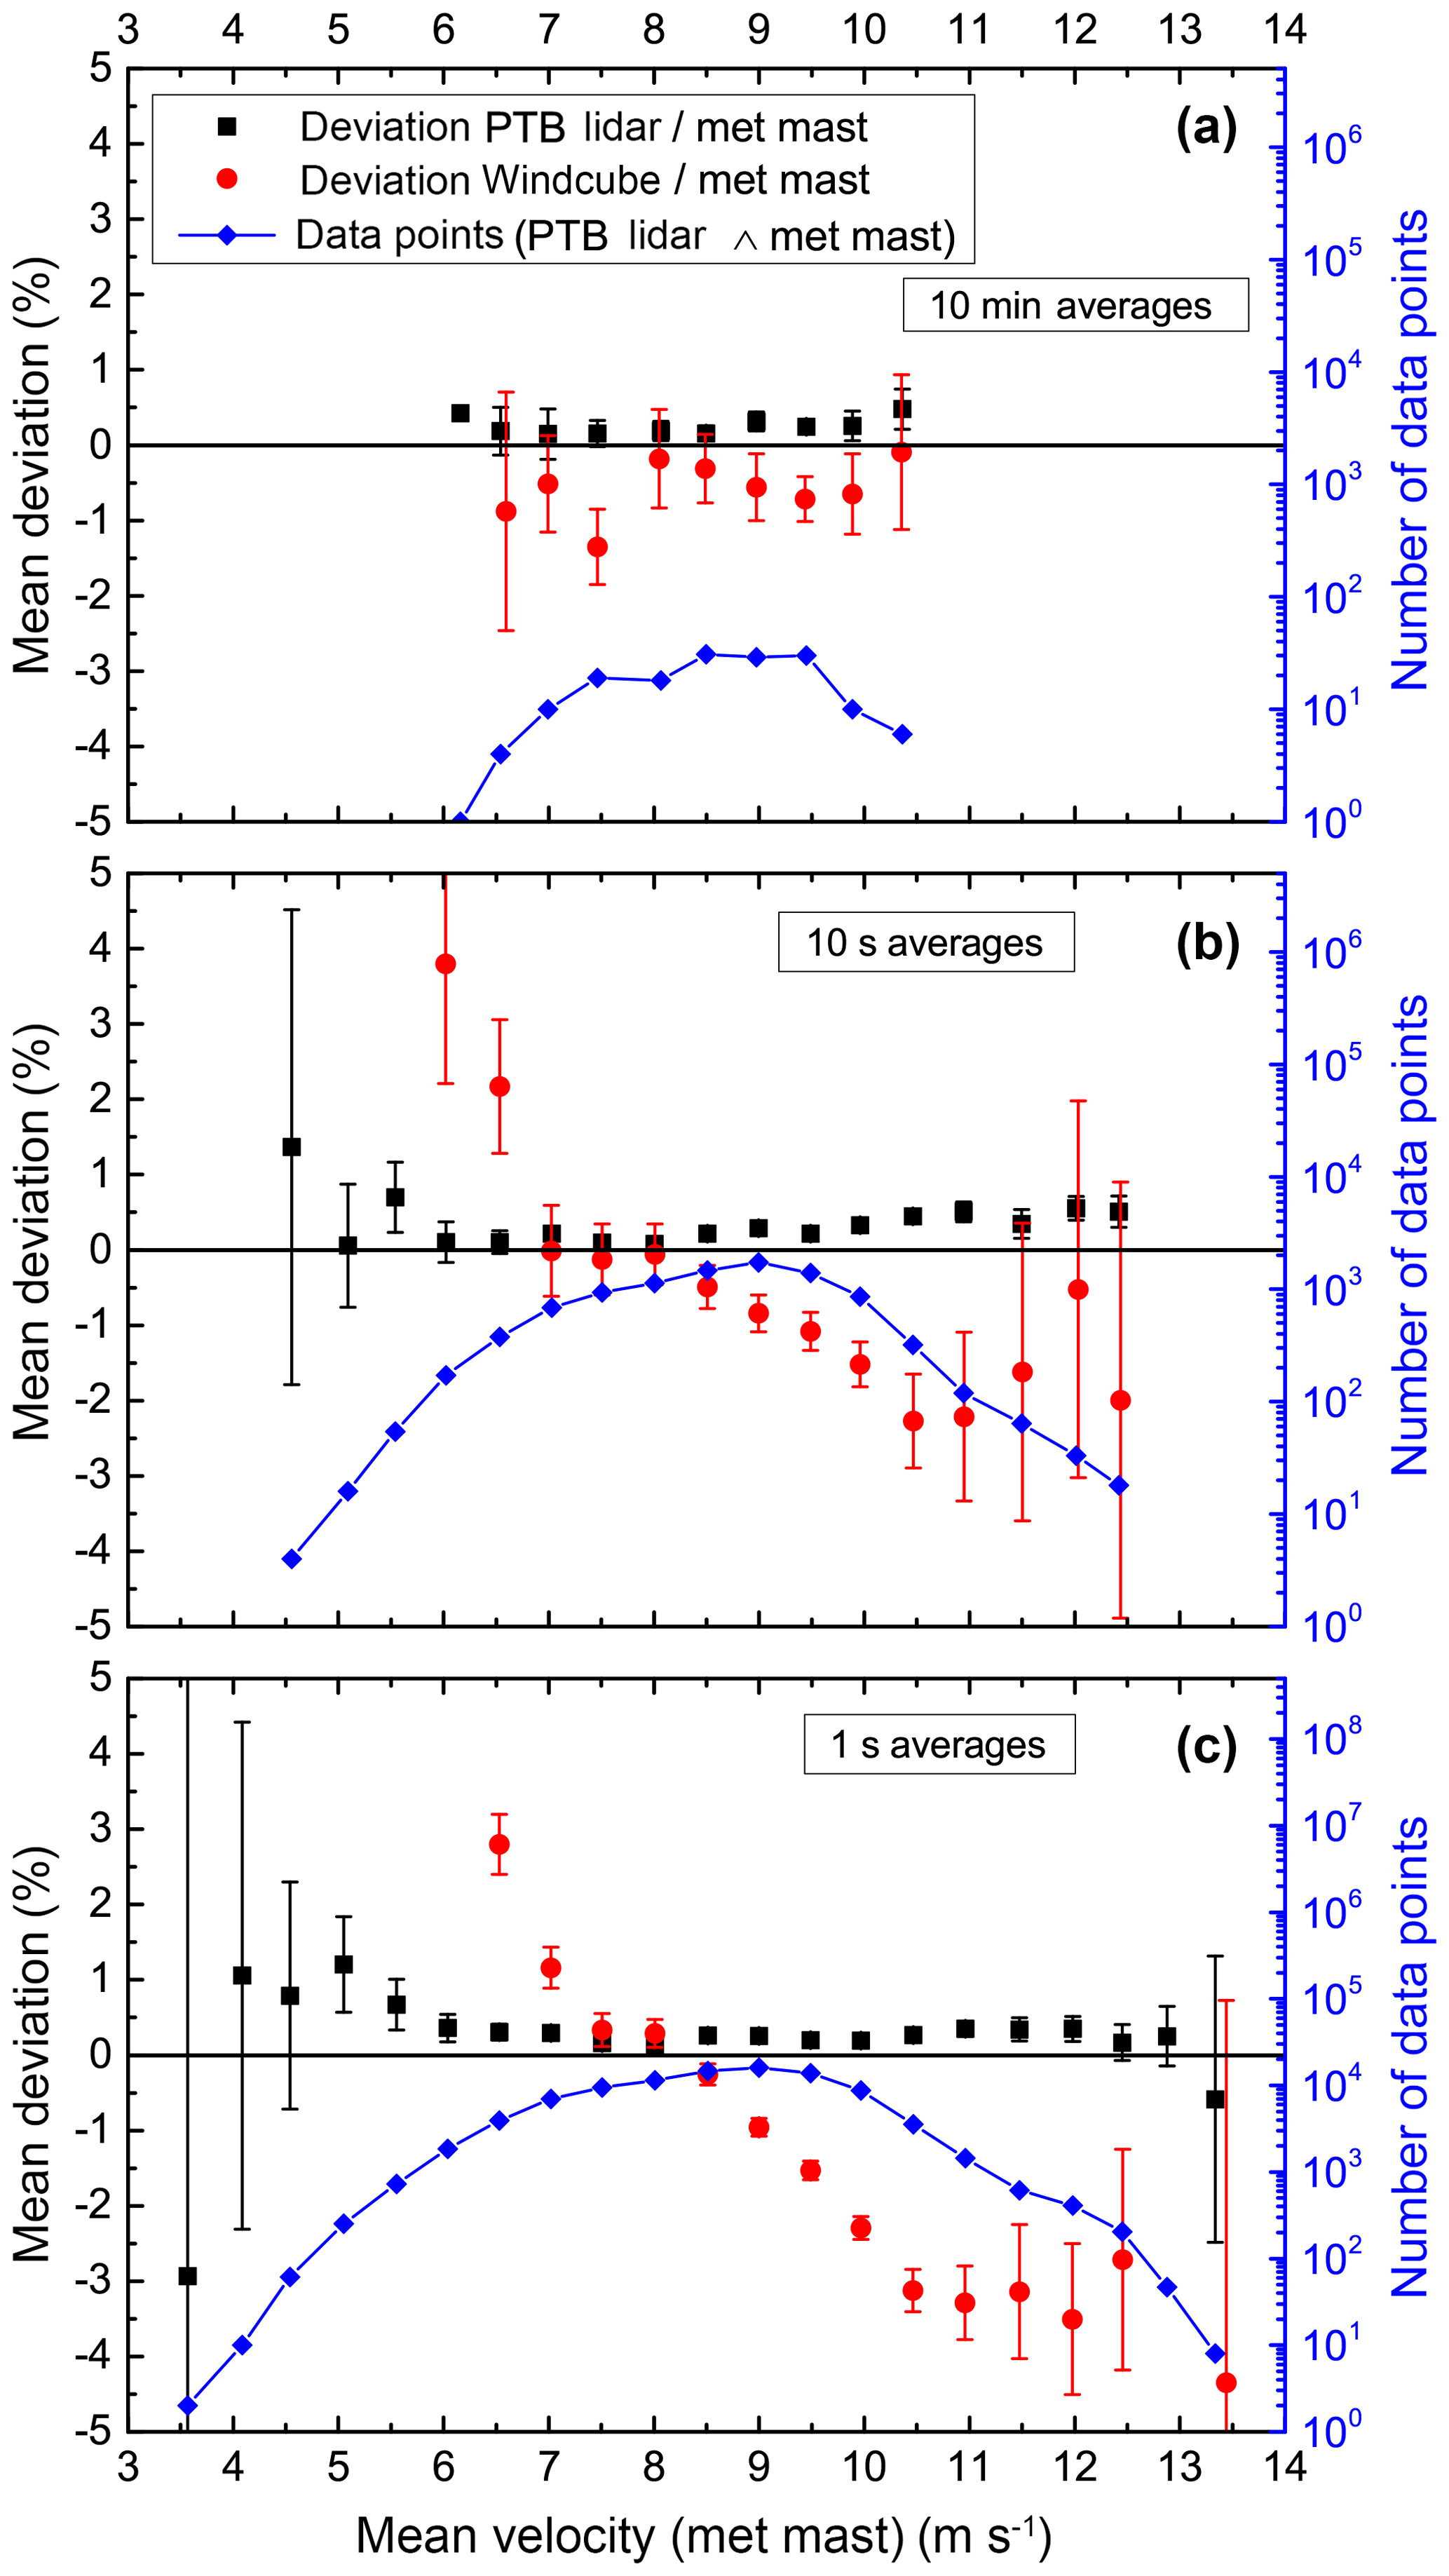
Figure 7Comparison of PTB lidar (black squares) and Windcube (red points) with decreasing temporal averaging (a)–(c) for undisturbed wind conditions (campaign 2). The blue diamonds are the number of data points of the PTB lidar (equivalent: the wind met mast) available in each velocity slot (the lines guide the eye).
For all measurements, the measurement volume of the PTB lidar was located as close as possible to the cup anemometers, i.e., at a distance of about 1 m for campaign 1 and 3 m for campaign 2, respectively, and the remaining local distance was considered in the data evaluation by correlating the time-resolved and synchronized wind speed data. The data were evaluated according to the standard specification IEC 61400-12-1, with the calibrated cup anemometers of the met mast used as a reference. For comparison and analysis of the data, the raw data were averaged over different time intervals (for example, 10 min). The mean velocities derived were later classified in 0.5 m s−1 segments according to the reference and compared within these segments.
Figure 6 shows the comparison of the wind speed data (blue circles) of the PTB lidar with that of the top-mounted met mast cup anemometer (red line) for campaign 2, measured over a period of 28 h with time averages of 1 s, i.e., high temporal resolution. The deviation of both datasets (black squares) in the velocity range from 6 to 13 m s−1 is less than 0.5 % and lies well within the calibration uncertainty of the met mast cup anemometer (grey dashed line), thus revealing the very promising first validation result of the novel bistatic lidar system.
Again using the met mast as a reference, the contrast between the PTB lidar and the conventional lidar (Windcube), with dependence on temporal averaging, is depicted in Fig. 7a–c (campaign 2, undisturbed wind conditions). For long temporal averages (10 min in Fig. 7a), the deviation of both the bistatic lidar system and the monostatic lidar system provides reliable measurement results, whereas the deviation of the PTB lidar (0.5 %) is less than the deviation of the Windcube (1 %). However, with decreasing averaging time, the discrepancy of the monostatic Windcube compared to the met mast increases (Fig. 7b–c) and reaches a deviation of 3 % to 4 % for velocities above 10.5 m s−1 for an averaging time of 1 s (Fig. 7c). By contrast, the deviation of the PTB lidar – independently of the averaging time for all velocity bins where sufficient data points were available – lies below 0.5 % and is thus within the measurement uncertainty of the met mast. This result illustrates the fact that, even in undisturbed wind fields, normal wind gusts lead to significant discrepancies of the wind velocities measured by the conventional lidar system due to the high spatial and temporal averaging of the monostatic measurement principle.
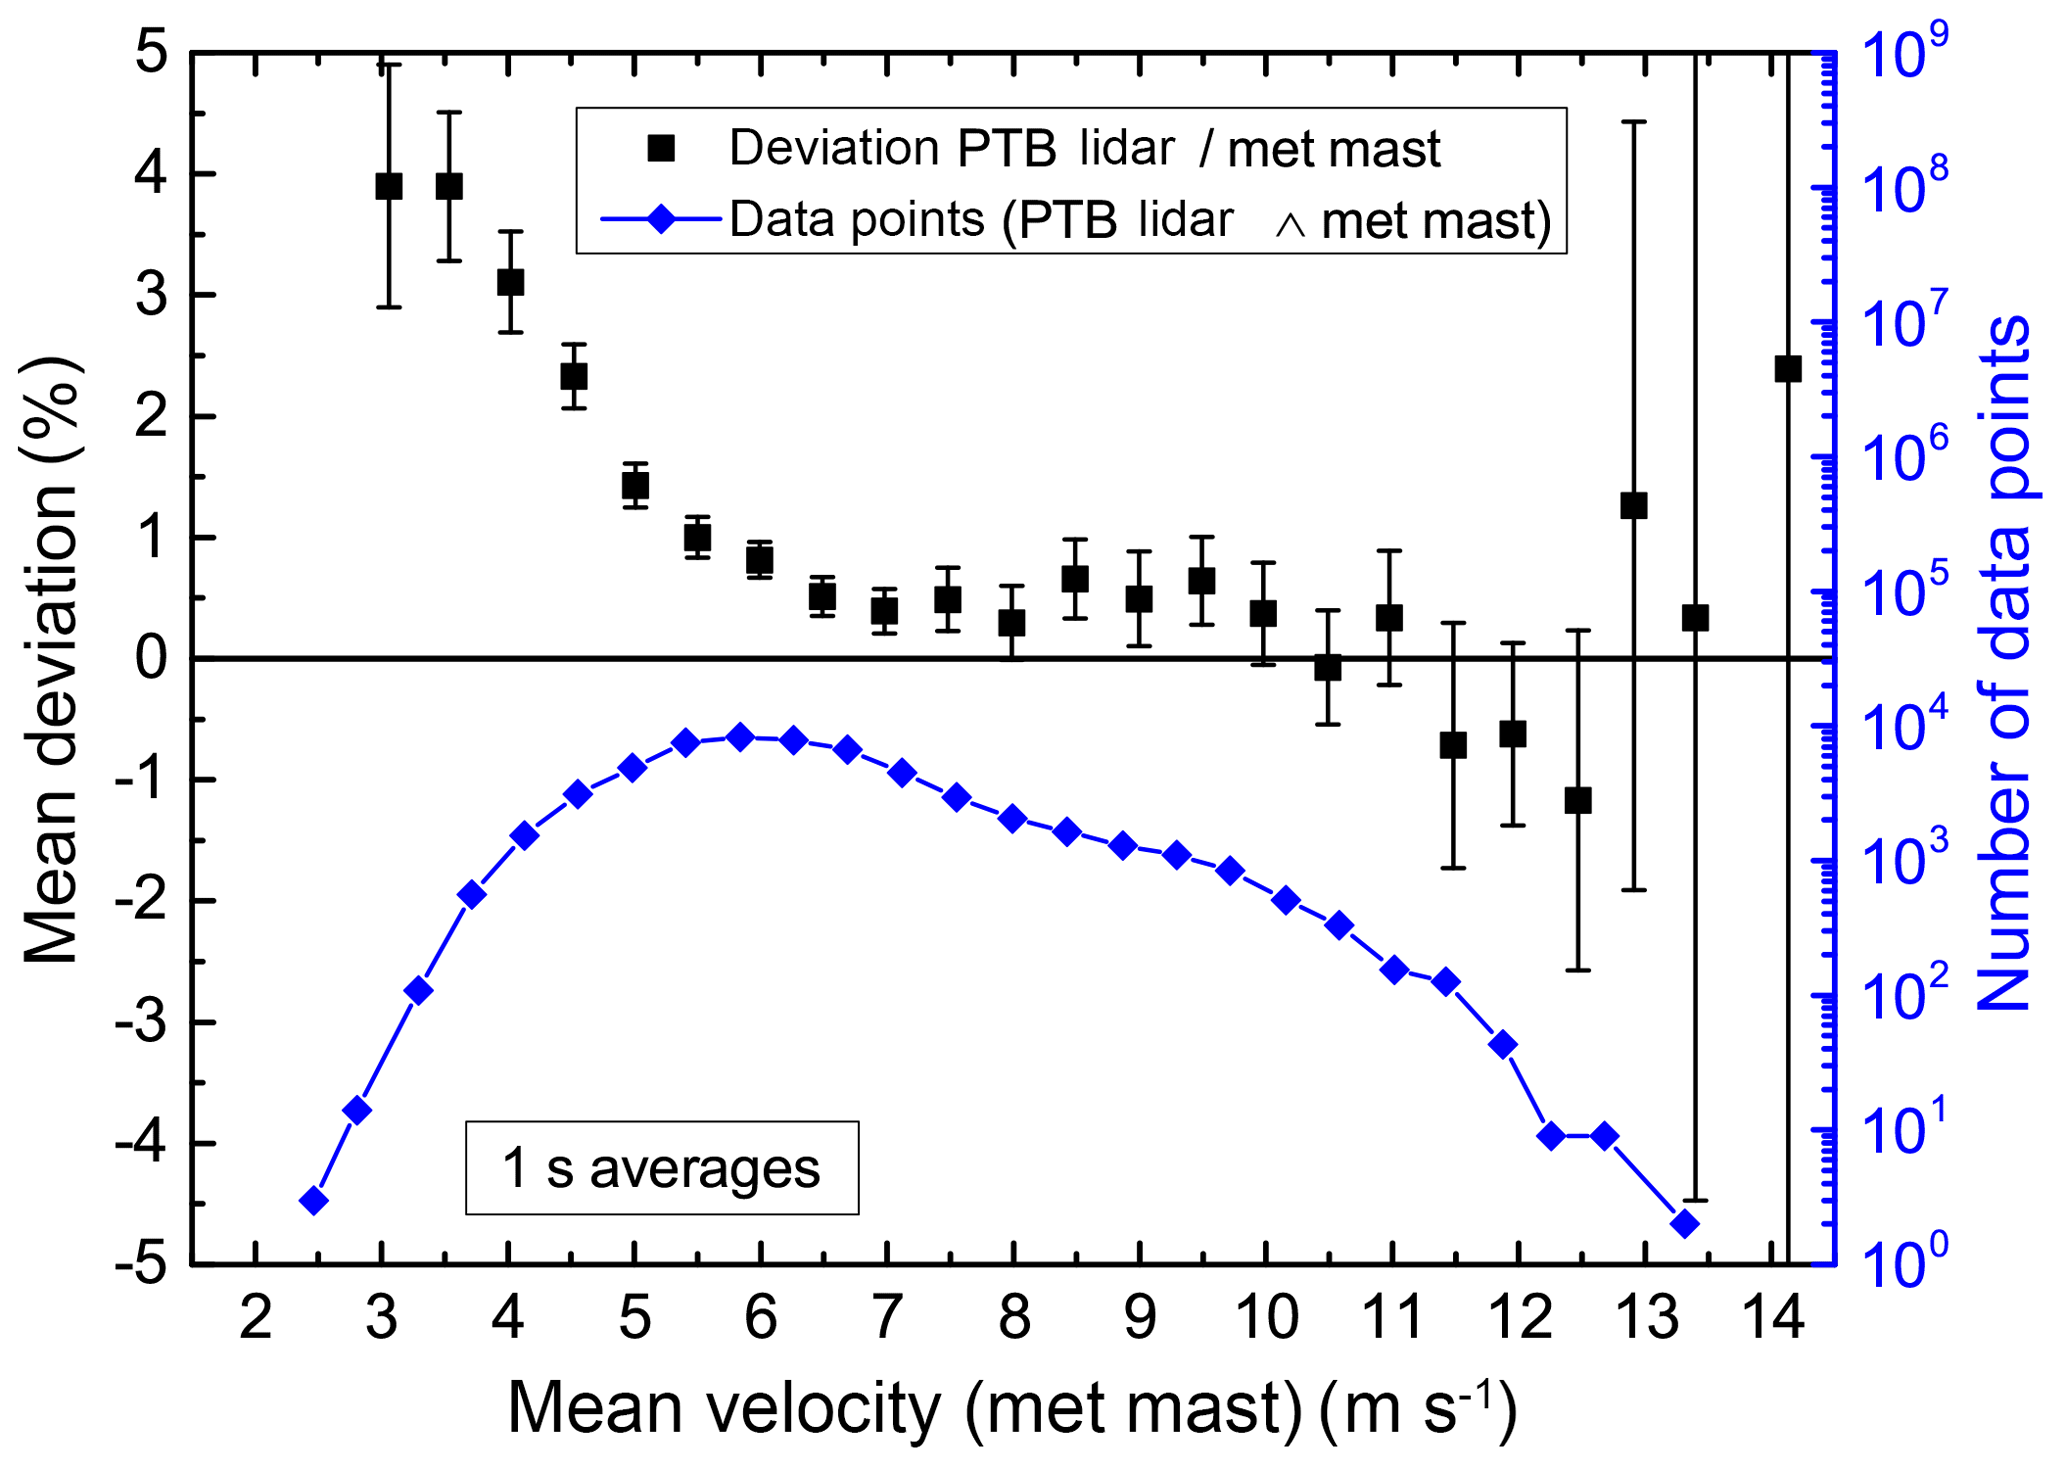
Figure 8Comparison of PTB lidar with wind met mast for disturbed wind conditions (campaign 1).
Finally, Fig. 8 shows the comparison of the PTB lidar with the met mast for the disturbed wind field of campaign 1 (1 s averages) over a measurement period of 16 h. The deviation of the measured wind velocities is below 1 % over a wide range and represents a consistent result, considering the disturbed wind conditions due to the influence of the wind turbine. The extent of this influence on the flow conditions can be estimated by the vertical velocity component measured by the PTB lidar, which has a standard deviation of 7 m s−1, compared to the standard deviation of 0.33 m s−1 in the undisturbed wind field.
The first validation tests of the bistatic PTB lidar on the wind energy test field show that the deviation of the measured wind speeds are within the measurement uncertainty of the calibrated cup anemometers of the met mast (i.e., the reference). A more detailed analysis and investigation of the bistatic PTB lidar, its impact factors and its accuracy limits demands controllable and well-defined flow fields with a precise flow velocity reference traceable to the SI units. For this reason, a specially designed wind tunnel from Deutsche WindGuard Wind Tunnel Services GmbH was erected on a platform at a height of 8 m in the metrological Competence Center for Wind Energy (CCW) at PTB; this allows the bistatic lidar to be positioned below the test section of the wind tunnel (Fig. 9). The wind tunnel has an open test section 0.75 m in length with a cross-sectional area of 0.5 m×0.5 m and a flow velocity range of 1 to 30 m s−1. Due to a given position of the test section on the platform and the dimensions of the platform, special care had to be taken when designing the wind tunnel to achieve a high homogeneity and a low turbulence level (<0.5 %) of the flow field. A stagnation chamber consisting of one honeycomb and seven screens and a contraction ratio of 1:5.7 accomplish the high flow quality necessary for traceable wind speed measurements. An LDA 1-D fp50-unshift from Intelligent Laser Applications (ILA) R&D GmbH with a measurement uncertainty of 0.18 %, with the type being identical to an LDA used as transfer standard in the CIPM key comparison of air speed CCM.FF-K3.2011 (Müller et al., 2017), serves as a reference standard for the flow velocity within the wind tunnel test section.
The new wind tunnel test facility will be used to analyze and validate the bistatic lidar in detail, with the objective of deploying the bistatic lidar in the future as a new reference standard for wind remote sensing devices with reduced measurement uncertainty.
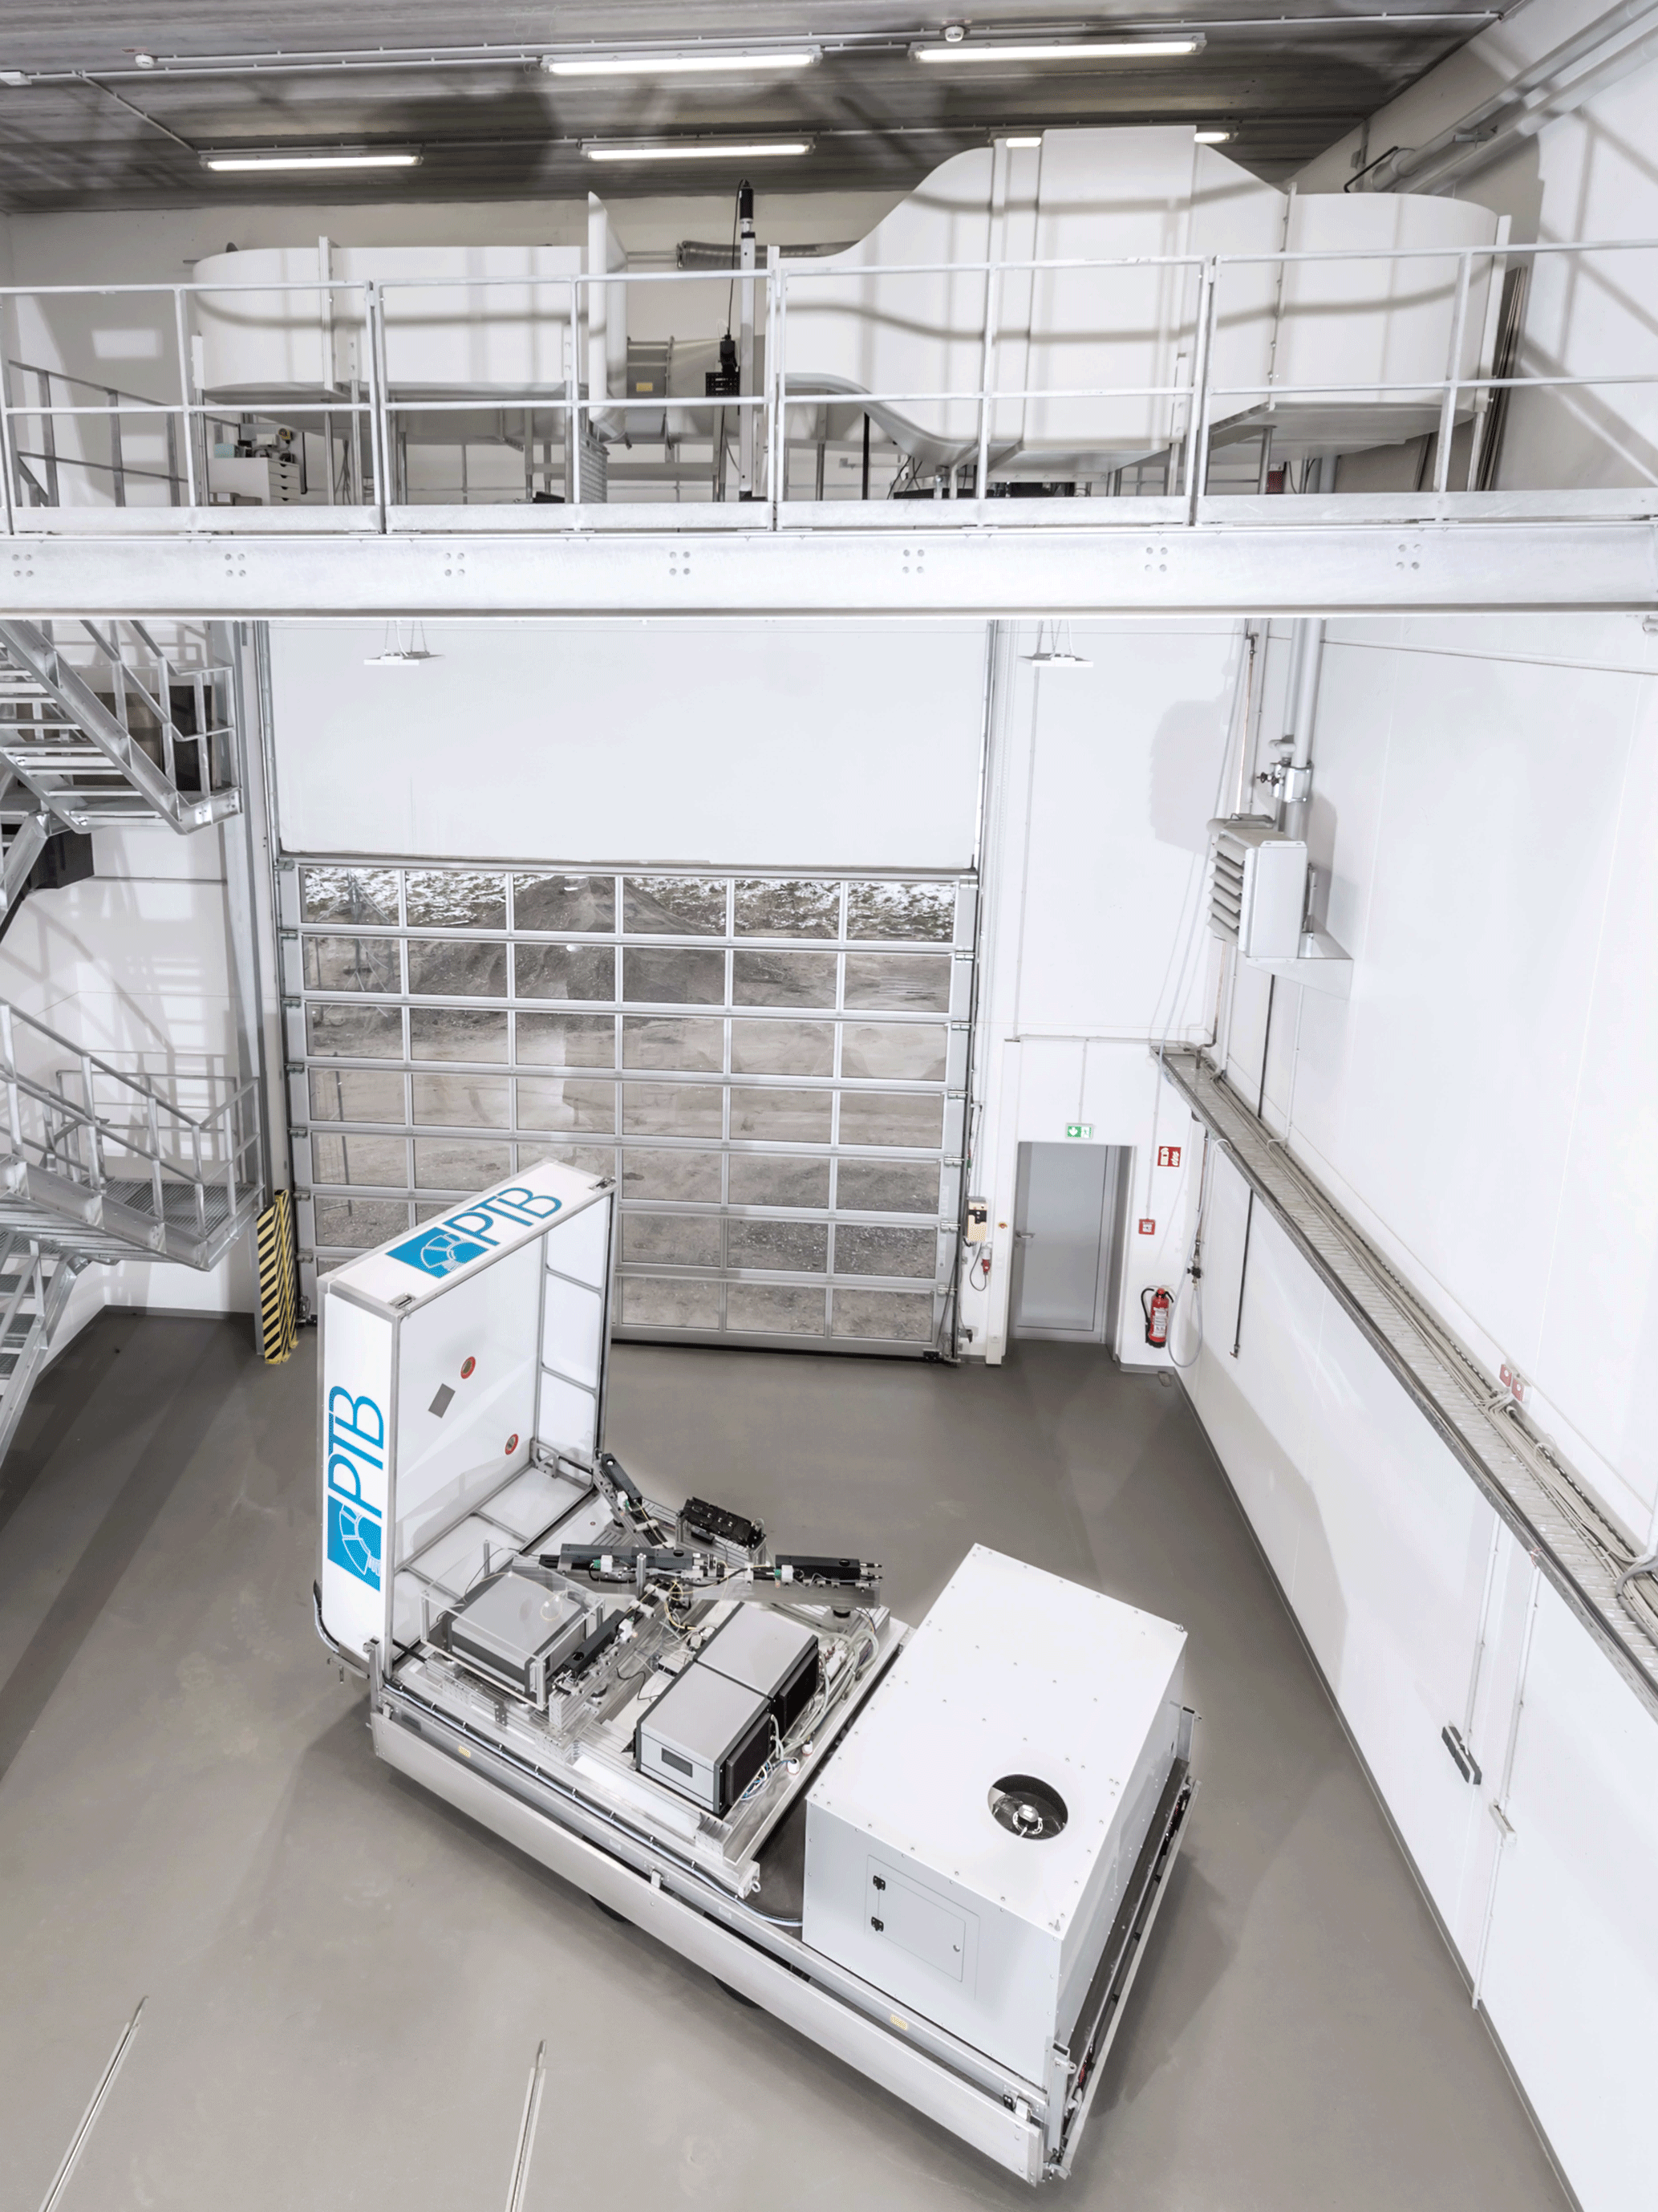
Figure 9Wind tunnel test facility at PTB with bistatic PTB lidar (opened trailer housing) positioned below the wind tunnel test section.
4.1 Wind tunnel characterization
Characterization measurements of the wind tunnel test section were performed using the LDA of the test facility to verify the flow quality of the wind tunnel. The seeding of the flow was accomplished by a TSI Atomizer Model 9302 creating scattering particles with a mean diameter of approximately 1 µm from a glycerine water mixture. Figure 10 shows the turbulence level of the flow measured in the center of the test section ( mm, z=375 mm; see Fig. 11c), where the turbulence level is given by the standard deviation divided by the mean value of the acquired velocity data. An initial resonance (dashed blue line) at a flow speed of 20 m s−1 caused by the dimensions and layout of the wind tunnel was removed by an appropriate air inlet in the corner of the wind tunnel yielding a turbulence level below 0.35 % in the complete flow speed range of the wind tunnel (black line).
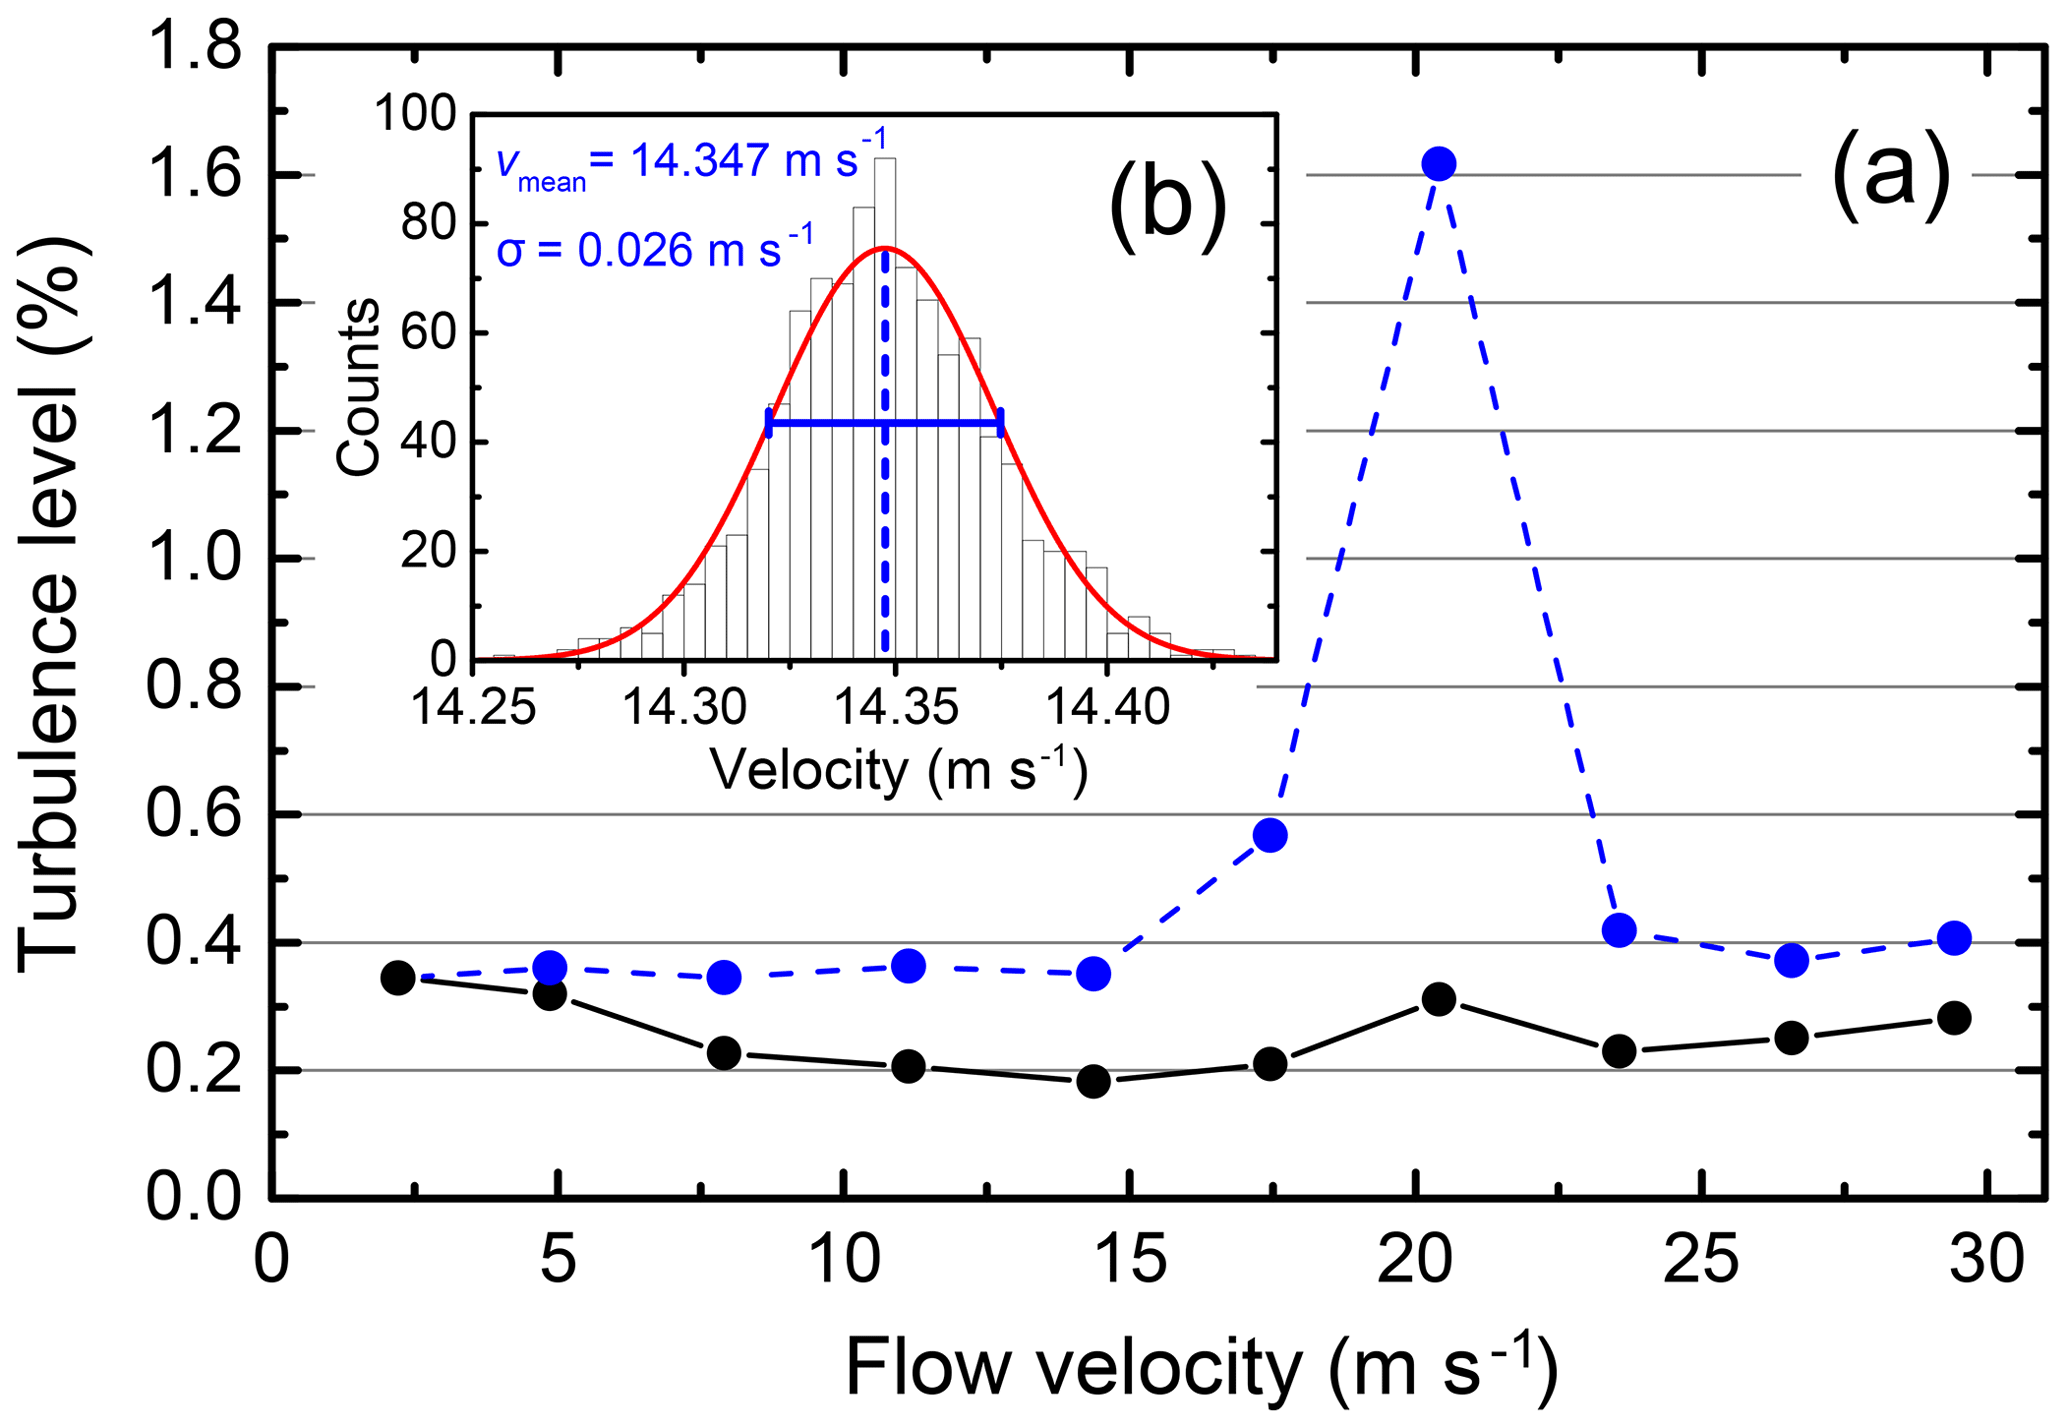
Figure 10(a) Turbulence level of the wind tunnel (blue dashed line – initially, without air inlet; black line – with air inlet). (b) Typical histogram of acquired LDA data at constant flow speed with Gaussian fit (red line).
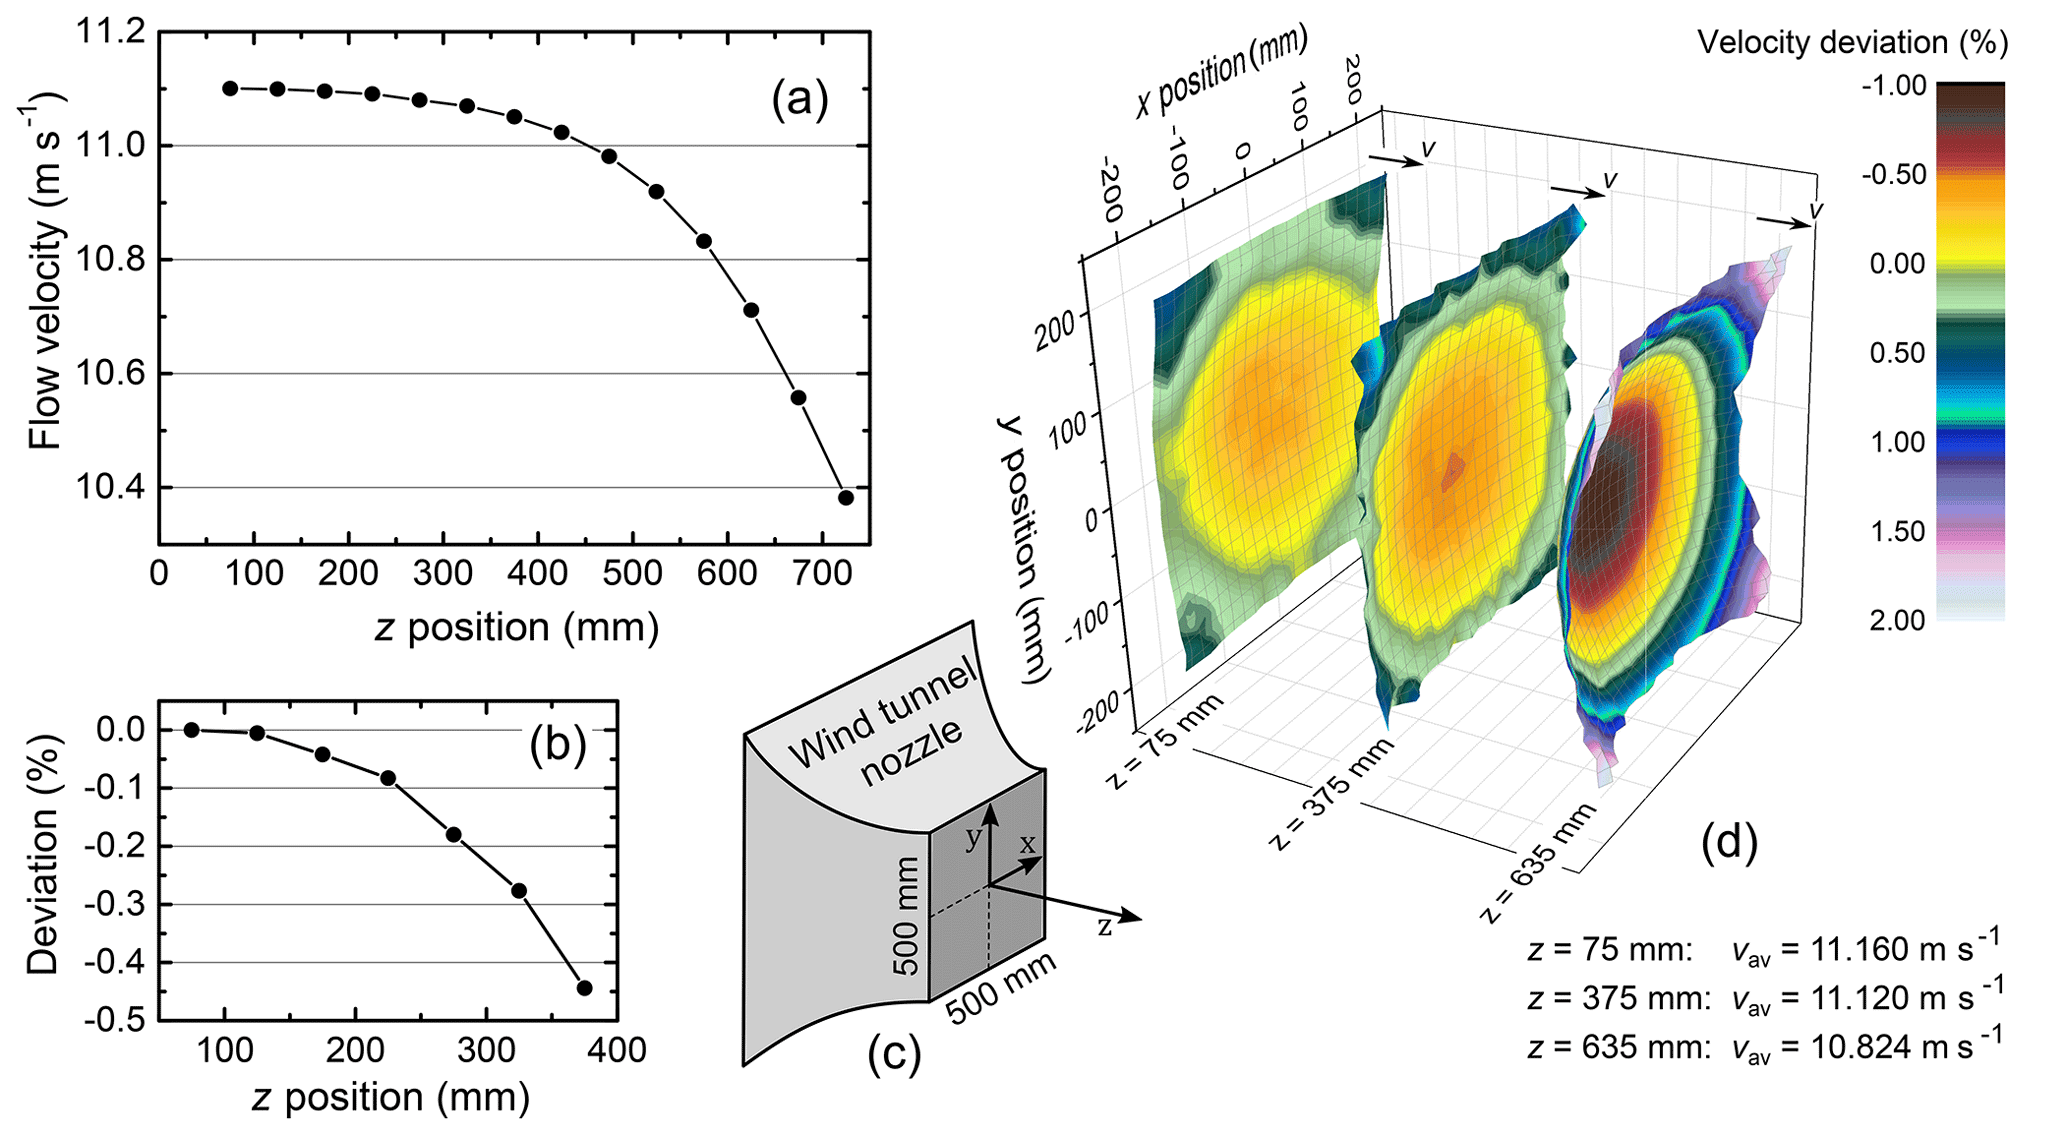
Figure 11Homogeneity of the wind tunnel: (a) flow velocity along the z axis of the test section ( mm) at constant wind tunnel flow speed and (b) corresponding deviation in % for z<375 mm. (c) Sketch of wind tunnel nozzle with coordinate system, and (d) lateral homogeneity at the beginning, the center and the end of the test section on a cross-sectional area of 400 mm ×400 mm2.
The characterization of the homogeneity of the flow within the test section is depicted in Fig. 11. Figure 11a shows measurements of the flow velocity along the z axis in the center of the flow ( mm), where the flow speed of the wind tunnel was kept constant at v=11.10 m s−1 (at mm, z=375 mm). The decrease of the flow velocity is attributed to the open character of the test section and predominates in the second half of the test section (z>375 mm). In the first half of the test section (z<375 mm), i.e., the relevant part of the test section which is used for the validation measurements of the bistatic lidar system, the flow velocity only slightly decreases with a deviation below 0.15 % dm−1 as shown in Fig. 11b. The lateral homogeneity of the flow is depicted in Fig. 11d for z= 75, 375 and 635 mm on a cross-sectional area of 400 mm ×400 mm2 with a grid size of 10 mm ×10 mm2. The velocity deviations are referred to the individual average velocities vav of each cross section. In the first half of the test section the deviation of the flow velocity is about 0.1 % dm−1 in the core of the flow, i.e., on a cross-sectional area with a radius of 10 cm. In the second half of the test section small inhomogeneities increase as is indicated by the velocity profile at z=635 mm, which is slightly deformed due to the air intake at the end of the open test section, i.e., in front of the hopper of the wind tunnel.
In summary, the wind tunnel is characterized by a high homogeneity in the relevant part of the test section in which calibrations and measurements are performed. Furthermore, it shows a low turbulence level especially in the flow speed regime from 4–16 m s−1, being typical for anemometer calibrations in the field of wind energy.
4.2 First validation measurement
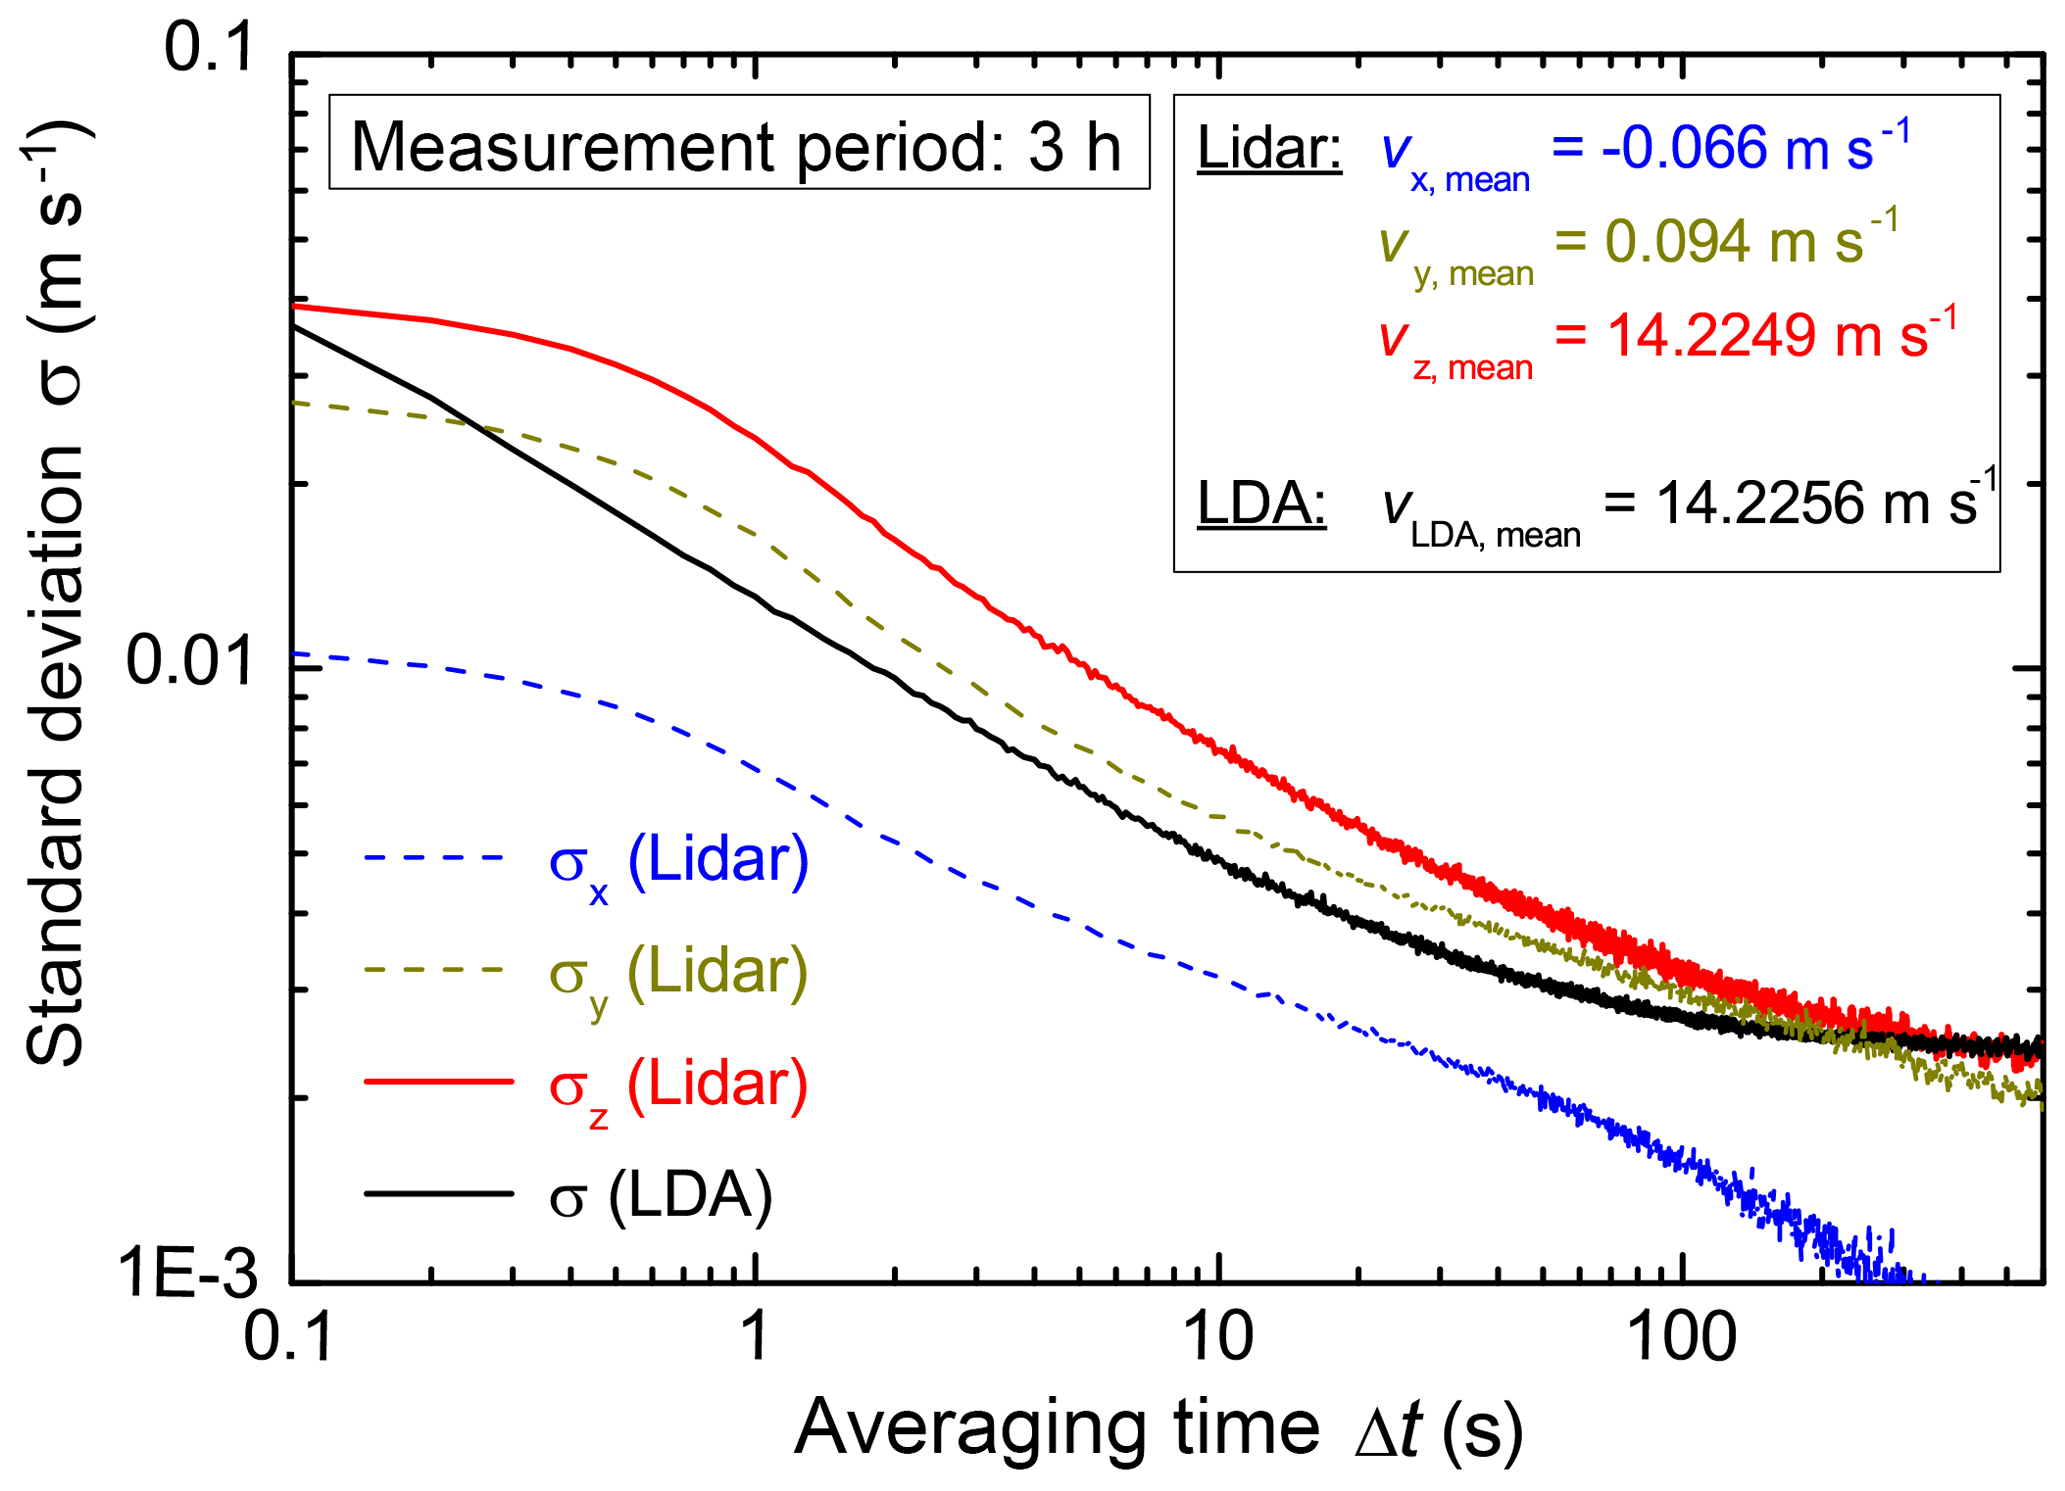
Figure 12Long-term comparison measurement of the PTB lidar and the LDA reference standard in the wind tunnel.
For a first comparison between the bistatic PTB lidar and the LDA reference standard in the wind tunnel, a long-term measurement lasting 3 h was carried out. During the measurement the lidar system was oriented in a way that the z component of the measured flow velocity vector pointed along the test section, i.e., the z axis of the wind tunnel. Both the lidar measurement volume (d=400 µm, l=4 mm) and the LDA measurement volume (d=300 µm, l=2.5 mm) resided within the same volume of about 1 cm3 in the core of the flow field ( mm) at z≈250 mm. For the data analysis the raw data were averaged in each case over time intervals (averaging time Δt) from 0.1 to 600 s. The resulting mean values were further used to calculate the standard deviation σ for each averaging time. The red (σLidar,z) and the black (σLDA) line depicted in Fig. 12 show the result of this data evaluation for the lidar system (relevant z component) and the LDA, respectively. A lower signal-to-noise ratio in addition to a lower data rate (during this measurement) of the lidar system leads to higher standard deviations of the lidar system compared to the LDA which are, however, well within the same order of magnitude. For long averaging times both standard deviations reach the same asymptotic value caused by a long-term drift of the wind tunnel of about 0.003 m s−1 h−1. The coinciding values of σ at Δt=0.1 s are generated by the turbulence of the flow field in the wind tunnel. Figure 12 also shows the standard deviations of the two other vector components (σLidar,x and σLidar,y) measured by the lidar system and, additionally, the mean values vmean of the measured flow velocities averaged over the complete long-term measurement (3 h). The deviation between the lidar system (vz,mean) and the LDA (vLDA,mean) is about 0.005 % and shows a first very promising result provided by the wind tunnel test facility regarding the validation of the bistatic lidar as new reference standard for wind remote sensing devices. Further extensive measurements will be performed in the future to determine the impact of parameter variations (like, for example, temperature or misalignment of the receiving optics) on the measurement uncertainty of the bistatic lidar system. These measurements will help to validate mathematical modeling of misalignment effects, which can be transferred to in-field measurements thereafter.
A new three-component fiber laser-based bistatic lidar system constructed at the Physikalisch-Technische Bundesanstalt (PTB) enables wind velocity vectors to be measured by means of single aerosols at heights from 5 to 250 m. The high spatial and temporal resolution of the bistatic system leads to a reduced measurement uncertainty of the wind speed compared to conventional monostatic systems, as clearly evidenced by comparison measurements with a wind met mast in a wind energy test field. Based on the well-defined geometry, the known wavelength and the precise frequency evaluation, the novel system has the potential for traceable wind speed measurements in flat as well as in complex terrain. For a detailed analysis and validation, a new wind tunnel test facility was constructed at PTB that enables the measurement uncertainty of the bistatic system to be determined quantitatively as accurate characterization measurements of the wind tunnel flow-quality evidence. A first validation measurement with the wind tunnel test facility yields a deviation between the bistatic lidar and the LDA reference clearly below 0.1 %, revealing the high precision of the bistatic lidar. Due to its unique characteristics, the novel system is exceptionally qualified to improve the measurement capability and accuracy of site and wind resource assessments, power curve measurements, and calibrations of conventional lidar systems.
The underlying measurement data are not publicly available and can be requested from the authors if required.
SO wrote the manuscript, performed the setup of the wind tunnel test facility and its characterization measurements, and contributed to the first validation measurement. ME constructed the lidar system and its signal processing and performed all lidar measurements, including the data evaluation. CG supported the hardware and software setup of the lidar system and contributed to the lidar measurements and data evaluation. PW supported the signal processing of the lidar system. HM and HT supervised all constructions and measurements.
The authors declare that they have no conflict of interest.
This article is part of the special issue “Sensors and Measurement Systems 2018”. It is a result of the “Sensoren und Messsysteme 2018, 19. ITG-/GMA-Fachtagung”, Nuremberg, Germany, from 26 June 2018 to 27 June 2018.
Parts of this work have been funded by the Bundesministerium für Wirtschaft
und Energie within the funding project “Aufbau eines Kompetenzzentrums Wind
zur Verbesserung der Metrologie für die Effizienzsteigerung von
Windenergieanlagen”, funding code: 0325945.
Edited by: Jürgen Czarske
Reviewed by: five anonymous referees
Albers, A., Janssen, A. W., and Mander, J.: How to gain acceptance for lidar measurements, available at: https://www.windguard.de/veroeffentlichungen.html (last access: 4 January 2019), 2010. a
Bingöl, F., Mann, J., and Foussekis, D.: Conically scanning lidar error in complex terrain, Meteorol. Z., 18, 189–195, https://doi.org/10.1127/0941-2948/2009/0368, 2009. a
Bradley, S.: Wind speed errors for LIDARs and SODARs in complex terrain, IOP Conf. Ser. Earth Environ. Sci., 1, 012061, https://doi.org/10.1088/1755-1307/1/1/012061, 2008. a
Bradley, S., Strehz, A., and Emeis, S.: Remote sensing winds in complex terrain – a review, Meteorol. Z., 24, 547–555, https://doi.org/10.1127/metz/2015/0640, 2015. a
Drain, L. E.: The Laser Doppler Technique, John Wiley & Sons Ltd, 1980. a
Eggert, M., Müller, H., and Többen, H.: Konzeption eines Doppler-Lidar-Transfernormals zur Windgeschwindigkeitsmessung, Proc. 19. GALA-Fachtagung, 45/1–45/6, 2011. a
Eggert, M., Gutsmuths, C., Müller, H., and Többen, H.: Zeitaufgelöste, vektorielle Vergleichsmessung zwischen dem Doppler-Lidar-Transfernormal der PTB und einem Referenz-Ultraschallanemometer, Proc. 22. GALA-Fachtagung, 11/1–11/8, 2014. a
Emeis, S., Harris, M., and Banta, R. M.: Boundary-layer anemometry by optical remote sensing for wind energy applications, Meteorol. Z., 16, 337–347, https://doi.org/10.1127/0941-2948/2007/0225, 2007. a
Gottschall, J., Courtney, M. S., Wagner, R., Jørgensen, H. E., Antoniou, I.: LiDAR profilers in the context of wind energy – A verification procedure for traceable measurements, Wind Energy, 15, 147–159, https://doi.org/10.1002/we.518, 2012. a
Gutsmuths, C., Eggert, M., Müller, H., and Többen, H.: Zeitaufgelöste, vektorielle Vergleichsmessungen zwischen dem Doppler-Lidar-Transfernormal der PTB und konventionellen Lidar Systemen, Proc. 23. GALA-Fachtagung, 65/1–65/7, 2015. a
Harris, M., Constant, G., and Ward, C.: Continuous-wave bistatic laser Doppler wind sensor, Appl. Opt., 40, 1501–1506, https://doi.org/10.1364/AO.40.001501, 2001. a
IEC 61400-12-1, Edition 2.0: Wind energy generation systems – Part 12-1: Power performance measurements of electricity producing wind turbines, 2017. a, b
MEASNET Procedure: Evaluation of Site-Specific Wind Conditions, Version 2, April 2016. a
Müller, H., Caré, I., Lucas, P., Pachinger, D., Kurihara, N., Lishui, C., Su, C.-M., Shinder, I., and Spazzini, P. G.: CCM.FF-K3.2011: Final report for the CIPM key comparison of air speed, 0.5 m/s to 40 m/s, Metrologia, 54, 07013, https://doi.org/10.1088/0026-1394/54/1A/07013, 2017. a
Pauscher, L., Vasiljevic, N., Callies, D., Lea, G., Mann, J., Klaas, T., Hieronimus, J., Gottschall, J., Schwesig, A., Kühn, M., and Courtney, M.: An Inter-Comparison Study of Multi- and DBS Lidar Measurements in Complex Terrain, Remote Sens., 8, 782, https://doi.org/10.3390/rs8090782, 2016. a
Peña, A., Hasager, C. B., Gryning, S. E., Courtney, M., Antoniou, I., and Mikkelsen, T.: Offshore wind profiling using light detection and ranging measurements, Wind Energy, 12, 105–124, https://doi.org/10.1002/we.283, 2009. a
Scheurich, F., Enevoldsen, P. B., Paulsen, H. N., Dickow, K. K., Fiedel, M., Loeven, A., and Antoniou, I.: Improving the Accuracy of Wind Turbine Power Curve Validation by the Rotor Equivalent Wind Speed Concept, J. Phys. Conf. Ser., 753, 072029, https://doi.org/10.1088/1742-6596/753/7/072029, 2016. a
Slinger, C. and Harris, M.: Introduction to continuous-wave Doppler lidar, available at: http://breeze.colorado.edu/ftp/RSWE/Chris_Slinger.pdf (last access: 4 January 2019), 2012. a
Sørensen, S., Warden, M., Macarthur, J., Silver, M., Holtom, T., McDonald, C., Clive, P., and Bookey, H.: Advances in Doppler Lidar for Accurate 3D Wind Measurements, Imaging and Applied Optics, AM2A.3., 2018. a