the Creative Commons Attribution 4.0 License.
the Creative Commons Attribution 4.0 License.
 | 15 Jul 2020
Evaluation of optical fibre sensors in the electrical domain
Ulrich Nordmeyer
Niels Neumann
Xiaozhou Wang
Dirk Plettemeier
Torsten Thiel
Konstantin Kojucharow
Optical fibre sensors cover a wide range of applications. They offer versatile advantages including resilience to electromagnetic interference, biocompatibility and chemical resistivity. Even in environments with restricted accessibility, integration difficulties can be overcome by using radio-over-fibre (RoF) technology that allows a wireless read-out. Conventionally, optical fibre sensors are evaluated in the optical domain by analysing the amplitude or spectrum of either the transmitted or the reflected light. A novel approach is to feed a radio frequency-modulated laser into the optical sensor and carry out a full electrical analysis of the resulting radio frequency (RF) signal, which is changed by the sensor's characteristics. This method will be investigated in this paper for fibre Bragg grating-based and chirped fibre Bragg grating-based sensors in reflection and transmission configuration. Their applicability for this new evaluation scheme will be discussed. Subsequent studies may cover additional types of sensors and the testing of the novel evaluation method within an application-related scenario, including packaging.
- Article
(6561 KB) - Full-text XML
- BibTeX
- EndNote


Optical sensors are available for various quantities, e.g. temperature, strain, pressure, pH, humidity, and even electrical or magnetic fields. Furthermore, optical sensors offer some key advantages over competing sensing principles. Their main benefit is their resilience to electromagnetic interference. Moreover, optical sensors provide immunity to corrosion, biocompatibility, high chemical resistivity and high sensitivity. Hence, they are suitable for measurement purposes over a wide range of applications, especially for those under harsh environmental conditions. These include the monitoring of buildings, healthcare, chemical processing and many more (Schuster et al., 2012; James and Tatam, 2003; Neumann et al., 2017).
Different measuring methods based on optical sensors are well known and share similar fundamental principles: the sensor, e.g. a fibre grating, is interfaced directly with fibre optics attached to a light source and the evaluation module. The light fed from the source into the optical sensor is evaluated after having passed the (passive) sensor. With photodetectors inside the evaluation module, the optical power, wavelength, or phase of the transmitted or the reflected light may be measured. While another key advantage of measurement set-ups based on optical sensors is the possibility of transmitting the signal over long distances without signal impairments, often times industrial environments do not allow for evaluation units to be placed remotely near the sensors. In addition, set-ups with many sensors require many evaluation units, which not only increases costs but also inflates the complexity of cabling. Other approaches include sophisticated laser sources like Fourier domain mode locking (FDML) fibre lasers to realise the multi-point read-out of complex fibre sensor networks while minimising the hardware efforts of the interrogation unit (Fu et al., 2012). In environments with restricted accessibility or the need for many sensors, integration difficulties can be overcome by using radio-over-fibre (RoF) technology (Neumann et al., 2014a). In an RoF set-up each sensor is connected to a simple transducer that converts the signal from the optical to the electrical domain and transmits it wirelessly to a central station, which again carries out the signal evaluation for all sensors together. For the RoF principle to work, it is necessary to modulate the light source with a radio frequency (RF) signal according to the desired carrier frequency of the radio transmission. The optical-to-wireless converter is also called a photonic antenna and basically consists of a photodiode, an electrical amplifier (optional) and an antenna (Yashchyshyn et al., 2010). RoF set-ups as well as photonic antennas, which serve as integral components of the RoF technology, have been studied extensively (mainly for applications in wireless communication; Nanyan et al., 2010; Prakoso et al., 2011; Neumann et al., 2012, 2013, 2014b).
As explained above, the evaluation of optical fibre sensors has conventionally been carried out in the optical domain by analysing the amplitude or spectrum of either the transmitted or the reflected light. Since the signal in RoF set-ups is RF modulated, an alternative approach is to carry out an electrical analysis of the received signal, which is changed by the measurand-dependent sensor's characteristics before reception. This method provides several benefits and is especially qualified for use in RoF applications as an RF modulation is already present, but it can also be adapted to non-RoF applications by simply applying an RF modulation to the existing set-up. Some authors have already investigated this approach by evaluating the amplitude of the electrical RF signal both in RoF and non-RoF set-ups (Gagliardi et al., 2005; Liu et al., 2010; Neumann et al., 2014a, 2017). The novelty of the present study is to carry out a full analysis of the electrical RF signal in terms of a complex amplitude measurement.
In the next section, some basics of the utilised fibre sensors are introduced and the experimental set-ups are subsequently explained. The key results are then presented and discussed with respect to their consequences regarding the applicability of the novel sensor read-out approach.
A typical application scenario for optical sensors is the measurement of temperature with fibre gratings. Their working principle is based on a periodic variation of the refractive index in the core of a single-mode fibre. The grating acts as an interference filter with its specific resonance wavelength λR according to
where Λ is the grating period, and Δneff is the difference of the effective refractive indices of the involved modes (Erdogan, 1997). Fibre gratings having a period of some hundred nanometres belong to the subcategory of fibre Bragg gratings (FBGs). The optical transmission characteristic of FBGs corresponds to a small band-stop filter around its resonance wavelength. A change in temperature leads to a difference in the grating period. These changes again affect the resonance wavelength and the whole filter characteristic in the form of a shift in the centre wavelength. A measured change in the ratio of the transmitted to the inserted optical power of a stabilised laser source can be assigned to a specific change in temperature, provided that the filter characteristic is known.
Accordingly, it is essential to know the exact spectral amplitude filter characteristic of the optical sensor. Only this knowledge enables measured reflection or transmission values of optical power to be translated back to a shift in wavelength and by that to a change in the measurand. This very filter curve depends on certain parameters. Despite the aforementioned resonance wavelength λR, the full width at half maximum (FWHM) of the stop band is the most important application-related parameter of an FBG. Both are formed together with the exact course of the filter curve by manufacturing specific values. The most important values are the length L and the period Λ of the grating. In addition, the precise variation shape of the refractive index has great influence on the resulting filter curve. The fundamental shape is typically a uniform raised cosine. It may be modified in many variations. Compared with uniform-shape gratings, wider stop bands can be achieved by sweeping the grating period continuously from one end to the other. Gratings with a nonconstant but consistently modulated grating period are called chirped FBGs (cFBG), defined by the specific increase rate of their grating period (chirp dΛ∕dz). Another commonly utilised transformation is to apodise the fundamental shape e.g. with a Gaussian filter. Here, the incentive is to reduce undesired side lobes that occur in the spectra of non-apodised gratings (Erdogan, 1997). In general, many forms of amplitude filter characteristics can be manufactured.
Besides the wavelength-dependent attenuation, a grating also introduces dispersion to an inserted optical signal. This means that every grating also possesses a wavelength-dependent group delay characteristic. The group delay τg can be calculated from the phase Φ and the angular frequency ω according to
The group delay properties have also been studied for many years and are mainly used for dispersion compensation in optical networks (Ouellette, 1987; Hill et al., 1994; Erdogan, 1997; Giles, 1997; Hill and Meltz, 1997).
Table 1Parameters of the sensors tested. “n/a” stands for not applicable.
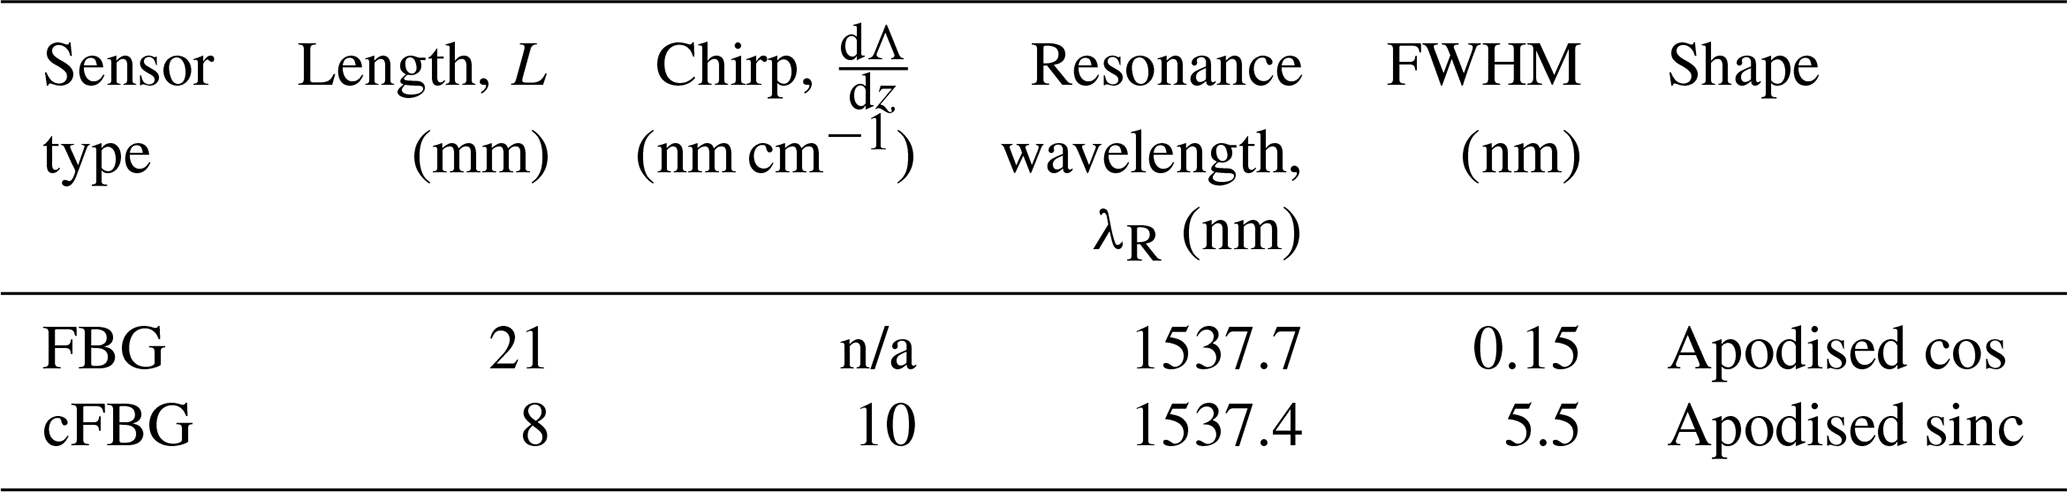
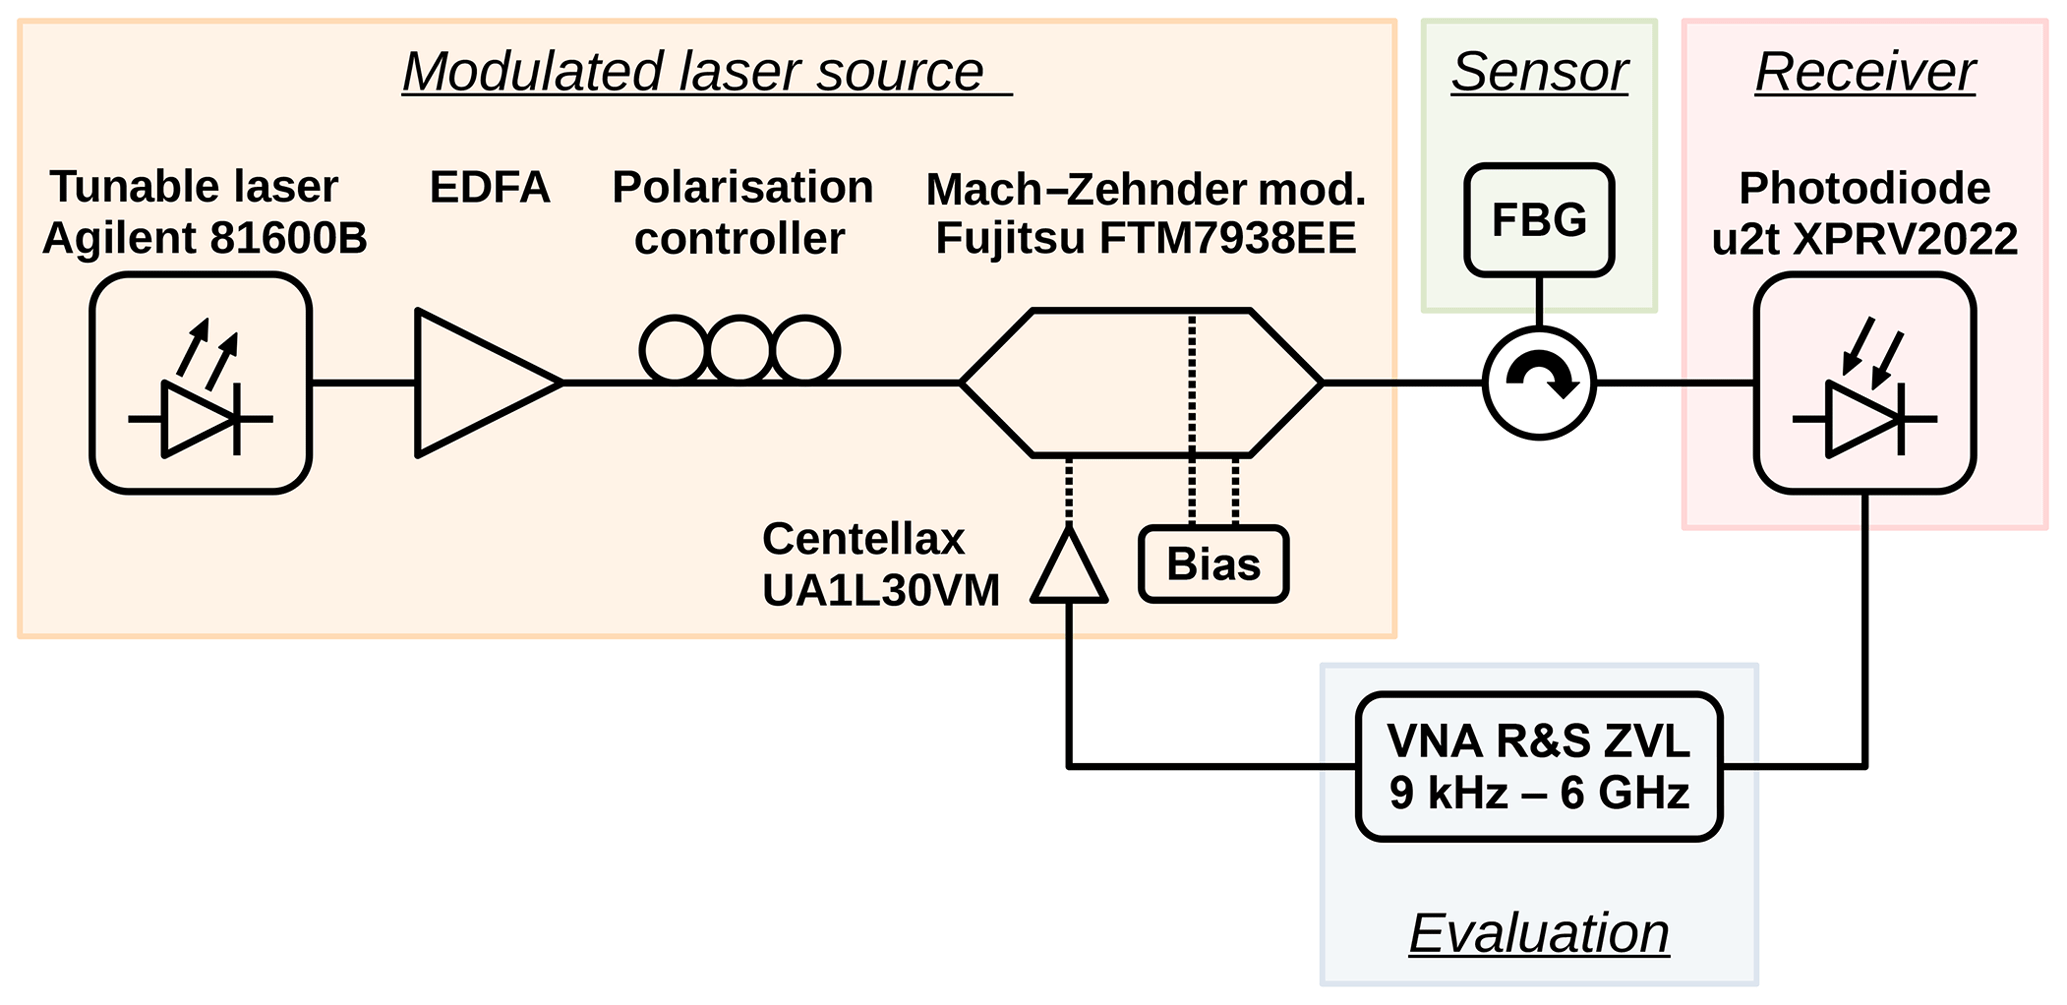
Two fibre grating sensors have been tested using the electrical read-out scheme: a cFBG and a normal FBG. Their characteristic parameters are shown in Table 1. As controlling the temperature of the sensors leads to a more sophisticated experimental set-up, the temperature is kept constant while the shift of the filter characteristic relative to the inserted laser wavelength is simulated by changing the latter. The set-up is identical for both sensors: a laser source with tunable wavelength (TLS) is connected to an erbium-doped fibre amplifier (EDFA) to achieve sufficient optical power. The amplifier’s output is connected to a Mach–Zehnder modulator (MZM) with a polarisation controller in between. The first port of the sensor to be tested is connected to the output of the modulator. A photodiode (PD) with a sufficient RF bandwidth is connected to the second port of the sensor. For the electrical read-out a two-port vector network analyser (VNA) is used: port one is connected to the electrical input of the MZM, and port two is connected to the PD with an electrical amplifier in between. While the set-up described integrates the sensor in transmission configuration, in the reflection variant a circulator is inserted between the MZM and the PD. One port of the sensor is connected to the circulator instead and the other one is left open. This set-up is shown in Fig. 1.
Before testing the electrical read-out approach, the filter characteristics of both gratings were determined conventionally. By scanning the sensor with the TLS over a wide range of wavelengths using small steps (0.1 pm for the FBG and 5 pm for the cFBG), the sensor is analysed using an optical power meter. The resulting filter characteristic serves as reference for the following electrical analysis.
The very same procedure is repeated by conducting full electrical S21 measurements on the VNA, i.e. real and imaginary amplitude, in a frequency band from 9 kHz to 6 GHz (the frequency range of the VNA). The electrical sweep is performed for each wavelength that the TLS is set to. Beforehand, the whole set-up is calibrated electrically by means of a forward normalisation at a wavelength with minimum attenuation. For the transmission configuration, this is a wavelength outside the filter notch; for reflection measurements, this is a wavelength at the peak attenuation known from the optically determined reference characteristic. This not only allows for the calibration of the insertion loss of the whole set-up, including cables, electro-optical conversion, optical loss and opto-electrical conversion, but also provides a reference for the group delay of the aforementioned set-up. As a consequence, the measured S21 values are independent of the electro-optical set-up used.
In the following, all parameters and dependencies in the optical domain are given with respect to wavelength, while all measurements and evaluations in electrical domain are presented with respect to frequency.
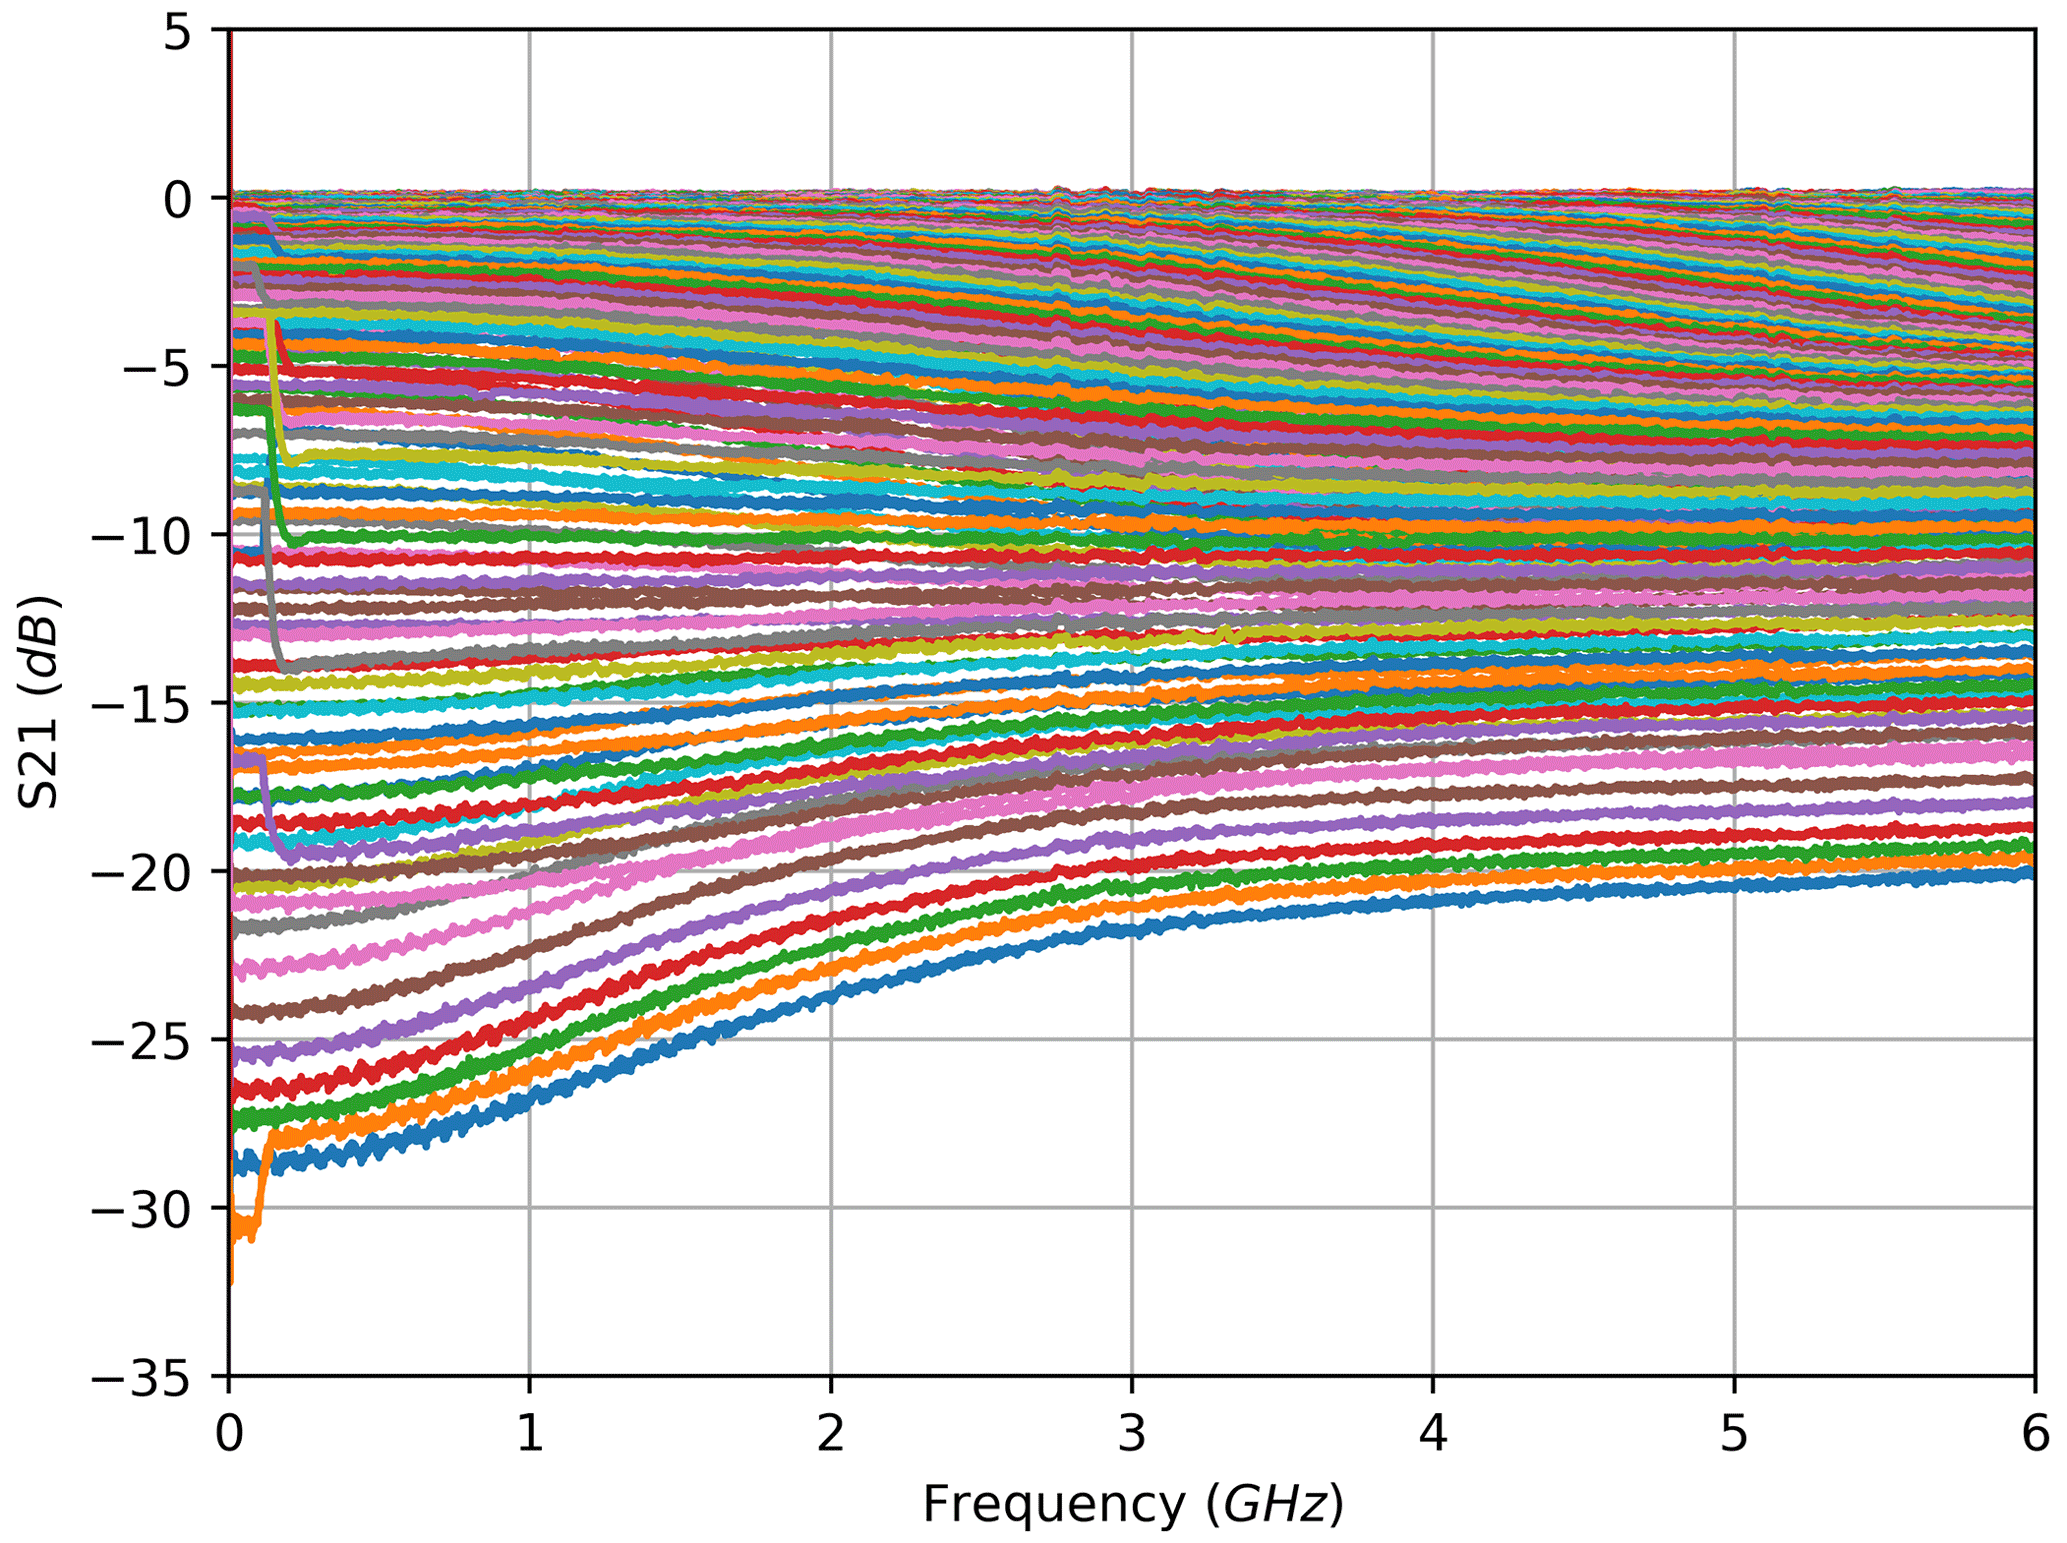
For the transmission configuration, the measured electrical amplitude characteristics of the FBG are shown at selected wavelengths in Fig. 2. These characteristics are calculated from the magnitude of the complex S21 measurements which were acquired directly with the VNA. Each curve corresponds to the complex S21 measurement of one electrical frequency sweep at a single optical wavelength. A depiction of the complete family of curves for all wavelengths of the optical sweep across the FBG would fill the entire area of Fig. 2 between 0 and approx. −32 dB; therefore, only a small count of curves at equidistant wavelengths was selected. The amplitude curves show unexpected slopes in higher frequency bands, which are discussed and explained in the following section. From the entire set of amplitude characteristics, the filter characteristic of the sensor is derived. This was done in a small frequency band in the form of an arithmetic mean from 400 to 600 MHz for each curve. Because a photodiode is a square-law device, the square root of the resulting amplitude value has to be extracted, which corresponds to a division by 2 in the decibel domain. The reason for limiting the frequency band is to avoid a distortion resulting from the curvature behaviour. The definition of the width and location of this evaluation frequency band is a trade-off between several aspects: on the one hand, the sloped frequency ranges have to be avoided; on the other hand, averaging over a wider frequency band reduces noise, and the glitches that occur at low frequencies of some measurements have to be skipped. These glitches result from timing issues with the measurement equipment: an example can be observed in the low frequencies for the brown curve in Fig. 5.
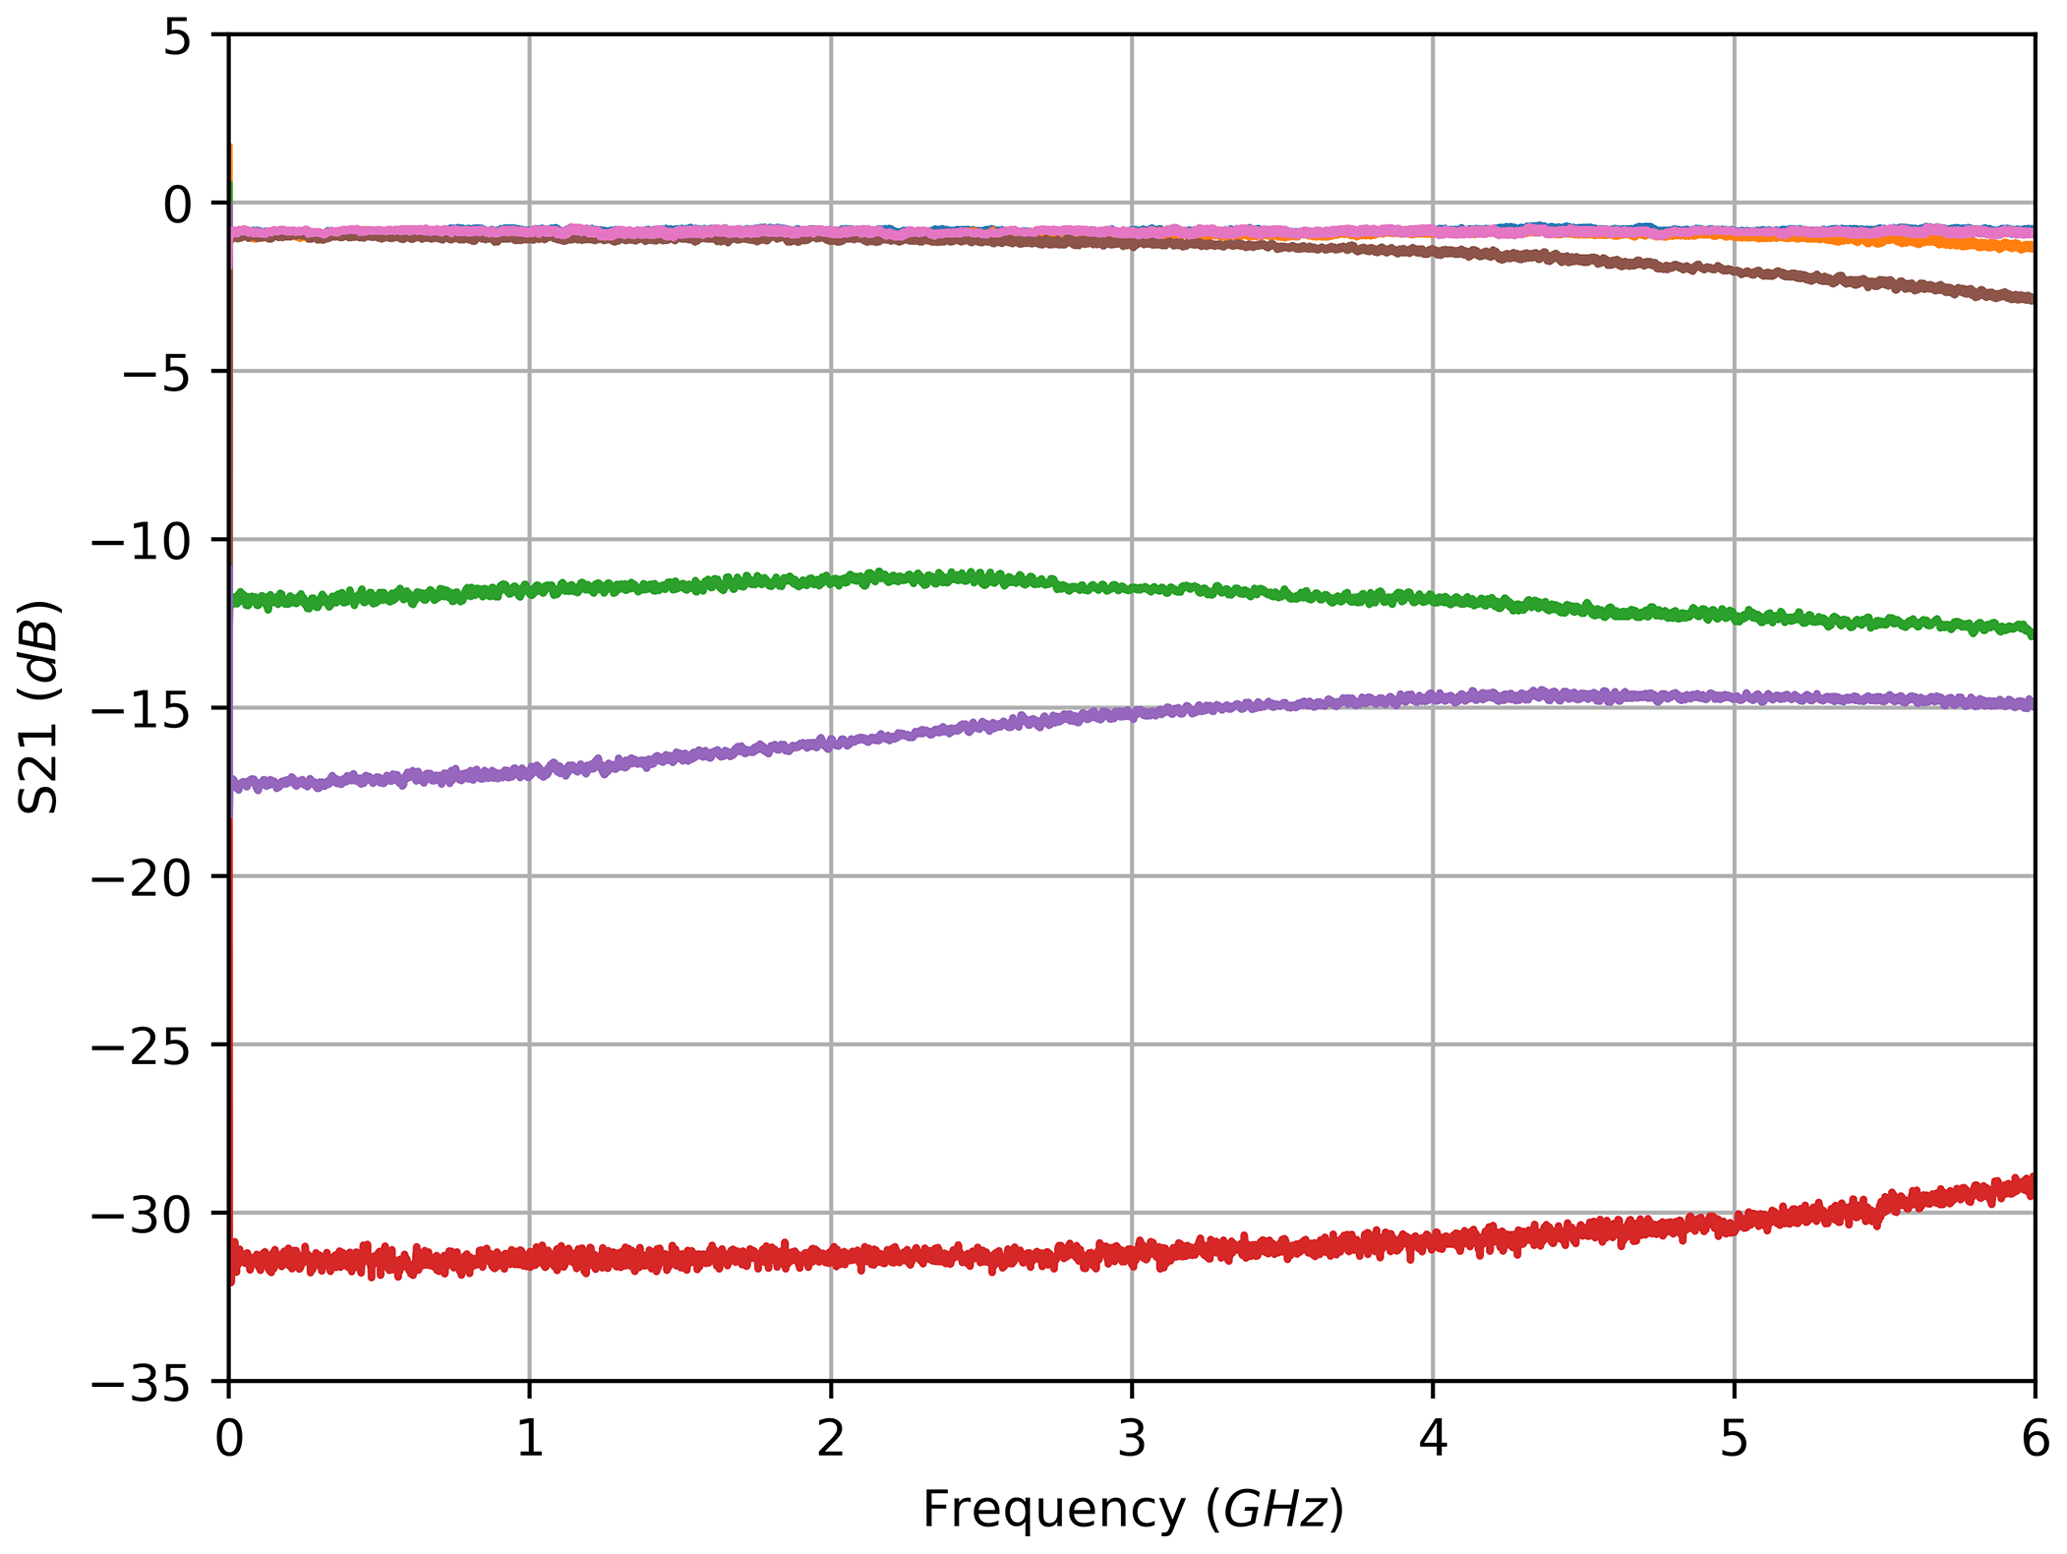
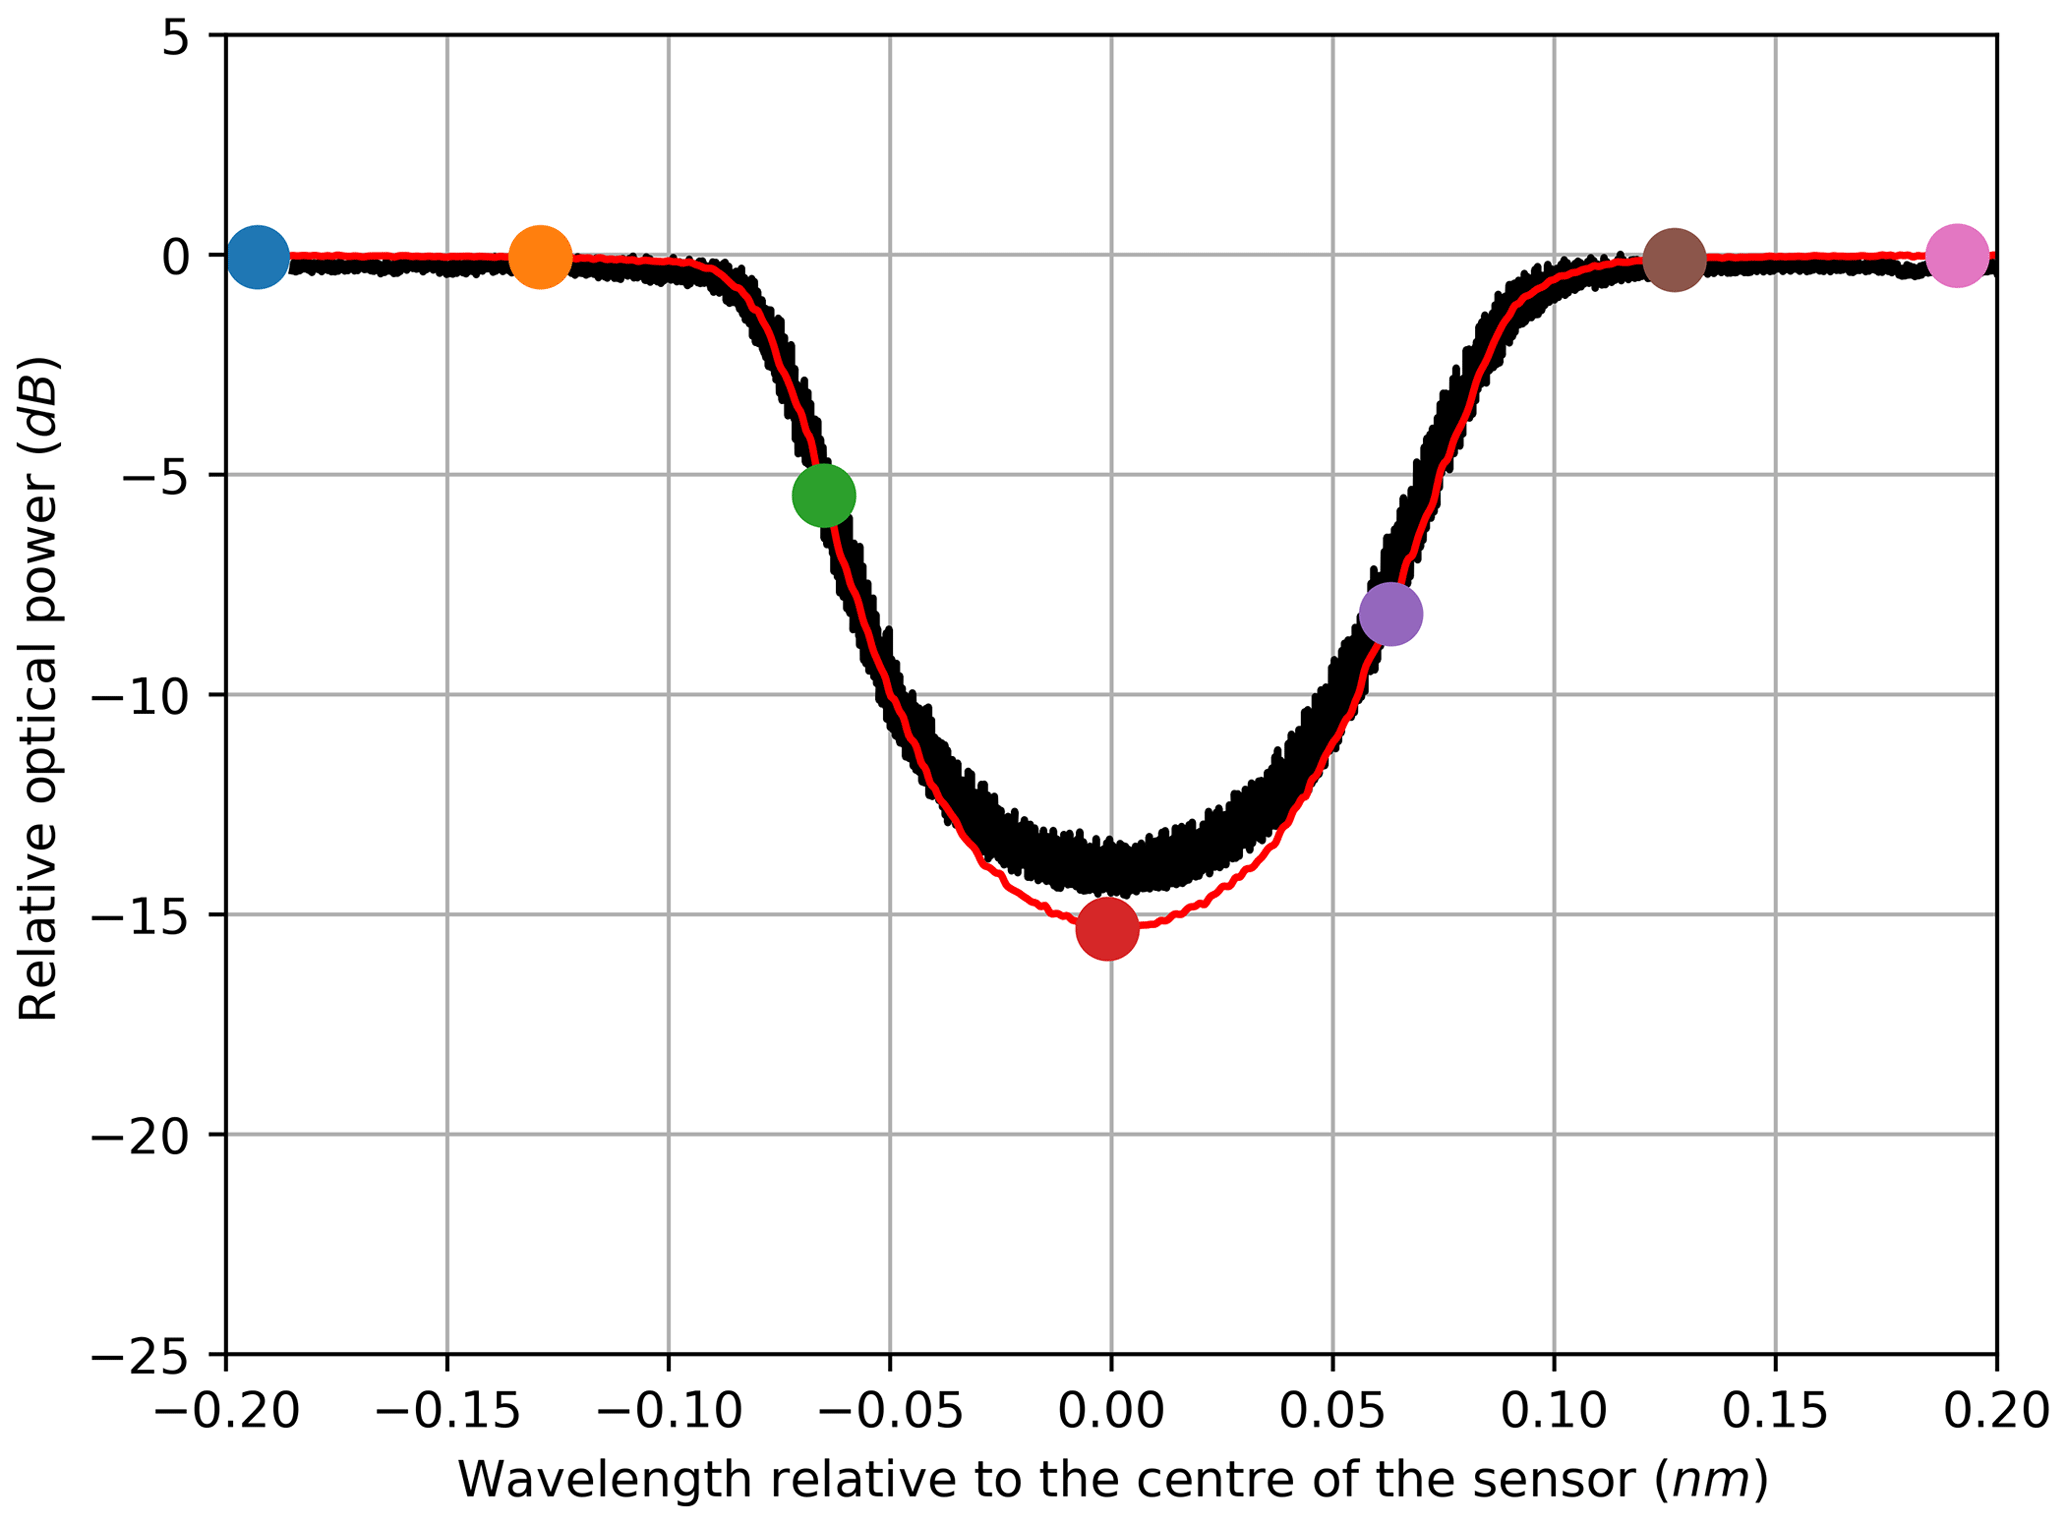
Figure 3Electrically (red) vs. optically (black) derived filter characteristic of an FBG in transmission configuration.

Figure 4Electrically (red) vs. optically (black) derived filter characteristic of a cFBG in transmission configuration.
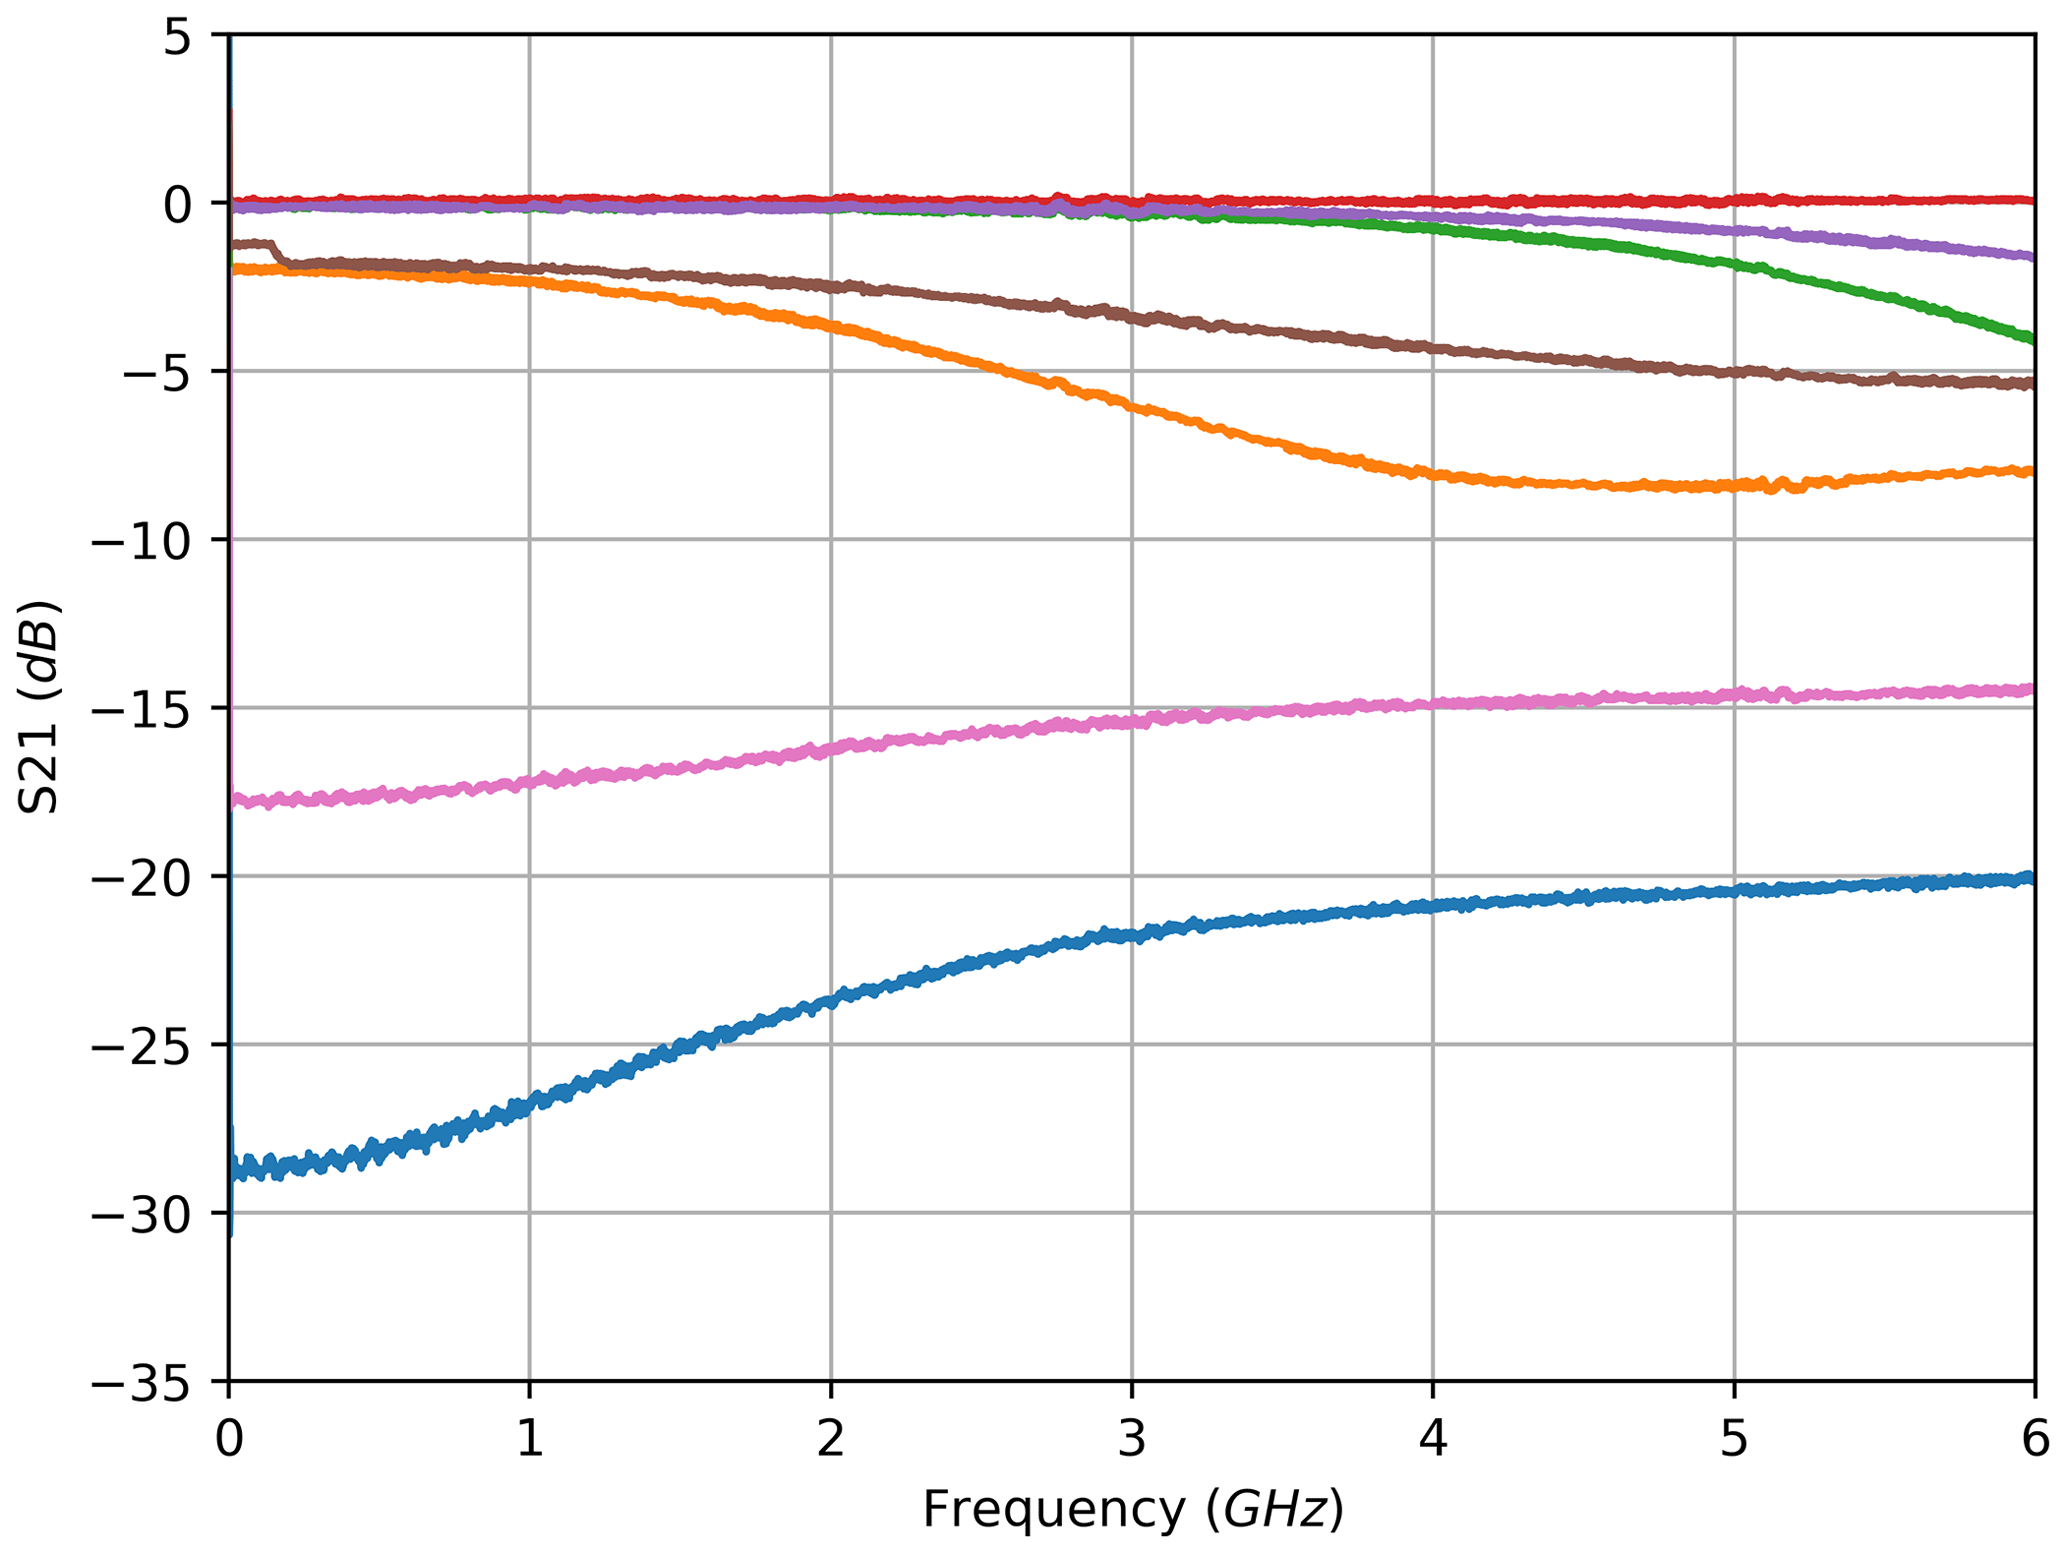
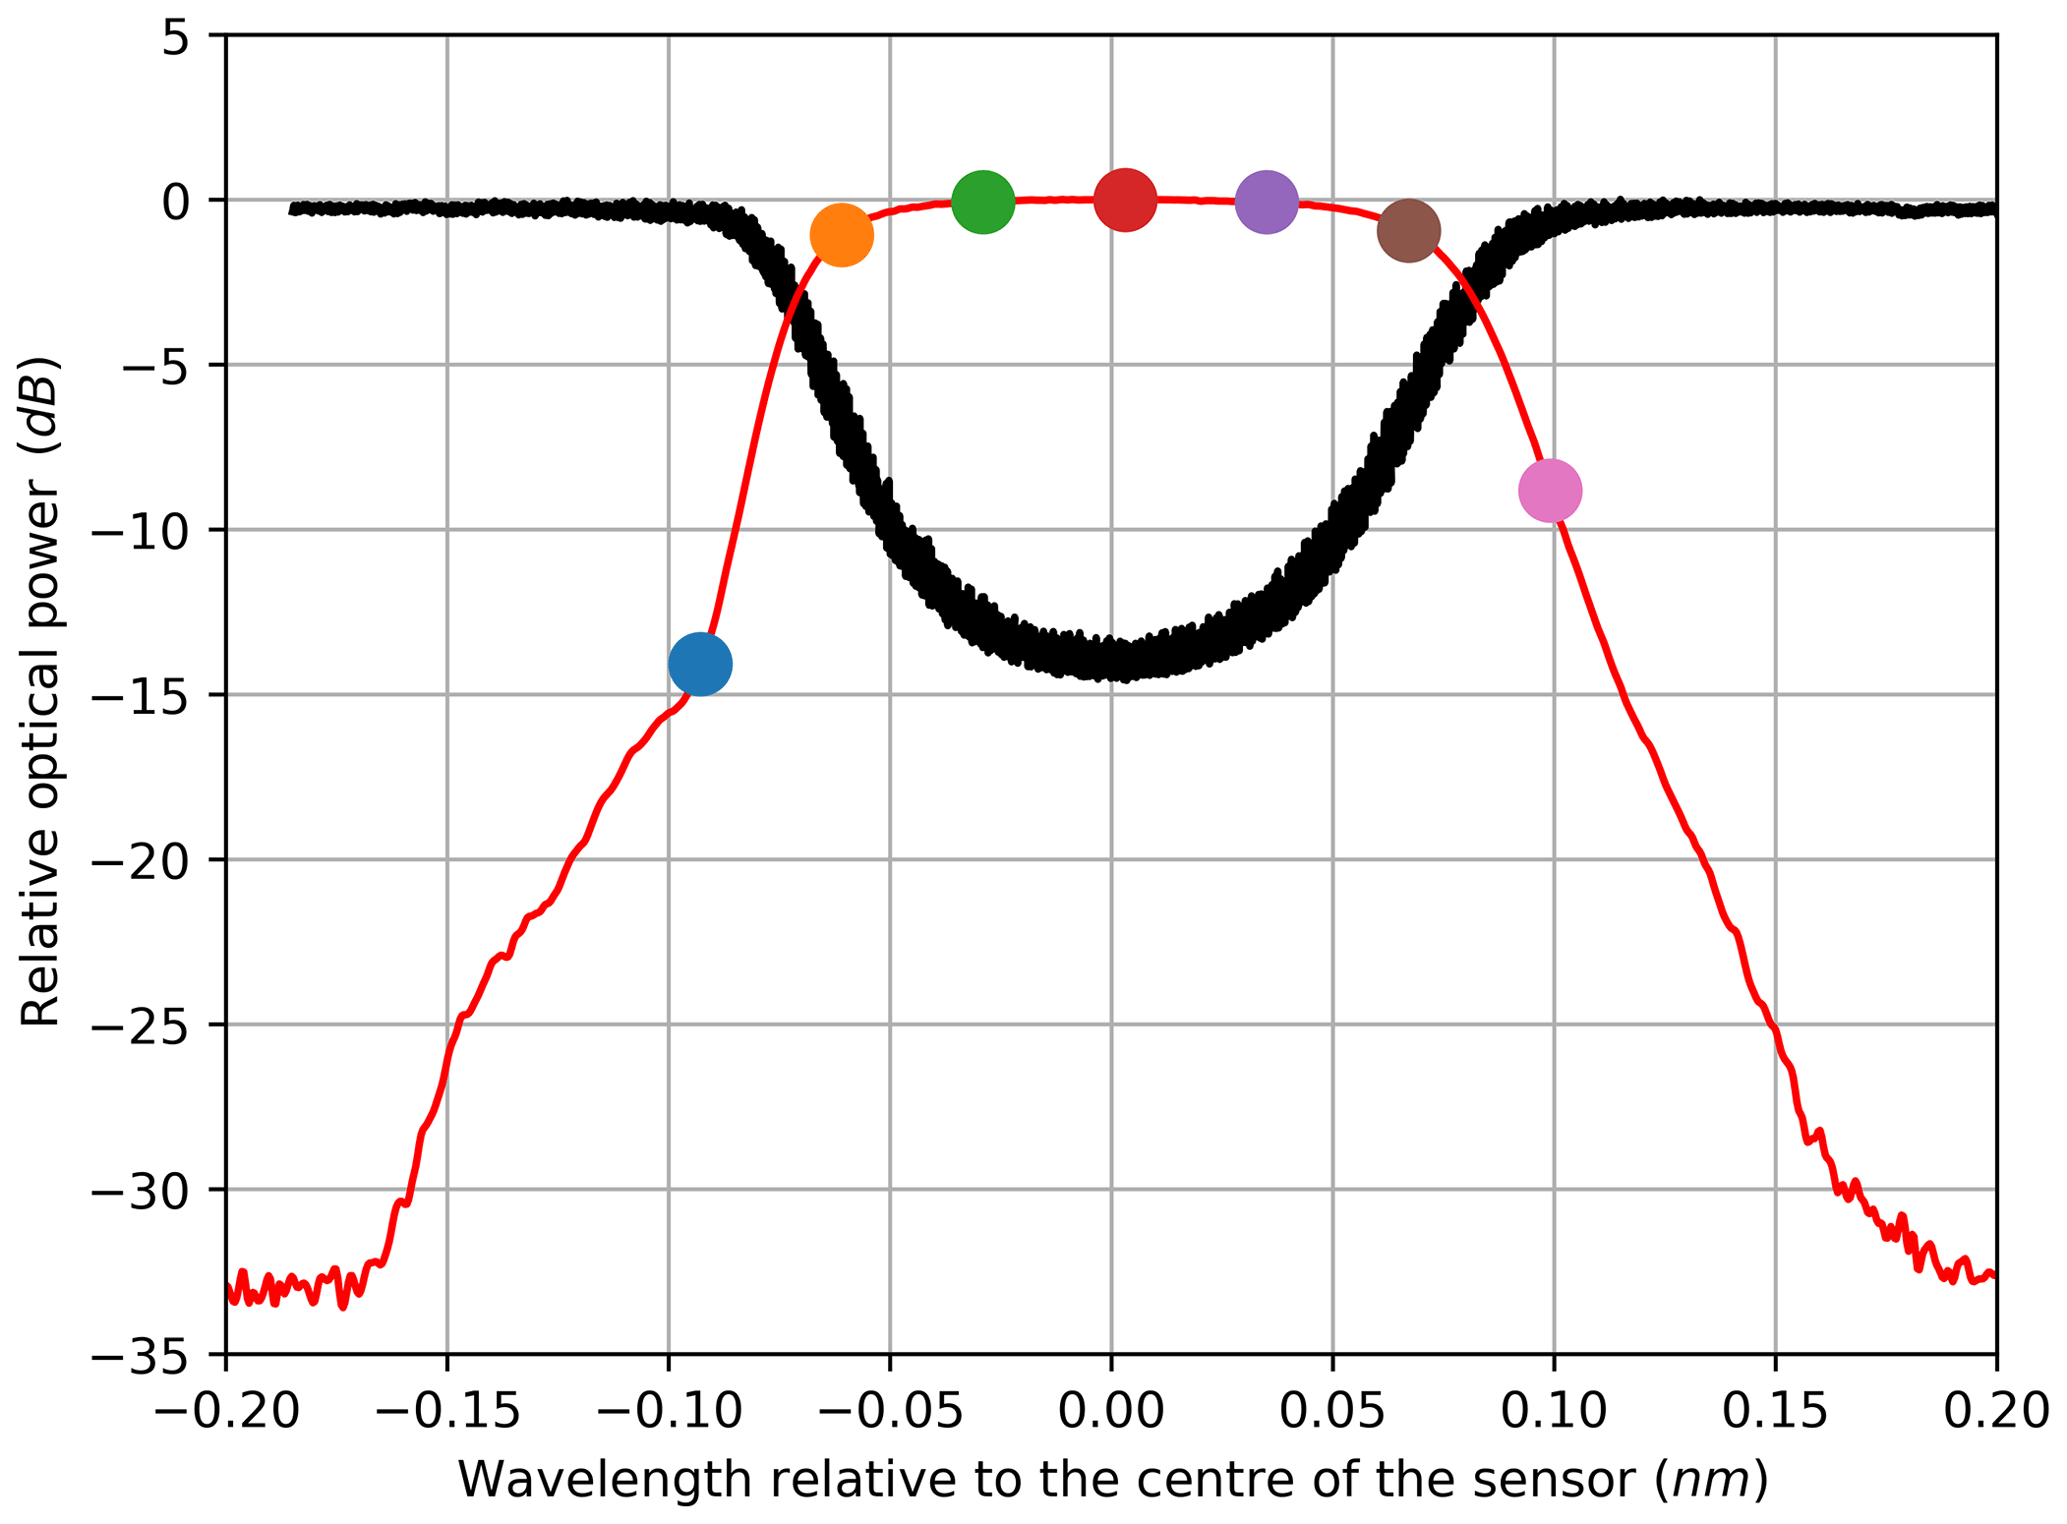
Figure 6Electrically derived filter characteristic of an FBG in reflection configuration (red) vs. optically derived filter characteristic of an FBG in transmission configuration (black).
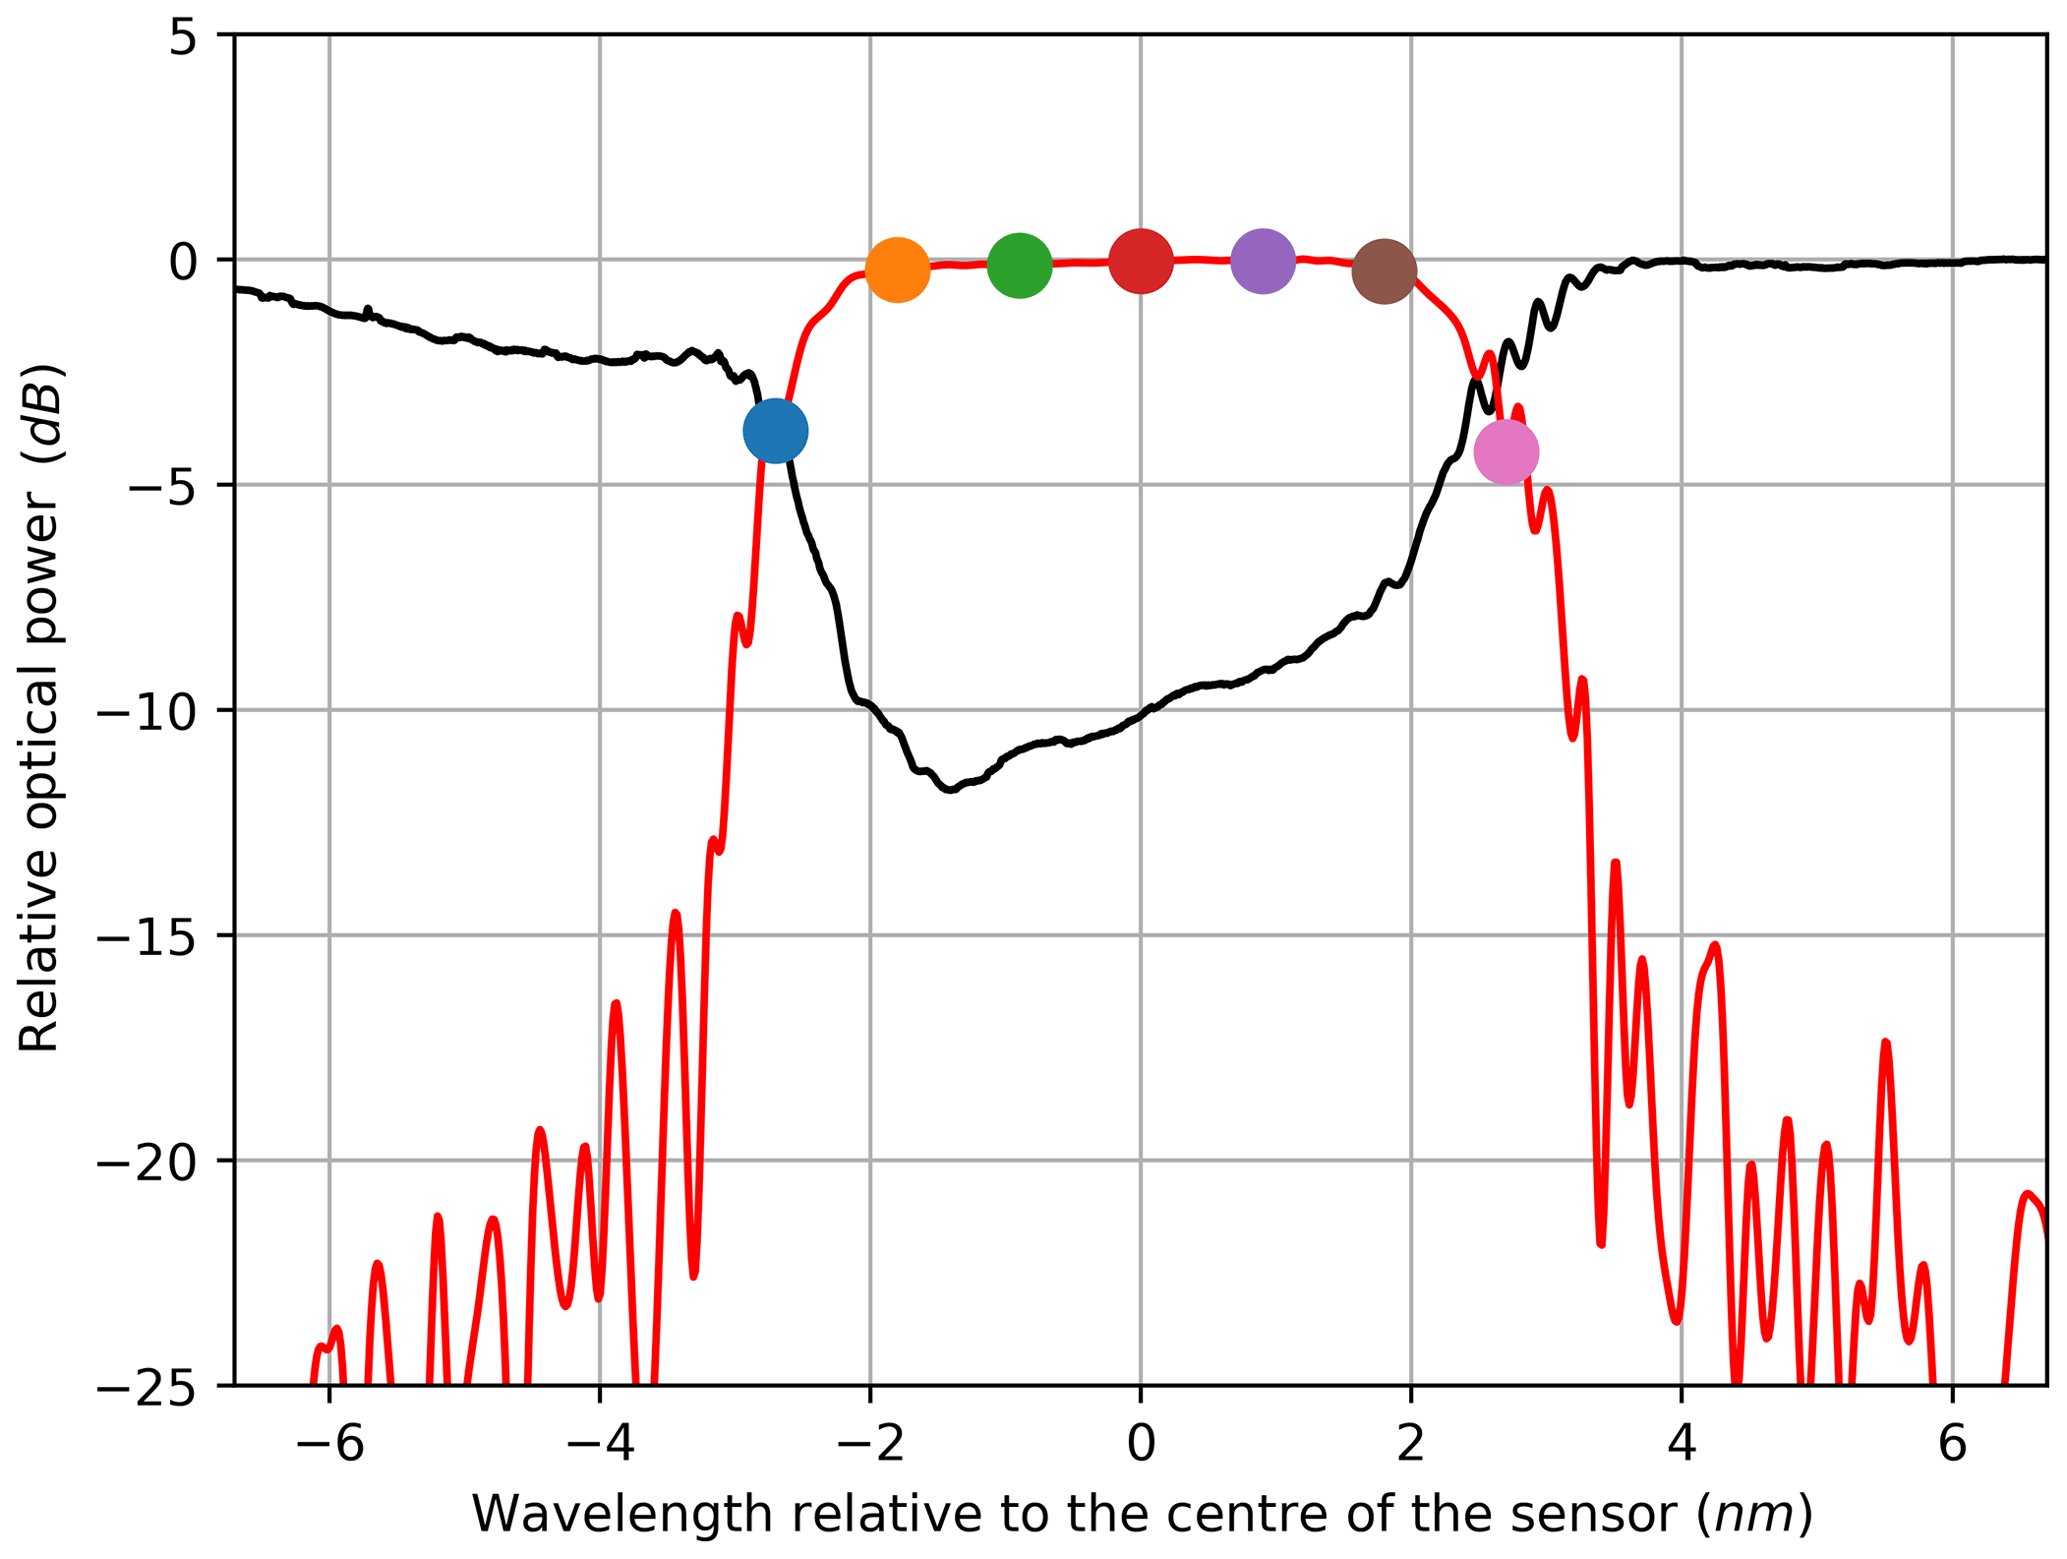
Figure 7Electrically derived filter characteristic of an FBG in reflection configuration (red) vs. optically derived filter characteristic of an FBG in transmission configuration (black).

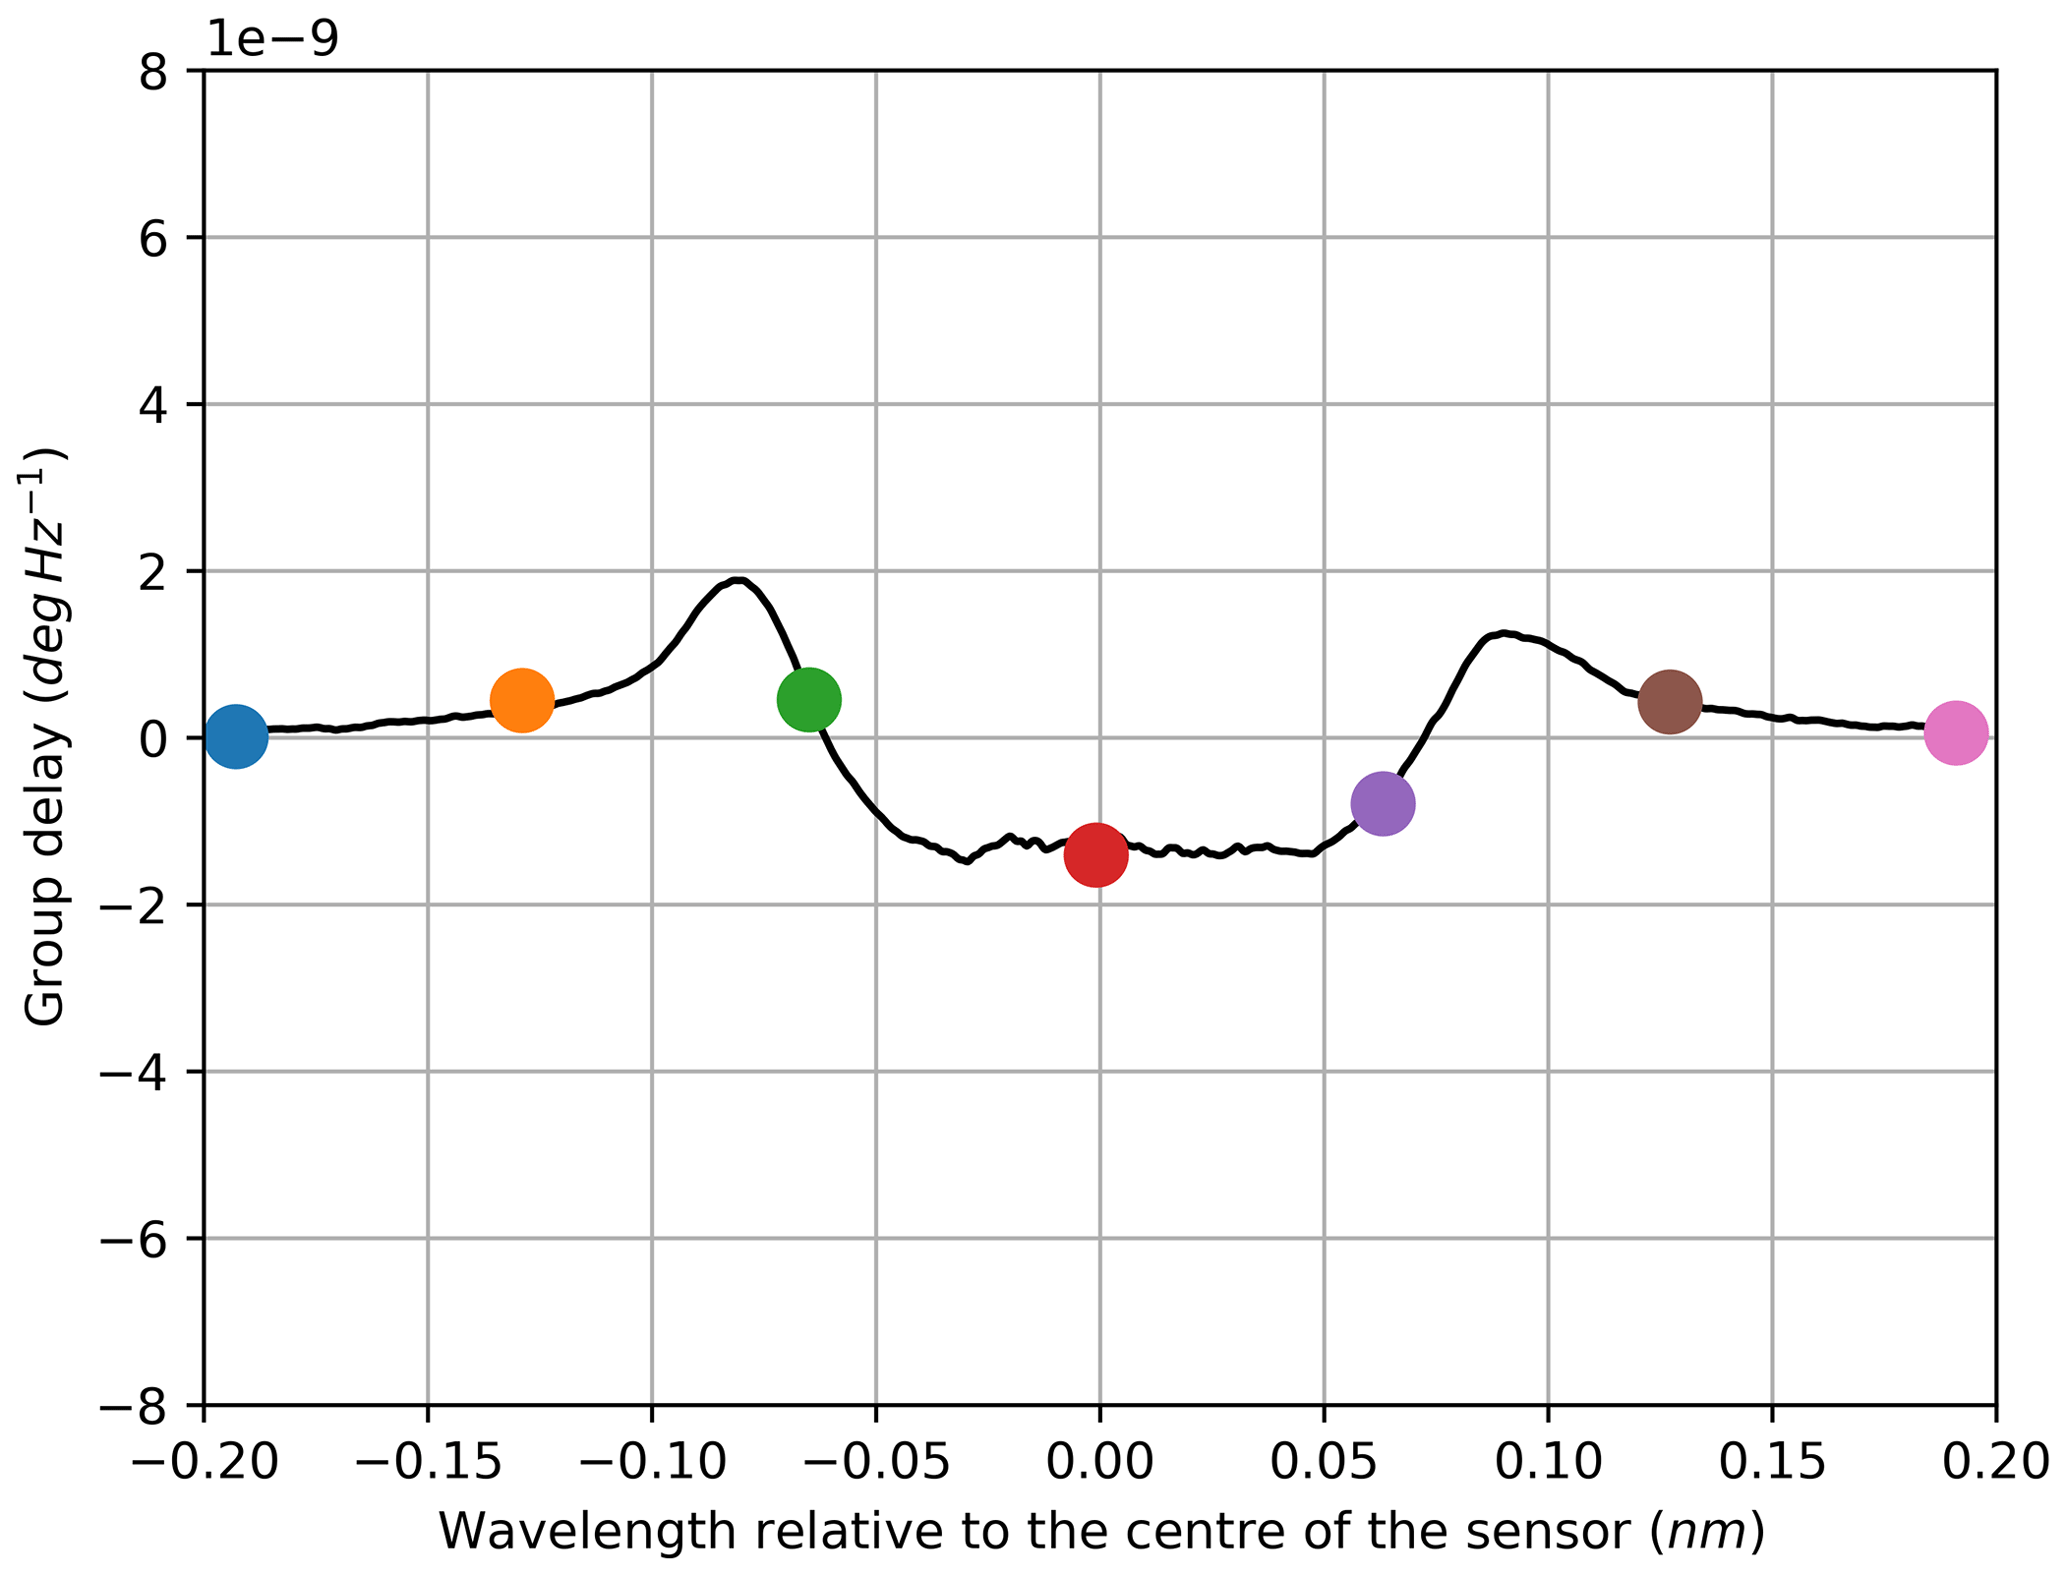
Figure 9Group delay derived from the electrical phase of an FBG in transmission configuration.
As a result of these calculations, one amplitude value can be assigned to each wavelength of the optical sweep. Due to the high resolution of the optical sweep of 0.1 pm for the FBG, the filter characteristic can be reconstructed in great detail. Figure 3 shows the back-traced amplitude vs. wavelength curve in comparison to the reference acquired with the optical power meter. To better visualise the reconstruction, Fig. 3 contains selected coloured dots that correspond to the curves depicted in Fig. 2. Thus, according to the previously explained considerations, the arithmetic mean (in decibels) of the red curve in Fig. 2 in the frequency band from 400 to 600 MHz divided by 2 yields the amplitude value of the red dot in Fig. 3. The same data are shown in Figs. 5 and 6 for the measurements in reflection configuration. As expected, the filter characteristic is inverted compared with the transmission set-up.
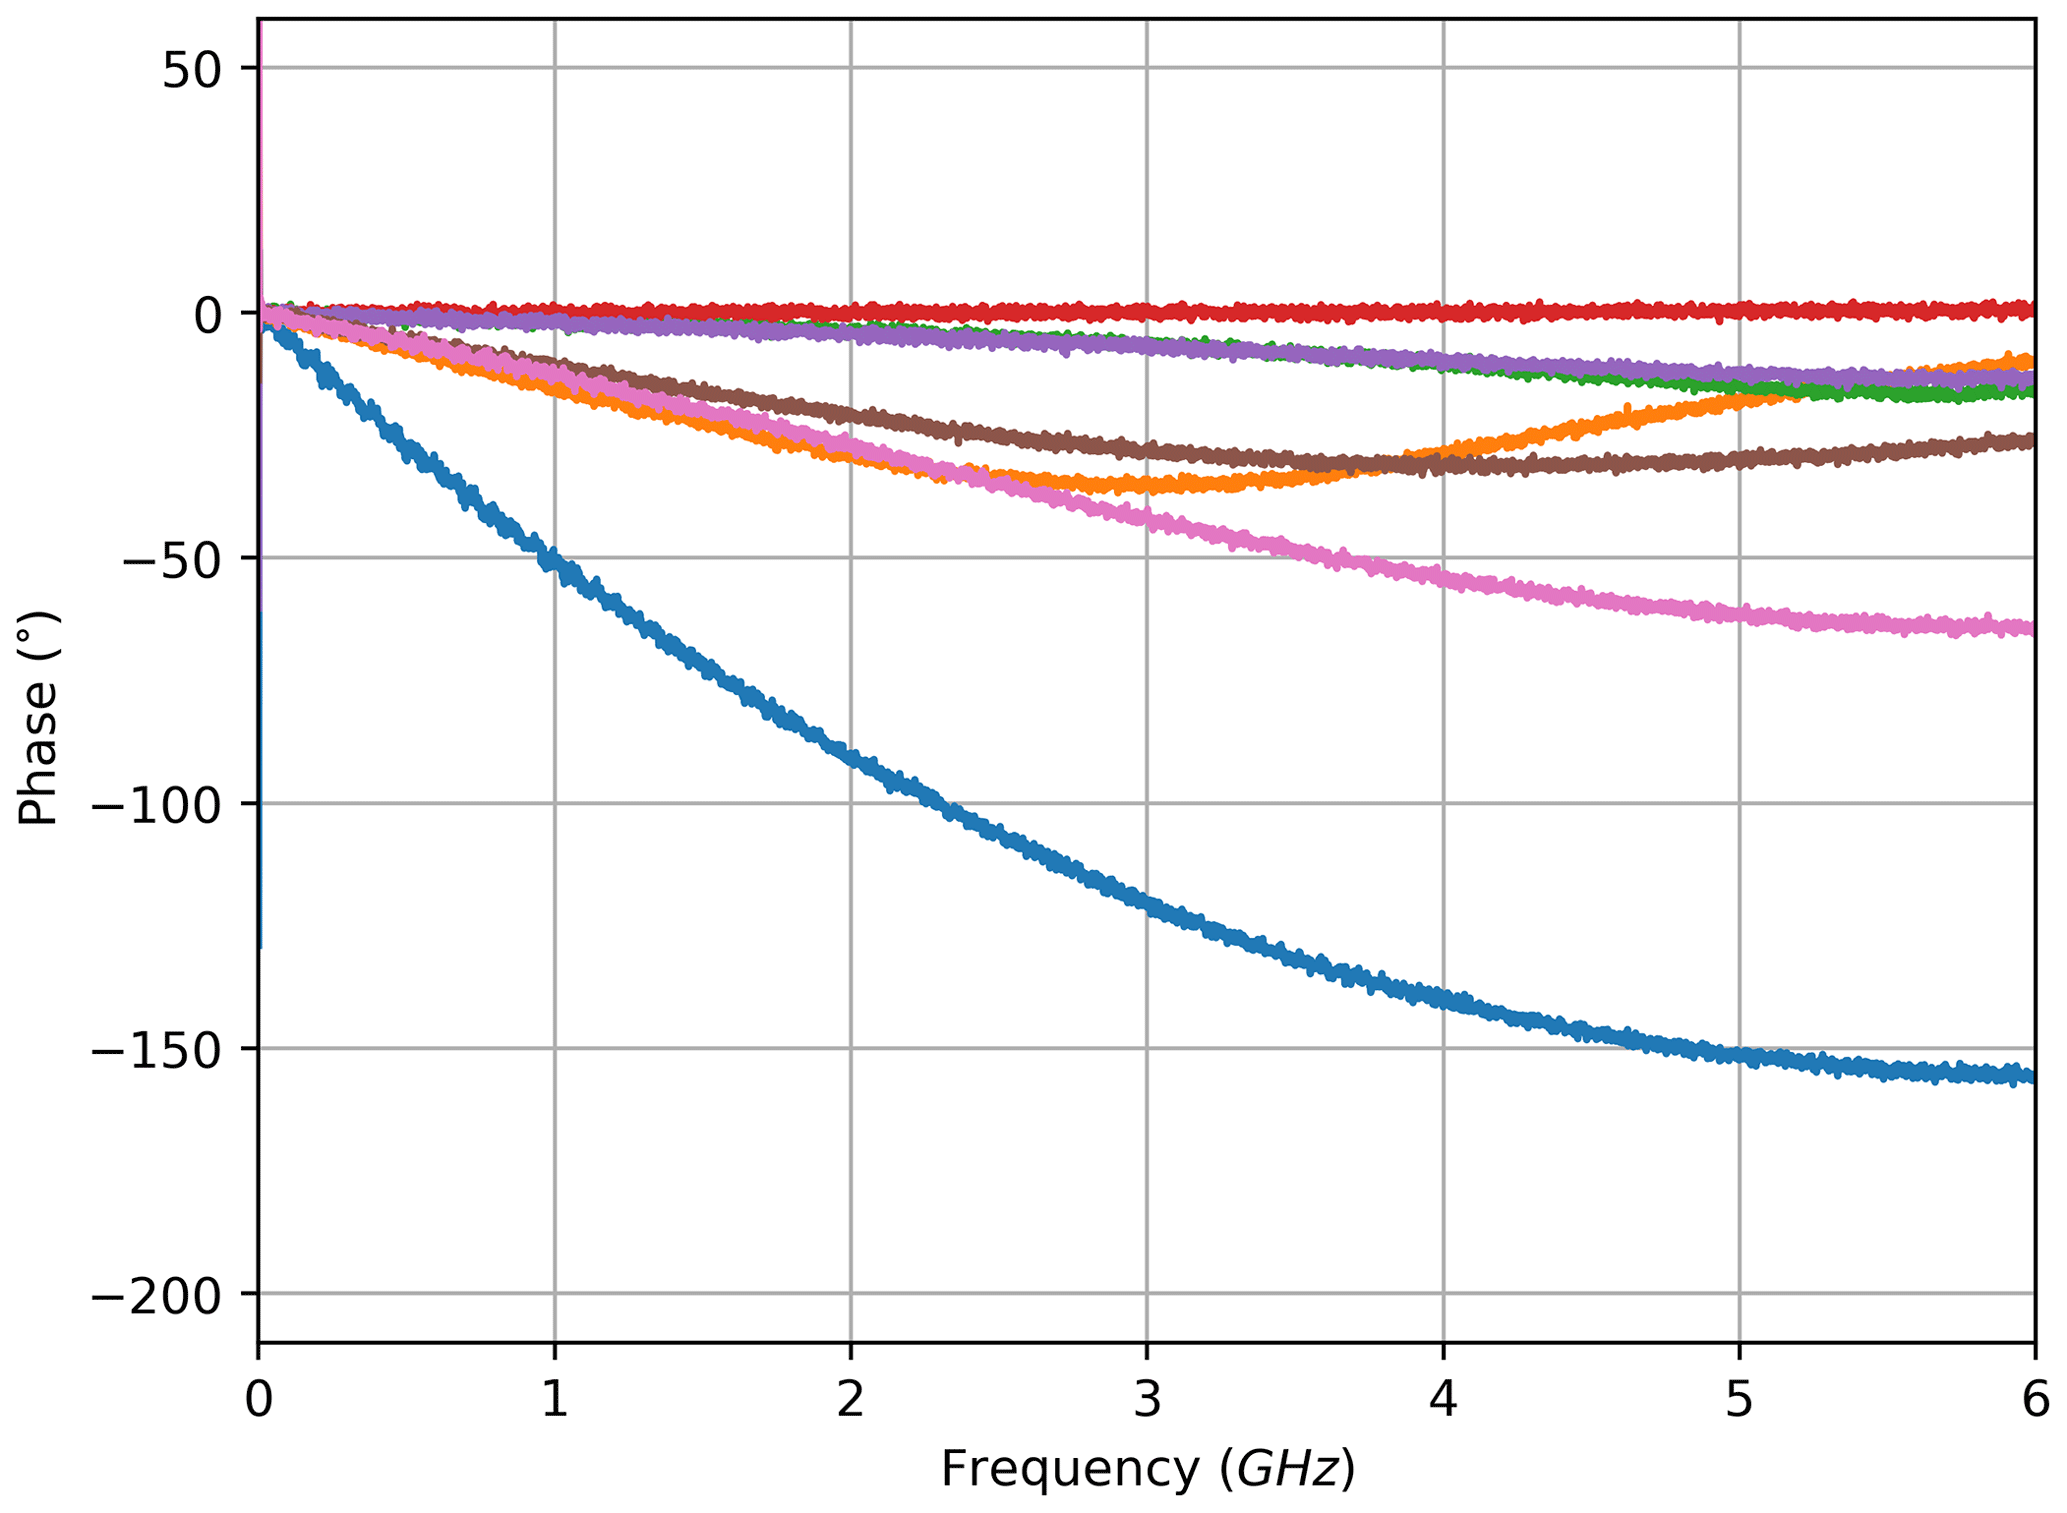
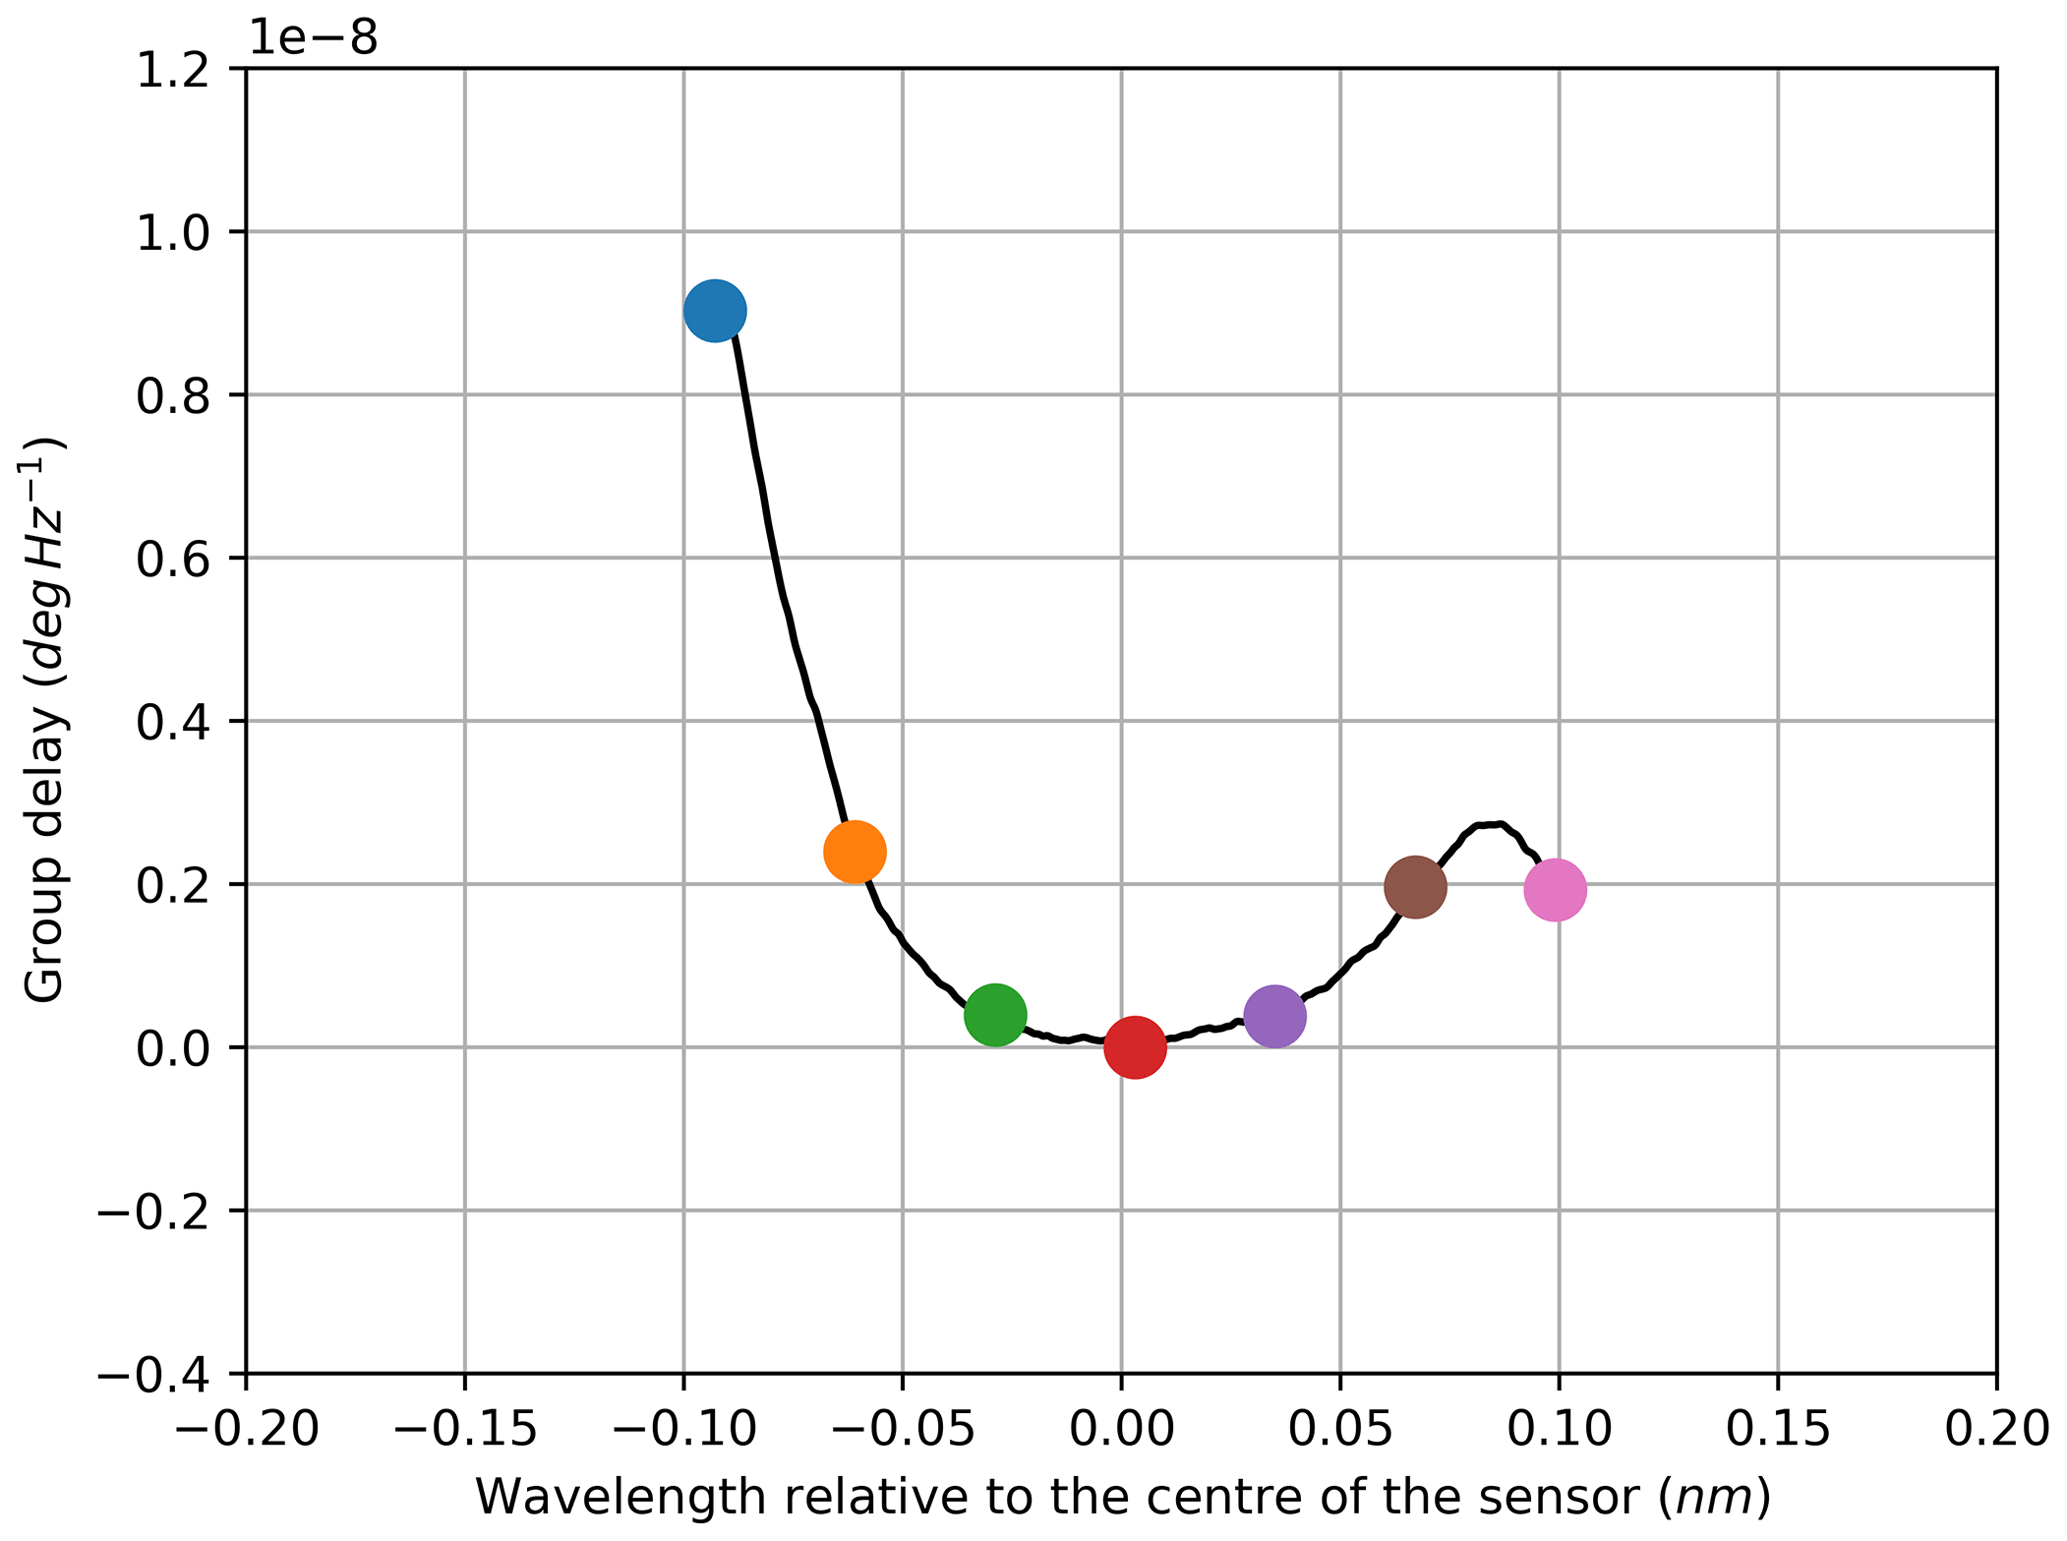
Figure 11Group delay derived from the electrical phase of an FBG in reflection configuration.
Additionally, the analogously back-traced filter characteristics for the transmission and reflection measurements of the cFBG are shown in Figs. 4 and 7. In comparison to the FBG, the filter characteristic spans over a wider range of wavelengths.
Because the S21 measurements performed with the VNA generate complex values for the amplitude, the phase information is included in the data. The corresponding phase characteristics are shown in Figs. 8, 12, 10 and 14. Based on the phase response, the group delay can be calculated according to Eq. (2) for each sampled wavelength. Again, this is implemented in a limited frequency band to avoid distortion resulting from the curvature of the phase characteristics at higher frequencies. The selected range starts at 1 MHz and stops at 301 MHz. The computed group delay characteristics are shown in Figs. 9, 13, 11 and 15. As before, the colour of the phase curves and the coloured dots in the group delay graphs highlight the affiliation to the respective amplitude curves.
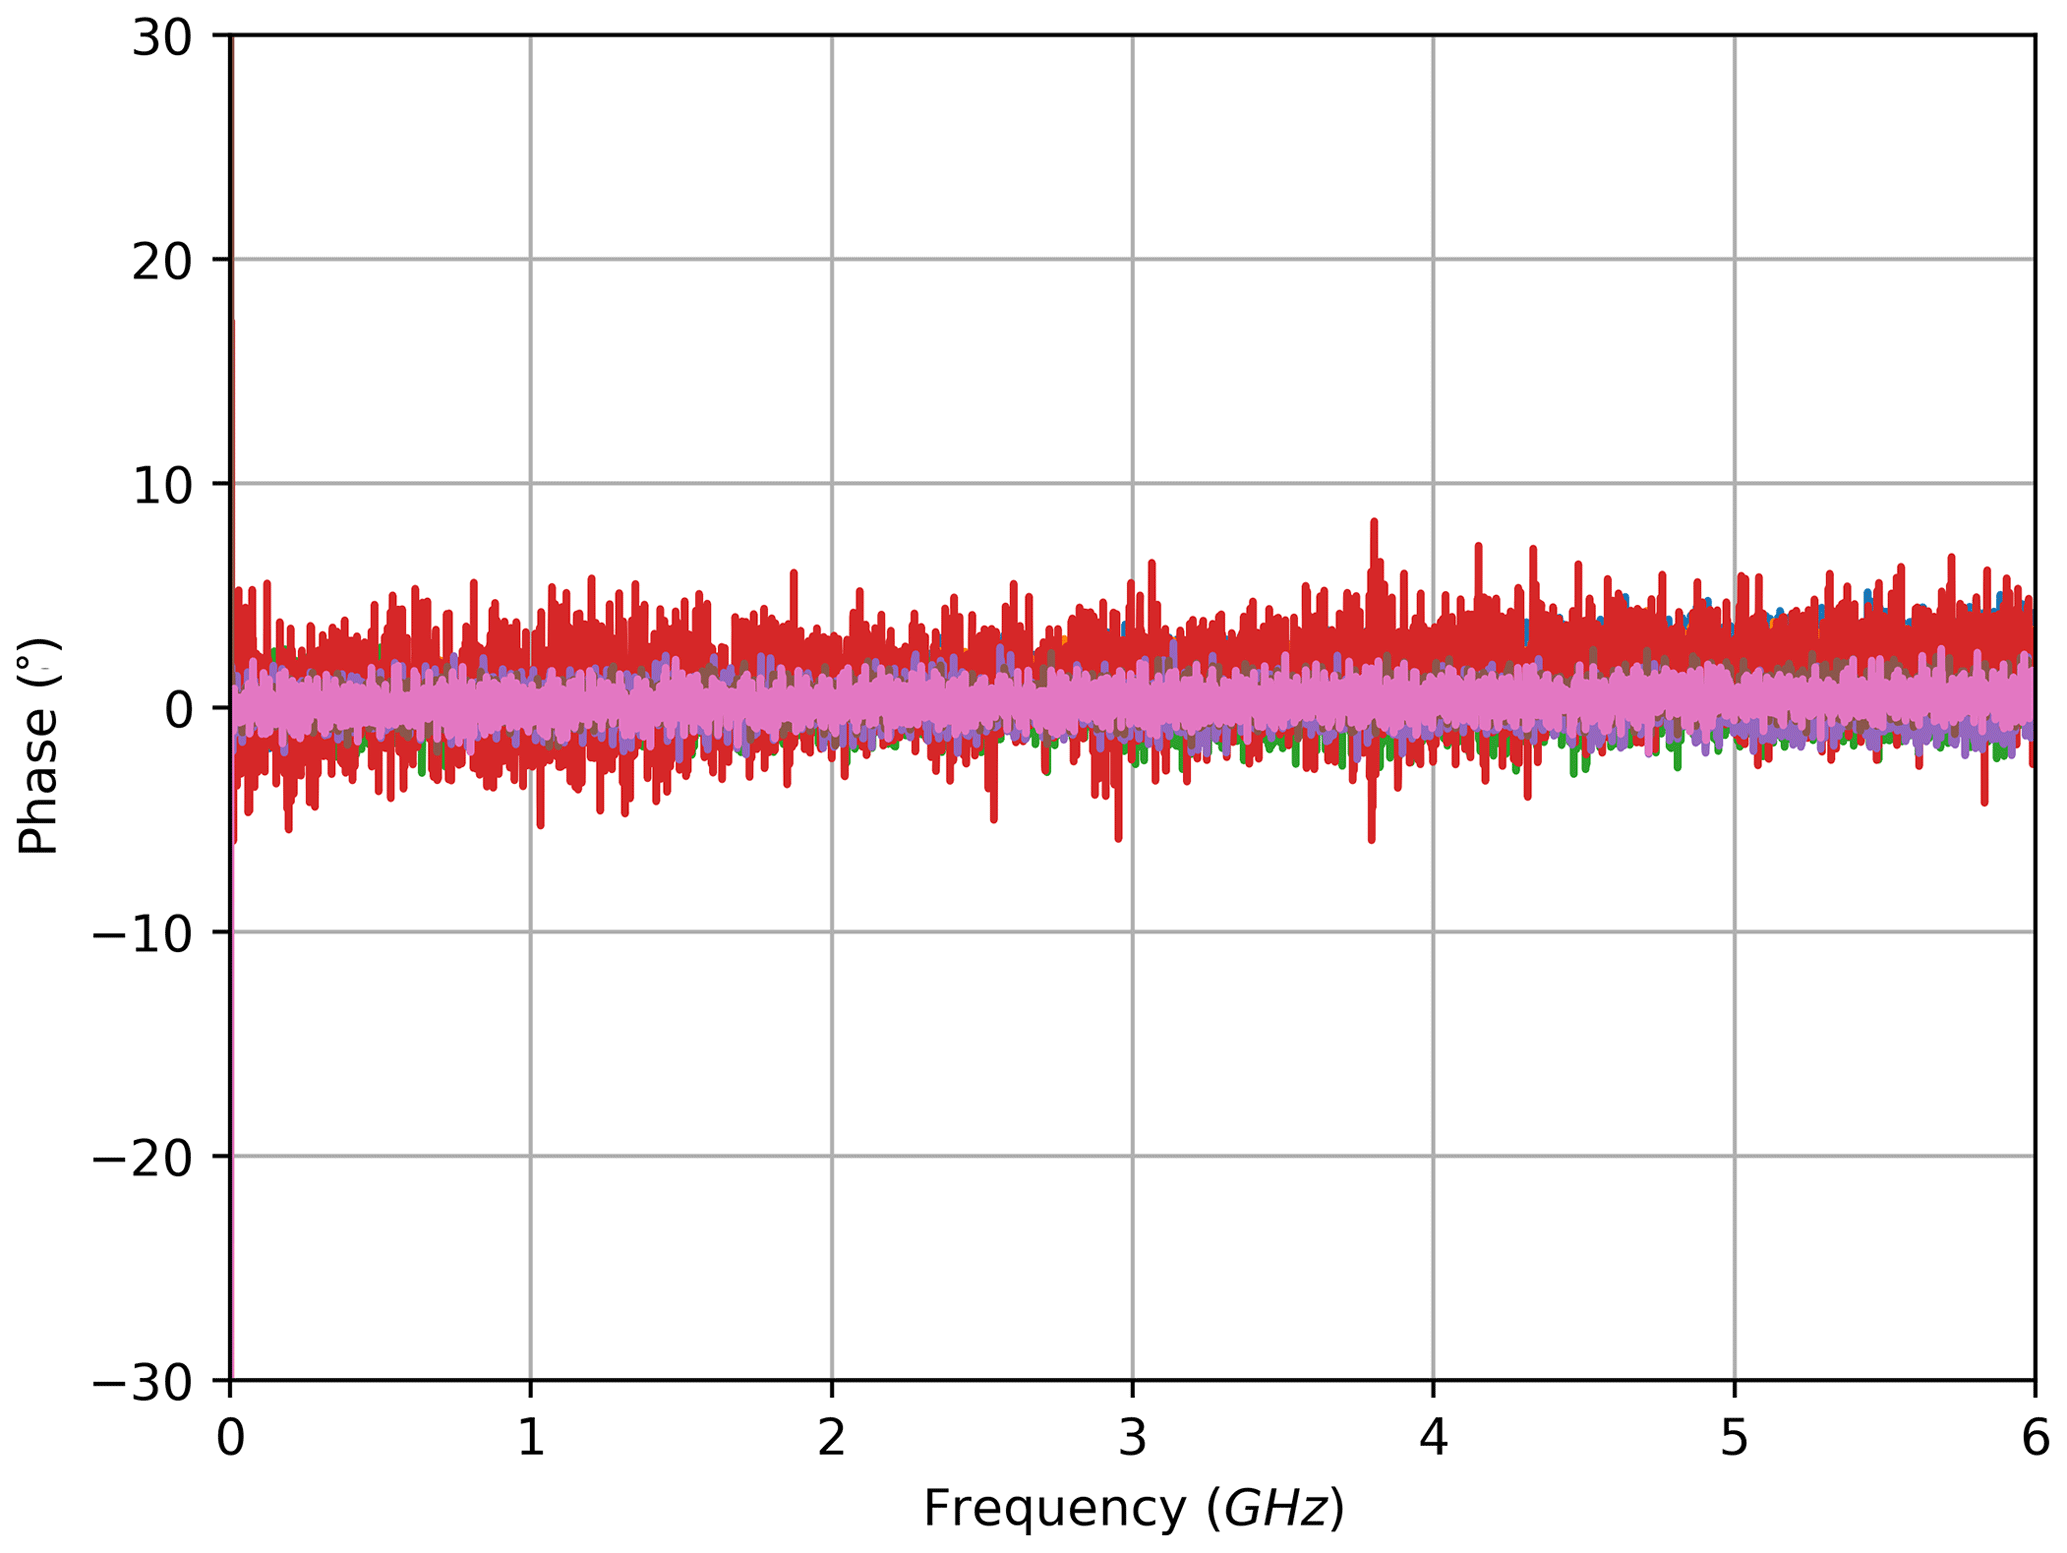
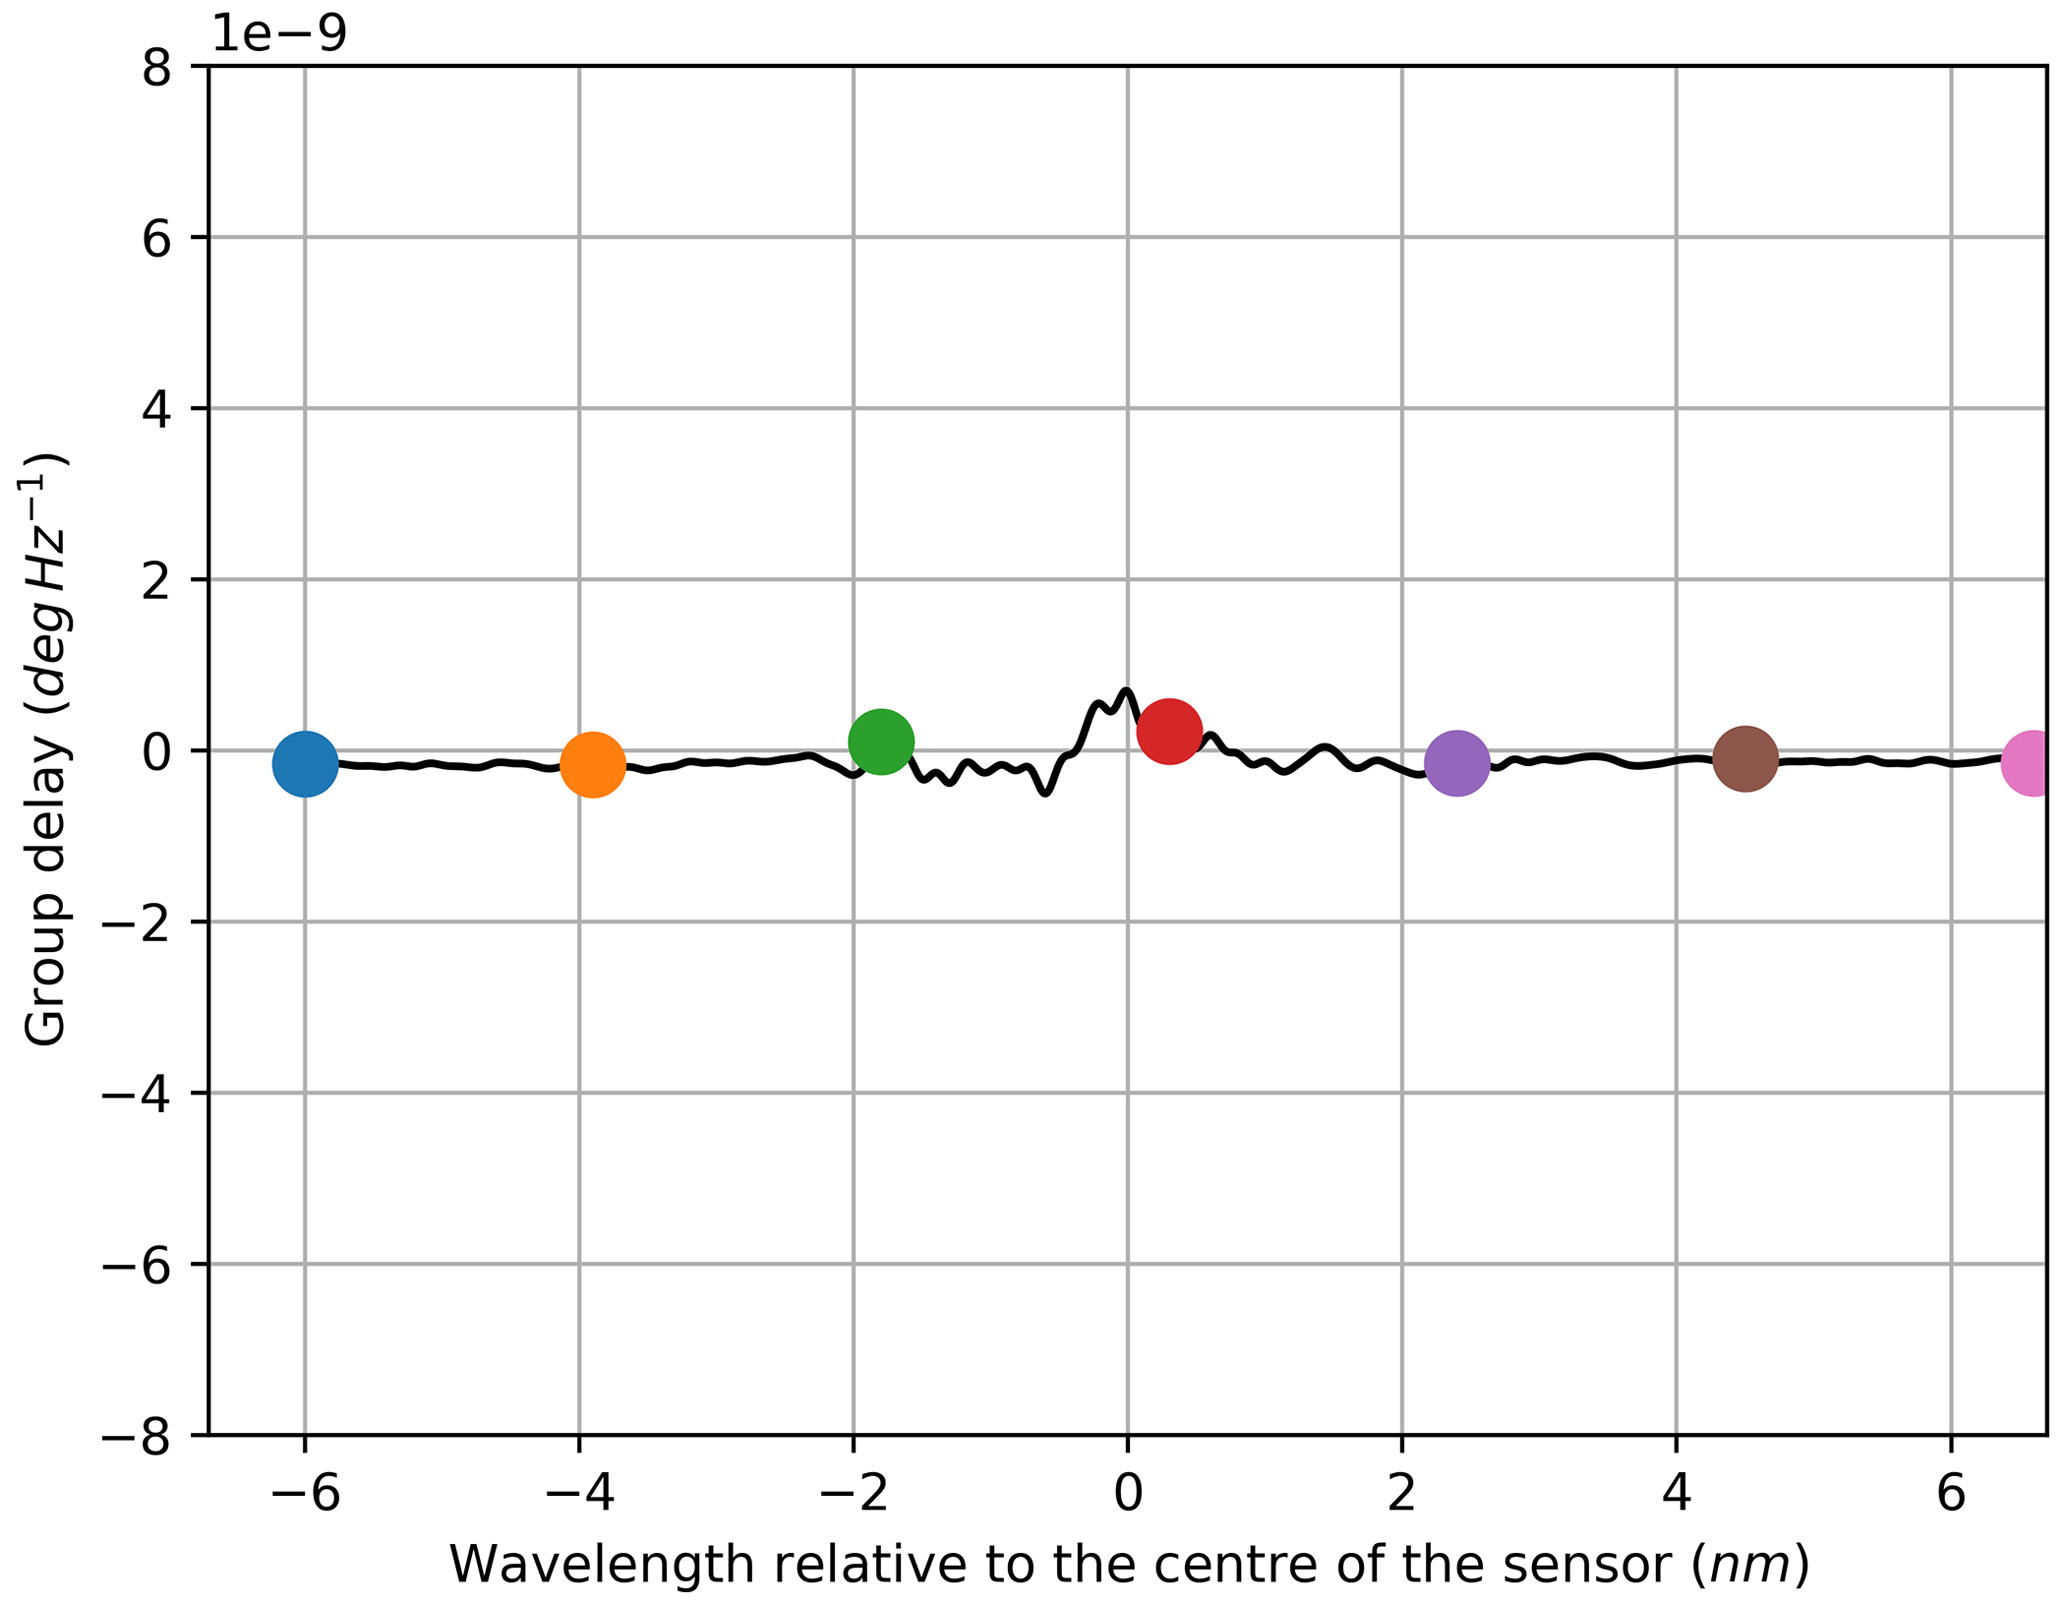
Figure 13Group delay derived from the electrical phase of a cFBG in transmission configuration.
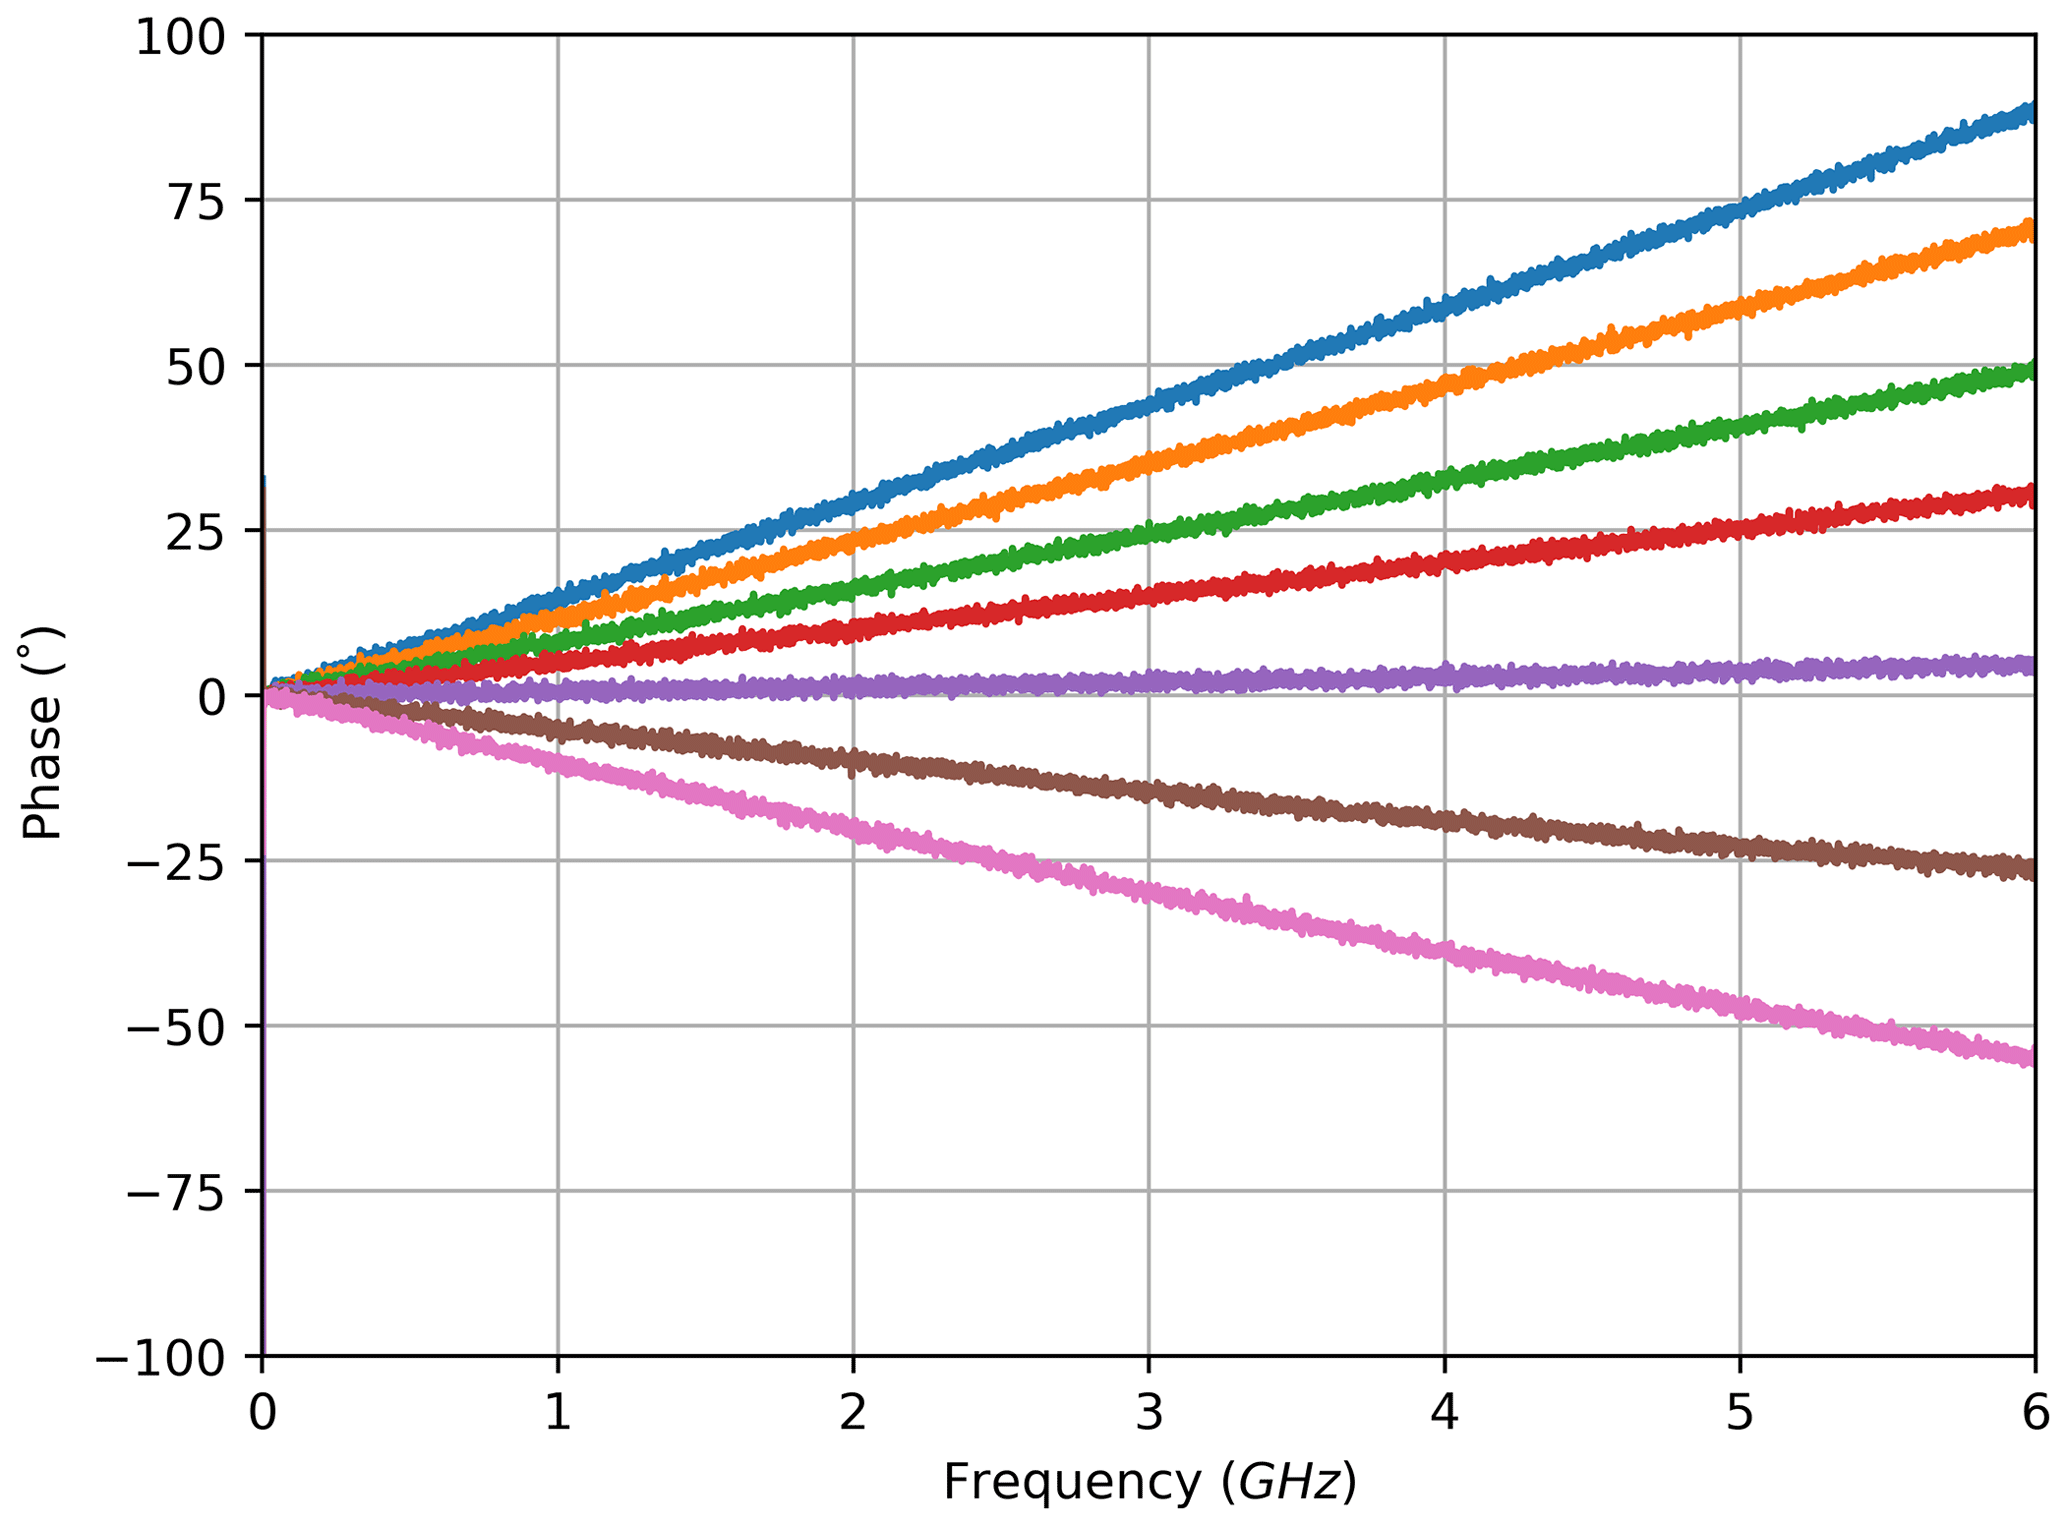

Figure 15Group delay derived from the electrical phase of a cFBG in reflection configuration.
5.1 Filter characteristic
The filter characteristics calculated from the electrical read-out match the conventionally acquired curves (Figs. 3 to 7). For the transmission experiment with the FBG, the electrically acquired curve has almost no deviation from the reference curve (Fig. 3). It is highly remarkable that the electrically derived transmission filter characteristic of the cFBG has much better sensitivity (Fig. 4). In comparison with the conventional optical read-out, the new approach is presumably less affected by the relative intensity noise (RIN) of the laser source, the amplified spontaneous emission (ASE) noise of the optical amplifier and the noise currents in the photodiode, which may lead to a better signal-to-noise ratio (SNR).
5.2 Phase and group delay
The stop-band attenuation of the grating is so high that, even with the better sensitivity of the electrical measurement, the phase measurements are still very noisy due to low amplitudes (Figs. 8, 12). For the same reason the derived results for the group delay are unrepresentative (Figs. 9, 13). In contrast to the transmission set-up, the reflection configuration shows very smooth phase and group delay curves within the wavelength range of the stop bands. This matches with the previously explained observations: because the stop band attenuates the signal strongly in transmission configuration, high noise ratios result, whereas the band-stop characteristic is flipped to a band-pass characteristic with resulting low attenuation in reflection configuration; therefore, the noise contribution in the latter remains very low in the same band. At the same time, the attenuation becomes very high outside the pass band, and the measurements become noisy. In order to only show reasonable data, both group delay graphs for the reflection configuration are cut to be displayed within the pass band. The fact that the group delay characteristic within the filter band is hardly useable in transmission configuration is advantageous, as the reflection configuration is preferred over the transmission set-up for most applications. This is due to the fact that only one port of the sensor has to be connected for the reflection variant, which reduces the cabling efforts and allows for the transmit module and the receiving evaluation module to be placed together or even integrated into one module.
5.3 Sideband effect
While the positively sloped phase measurements are a property of the calibration process (slower or faster propagation than at the reference wavelength), the positive and negative slopes of the amplitude curves depend on a different effect. They are a key property of the electrical evaluation and can be studied in Figs. 2 and 5. The underlying mechanism will be discussed in detail in this subsection.
The power of an optically modulated signal is split between the carrier and both sidebands. Considering the given measurement set-up, the light of the TLS acts as the optical carrier, while the sidebands are located symmetrically around it and their distance to the carrier is defined by the frequency of the modulating RF signal. Higher modulation frequencies mean a wider spectral separation of the sidebands. On the non-linear filter characteristic, this can lead to different attenuations of each sideband. Considering the coloured markers in Fig. 3, which correspond to the equally coloured amplitude graphs in Fig. 2, and using the measurement at the wavelength highlighted in green as an example, the following can be noted: with increasing modulation frequency, the sidebands move on the characteristic curve to each side of the carrier. The lower sideband (LSB) moves to the right, while the upper sideband (USB) moves to the left. For small frequencies, both sidebands remain within the almost linear slope of the curve, and the lower attenuation of the USB compensates for the higher attenuation of the LSB. Therefore, the impact of the rising frequency is negligible until one sideband leaves the linear range. The USB then remains at a low attenuation, while the LSB is attenuated further until it reaches the peak attenuation. This leads to a negative slope, which can be confirmed by the results shown in Fig. 2. Since the photodiode only yields the mixing product of both sidebands with the carrier, the results for wavelengths on the right slope of the characteristic curve do not differ systematically from the measurements on the left slope, except from asymmetries immanent to the sensor's filter curve. For all wavelengths near to the concave part of the filter curve, the presented effect produces a positive slope in amplitude. The same phenomenon can clearly be identified for the studies in reflection configuration (Fig. 5 vs. Fig. 6). For the measurement at the orange highlighted wavelength in Fig. 6, the described effect is even stronger as the LSB remains at the lowest attenuation from the beginning. Although the associated graphs of the amplitude frequency response are not included here, the sideband effect can still be discussed for cFBGs: in theory, it occurs too; however, for it to come into effect, the chosen modulation frequency has to be much higher due to the relatively broader FWHM and the less steeply sloped edges.
Besides the potentially different attenuation, the group delay can also diverge for both sidebands. As for the amplitude, the relative phase of both sidebands to each other depends on their distance and location in the group delay characteristic, where the former depends on the modulation frequency and the latter depends on the carrier wavelength. The effect can be identified in the phase response diagrams, where the phase graphs are non-linear for growing frequencies because the sidebands are shifted apart on the group delay graph. As the sidebands are superimposed by the photodiode, they will interfere constructively or destructively depending on their relative phase to each other. This influence is less intuitive to identify by analysing the group delay characteristics and the amplitude frequency response. Hence, the complete sideband effect will be modelled mathematically in the next subsection.
5.4 Mathematical model
To validate the stated theory, the electrical amplitude curves can be modelled analytically according to the expected principle based on the measured filter characteristics for amplitude and group delay. The characteristics are calculated from small bands of low frequencies. This approach approximately equals an unmodulated measurement. Following this, both extracted characteristics are not affected by the phenomenon investigated. All subsequent considerations are normalised to a theoretical total incident optical power of 0 dBm, so the amplitudes can be calculated with the attenuations.

Being a square-law device, the photodiode mixes the spectral components of the incident optical signal and provides an electrical signal at its output. This means that the amplitude of the photocurrent of the component at the RF modulation frequency is composed of the powers of the optical carrier Ac and both sidebands Asb:
The carrier amplitude Ac is read off the amplitude characteristic A(λ) at the particular wavelength λc of the TLS. Additionally, the modulation index m has to be taken into account:
During the experiments a modulation index of m=0.995 was used. The total sideband amplitude Asb is the sum of the amplitude of the lower sideband Alsb and the amplitude of the upper sideband Ausb, multiplied by the modulation index:
while
applies for each sideband. The local amplitude A(λlsb|usb) is read off the amplitude characteristic at the particular sideband wavelength λlsb|usb which depends on the carrier wavelength λc and the modulation frequency fmod according to
where c is the speed of light. The phase of each sideband ϕlsb|usb is calculated as follows:
where the group delay τg(λlsb|usb) is read off the group delay characteristic at the particular sideband wavelength λlsb|usb.
Following the previous model, a synthetic frequency sweep can be performed for each wavelength of the filter, and the resulting electrical amplitude curves can be calculated. A problem occurs when any sideband leaves the definition range of the group delay characteristic. Although the group delay is supposedly not zero outside of the known range, it is set to zero for the modelling. This definition implies that the model becomes invalid as soon as one sideband leaves the known range of the group delay. However, as the amplitudes are small outside the known range, this simplification has been regarded as acceptable.
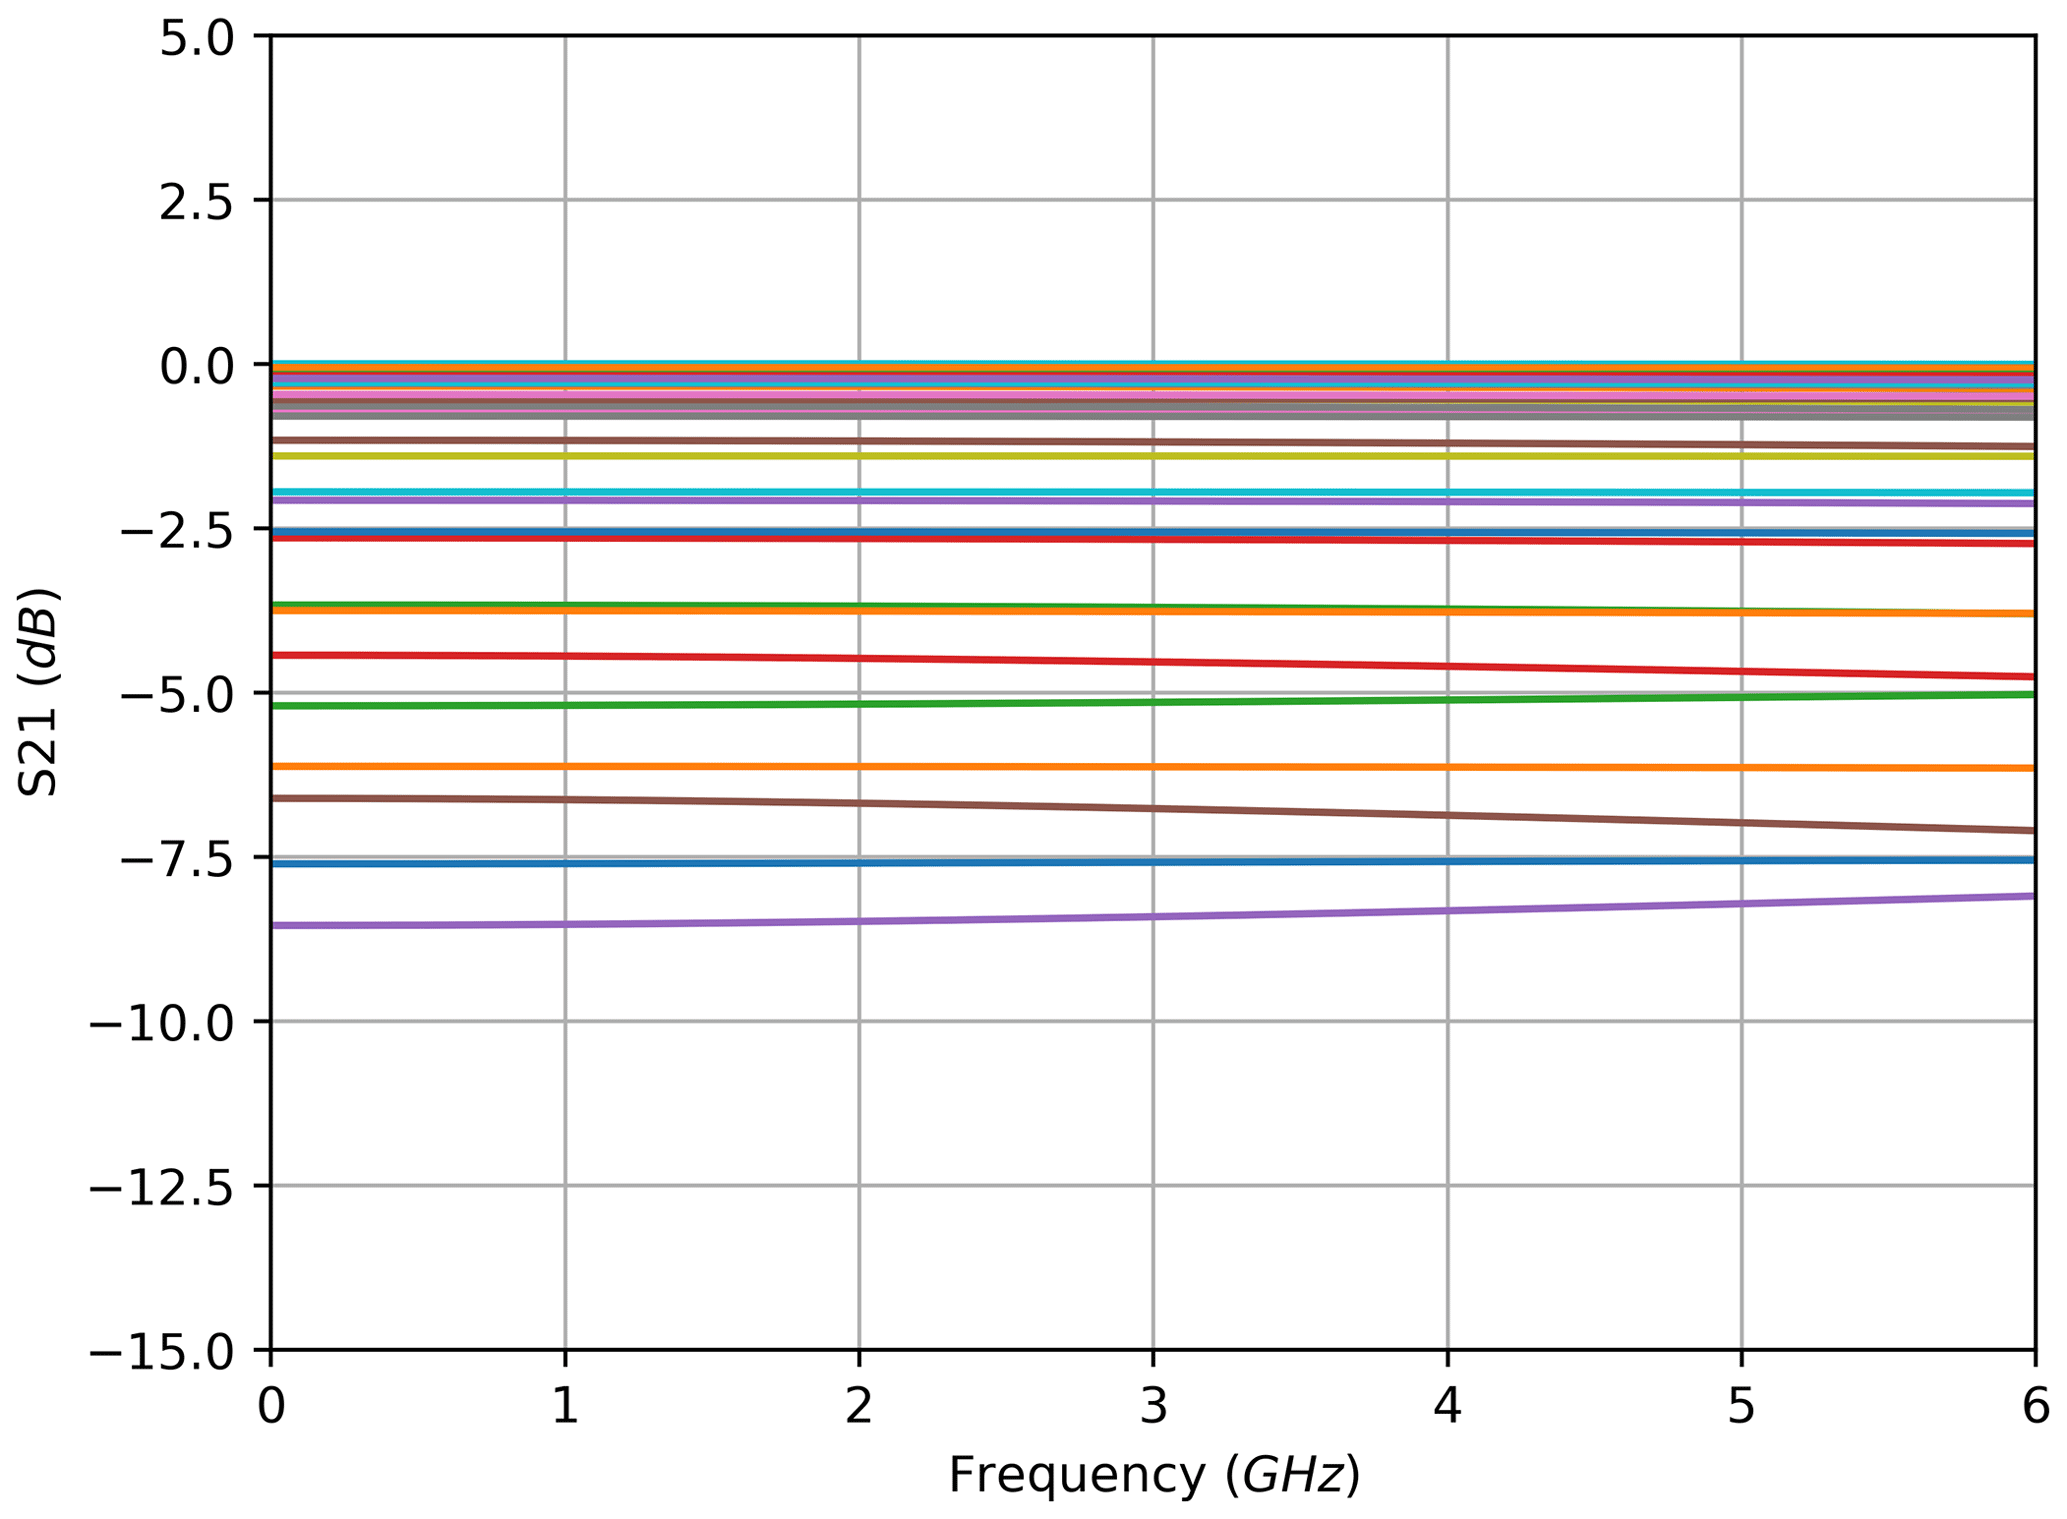
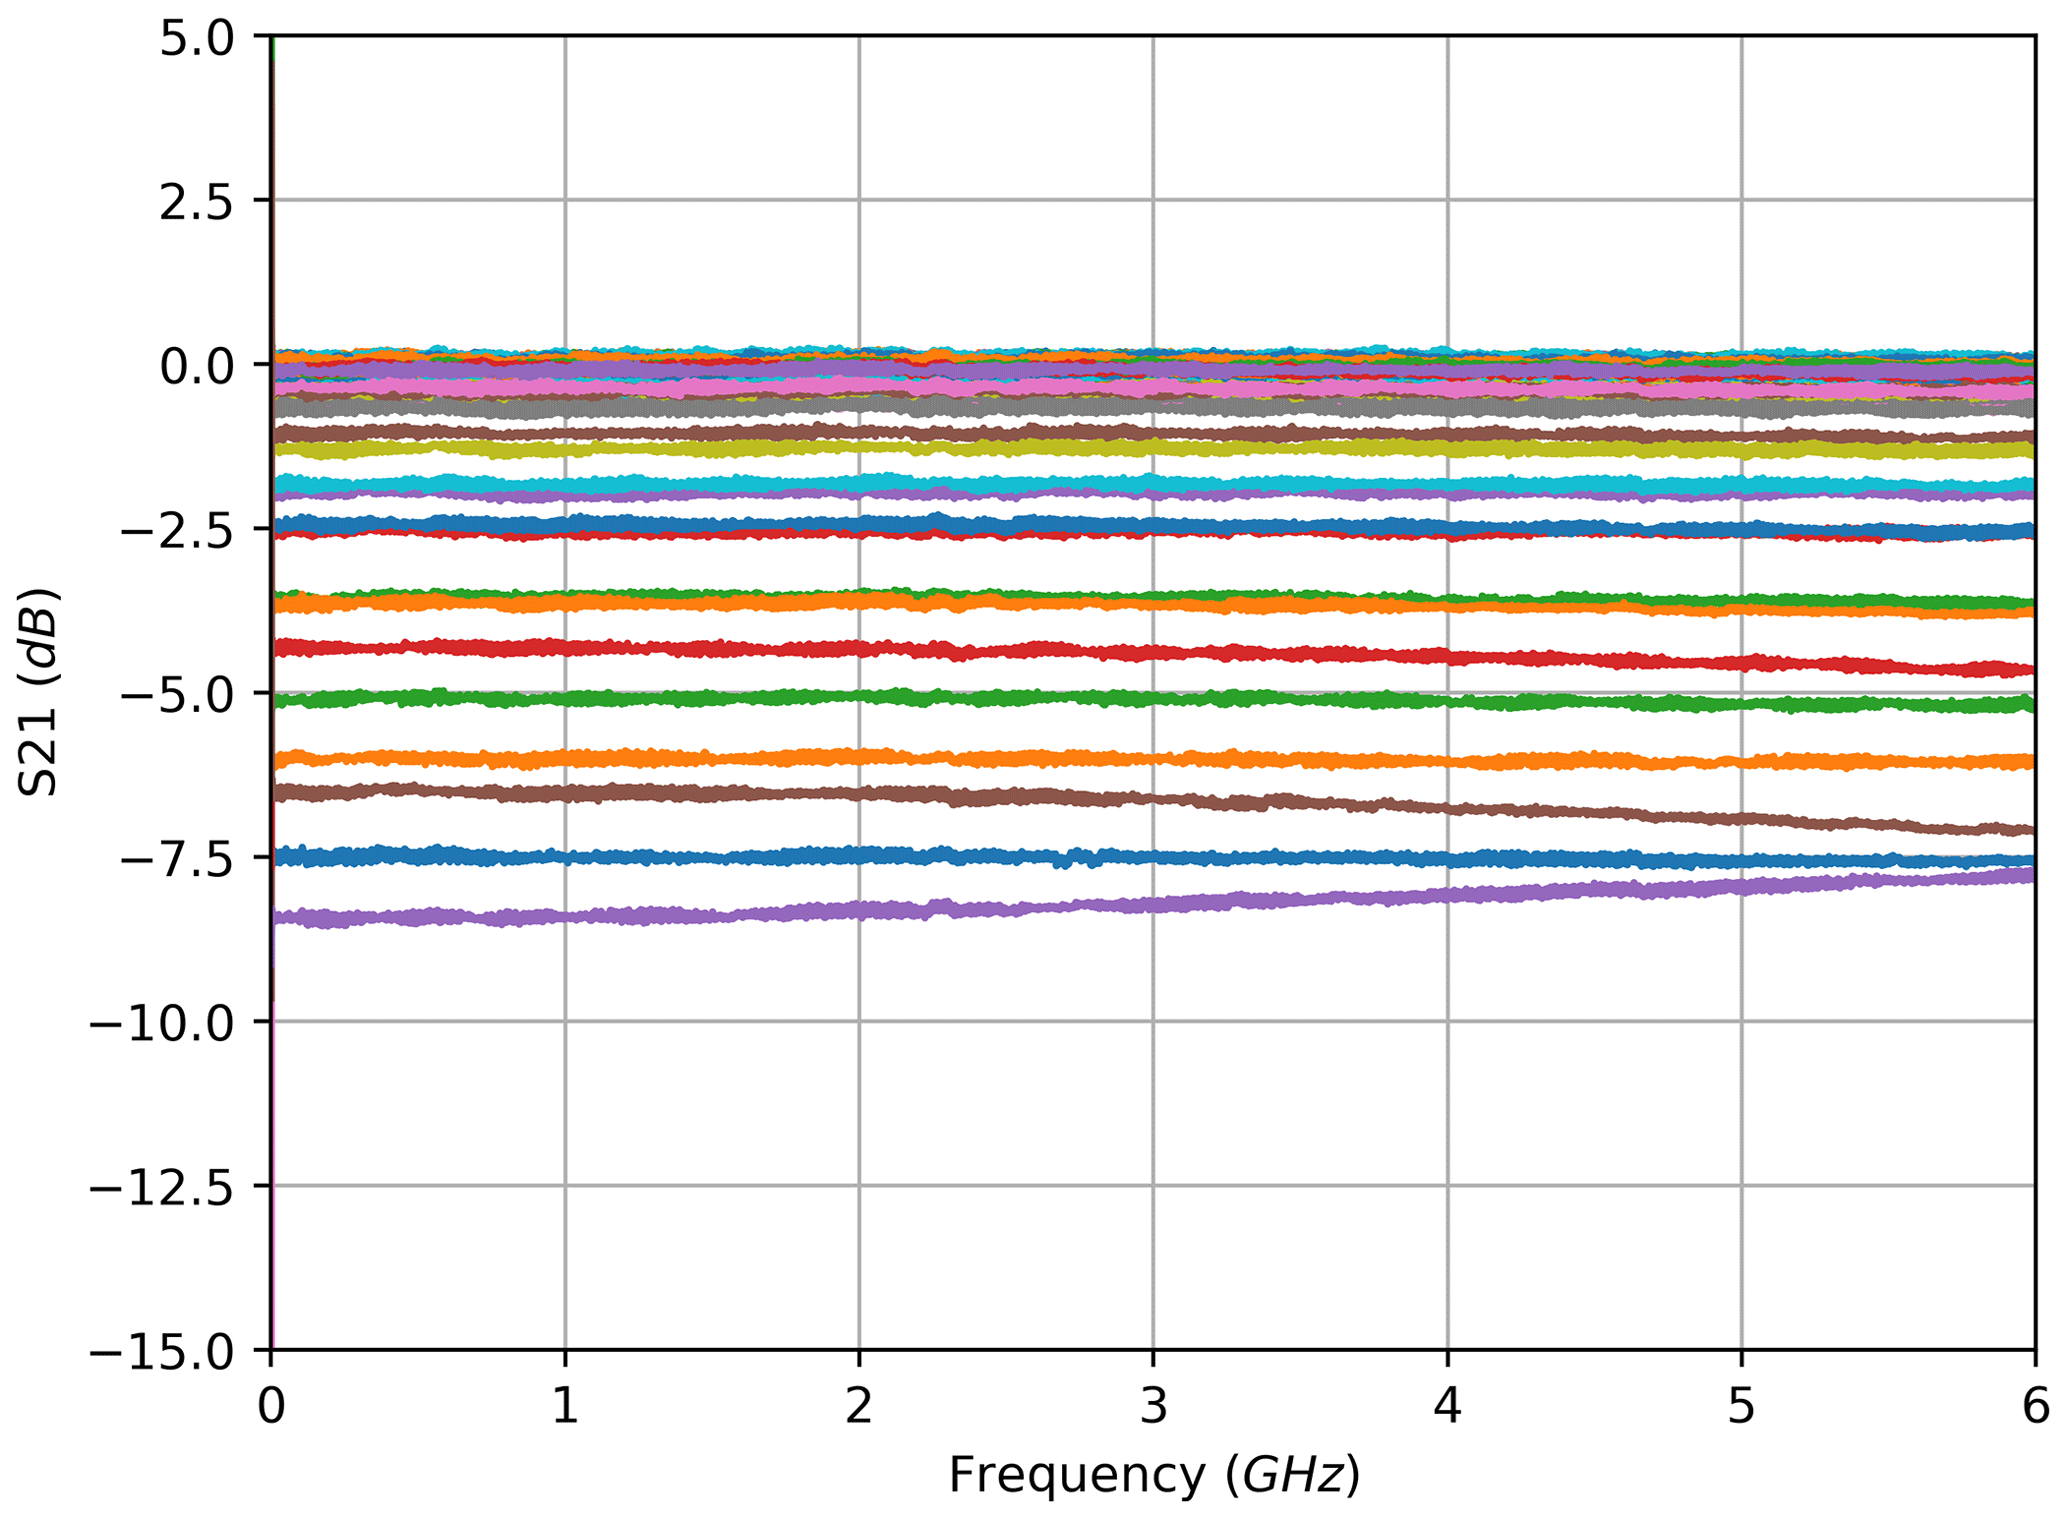
The results of the sideband effect synthesis are depicted in Fig. 16 for the FBG and in Fig. 18 for the cFBG. Compared to the corresponding measurements in Figs. 17 and 19, the courses of curves show up as expected. Regarding higher frequencies, the deviations from the measurements increase, especially for wavelengths at the edges of the FBG, which was expected due to the limited knowledge of the group delay in the outer ranges. For the cFBG, the same trend can be observed but with a much smaller impact. This difference results from the lower dynamic range of the group delay on one side and the smaller ratio of the modulation frequency to the spectral filter width on the other side. In general, all synthetically generated data essentially match the measured data.
In conclusion, the sideband effect discussed is an interesting property that has to be taken into account when choosing the RF modulation frequency in RoF set-ups or other applications where the laser source is modulated. However, it can also help to determine several characteristics of FBGs without needing to sweep the laser wavelength, e.g. the spectral position of the filter edges.
In this paper, the electrical read-out of optical sensors has been studied using fibre Bragg gratings and an RF-modulated laser source. An introduction to optical sensors, their manifold measurement abilities and the conventional optical read-out has been given. Furthermore, the context of radio-over-fibre applications has been pointed out, which is where the novel approach originates from. The results have shown new possibilities regarding the evaluation of optical sensors, such as the evaluation of the electrical phase and the group delay. In this context, the potentials and limitations of measurements in transmission vs. reflection configuration have been discussed. Furthermore, it has been revealed that the filter characteristic of an optical sensor affects the shape of the measured electrical amplitude curves. This effect has to be taken into account when reconstructing filter characteristics by electrical read-out in order to avoid distortion as an impact of asymmetrical sideband power distribution. Therefore, the precise reconstruction of filter characteristics from electrical S21 amplitude measurements should be conducted in small ranges of low frequencies only or corrected accordingly. A comparison to conventionally obtained filter characteristics can reveal the differences and help to understand the phenomenon, but it is not necessary for the modelling nor the application of the electrical read-out principle. Future investigations will cover the influence of the modulation index on the electrical read-out method, the evaluation of further sensor types (e.g. long period gratings and phase-shifted FBGs) and the applicability of the discussed evaluation principle within real measurement scenarios.
Research data are available upon request from the authors.
UN was responsible for the conceptualisation, data curation, formal analysis, investigation, methodology, software, validation, visualisation and writing the original draft of the paper. NN contributed to the conceptualisation, the formal analysis, funding acquisition, investigation, methodology, project administration, supervision, validation, and reviewing and editing the paper. XW was responsible for the investigation and validation. DP contributed to the funding acquisition, project administration, resources and supervision. TT contributed to the conceptualisation, funding acquisition, project administration, resources and validation. KK was responsible for the conceptualisation, investigation, methodology, project administration and validation.
The authors declare that they have no conflict of interest.
This article is part of the special issue “Sensors and Measurement Systems 2019”. It is a result of the “Sensoren und Messsysteme 2019, 20. ITG-/GMA-Fachtagung”, Nuremberg, Germany, 25–26 June 2019.
This paper is an extended version of the original publication “Microwave based electrical read-out of optical sensors” (Nordmeyer et al., 2019).
This research has been supported by the EU and the Free State of Saxony as part of the “OSMAT” project within the framework of ESF-InnoTeam (SAB no. 100329864). Open-access funding has been provided by the Publication Fund of the TU Dresden.
This paper was edited by Eberhard Manske and reviewed by two anonymous referees.
Erdogan, T.: Fiber grating spectra, J. Lightwave Technol., 15, 1277–1294, https://doi.org/10.1109/50.618322, 1997. a, b, c
Fu, H., Chen, D., and Cai, Z.: Fiber Sensor Systems Based on Fiber Laser and Microwave Photonic Technologies, Sensors, 12, 5395–5419, https://doi.org/10.3390/s120505395, 2012. a
Gagliardi, G., Salza, M., Ferraro, P., and De Natale, P.: Fiber Bragg-grating strain sensor interrogation using laser radio-frequency modulation, Opt. Express, 13, 2377–2384, https://doi.org/10.1364/OPEX.13.002377, 2005. a
Giles, C. R.: Lightwave applications of fiber Bragg gratings, J. Lightwave Technol., 15, 1391–1404, https://doi.org/10.1109/50.618357, 1997. a
Hill, K. O. and Meltz, G.: Fiber Bragg grating technology fundamentals and overview, J. Lightwave Technol., 15, 1263–1276, https://doi.org/10.1109/50.618320, 1997. a
Hill, K. O., Bilodeau, F., Malo, B., Kitagawa, T., Thériault, S., Johnson, D. C., Albert, J., and Takiguchi, K.: Chirped in-fiber Bragg gratings for compensation of optical-fiber dispersion, Opt. Lett., 19, 1314–1316, https://doi.org/10.1364/OL.19.001314, 1994. a
James, S. and Tatam, R.: Optical fibre long-period grating sensors: Characteristics and application, Meas. Sci. Technol., 14, R49–R61, https://doi.org/10.1088/0957-0233/14/5/201, 2003. a
Liu, W., Fu, H., Zhang, A. P., and He, S.: Fiber Bragg Grating Based Wireless Sensor Module With Modulated Radio-Frequency Signal, IEEE Microw. Wirel. Co., 20, 358–360, https://doi.org/10.1109/LMWC.2010.2047534, 2010. a
Nanyan, N. F., Ngah, R., Prakoso, T., Rahayu, Y., and Rahman, T. A.: An active downlink photonic antenna, in: International Conference On Photonics 2010, 11–15 December 2010, Guwahati, India, 1–5, https://doi.org/10.1109/ICP.2010.5604378, 2010. a
Neumann, N., Trieb, R., Benedix, W., and Plettemeier, D.: Active integrated photonic antenna array, in: 2012 IEEE-APS Topical Conference on Antennas and Propagation in Wireless Communications (APWC), 2–7 September 2012, Cape Town, South Africa, 648–651, https://doi.org/10.1109/APWC.2012.6324933, 2012. a
Neumann, N., Frach, S., and Plettemeier, D.: Active integrated fiber-coupled receiving antenna, in: 2013 Loughborough Antennas Propagation Conference (LAPC), 11–12 November 2013, Loughborough, UK, 65–268, https://doi.org/10.1109/LAPC.2013.6711897, 2013. a
Neumann, N., Schuster, T., and Plettemeier, D.: Novel approach for simultaneous wireless transmission and evaluation of optical sensors, in: SPIE/COS Photonics Asia, 9–11 October 2014, Beijing, China, Advanced Sensor Systems and Applications VI, SPIE, vol. 9274, 1–9, https://doi.org/10.1117/12.2070053, 2014a. a, b
Neumann, N., Trieb, R., Frach, S., and Plettemeier, D.: FTTA System Demo Using Optical Fiber-Coupled Active Antennas, Photonics, 1, 198–210, https://doi.org/10.3390/photonics1030198, 2014b. a
Neumann, N., Schuster, T., Haentzsche, E., Nocke, A., and Plettemeier, D.: Wireless Read-Out of Optical Fiber Sensors, in: Beiträge der 18. ITG/GMA-Fachtagung, 30 May–1 June 2017, Nürnberg, Germany, Sensoren und Messsysteme, VDE Verlag, Berlin, Germany, 197–201, https://doi.org/10.5162/sensoren2019/2.1.2, 2017. a, b
Nordmeyer, U., Neumann, N., Wang, X., Thiel, T., Kojucharow, K., and Plettemeier, D.: Microwave based Electrical Read-Out of Optical Sensors, in: Beiträge der 20. ITG/GMA-Fachtagung, 25–26 June 2019, Nürnberg, Germany, Sensoren und Messsysteme, VDE Verlag, Berlin, Germany, 119–124, https://doi.org/10.5162/sensoren2019/2.1.2, 2019. a
Ouellette, F.: Dispersion cancellation using linearly chirped Bragg grating filters in optical waveguides, Opt. Lett., 12, 847–849, https://doi.org/10.1364/OL.12.000847, 1987. a
Prakoso, T., Ngah, R., Abd Rahman, T., Chude Okonkwo, U., and Ghassemlooy, Z.: An evaluation of half-cut technique for microwave-photonic access-point antenna miniaturization, in: 2011 IEEE International RF Microwave Conference, 12–14 December 2011, Seremban, Negeri Sembilan, Malaysia, 384–388, https://doi.org/10.1109/RFM.2011.6168773, 2011. a
Schuster, T., Herschel, R., Neumann, N., and Schaeffer, C.: Miniaturized Long-Period Fiber Grating Assisted Surface Plasmon Resonance Sensor, J. Lightwave Technol., 30, 1003–1008, https://doi.org/10.1109/JLT.2011.2166756, 2012. a
Yashchyshyn, Y., Chizh, A., Malyshev, S., and Modelski, J.: Technologies and applications of microwave photonic antennas, in: 2010 International Conference on Modern Problems of Radio Engineering, Telecommunications and Computer Science (TCSET), 23–27 February 2010, Lviv, Ukraine, 11–14, 2010. a