the Creative Commons Attribution 4.0 License.
the Creative Commons Attribution 4.0 License.
 | 20 Aug 2020
Optimization of soot deposition by high-temperature prepolarization of a resistive particulate matter sensor
Jens Ebel
Carolin Schilling
Holger Fritze
For the purposes of the onboard diagnosis (OBD) of diesel particulate filters (DPFs) in diesel exhaust treatment systems, a particulate matter (PM) sensor is applied downstream from the DPFs to detect small amounts of diesel soot that passed through the filter. The state-of-the-art technology is a sensor based on the resistive measurement principle, i.e., charged soot particles are attracted by electrophoretic forces, deposited on an interdigital electrode (IDE) structure and conductive soot bridges that reduce the overall resistance are formed. This paper reports how the response time of a resistively working particulate matter sensor can be shortened up to 30 % by the optimization of soot deposition that is initiated by a change in the sensor operation strategy. The measurement voltage is applied for prepolarization during the sensor regeneration phase rather than during the cooling phase before the measurement is commonly done. Experiments were performed at diesel engine test benches to examine this context and simulations of the electric field above and below the IDE structure. The data are used to deduct a model, including the solid state chemistry of the sensor's ceramic materials, the effect of impurities on the electric field properties and the interconnection with the soot deposition, which defines the sensor's response.
- Article
(3552 KB) - Full-text XML
- BibTeX
- EndNote


Particulate matter (PM) emissions of internal combustion engines, especially diesel combustion, are said to cause serious health problems (Newell et al., 2017). The state-of-the-art technology to reduce PM emissions in automotive exhaust aftertreatments includes ceramic wall flow diesel particulate matter filters (DPFs) which need to be regenerated when the PM load reaches a certain level. Two pressure sensors mounted up- and downstream from the DPFs monitor the differential pressure, which is used in combination with the engine specific emission model to predict the filter load (Guan et al., 2015). To ensure onboard diagnosis (OBD) of the DPFs, a PM sensor is applied downstream from the DPFs to detect soot particles passing through the filter in case of a malfunction (Bargende et al., 2016; Ochs et al., 2010). Tightening emission limits in worldwide legislation requires the development of more sensitive and faster sensors. Since the introduction of the European emission standards' Euro 5 regulations in 2009, the particle number (PN) is also strictly regulated and PM emissions for diesel and gasoline engines are treated equally. PM emitted by gasoline engines is smaller in size compared to diesel PM, so in the case of a future gasoline particulate matter filter (GPF) OBD for very low masses needs to be detected to ensure that the PN limit holds (Harris and Maricq, 2001). The most promising approach for transducing PM into an analog signal is the resistive (sometimes called conductometric) measurement principle based on the electrophoretic deposition of charged soot particles at an planar interdigital electrode (IDE; Kamimoto, 2017). Conductive bridges formed by soot particles lower the overall IDE resistance. The current flow over these soot bridges is the sensor signal, and its temporal course can be correlated with the emitted soot mass. Recent studies by Grondin et al. claim to obtain information about the PN from resistive sensors by evaluating the drops and jumps of the measured resistance curve due to the soot bridge destruction caused by the Joule effect (Grondin et al., 2019). As a way to shorten the response time, Middelburg discussed the possibility of transducing PM into a chance of permittivity, which is caused by the movement of soot dendrites before they form conductive bridges by alternating current (AC) measurements (Middelburg et al., 2020).
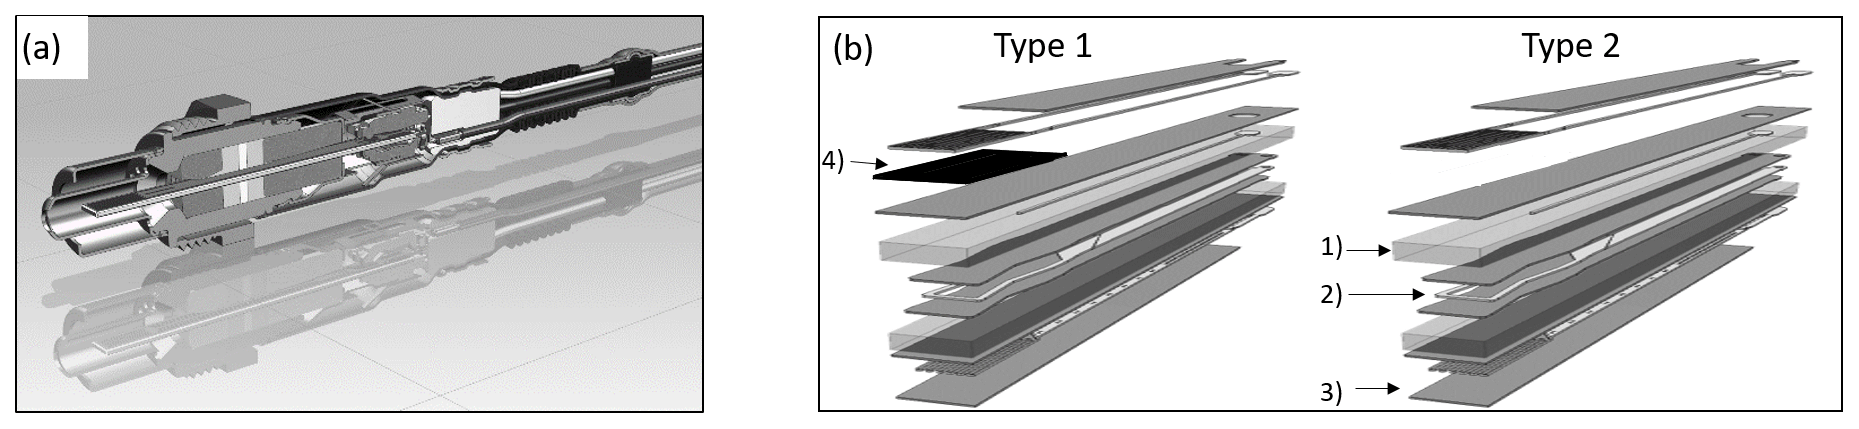
Figure 1(a) Cross section of a Bosch PM2.2 sensor. (b) Enlarged views of sensor element types 1 and 2. Materials from light to dark gray: (1) yttria-stabilized zirconia (YSZ), (2) platinum, (3) Al2O3 and (4) Al2−xFexO3.
This study shows how the soot deposition mechanism of a commercial PM sensor from Bosch can be optimized by the adaption of an operating strategy regarding the course of IDE voltage and sensor temperature. Thanks to this optimization, more conductive soot bridges are formed with the same number of particles, and the sensor response time is reduced by up to 30 % compared to the regular operating strategy at equal experimental conditions.
For all presented measurements, PM sensors made by Bosch (Robert Bosch GmbH, Germany) were used (Fig. 1a; Ochs et al., 2010).
The sensor probe consists of a steel housing with a screw to attach it to the exhaust pipe. A protection tube was designed to ensure laminar exhaust flow over the sensing element's surface, which is centered inside the housing. The two types of multilayer screen-printed sensing elements, shown in an enlarged view in Fig. 1b, were mounted and compared in the experiment. For reasons of thermomechanical stability, the element is built on the base of film-casted 4.5 mole-% yttria-stabilized zirconia (4.5 YSZ) foils. It is equipped with an internal heater that forms a control loop for temperature regulation together with a meander structure for temperature measurement. The soot-sensitive IDE structure is fabricated with a gap width of g=40 µm and a finger width of d=80 µm. All three functional structures are made of platinum for reasons of chemical inertness in exhaust atmospheres and thermal stability during the sintering process. To save the formative YSZ from decomposition due to high potentials, all the connected functional structures are isolated by alumina (Al2O3) layers. For some of the shown experiments, the iron-doped alumina layer (Al2−xFexO3) printed right below the IDE structure, in the case of sensing element type 1, is crucial. Sensing element type 2 is fabricated without the iron-doped alumina layer.
The sensor works in cycles of alternating the sensor regeneration phases and measuring phases. To start one cycle, the sensing element heats itself up to ϑ≈780 ∘C for Δ(t)=45 s with the internal heater for complete oxidation of deposited soot (regeneration phase). After regeneration, the sensing element cools down to the ambient exhaust gas temperature (ϑ=100 … 400 ∘C), and the measurement phase is initiated by turning on the measurement voltage of U=45 V over the IDE. Concerning the context discussed in Grondin et al. (2016) this voltage is the optimum measuring voltage in the case of the utilized sensor design. During the measurement, charged soot particles are attracted by the electrophoretic forces of the electric field that result from the electrode potentials and attach according to their charge, either on the 45 V or the grounded electrode. The electrical conductivity of soot leads to a local excessive increase in the electric field strength where soot particles are deposited (Middelburg et al., 2020). Due to that, the probability of further soot deposition is increased where particles are attached and are already leading to the formation of dendritic structures which align along the electric field lines and form conductive (or resistive) soot bridges connecting the IDE fingers (Teike et al., 2012). The IDE current, which is enabled by the reduction of resistance caused by these conductive soot bridges, is the sensor signal that can be correlated with the soot mass that passed the DPFs (Ochs et al., 2010). One complete sensor cycle is shown in Fig. 2. For further information on signal generation, we refer to earlier publications (Ochs et al., 2010; Feulner et al., 2017; Grondin et al., 2015).
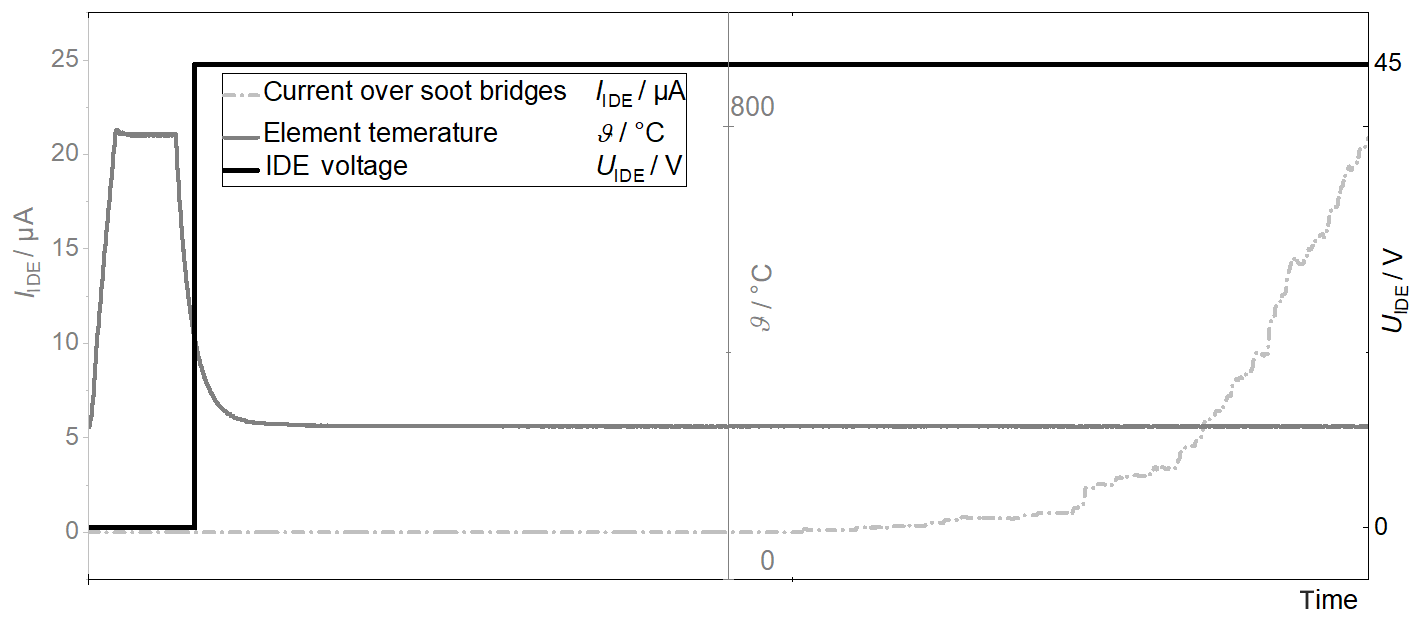
Figure 2From left to right: regeneration phase at ϑ≈780 ∘C and cooling down to exhaust temperature, with a transition to the measurement phase. During the measurement phase the current is zero as long as no soot bridge is formed (downtime) and rises exponentially due to the formation of many parallel conductive paths. After a predefined threshold is reached, the sensor regenerates itself and a new cycle begins.
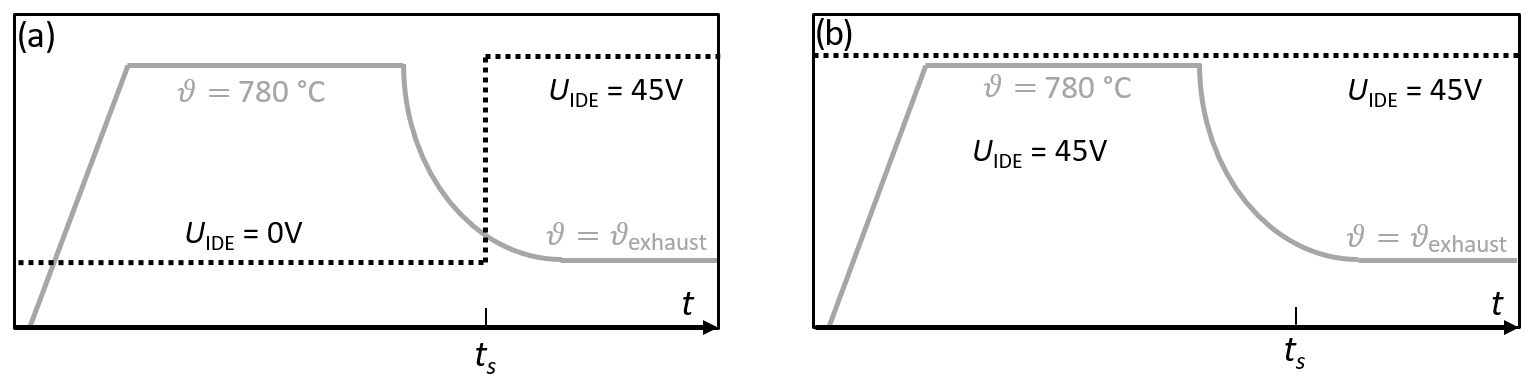
Figure 3Schematic comparison of (a) the regular operating strategy and (b) the alternative strategy, called prepolarization, at high temperatures. In the case of (b), the measurement voltage is switched on during the whole regeneration phase.
Besides the operating strategy described above and shown in Fig. 2, the effect of an alternative operating strategy on the sensor response is examined in this study. This alternative strategy is called prepolarization in the following sections and differs from the regular strategy in the measurement voltage, which is applied during the sensor regeneration phase as well. Both strategies are shown for comparison in Fig. 3. The beginning of the measurement phase (ts) is clearly defined when the measurement voltage is switched on as the sensing element temperature falls below ϑ=425 ∘C (Fig. 3a). In the case of prepolarization at high temperatures, the measurement phase starts as soon as the sensing element temperature falls below ϑ=425 ∘C as well. The repelling effect of thermophoresis is expected to overrule electrophoretic attraction until the sensor element temperature is about 10–20 K above ambient exhaust temperature (Hagen et al., 2018).
To evaluate and compare the effect of the two strategies on the sensor response, experiments at diesel engine test benches (BMW B47 and Daimler OM646) were carried out. Along with the engine as the particle source, the test benches are equipped with diesel oxidation catalysts (DOCs), catalysts for selective catalytic reduction (SCR) and diesel particulate filters which are bypassed with adjustable throttles to simulate DPF malfunction. Downstream of the bypassed DPFs, the section of measurement is mounted with 40 possible sensor positions. To ensure reproducible measurements, the motors run on stationary engine-operating points (EOPs) during the measurement, providing a constant soot mass concentration csoot in the exhaust gas. As discussed in various publications (Hagen et al., 2018; Grondin et al., 2019; Reynaud et al., 2019), the properties of soot particles and experimental conditions, like the exhaust velocity, have a crucial impact on the response of resistive soot sensors. Since the aim of the experiments conducted in this study is the comparison of different operating strategies instead of determining absolute values, all samples were measured simultaneously to rule out the effect of potentially unstable experimental conditions. A MSSplus AVL Micro Soot Sensor, working with the photoacoustic soot sensing (PASS) technology, measures the actual soot mass concentration csoot, which is included in the calculation of a soot-mass-specific and comparable value R that we call the specific response, as follows:
ttrigger represents the time it takes for the current flow
over the soot bridges to reach a predefined value (here
IIDE=12 µA) from the start of the
measurement phase ts. Higher values of R
indicate shorter sensor response times. In addition, soot deposition
patterns were observed and evaluated. For this purpose, sensors run at
the test bench until they reach
Itrigger=12 µA, but instead of
starting a sensor regeneration, the sensors were disconnected from the
power supply to preserve the grown soot structures for further
evaluation by scanning electron microscopy (SEM; Zeiss GeminiSEM 500). The
SEM images of the soot structures were evaluated with respect to their
degree of branching by a MATLAB® script, using
Dijkstra's algorithm (Cormen et al., 2001) to spot closed soot
paths. Furthermore, for material analysis, energy-dispersive X-ray
spectroscopy was carried out using an XFlash®
6 | 30 (Bruker) detector and time of flight secondary
ion mass spectroscopy with a TOF–SIMS 5 (IONTOF).
4.1 Comparison of operating strategies
The specific responses R of type 1 sensors (Fig. 1), running either on the regular operating strategy or on prepolarization, are compared at three different EOPs at the BMW N47 test bench. As defined in Table 1, these EOPs result in varying soot concentrations, exhaust temperatures and velocities.
Table 1Definition of the engine operating points (EOPs). The experiment was carried out at the BMW N47 test bench.
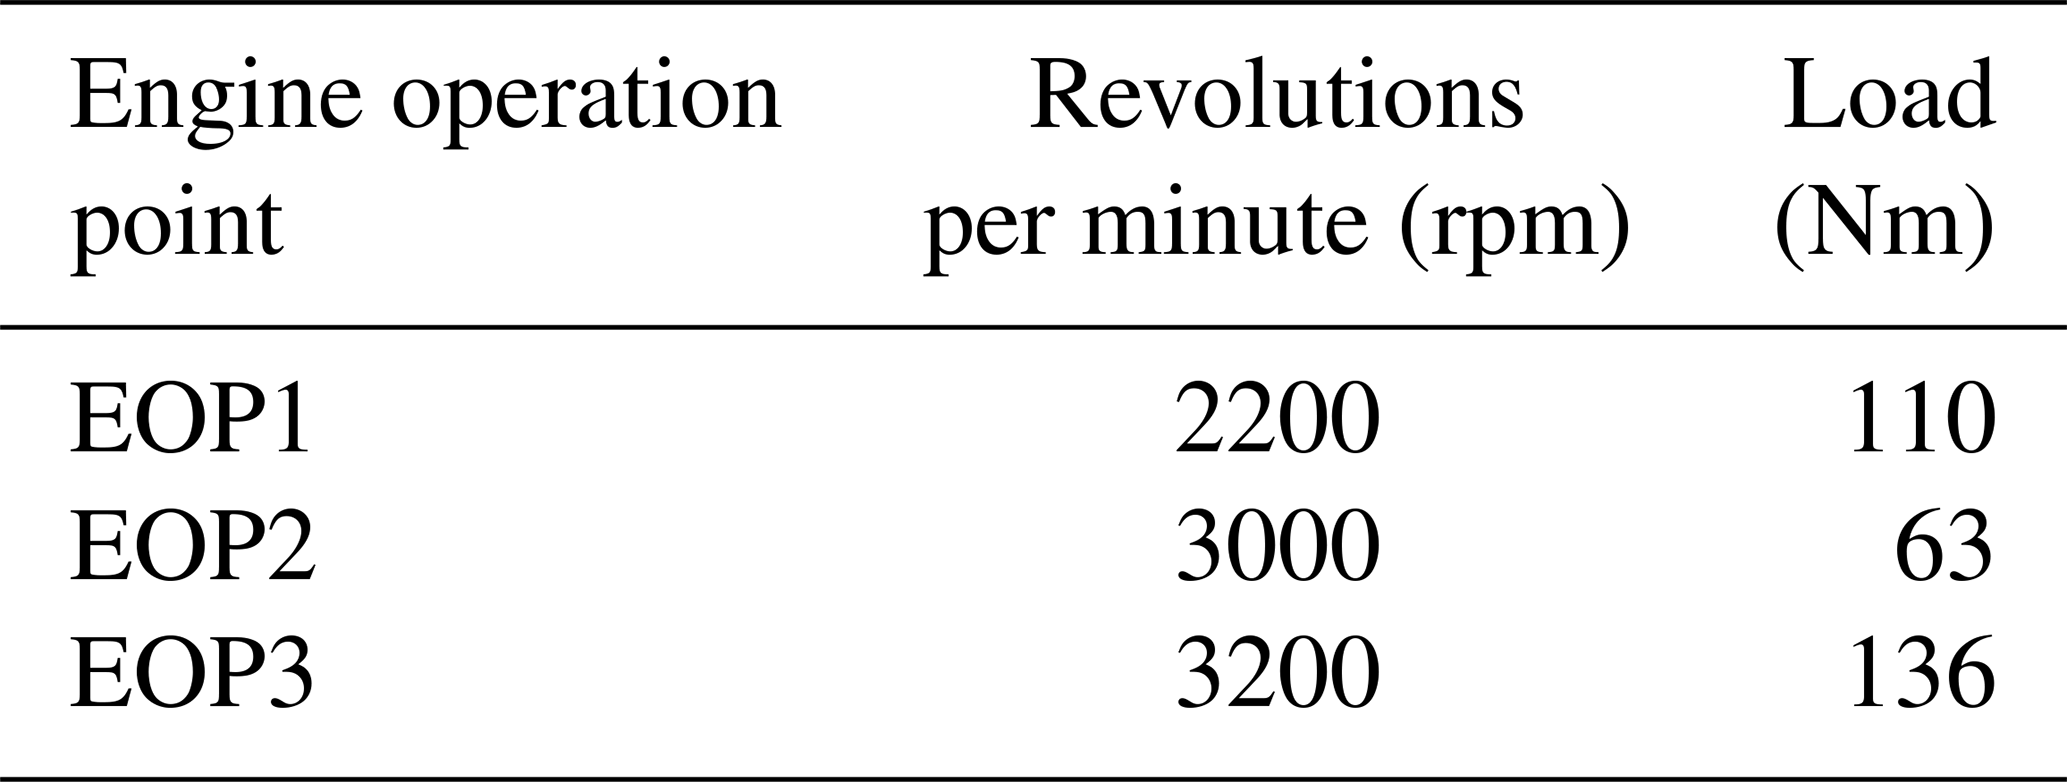
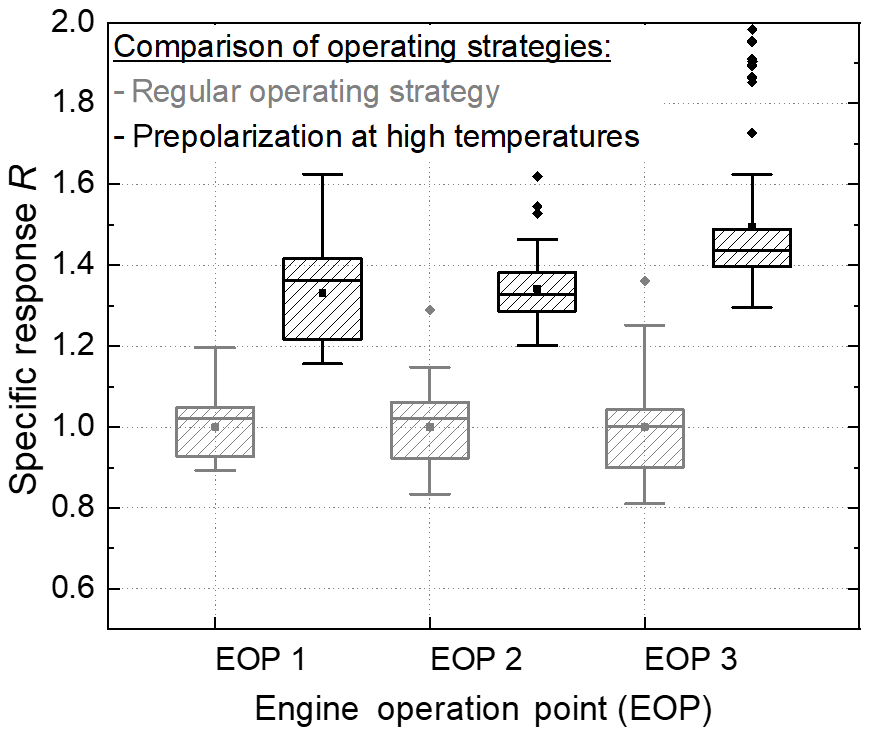
Figure 4Specific response at three different engine operation points for each of the five sensors operated by either the regular strategy or prepolarization at high temperatures. The values of R are scaled to the mean specific response of the regular operated sensors at each EOP. The experiment was carried out at the BMW N47 test bench.
Figure 4 shows the specific responses R of five sensors for each operating strategy at the three EOPs. The results are presented as boxplots. Each box represents five sensors. The boxes include 50 % of all measured values, and the horizontal line marks the median value. Dots outside the boxes represent outliers. The values are scaled down to the sensitivity of the regular operating sensors (Fig. 3a) at each EOP. In the case of the prepolarized sensors, the specific responses R at all EOPs are up to 30 % higher compared to the regular operated sensors, independent of the variation of experimental conditions. This boost of specific response by prepolarization at high temperatures we call the polarization effect.
4.2 Reversibility of the polarization effect
In this experiment, sensors of type 1 were operated in alternation by the regular and prepolarization strategy in four measurements at a constant EOP (2000 rpm∕60 Nm) in a row, each including several sensor cycles. Between each of the four measurements the engine was shut down and restarted with an initial DPF regeneration. It should be pointed out that the very same sensors were used for both operating strategies. The results in Fig. 5 show the reversibility of the polarization effect for three sensors. To monitor equal experimental conditions, a reference sensor running on the regular operation strategy was added to all four measurements. The specific response in measurement 1, when all sensors were run on the regular operating strategy is low compared to measurement 2, when the sensors were run on prepolarization at high temperatures. Moreover, switching back to the regular operating strategy leads to lower values of R again and so on.
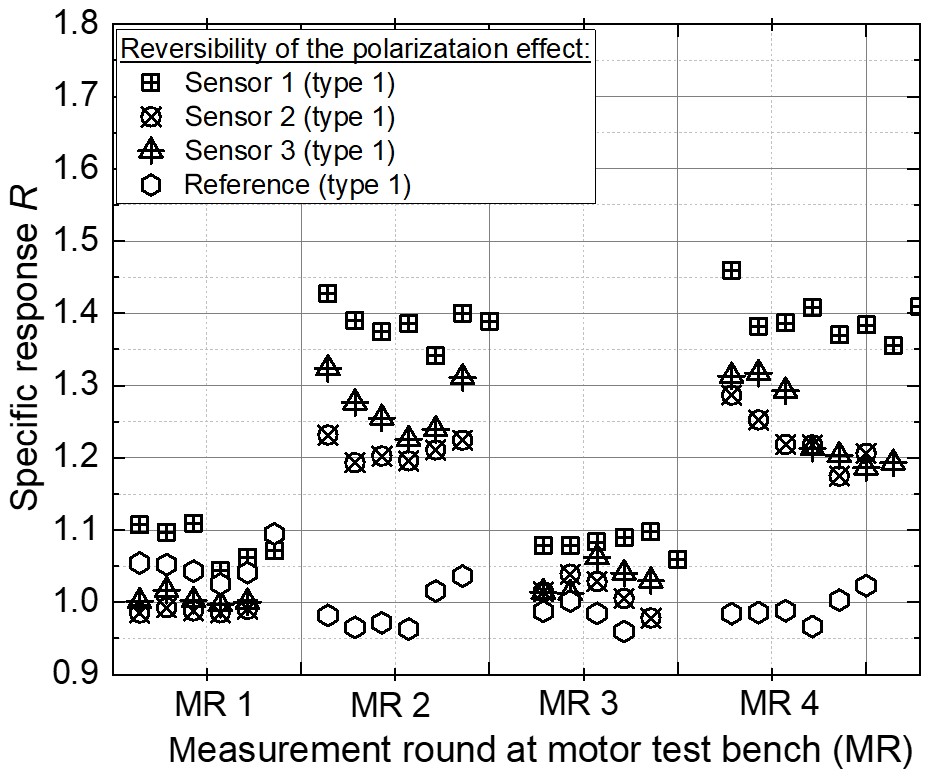
Figure 5Specific responses of three sensors (1–3) operated in alternation by the regular (MR1 and MR3) and prepolarization (MR2 and MR4) strategy in four measurements in a row. A reference sensor monitors equal experimental conditions. Each point represents 1 value of R evaluated from one sensor cycle. The values of R are scaled to the mean specific response of the reference sensor. The experiment was carried out at the Daimler OM646 test bench.
4.3 Comparison of sensing element types
At the same EOP (2000 rpm∕60 Nm), the specific responses of sensors mounted with sensing elements type 1 and 2 (Fig. 1b) operated by both operating strategies (Fig. 3) were ascertained and compared. The results in Fig. 6 show the polarization effect on R for sensing element type 1, as observed before in Fig. 4. For sensing element type 2 without the iron-doped alumina layer, however, prepolarization at high temperatures does not lead to increased values of R. Both sensing element variants were measured simultaneously under equal experimental conditions.
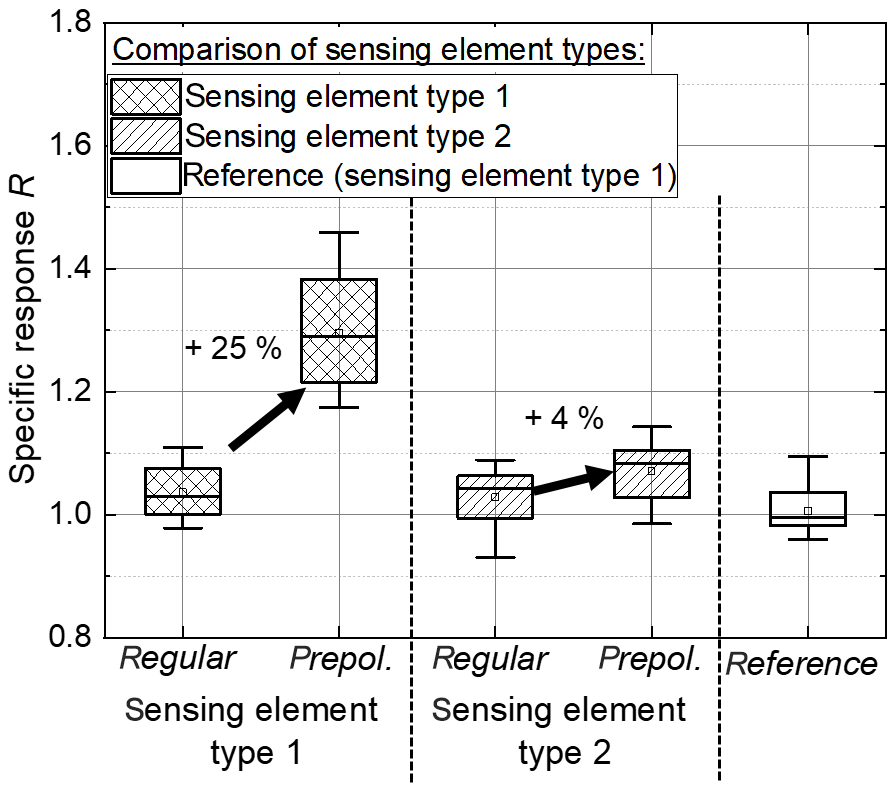
Figure 6Specific response of type 1 and 2 sensors operated by both regular and prepolarization strategy. The values of R are scaled to the mean specific response of the reference sensors. The experiment was carried out at the Daimler OM646 test bench.
4.4 Analytical observations
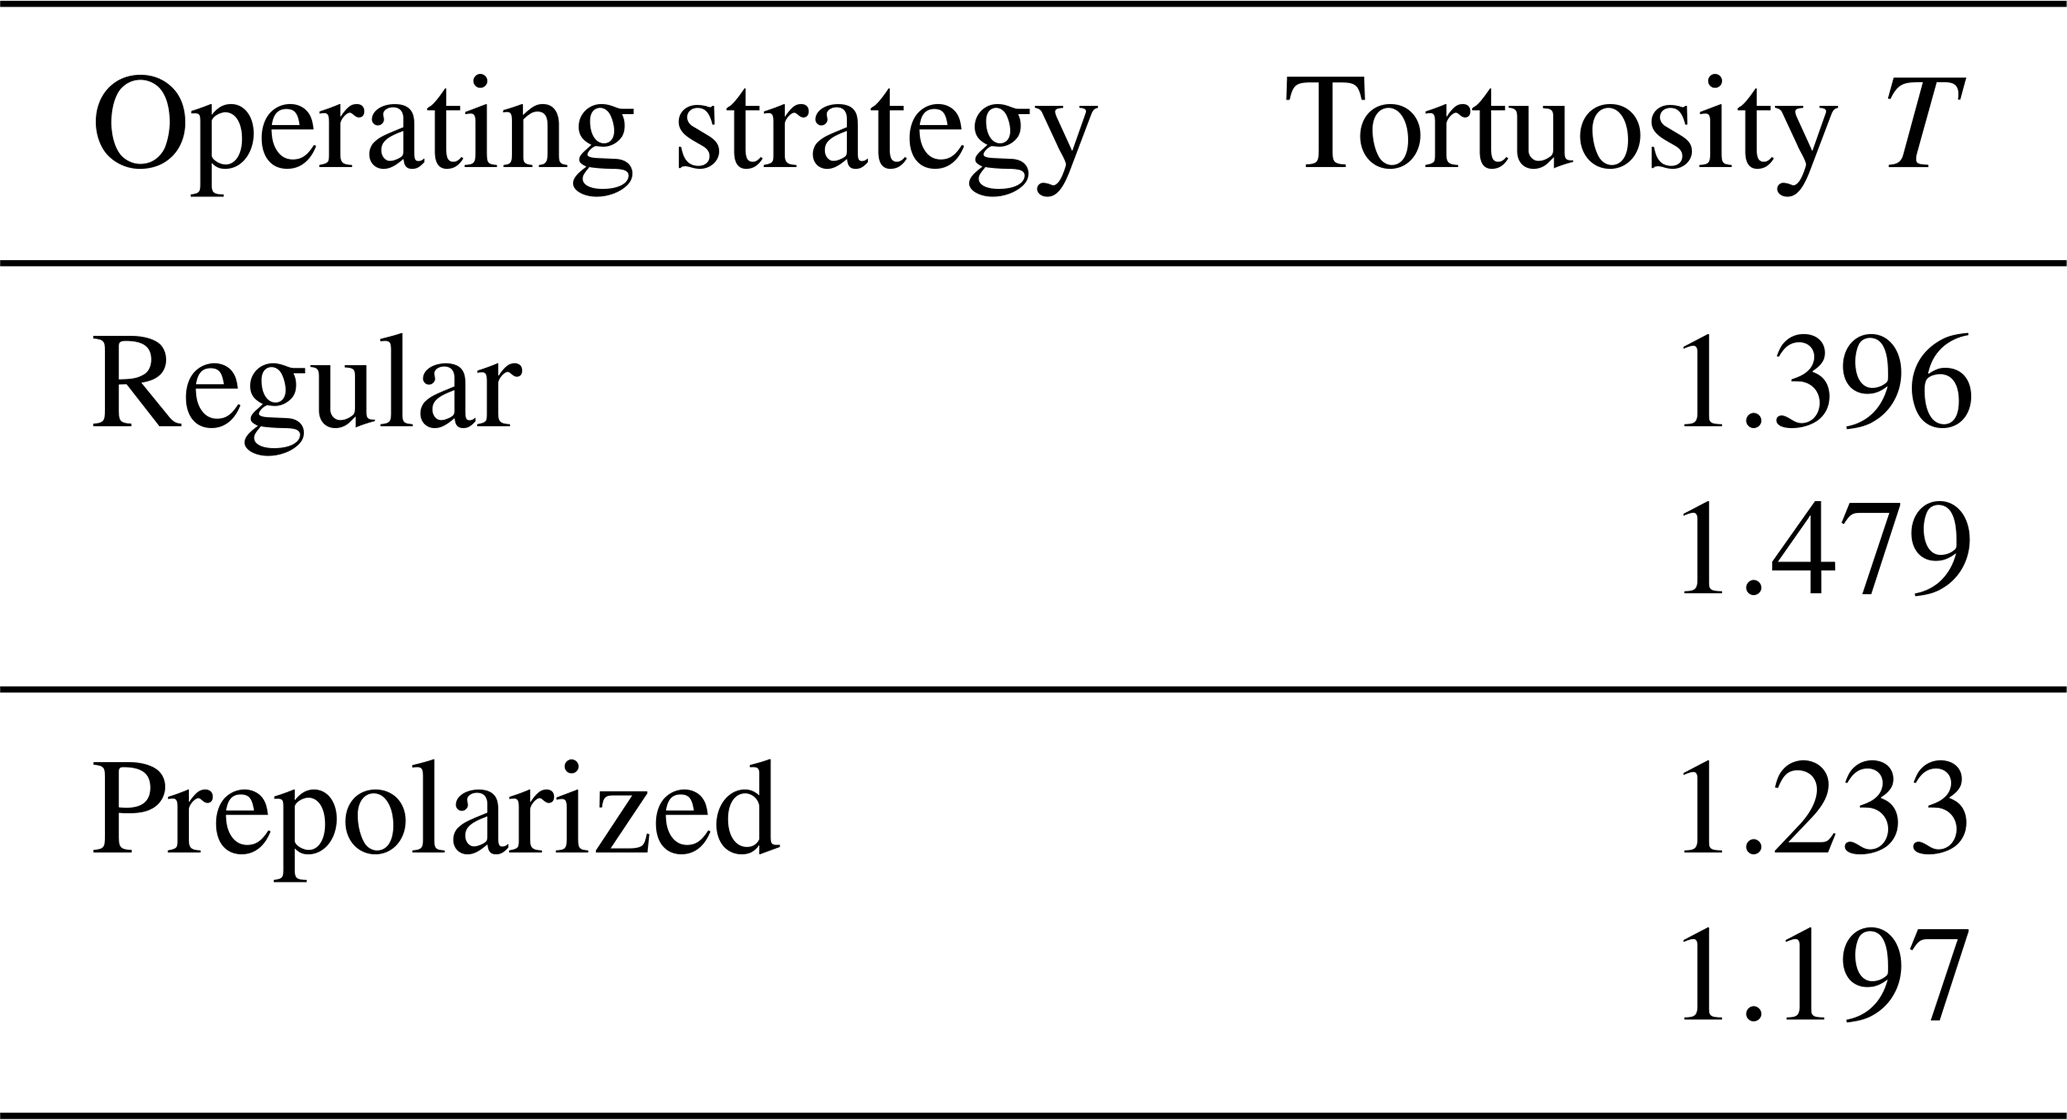
SEM images were taken from representative sensors of this study to compare the deposited soot structures. As can be seen in Fig. 7a, for the regular operated sensors, and Fig. 7b, for the prepolarized sensors, the soot structure of sensors with high specific-response values differ from those of low values. The prepolarized sensors show straight soot bridges with a small number of branches, while the soot bridges of sensors operated by the regular strategy show a high grade of branching. A MATLAB® script spots the closed paths between the electrodes (Fig. 7c–d), determines their length and calculates their tortuosity T. The tortuosity T describes the length of a curve compared to the distance between its ends and is calculated by the following:
The tortuosity describing the values of T, depending on the operation strategy, are given for two sensors, each in Table 2, while every value is determined by an evaluation at three spots on each sensor.
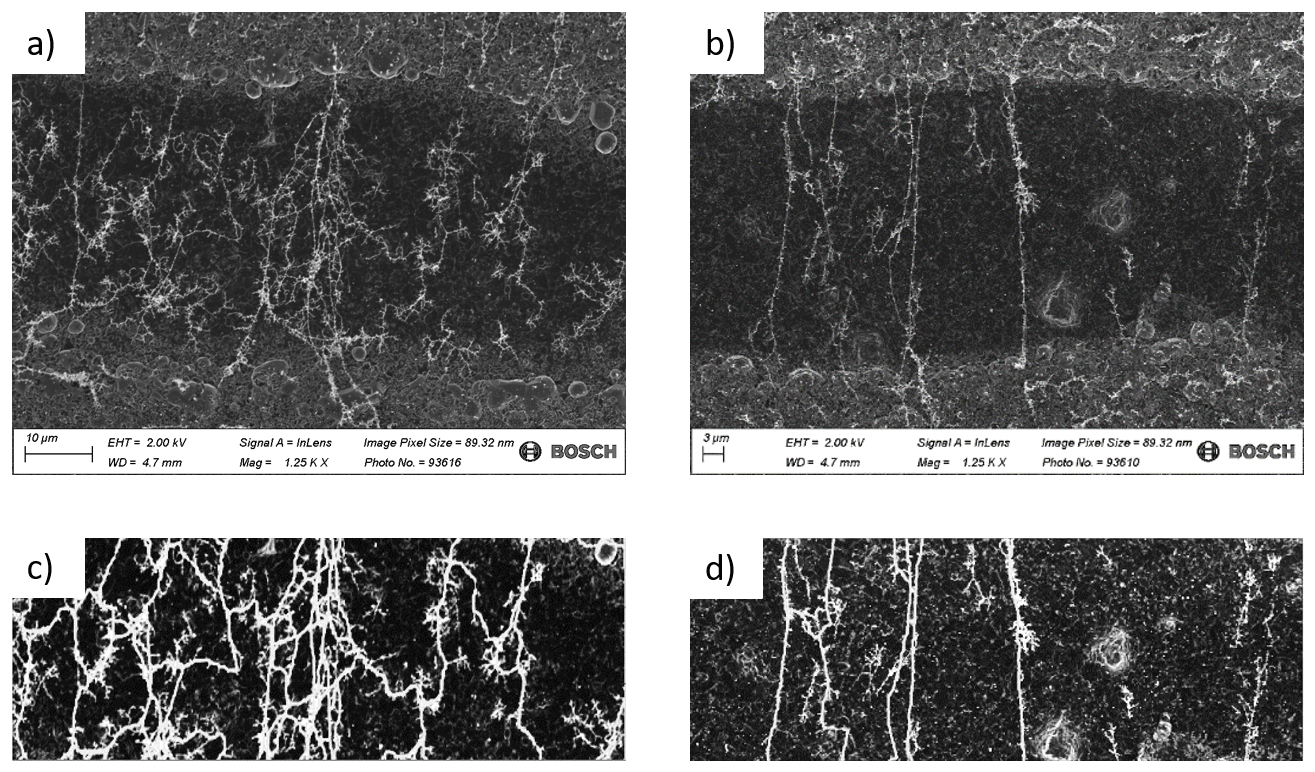
Figure 7(a–b) Soot structures in selected sections on the IDE after soot loading using the regular operating strategy and prepolarization at high temperatures, respectively. (c–d) Screenshots from the MATLAB® evaluation of the soot structures from (a–b). Spotted soot paths connecting the electrodes are marked with thick white lines.
Table 2Results of the MATLAB® soot structure evaluation using Dijkstra's algorithm to spot the closed soot paths as visualized in Fig. 7.
In summary, it can be stated that prepolarization at high temperatures leads to elevated values for the specific response, caused by the growth of straight instead of branched soot structures. Straight soot bridges are more efficient because fewer soot particles are needed to close one conductive path. Since the soot structures align with the electric field, they provide information about the shape of the field lines. Considering the polarization effect taking place due to prepolarization at high temperatures in combination with the iron-doped alumina layer (sensing element type 1), a coherence between the electrical properties of the substrate material under the IDE structure, and the characteristics of the electric field that affects the soot deposition, is expected. To examine the substrate material properties, energy-dispersive X-ray spectroscopy (EDX) and TOF–SIMS analyses were carried out on comparable sensing elements. Sodium (Na) enters the material as an initial impurity of the raw materials and during the sensor operation of the order of some 100 parts per million (Binnig et al., 2017). It shows the most significant distribution (Fig. 8a–b), namely a clear enrichment on and in the vicinity of the grounded electrode occurs. The depth profiles of sodium under the grounded electrode (Fig. 9a) show higher values by a factor of ≈3 compared to the 45 V electrode (Fig. 9b). These observations are proof of the displacement of sodium in the alumina-based substrate material by the high potentials applied on the IDE.
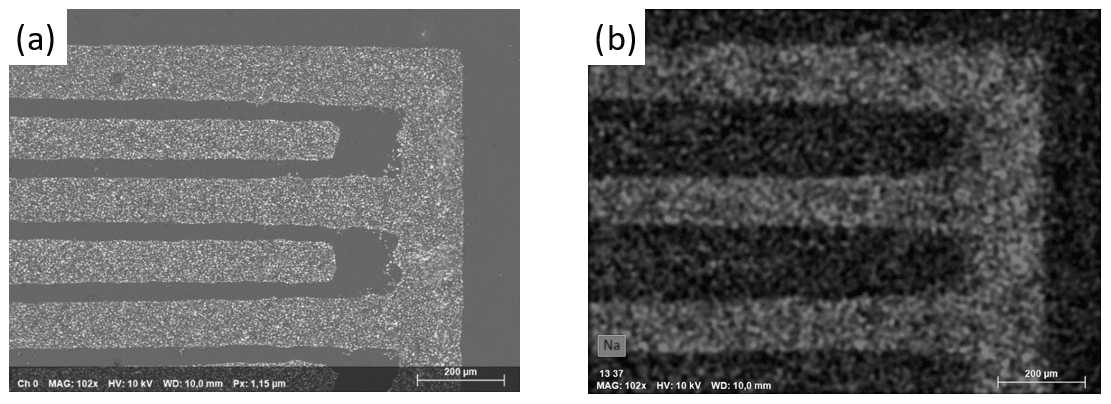
Figure 8(a) SEM image showing a selected section of the IDE. (b) Sodium EDX signal in the same section shows the irregular distribution of sodium after a multiple sensor operation.

Figure 9Depth profiles of aluminum, sodium and platinum measured by TOF–SIMS after a multiple sensor operation, where (a) is evaluated in the region of the grounded electrode and (b) is evaluated in the region of the 45 V electrode.
To understand the electric field characteristics and the displacement of mobile charge carriers (especially Na+), a 2D simulation model was set up. To ensure initial charge neutrality, oxygen ions (O2−) were assumed with a much lower mobility. The mobility of the charged species is given by the Nernst–Einstein equation (Einstein, 1905), beginning with literature values for the diffusion coefficients ( m2 s−1, Lovas et al., 2009; m2 s−1, Heuer, 2008). The initial sodium concentration was estimated on the basis of raw material elemental analysis to mol m−3 (because of the two charges mol m−3)). Mass transport of charged species is calculated by the Nernst–Planck equation (Neuen, 2016). Since every charge (charge density) is considered to be a source of internal electric fields, the electrostatic field properties are calculated simultaneously by the Poisson's equation (Maier, 2000). The external electric field is applied on the electrodes as 45 and 0 V, respectively. Figure 10a shows the ideal electric field in case of no mobile charge carriers in the substrate material, while in Fig. 10b, with sodium and oxygen ions as mobile charges, a distortion of the field lines, caused by the formation of ionic space charge regions near the electrodes, is observed. During the measurement on the real sensor, soot structures align along the distorted electric field lines and form branched soot structures. For further discussion, note that neither the electronic current nor the chemical interaction of the charged species or electrode reactions were considered for this simulation. Also, the real values of DNa and DO may differ significantly from the literature values because of the unknown influence of iron in alumina.
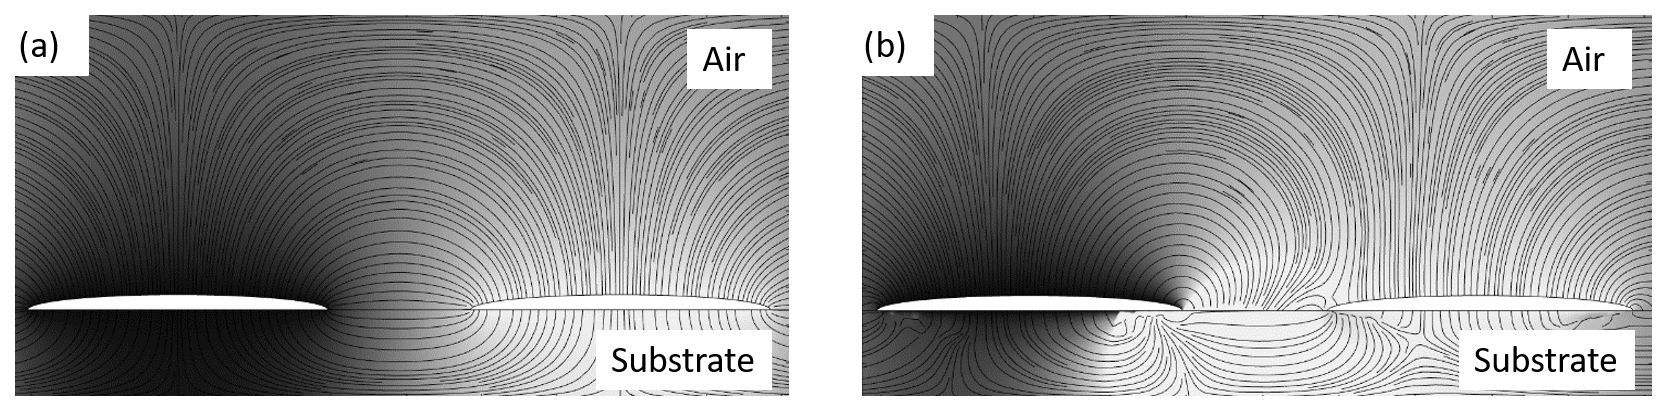
Figure 10(a) Electric field simulation without the assumption of mobile charge carriers. (b) Electric field simulation with the assumption of sodium and oxygen as mobile charge carriers. The mass transport follows the Nernst–Planck equations.
The processes leading to their respective specific response R or soot path tortuosity T are discussed for both operating strategies, separately, to give a universal model that describes the interrelationship between the solid state chemistry, sensor operation strategy and soot deposition.
6.1 Regular operating strategy without prepolarization
In the case of the regular operating strategy (Fig. 3a) during sensor regeneration at ϑ≈780 ∘C, the substrate layer under the IDE is free of potential (neglecting possible low potentials that result from the heater). Following the law of Arrhenius at the regeneration temperature, the mobility of ionic species is higher than at low temperatures. In addition, electronic conductivity due to the iron-doped alumina occurs (in the case of type 1 sensing elements; Lloyd et al., 1984). Ions move along their concentration gradient and electronic charge carriers cause the discharging of possible space charges, with the result that the substrate layer is neutrally charged at the end of the regeneration. In the thermal decay period, the electric conductivity and ionic mobility decrease at different rates according to their thermal activation energy. The application of the measurement voltage causes a slight displacement of sodium at the electrodes (which accumulates in multiple cycles to detectable concentrations as observed by EDX in Fig. 8), leaving the negative charge behind to form a space charge region, while the electronic conductivity is too low for entire discharge. Since the temperature drops later on, the nonequilibrium state is frozen, resulting in a distorted electric field over the electrodes caused by the space charges, similar to the simulated field shown in Fig. 10b. Since the space charge depends on structural properties like grain orientation, it takes no uniform shape over the entire sensing element, leading to branched soot structures with high tortuosities. The high amount of soot particles required to build this branched connection results in higher ttrigger values and lower values for the specific response, respectively.
6.2 Operating strategy with prepolarization
Prepolarization at high temperatures leads to relatively high values of specific responses, low tortuosities and straight soot bridges, which strengthens the assumption of a ideal electric field over the electrodes as shown in Fig. 10a, where no mobile species were considered. The experiment, concerning the reversibility of the polarization effect proves the presence of charge carriers and their field-distorting effect described above. In the case of prepolarization, an ionic space charge resulting from the displacement of sodium ions is neutralized by the thermally activated free electronic charge carriers. These effects also lead to an equilibrium state of the solid at the end of the regeneration phase. Since there is no further application of voltage in the thermal decay period, the system cools down in the equilibrium state to provide the ideal electric field that is required to form efficient, straight soot bridges, and the specific response value R is relatively high.
The comparison of type 1 and type 2 sensing elements showed that, without the electronic charge carriers provided by the iron-doped alumina layer in case of type 2 elements, the polarization effect does not occur. The space charges caused by sodium migration cannot be discharged by electronic charge carriers in the same way because of the high electronic resistance of undoped alumina (Pappis and Kingery, 1961).
Electrophoretic attraction of soot particles towards a wired IDE structure leads to the formation of soot structures that are aligned along the electric field lines. It can be shown by simulations and by experiments that the electric field characteristics that are projected by the structure of the grown soot paths strongly depend on the solid state chemistry of the substrate layer below the IDE. Due to the electric forces induced by the measurement voltage, ions are displaced and act as mobile charge carriers, forming space charge regions near the electrodes that distort the electric field. The application of the measurement voltage in the thermal decay period, as implemented in the regular operating strategy of the Bosch PM sensor, leads to a nonequilibrium state of the solid, with extensive space charge regions, affecting the soot deposition to form branched soot structures. Using prepolarization at high temperatures, the solid state is set to an equilibrium state that leads to an undistorted homogeneous electric field, resulting in straight-aligned soot structures and faster sensor response up to 30 %. Considering the existence and mobility of charged species in the substrate layer below the IDE and the formation of ionic space charges, the interrelationship between operating strategy and soot deposition can be explained. The better understanding of this context opens the possibility of optimizing the soot deposition at resistive soot particle sensors by adapting the operation strategy without the need for any further design measures.
The data presented in this article were acquired during the development of future particulate matter sensor generations at Bosch (Robert Bosch GmbH, Germany) and stored in an internal system. The raw data include confidential material and are thus inaccessible.
JE, CS and HF conceptualized this study. JE and CS designed the experiments. JE performed the experiments and evaluated the data. JE wrote the paper, and CS and HF proofread it.
The authors declare that they have no conflict of interest.
This article is part of the special issue “Dresden Sensor-Symposium DSS 2019”. It is a result of the “14. Dresdner Sensor-Symposium”, Dresden, Germany, on 2–4 December 2019.
The authors appreciate the support from Robert Bosch GmbH for providing the possibility to perform and present the experiments shown in this paper.
This open-access publication was funded
by Clausthal University of Technology.
This paper was edited by Andreas Schütze and reviewed by two anonymous referees.
Bargende, M., Reuss, H.-C., and Wiedemann, J. (Eds.): 16. Internationales Stuttgarter Symposium, Springer Fachmedien Wiesbaden and Imprint, Springer, Wiesbaden, 2016. a
Binnig, S., Fuchs, S., Robles Collantes, C. A., and Volpp, H.-R.: Exhaust gas condensate – formation, characterization and influence on platinum measuring electrodes in diesel vehicles, Sensor. Actuat. B-Chem., 242, 1251–1258, https://doi.org/10.1016/j.snb.2016.09.082, 2017. a
Cormen, T. H., Leiserson, C. E., Rivest, R. L., and Stein, C.: Introduction to Algorithms, 2nd Edn., The MIT Press, London, ISBN 978-0262531962, 2001. a
Einstein, A.:Über die von der molekularkinetischen Theorie der Wärme geforderte Bewegung von in ruhenden Flüssigkeiten suspendierten Teilchen, Ann. Phys. Chem., 322, 549–560, https://doi.org/10.1002/andp.19053220806, 1905. a
Feulner, M., Hagen, G., Hottner, K., Redel, S., Müller, A., and Moos, R.: Comparative Study of Different Methods for Soot Sensing and Filter Monitoring in Diesel Exhausts, Sensors-Basel, 17, 400, https://doi.org/10.3390/s17020400, 2017. a
Grondin, D., Breuil, P., Viricelle, J. P., and Vernoux, P.: Development of a Particulate Matter Sensor for Diesel Engine, Procedia Eng., 120, 1237–1240, https://doi.org/10.1016/j.proeng.2015.08.838, 2015. a
Grondin, D., Geara, S., Breuil, P., Viricelle, J. P., and Vernoux, P.: Influence of Electrodes Polarization on the Response of Resistive Soot Sensor, Procedia Eng., 168, 31–34, https://doi.org/10.1016/j.proeng.2016.11.124, 2016. a
Grondin, D., Breuil, P., Viricelle, J. P., and Vernoux, P.: Modeling of the signal of a resistive soot sensor, influence of the soot nature and of the polarization voltage, Sensor. Actuat. B-Chem., 298, 126820, https://doi.org/10.1016/j.snb.2019.126820, 2019. a, b
Guan, B., Zhan, R., Lin, H., and Huang, Z.: Review of the state-of-the-art of exhaust particulate filter technology in internal combustion engines, J. Environ. Manage., 154, 225–258, https://doi.org/10.1016/j.jenvman.2015.02.027, 2015. a
Hagen, G., Spannbauer, C., Feulner, M., Kita, J., Müller, A., and Moos, R.: Conductometric Soot Sensors: Internally Caused Thermophoresis as an Important Undesired Side Effect, Sensors-Basel, 18, 3531, https://doi.org/10.3390/s18103531, 2018. a, b
Harris, S. J. and Maricq, M.: Signature size distributions for diesel and gasoline engine exhaust particulate matter, J. Aerosol Sci., 32, 749–764, https://doi.org/10.1016/S0021-8502(00)00111-7, 2001. a
Heuer, A. H.: Oxygen and aluminum diffusion in α-Al2O3: How much do we really understand?, J. Eur. Ceram. Soc., 28, 1495–1507, https://doi.org/10.1016/j.jeurceramsoc.2007.12.020, 2008. a
Kamimoto, T.: A review of soot sensors considered for on-board diagnostics application, Int. J. Engine Res., 18, 631–641, https://doi.org/10.1177/1468087416678499, 2017. a
Lloyd, I. K., Pollak, T. M., and Bowen, H. K.: Conductivity of Iron-Doped Polycrystalline Alumina at High Temperatures, J. Am. Ceram. Soc., 67, 810–814, https://doi.org/10.1111/j.1151-2916.1984.tb19706.x, 1984. a
Lovas, H., Josepovits, V. K., and Tóth, Z.: The sodium diffusion in aluminium-oxide, Appl. Surf. Sci., 255, 3581–3585, https://doi.org/10.1016/j.apsusc.2008.10.001, 2009. a
Maier, J.: Festkörper: Fehler und Funktion, Prinzipien der physikalischen Festkörperchemie, Teubner Studienbücher, Chemie, Teubner, Stuttgart, 2000. a
Middelburg, L. M., Ghaderi, M., Bilby, D., Visser, J. H., and Wolffenbuttel, R. F.: Exploring the response of a resistive soot sensor to AC electric excitation, J. Aerosol Sci., 146, 105568, https://doi.org/10.1016/j.jaerosci.2020.105568, 2020. a, b
Neuen, C. P. T.: Simulation of Ion Migration with Particle Dynamics and the Heat-Poisson-Nernst-Planck System, Dissertation, University of Bonn, Bonn, 2016. a
Newell, K., Kartsonaki, C., Lam, K. B. H., and Kurmi, O. P.: Cardiorespiratory health effects of particulate ambient air pollution exposure in low-income and middle-income countries: a systematic review and meta-analysis, Lancet Planet. Health, 1, e368–e380, https://doi.org/10.1016/S2542-5196(17)30166-3, 2017. a
Ochs, T., Schittenhelm, H., Genssle, A., and Kamp, B.: Particulate Matter Sensor for On Board Diagnostics (OBD) of Diesel Particulate Filters (DPF), SAE Int. J. Fuels Lubric., 3, 61–69, https://doi.org/10.4271/2010-01-0307, 2010. a, b, c, d
Pappis, J. and Kingery, W. D.: Electrical Properties of Single-Crystal and Polycrystalline Alumina at High Temperatures, J. Am. Ceram. Soc., 44, 459–464, https://doi.org/10.1111/j.1151-2916.1961.tb13756.x, 1961. a
Reynaud, A., Leblanc, M., Zinola, S., Breuil, P., and Viricelle, J.-P.: Responses of a Resistive Soot Sensor to Different Mono-Disperse Soot Aerosols, Sensors-Basel, 19, 705, https://doi.org/10.3390/s19030705, 2019. a
Teike, G., Dietzel, M., Michaelis, B., Schomburg, H., and Sommerfeld, M.: Multiscale Lattice–Boltzmann Approach for Electrophoretic Particle Deposition, Aerosol Sci. Tech., 46, 451–464, https://doi.org/10.1080/02786826.2011.634451, 2012. a