the Creative Commons Attribution 4.0 License.
the Creative Commons Attribution 4.0 License.
 | 20 Oct 2020
Characterization of ceramics based on laser speckle photometry
Ulana Cikalova
Beatrice Bendjus
Stefan Muench
Mike Roellig
Advanced ceramic components are frequently used in industrial applications. As a brittle material, ceramic reacts very suddenly to excessively high stresses. Existing defects lead to rapid crack growth followed by spontaneous destruction. This leads to a functional failure of the entire component. It is therefore important to develop innovative techniques to ensure a good quality condition of ceramic products. Laser speckle photometry (LSP) is an optical nondestructive testing method. It is based on the dynamic analysis of time-resolved speckle patterns that are generated by an external excitation. In this paper, we will present two investigations on ceramic components using the LSP technique. One is the nondestructive stress characterization on ceramic surfaces, and the other is the defect detection on ceramics components. The aim is to improve the quality and safety control of ceramic production in the challenging industrial field. Preliminary results have shown the potential of the LSP sensor system for the nondestructive characterization of ceramics in terms of stress monitoring and surface defect detection.
- Article
(3959 KB) - Full-text XML
- BibTeX
- EndNote


Due to the special structural and functional properties of ceramic materials, they play an important role in many fields of industry. For example, direct copper bonded (DCB) substrates, which consist of a ceramic layer between two thick copper layers, are frequently used in power electronics modules. Instead, Na-β-alumina can be utilized to produce high-temperature-resistant, low-cost batteries. During the manufacturing process, or under operating conditions, unexpected thermal or mechanical stress can occur. On the one hand, cracking can be caused by extreme stress conditions. On the other hand, the propagation of cracks in ceramic components is sensitive to stress and leads to the damage of components, which causes safety risks and financial losses for manufacturers and customers. Therefore, it is important to know the exact stress distribution and to be able to detect existing defects in ceramic products in order to ensure a continuously high quality of industrial applications. Currently, there is no technique available that allows for direct, noncontact testing and fast determination of mechanical stress in ceramics. Traditional techniques such as the X-ray diffraction method (Gao et al., 2017; Xi et al., 2017), Raman spectroscopy (Jannotti et al., 2017), and the hole-drilling method (Mainjot et al., 2011) are time-consuming, expensive, and sometimes destructive. In addition, speckle photography is a full-field optical method and, by combining it with the digital image correlation technique, can be used to measure in-plane deformations and strains in opaque materials (Blug et al., 2019; Schenuit et al., 2008; Tausendfreund et al., 2018). It records the speckle patterns before and after the deformation of the inspected workpiece. The strain difference can be derived from the surface displacement, which is calculated by the cross-correlation of the laser speckle pattern. On the contrary, there are many common defect detection methods, such as X-ray transmission and backscattering techniques (Okuma et al., 2019; Skácel et al., 2018) and the ultrasound impulse echo method (Barth et al., 2016; Kesharaju et al., 2014; Tripathi et al., 2019), with the aim of detecting defects in both the surface and inner zones. However, these procedures are usually complicated, and the samples are scanned individually with laboratory equipment. Additionally, most of these measuring systems are difficult to integrate into the production process to perform inspections in line. For these reasons, researchers are motivated to find a solution to verify important quality parameters locally and in real time. The authors therefore propose a novel, nondestructive, and noncontact optical technique for stress monitoring and defect detection in ceramics in a fast and cost-effective way, namely laser speckle photometry (LSP).
In this paper, a similar correlation technique – the digital image correlation of speckle photography – is utilized to characterize the stress difference in the bending experiments of ceramics. However, the purpose of the research for LSP, rather than to calculate the surface displacement using cross-correlation, is to find statistical characteristics of local static or quasi-static speckle intensities produced by deformations in ceramics that can be correlated to the stress. Accordingly, the absolute strain can be estimated by LSP from the calibrated speckle stress function. This will be completed in further research.
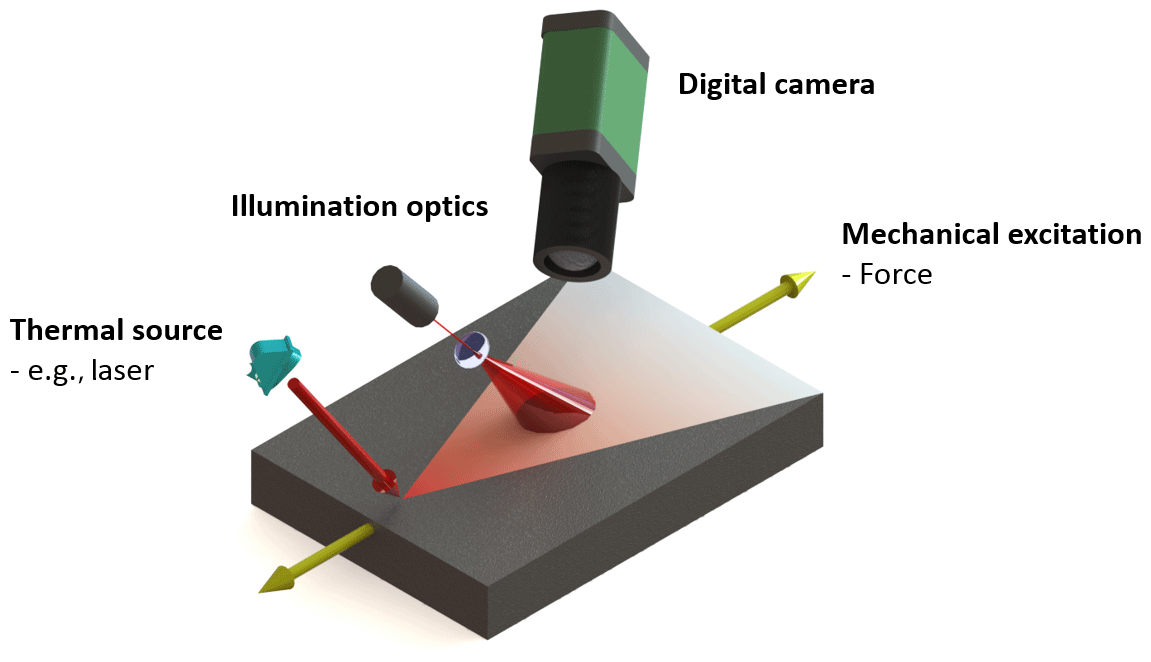
The speckle effect is an optical phenomenon. When an optical rough surface is illuminated by a coherent light source, such as a laser, a speckle pattern will be generated (Goodman, 1975). The waves scattered from various points on the illuminated surface interfere with each other in the observation plane and produce the speckle pattern, i.e., a spatial structure with a randomly distributed minimum and maximum intensity. Detectors such as digital cameras with a charge-coupled device (CCD) or complementary metal-oxide semiconductor (CMOS) chips can detect speckle patterns. The theory of speckle or dynamic speckle belongs to the category of statistical optics, which is described in detail by Goodman (1985). It reveals that laser speckle patterns are the sums of random phasors in the observation plane, and the speckle intensities are obeyed by statistical distributions, e.g., negative exponential and gamma distributions. Goodman also describes the mathematical speckle properties, e.g., the central limit theorem of probability theory and random processes. The LSP method is based on the analysis of speckle patterns generated by a laser source. In fact, the recorded speckle patterns are not only 2D graphics but also fingerprints containing 3D information of sample surfaces. In comparison to other speckle-based techniques, such as speckle interferometry whose setup contains a reference beam creating phase information, LSP only uses the amplitude information of the optical field. The basic experimental setup of LSP consists of three parts, namely laser and illumination optics, the external excitation source, and the digital camera, as shown in Fig. 1a where a laser diode is used as an illumination source to generate static speckle patterns on the sample surface. The static surface can be deformed by an external thermal or mechanical excitation and produces time-varying dynamic laser speckle patterns, which can be referred to as speckle movement. Through the development of hardware and mathematical tools for the registration and processing of nonstationary optical fields, the dynamic time-resolved speckle patterns can be recorded by a digital camera and can be evaluated with specific algorithms for different applications. By using a fast camera, it is possible to record the speckle signal with a frequency of 5000 Hz in the LSP technique.
In general, the LSP technique provides a solution for fast in-line inspections in the industrial field. It has already been used several times to characterize material properties, such as hardness and porosity, but also to detect defects in metallic components (Bendjus et al., 2012; Cikalova et al., 2012a, b). In contrast to metals, ceramic materials have very different thermal and mechanical properties. Therefore, the application of LSP to ceramics is still in the early stages and is the subject of academic and industrial research today.
2.1 Stress characterization of ceramics by LSP
As mentioned above, a speckle pattern is an interference pattern created by the rough surface of an object. In fact, speckles reveal the state of a surface in real time, and it changes with variations in surface conditions, such as roughness and mechanical stress. In order to characterize the mechanical stress of ceramics, a concept was developed that describes the correlation between speckle signal and mechanical signal. The details of the correlation were presented in our previous work (Muench et al., 2017). Briefly, a three-point bending device was used to deform ceramic specimens and introduce stresses into them. Rough surfaces of ceramic samples respond to this stimulation by changing the position of surface reflectors or scattering points and converting the variations into changes in speckle patterns. These changes are visible in time-resolved dynamic speckles. The time-resolved dynamic speckle signals correlate directly with the strain of the specimen surface. In the elastic range, this strain is still associated with the surface stress by Hooke's law. Consequently, a correlation between speckle signals and mechanical stress can also be derived.
The speckle signals obtained from measurements can be used to replace the mechanical strain. This results in a characteristic constitutive model equation, Eq. (1), with the speckle signal, r(t), as follows:
where Q1 and Q2 are determined by the experiments. The speckle signal, r(t), will be presented in Eq. (2) in Sect. 4. Since the initial state of the sample was defined as stress free, the parameter Q2 was set to zero. Using the finite element method (FEM), the mechanical stresses in the specimen can be determined during the three-point bending test. With the help of Eq. (1), the parameter Q1 can be calculated. After the establishment of the model, mechanical stress can also be calculated directly from the LSP signal, provided it is the same material and has a similar surface condition (Muench et al., 2017).
2.2 Defect detection of ceramics by LSP
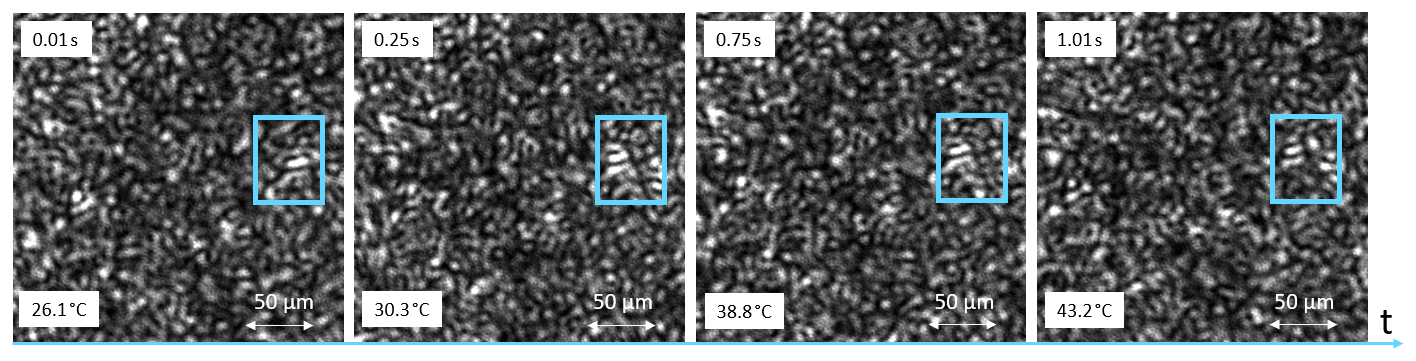
As mentioned above, the changes in surface strain can create dynamic speckle patterns. This strain change could also be produced by the change in local temperature, i.e., thermal expansion. When a ceramic sample is illuminated by an external heat source, e.g., a high-power laser (50 W), the thermal energy will be absorbed by the sample, and part of the absorbed energy will propagate along the sample surface. This results in local temperature differences. The change in temperature causes changes in the strain on the sample surface, which leads to time-varying dynamic speckle patterns, as shown in Fig. 2.
When thermal waves propagate on a normal surface without defects, a homogeneous spatial gradient of temperature is formed. If surface defects exist, the temperature distribution becomes nonhomogeneous; i.e., the presence of defects changes the distribution of thermal energy around the defect area (Tzou, 2014). Heat energy then accumulates around the defective area, as presented in Fig. 3.
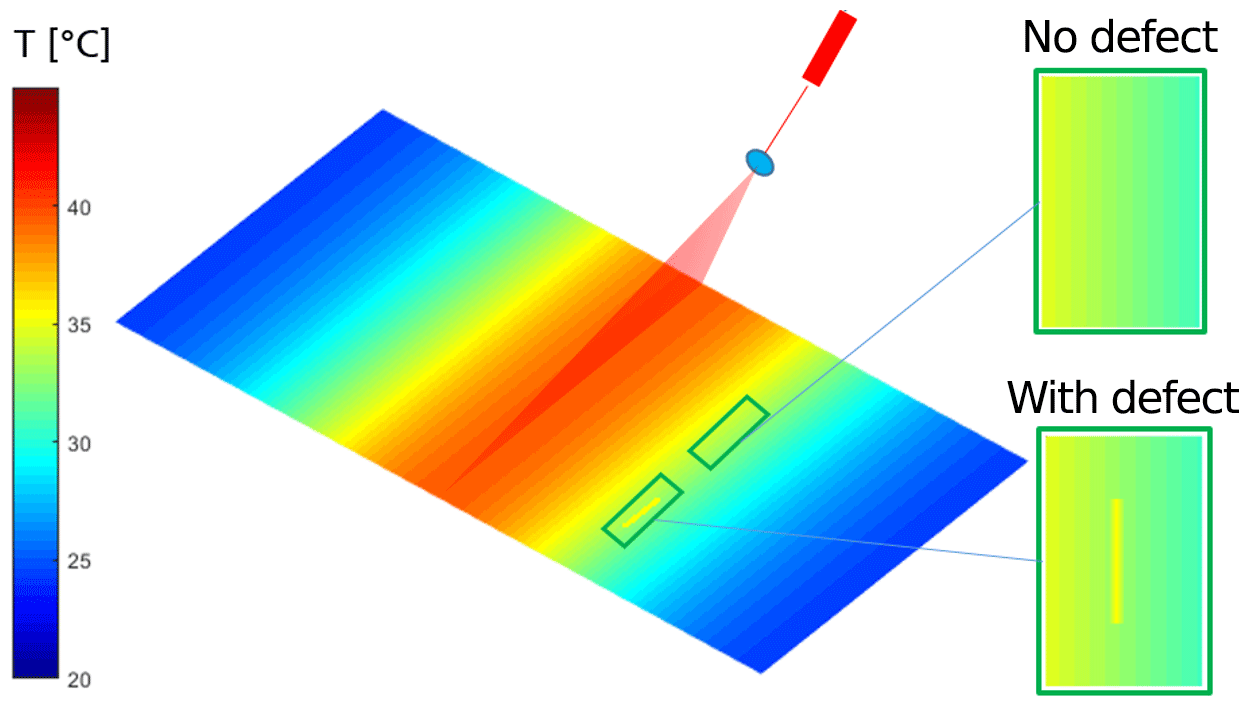
It can be observed that the thermal accumulation distorts the normal spatial gradient and leads to a higher level of speckle movement around the defective boundary due to a stronger displacement of surface elements in that area. The different speckle movements between defective and intact surfaces can be interpreted as a spatial contrast of speckle parameters. To extract the spatial contrast, the dynamic speckle signals can be evaluated and analyzed on the basis of specific algorithms introduced in Sect. 4. Consequently, relatively great values of a speckle parameter will be obtained in the defective area, and relatively small values of the same parameter will be calculated in the background or vice versa. In this case, it provides the possibility of defect detection by the technique of LSP.
Given the simple but robust design of the LSP technique, the measurement and evaluation of obtained data can be performed in real time. Therefore, it can be easily integrated into the manufacturing process, compared to X-ray and ultrasound techniques, to perform in-line inspections.
3.1 Samples and experimental setups of stress characterization
The experimental setup for the characteristic model of speckle and stress signals combines an optical setup for LSP recordings and a mechanical stress and strain applicator. The setup is shown in Fig. 4. The speckle pattern was generated on the sample surface using a single mode laser diode with a wavelength of 650 nm and output power of less than 15 mW. The diameter of the total illumination area was approximately 8 mm. Dynamic speckle signals were recorded by a CMOS digital camera with full resolution of the chip with 2048×1088 pixels. A macro lens with an eight-times magnification strength was mounted on the camera. The beam splitter offered the possibility to position the camera and laser diode perpendicular to the sample surface. All speckle measurements were performed at the center of the sample surface. In this case, there is no out-of-plane motion of the sample at the measuring point during the bending test. This ensures that the dynamic speckle pattern is generated only by changing the surface strain, which reduces the noise from the setup in the final results.
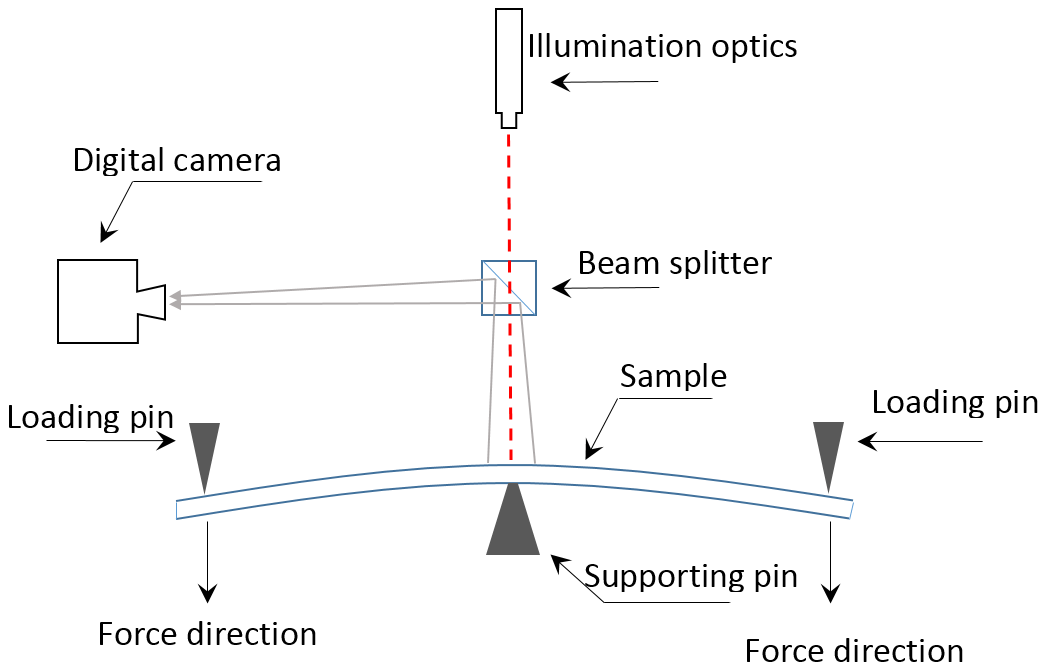
Figure 4Experimental setup of LSP for stress characterization. The sample is fixed in a three-point bending device. Speckle patterns generated by a laser diode and passing through a beam splitter are captured by a digital camera.
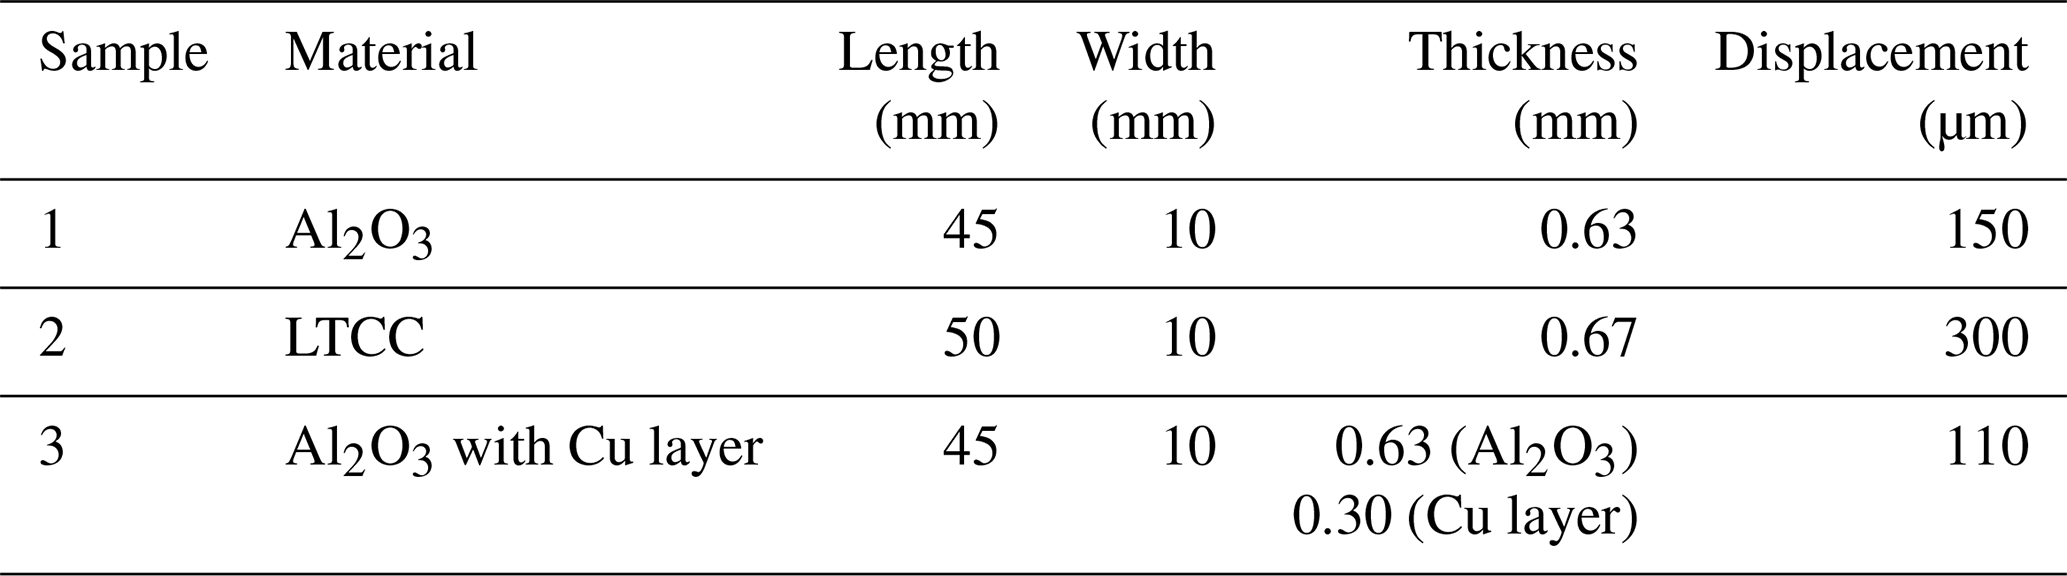
Samples were fixed in a three-point bending device. The distance between the two outer loading clamps was 40 mm. The tested samples were thin ceramic substrates, for which the roughness (Ra) was approximately 2 µm, and the details of the samples, including the dimensions and the corresponding maximal displacement of the bending test, are listed in Table 1. In addition, all the ceramic samples are assumed with linear elasticity. During the bending measurement, the surface strain was introduced into the sample via the displacement of the loading clamps of the controlled device. Speckle recordings were evaluated using the MATLAB® software with specific algorithms. Meanwhile, the mechanical stress at the measuring position was estimated by FEM simulation.
Table 1Sample dimensions and maximum applied displacement. Note: LTCC – low-temperature cofired ceramic.
3.2 FEM simulation of mechanical stress
The mechanical stress of the samples, introduced by the bending device, was estimated by FEM simulations with the commercial ANSYS Mechanical APDL (the ANSYS parametric design language) software. For this purpose, a 3D model of the sample was created and inserted into the virtual three-point bending machine to simulate the distribution of the first principal stress along the longitudinal axis during bending tests. The three-point bending machine was reduced to the clamps, where the diameter is 1 mm of the clamping, which is shown in Fig. 5. The middle clamp is fixed, while the outer clamps, standing 40 mm away from each other, are moved evenly. The connection between clamp and sample is realized by a symmetrical contact with node-to-surface contact elements. This allows the sample to separate as a result of transverse contraction (see Fig. 5b). The material of clamps is, as in reality, represented by hardened steel. For clamps and the samples in Table 1, linear eight node elements (solid 185 element) with enhanced strain formulation were used to prevent shear locking. They were defined by mapped meshing with hexahedral elements. A meshing study resulted in an optimum between accuracy and computing time, with approximately 80 000 elements in the full model. As an example, the material of Sample 1 has linearly elastic properties, with a transverse contraction of 0.3, and the modulus of elasticity was determined iteratively, up to around 340 GPa, based on the force and displacement data measured during the three-point bending experiment.
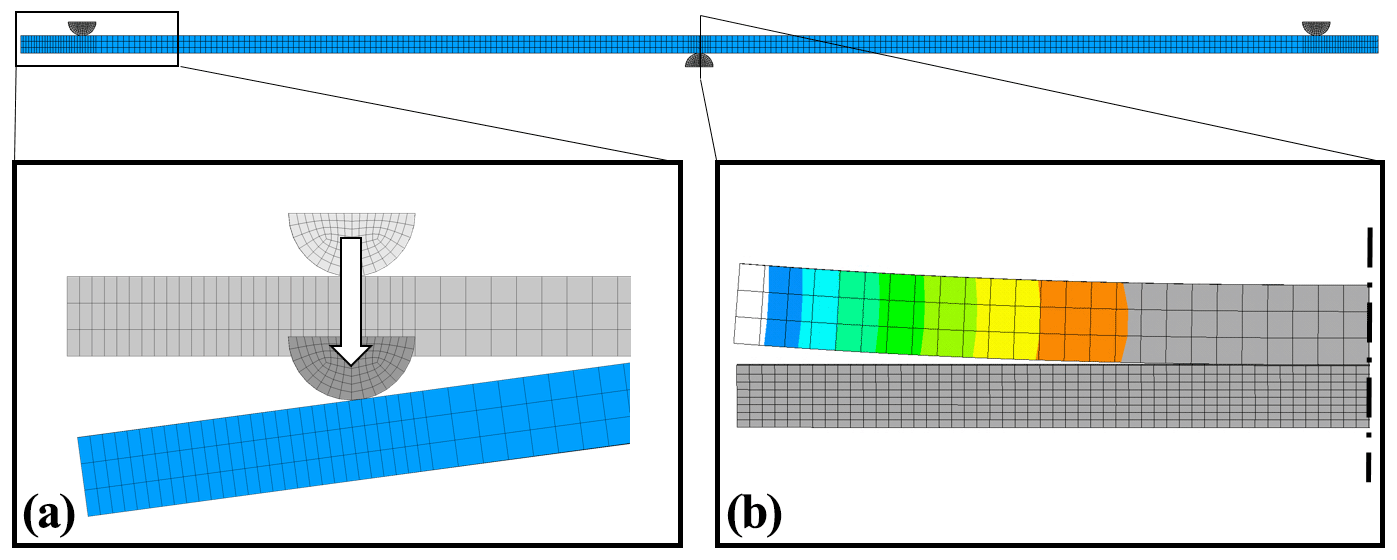
Figure 5FEM simulation of the three-point bending experiment with scaled details (a) of clamp movement and (b) of sample separation due to transverse contraction.
3.3 Experimental setup of defect detection
Measurements for defect detection on ceramics were carried out based on the analysis of dynamic speckle patterns during the thermal excitation. The experimental setup is shown in Fig. 6a. The same laser diode, which is shown in Fig. 4, was used to generate speckle patterns on sample surfaces. It is presented in Fig. 6 as illumination optics. A digital camera system, including a CMOS chip and an objective, serves as a detector to record speckle signals. The camera was focused on the surface of the ceramic, so the near-field speckle patterns were captured. The statistical properties of near-field speckles are related to the structure of the scattering object (Giglio et al., 2001) and can be connected to the structural properties of the sample surface. Thus, they are able to provide information about defects. As shown in Fig. 6a, the angle between the illumination optics and the camera was approximately 30∘. A high-power fiber laser, whose maximum output power is 50 W with a wavelength of 808 nm combined with a reflective collimator, was used to provide a thermal pulse to stimulate the sample, thus generating dynamic speckle signals. The temperature signal was captured by a pyrometer in parallel to the speckle recording, including the thermal excitation and the corresponding cooling procedure. Figure 6b demonstrates the temperatures measured by the pyrometer during the speckle measurements. An Al2O3 sample was illuminated by the excitation laser, with output powers from 10 to 50 W, respectively, and the excitation time was 1 s.
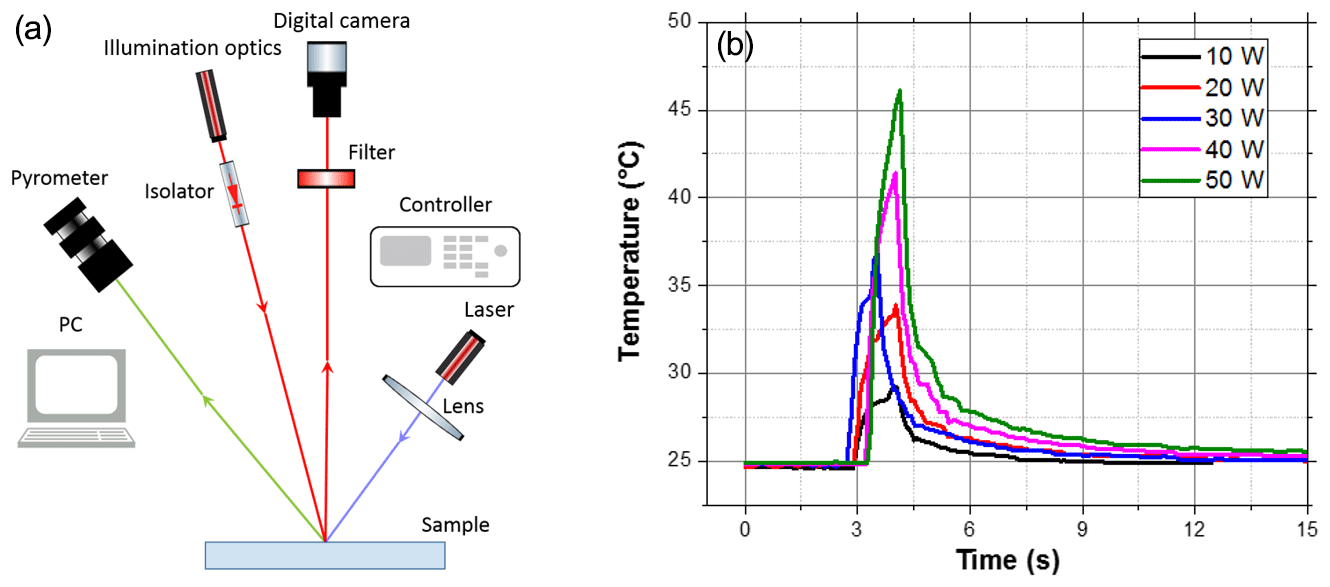
Figure 6(a) Experimental setup of LSP for defect detection. A laser diode generates speckle patterns on a sample surface. Dynamic speckle patterns produced by laser excitation are captured by a camera, and the pyrometer records the temperatures simultaneously. (b) Temperatures recorded by the pyrometer in parallel to the speckle measurements with thermal excitations by the laser from 10 to 50 W.
In order to evaluate speckle signals, two basic evaluation methods of the LSP are commonly used, namely static and quasi-static algorithms. The static algorithm focuses on the image analysis, which uses the gray-value-related parameters in combination with statistical properties of speckle images. Parameters calculated from the gray level co-occurrence matrix (GLCM), such as mean intensity, speckle contrast, speckle size, and texture properties (Haralick, 1979; Rabal and Braga, 2008), can be used to numerically represent speckle signals of the LSP technique. Quasi-static algorithms are focused on the analysis of differences in the gray value distributions of a single pixel in the time sequence. In our research of stress characterization and defect detection in ceramic samples, quasi-static algorithms have been used to evaluate the speckle parameters for the final results.
For the purpose of stress characterization, an algorithm based on the correlation equation was proposed. The time sequence processing, using the correlation equation, can be interpreted as the analysis of similarity between them. A high correlation means a great similarity between two different signals. In the work of Yamaguchi (1981), the strain information of a brass plate stressed in a tensile test was obtained by calculating the 1D speckle correlation. In addition, microscopic deformations in the uniform tensile test were also measured by digital speckle correlation (Sun et al., 1997). Taking into account the characteristics of the speckle patterns generated by a laser source on the surface of ceramic materials, a parameter based on the correlation equation was selected to represent speckle signals in the model equation. More specifically, the parameter is the coefficient of 2D correlation, defined by Eq. (2) as follows:
The coefficient r(t) was termed the correlation coefficient of speckles (CCoSs), which reveals the similarity between two recorded speckle images. In Eq. (2), Iij(t0) is the gray value of pixel (ij) in the image of speckle patterns when the stress is equal to zero. In addition, i presents the direction along y axis and j denotes the direction along x axis. In the present case, this corresponds to the first frame. is the gray value average of all the pixels in the first frame. Analogously, Iij(t) and represent the intensity of pixel (ij) in speckle images at different stress states and the average intensity of corresponding frames, respectively. In summary, the value of CCoSs implies a change in the time-resolved speckle patterns of a given frame compared to the first one. It thus shows the changes in stress in the tested specimens.
For defect detection by LSP, the algorithm was inspired by a time-resolved analysis. The intensity of each pixel is processed in the time domain. During the movement of speckle patterns, the time-variable intensity can be related to the spatial gradient of temperature and is analyzed by a special correlation function. Kazak et al. (2010) have demonstrated that the value of the correlation function is proportional to the local temperature of a certain region of interest. In contrast to the CCoSs mentioned above, the correlation function we used here is based on the semivariogram evaluation, a geostatistical tool for studying the relationship between collected data as a function of distance and direction (Mazzella and Mazzella, 2013). This calculates the intensity differences of pixels in the speckle patterns using Eq. (3), as follows:
The variable τ is the time shift or the frame number in video sequences. The change in the time-variable intensity for each individual pixel is calculated and considered as a dimensionless signal in the time domain. Since the thermal energy accumulates around defective areas, the dynamic speckle movement is more pronounced than that on the rest of the surface. Therefore, frequency analysis can be used to extract the contrast of speckle movements between defective and intact surfaces. To obtain the time–frequency information of the results of Eq. (3), either the short-time Fourier transform (STFT) or wavelet transform (WT) was applied to convert the dimensionless signal into the time–frequency domain (Namuq et al., 2013; Gao and Yan, 2006). In this case, the amplitudes of STFT or WT can be selected for all pixels at a specific time–frequency point to build the resulting image.
Arizaga et al. (2002) proposed a time domain algorithm. It calculates the accumulation of intensity difference of two adjacent frames and is stated as the idea of generalized differences (Arizaga et al., 2002). In this case, Eq. (3) is modified into the form of Eq. (4), as follows:
The summation of the intensity difference amplifies the slight difference, hidden in the speckle movements, between defective and intact surface. Hence, the defects appear as areas of enhanced brightness in the resulting images.
5.1 Stress characterization
The preliminary results of the measurements for Samples 1 and 2 in Table 1 are shown in Fig. 7. The data were obtained from a 200×200 µm2 area on the sample surface. The stress was calculated from FEM simulation, and the speckle parameter, CCoSs, was calculated using the quasi-static algorithm (Eq. 2). The measurements were repeated four times for each sample. Both variables are plotted against the time of measurement in the figures.
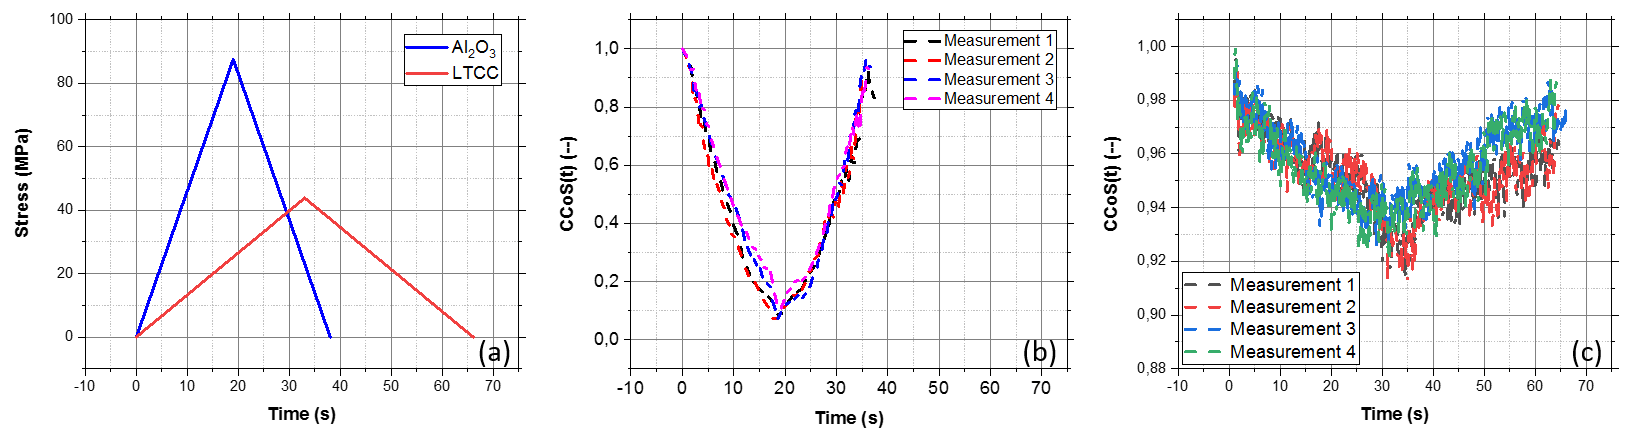
Figure 7(a) Stress calculated from FEM. (b) Resulting speckle signal of the Al2O3 sample. (c) Resulting speckle signal of the low-temperature cofired ceramic sample (LTCC).
Figure 7a–c show that the speckle parameter, CCoSs, has a linear relationship with the mechanical stress, induced by the bending device, for Al2O3 and low-temperature cofired ceramic samples (LTCCs) in the elastic range. The speckle signals change direction when the loading condition of the bending device becomes unloaded. Since CCoSs assess the similarities of speckle patterns at different stress states, they will lose the correlation with the initial state if the patterns change significantly. In this case, there is a measuring limitation from zero to approximately 90 MPa for the Al2O3 sample. For the LTCC sample, a stress difference of up to 45 MPa is detectable. Compared to the Al2O3 sample, LTCC showed a different amplitude and change in the CCoS parameter, which depends mainly on the material thickness and not on the correlation limit of the speckle signal. This phenomenon is caused by the different scattering models of ceramics. LTCC is opaque to 650 nm lasers, and speckle patterns generated on its surface are determined by surface scattering. Al2O3 is partially transparent for the wavelength of the used laser diode and shows volume scattering. The detected speckle patterns are the result of interference from the coherent source. This interference is controlled by the differences in optical paths. The surface scattering is determined by optical paths modulated by the fluctuation of the surface profile. The volume scattering, caused by the scattering at the grain boundaries in the volume, is dominated by the average distribution of path lengths (Goodman, 2007). The speckle patterns generated from surface scattering appear to change less than those generated from the volume scattering at the same surface strain condition. As shown in our experiments, the speckle patterns on the surface of LTCC did not change much, while the patterns on Al2O3 changed rapidly and then lost the correlation with the speckle pattern at the initial stress state. Additionally, the fluctuations of the resulting curves in Fig. 7c were caused by digital camera noise. This influence is about 2 % of the CCoSs.
Further tests were carried out on a sample (Sample 3) with an applied thick copper layer. The structure and process history of this sample corresponds to that of a real DCB substrate. A sketch of Sample 3 is shown in Fig. 8a. The blue dashed lines indicate the central axis of the sample. The fixed clamp is located here in the bending test. On the right-hand side of Fig. 8a, the details of the interaction between the copper layer and the Al2O3 substrate are presented. Speckle signals were captured from three different measuring positions (P1, P2, and P3) on the surface of the substrate. At each position, a region of interest (ROI) around 200×200 µm2, which corresponds to 300×300 pixels in the chip of digital camera, was chosen to record the speckle signal. P1 is very close to the copper layer, and P3 is approximately 1 mm from P1 in the transverse direction of the sample. During the bending experiments, the identical stress from P1 and P3 was disturbed by the existence of the copper layer that interferes with the deformation of the ceramic substrate. Figure 8b and c show the stress values calculated by the FEM for various measuring positions and the corresponding results of speckle signals. It can be observed from the figures that the behavior of the speckle signal curves at these positions are consistent with the mechanical stress. Such an observation indicates that there is a strong relation between the mechanical stress and the speckle signal. Consequently, strains and the derived mechanical stress can be characterized by the LSP technique.

Figure 8(a) Sketch of Sample 3, where P1, P2, and P3 are three measuring positions on the surface of the ceramic substrate, the orange coloring shows the copper layer, and the white part is the Al2O3 substrate. (b) FEM data of three measuring positions. (c) Resulting speckle signals of Sample 3 corresponding well to the mechanical stress shown in (b).
From the results, the limitations of LSP for stress characterization can also be concluded. When the characterization procedure is applied to a ceramic material, a corresponding characteristic model has to be established on the same material. The measuring range is influenced by the transmittance of the material to the illumination laser diode.
5.2 Defect detection
Figure 9 shows the defect detection results calculated from different algorithms in TiO2 and Na-β-alumina samples. The panels in the first column (Fig. 9a, e) are optical images without illumination by the laser diode. They show the positions and dimensions of the defects. The consecutive panels (Fig. 9b–d and f–h) are the resulting images calculated from WT, STFT, and the difference correlation function (DF); i.e., Eq. (4). In our measurements, the speckle images were captured with a frame rate of 30 frames per second, and samples were illuminated by a 50 W laser pulse lasting 1 s as the thermal excitation.
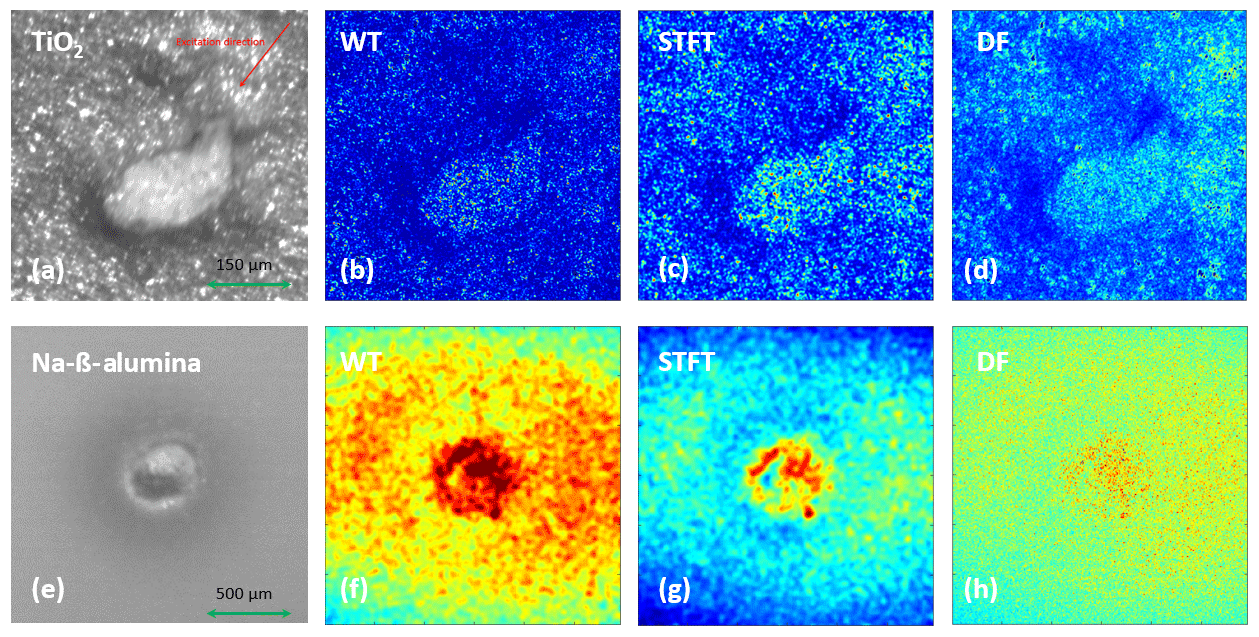
Figure 9Resulting images of defect detection. (a) Optical image of TiO2. (b–d) Resulting images of a defect in TiO2 as calculated by WT, STFT, and DF, respectively. (e) Optical image of Na-β-alumina. (f–h) Resulting images of Na-β-alumina as calculated by WT, STFT, and DF, respectively.
The resulting images are presented as pseudocolor images. The defects in the results of all algorithms are highlighted by an increased brightness. Both the position and approximate dimension can be determined and correspond well to the defect in the optical image. WT and STFT have time and frequency resolutions and, therefore, provide a series of resulting images, which reveal the amplitudes of the different frequency components of the time-varying speckle signals at different time stamps. The final resulting image was selected with an optimal spatial contrast between the defective area and the background. Meanwhile, the propagation of heat transport around the defective areas can also be observed in the resulting images at a specific frequency along the time axis. Finding an optimal excitation position could be helpful for developing better spatial contrasts in the resulting images, which helps us distinguish the defects from the background. However, the calculations of WT and STFT are time-consuming and limited by the performance of the computer. For instance, an evaluation of a video with 50 frames and a size of 500×500 pixels takes 2 h. This obviously does not satisfy the requirements of in-line inspection for industrial applications. In this context, DF shows its advantages, as it takes only 20 s to evaluate the same data. Nevertheless, the defects can be recognized easily. Therefore, the imaging method of DF has potential for industrial applications.
Figure 10 displays the results of defect detection in Al2O3 and Na-β-alumina samples evaluated by DF.

Figure 10Results of defect detection in ceramics calculated by DF. (a) A scratch in Al2O3. (b, c) Cracks in Al2O3. (d) A crack and an impurity in Na-β-alumina.
Figure 10 also shows that all defects are recognizable by an increase in brightness. As defect dimensions decrease, so image noise increases, which influences defect detection. In general, the ideal detectability of LSP is mainly determined by the sensor size of the digital camera. The sensor size is far greater than the wavelength of the laser source. On the other hand, in current research, the LSP method is limited by the thermal properties of ceramics such as the absorption coefficient, thermal diffusivity, and the coefficient of thermal expansion. These parameters influence the activation of dynamic speckle signals. Assuming an extreme situation, if a material has a small absorption coefficient and a small coefficient of thermal expansion, it is difficult to produce the speckle dynamics with an external laser source. Hence, the defects cannot be detected due to the lack of dynamic speckle information. Another limitation of the LSP technique for defect detection in the current research is the classification of defects. Since the results, the 2D images, and the defects are defined by features where they have nonuniform colors compared to the background, these features present only the existence of defects. From the resulting images, it is difficult to distinguish the type of defects if there is no reference information. As an example, Fig. 11 shows two different defects that have almost the same features in the resulting images. The idea of overcoming this limitation may be solved by the help of machine-learning algorithms. Should enough experiment data and corresponding images be obtained, the machine could be trained to observe the differences in detail for different defects. The type of defects will be distinguished on the basis of the morphology of the features in the resulting images. The shape of the defect is also an important factor for its detectability. Defects with sharp edges can be more easily detected than flat defects with nondistinct edges by the LSP technique because the thermal accumulation, mentioned above, on the sharp edges (e.g., an open crack) is higher than it is on the nondistinct one (e.g., a shallow pit). Compared to the visual inspection, LSP provides objective results and can be used in each stage of the manufacturing process. Based on a multitude of measurements on defective samples, defects such as scratches, cracks, pores, holes, and the “invasion by other colors” can be detected by means of LSP. In addition, the detectability of defects using LSP in ceramics is currently about 200 µm for crack lengths and 100 µm in diameter for pores and holes.
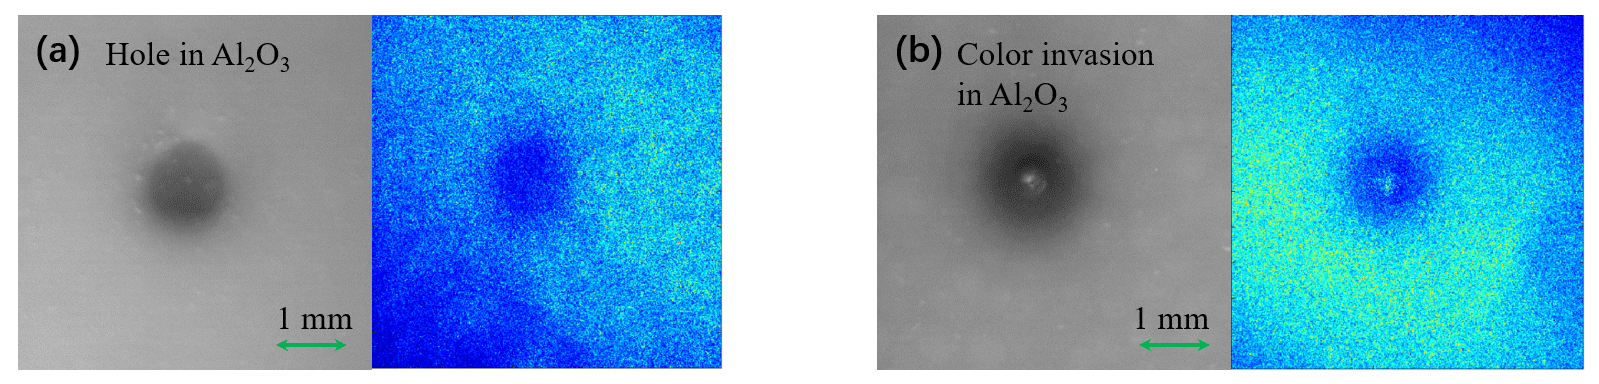
Figure 11Results comparison of different defects in Al2O3. (a) A hole in the surface. (b) Color changes on the surface (blue invades white).
This paper presents an optical sensor system based on the LSP technique for the characterization of ceramics, including mechanical stress measurement and defect detection. Based on the investigations, experimental setups and the corresponding evaluation algorithms are proposed. The preliminary results show the feasibility of measuring the mechanical stress on the surface of ceramic sheets by using the specific speckle parameter, CCoSs. It is shown that defects in different ceramics can be detected by both time–frequency domain analysis (WT and STFT, with a frequency resolution of 1 Hz and a time resolution of 0.25 s) and temporal analysis (DF). LSP has a simple but robust design that reduces the computational expense in comparison to other conventional optical nondestructive testing methods. It can be concluded that there is great potential for the LSP technique in the development of testing methods for ceramic materials.
Research data are available upon request from the authors.
LC performed the experiments, analyzed the data, developed the evaluation algorithms of the measurements, and wrote the initial paper. UC designed the experiments, analyzed the data, and revised the paper. SM performed the FEM simulations, contributed samples, and revised the paper. BB and MR conceived and designed the experiments, revised the paper, and led the projects. All authors approved the final paper.
The authors declare that they have no conflict of interest.
This article is part of the special issue “Sensors and Measurement Systems 2019”. It is a result of the “Sensoren und Messsysteme 2019, 20. ITG-/GMA-Fachtagung”, in Nuremberg, Germany, on 25–26 June 2019.
The authors would like to thank the German Federal Ministry for Economic Affairs and Energy for their support, within the framework of the “Zentrales Innovationsprogramm Mittelstand (ZIM) Kooperationsnetzwerke” for the “SubStress” project, and the Fraunhofer Society for providing the opportunity to participate in the research of the German Federal Ministry for Economic Affairs and Energy IGF research project of “Entwicklung eines optischen Inline-Verfahrens zur zerstörungsfreien Prüfung keramischer Hochleistungsbauteile”. In addition, the authors would like to show their appreciation to all the colleagues in the various institutions for their assistance during the investigation.
This research has been supported by the Federal Ministry for Economic Affairs and Energy (BMWi) within the framework of an IGF project on the research community of the German Ceramic Society e.V. (FDKG; grant no. 20012 BR) and the Federal Ministry for Economic Affairs and Energy (BMWi) within the framework of a ZIM project on the VDI/VDE Innovation + Technology GmbH (grant no. 16KN054326).
This paper was edited by Thomas Fröhlich and reviewed by three anonymous referees.
Arizaga, R. A., Cap, N. L., Rabal, H. J., and Trivi, M.: Display of local activity using dynamical speckle patterns, Opt. Eng., 41, 287–294, https://doi.org/10.1117/1.1428739, 2002.
Barth, M., Duckhorn, F., Tschoeke, K., Tschoepe, C., and Koehler, B.: Testing of ceramics by ultrasound microscopy and vibration analysis, in: Proceedings of the 19th World Conference on Non-Destructive Testing (WCNDT 2016), Munich, Germany, 13–17 June, 2016.
Bendjus, B., Cikalova, U., and Schreiber, J.: Material characterization by laser speckle photometry, in: Proceedings Volume 8413 of Speckle 2012, V International Conference on Speckle Metrology, Vigo, Spain, 841315, https://doi.org/10.1117/12.978246, 2012.
Blug, A., Regina D. J., Eckmann, S., Senn, M., Bertz, A., Carl, D., and Eberl, C.: Real-time GPU-based digital image correlation sensor for marker-free strain-controlled fatigue testing, Appl. Sci., 9, 2025, https://doi.org/10.3390/app9102025, 2019.
Cikalova, U., Bendjus, B., and Schreiber, J.: Laser-speckle-photometry–A method for non-contact evaluation of material damage, hardness and porosity, Mater. Test., 54, 80–84, https://doi.org/10.3139/120.110299, 2012a.
Cikalova, U., Bendjus, B., and Schreiber, J.: Laser speckle photometry: contactless nondestructive testing technique, in: Proceedings Volume 8413 of Speckle 2012, V International Conference on Speckle Metrology, Vigo, Spain, 84130X, https://doi.org/10.1117/12.978247, 2012b.
Gao, Q., Wang, J., Zhang, Y., Zhou, J., Peng, J., Hu, S., and Zeng, Y.: Residual stress distribution of the soldered structure with Kovar alloy and Al2O3 ceramics, Process. Appl. Ceram., 11, 75–81, https://doi.org/10.2298/PAC1701075G, 2017.
Gao, R. X. and Yan, R.: Non-stationary signal processing for bearing health monitoring, International Journal of Manufacturing Research, 1, 18–40, https://doi.org/10.1504/IJMR.2006.010701, 2006.
Giglio, M., Carpineti, M., Vailati, A., and Broqioli D.: Near-field intensity correlations of scattered light, Appl. Optics, 40, 4036–4040, https://doi.org/10.1364/ao.40.004036, 2001.
Goodman, J. W.: Statistical properties of laser speckle patterns, in: Laser Speckle and Related Phenomena, edited by: Dainty, J. C., Springer, Berlin, Heidelberg, Germany, 9–75, https://doi.org/10.1007/978-3-662-43205-1_2, 1975.
Goodman, J. W.: Statistical Optics, Wiley-Interscience, New York, USA, 1985.
Goodman, J. W.: Speckle phenomena in optics: theory and applications, Roberts and Company Publishers, Colorado, USA, 2007.
Haralick, R. M.: Statistical and structural approaches to texture, in: Proceedings of the IEEE, 67, 786–804, https://doi.org/10.1109/PROC.1979.11328, 1979.
Jannotti, P., Subhash, G., Zheng, J., and Halls, V.: Measurement of microscale residual stresses in multi-phase ceramic composites using Raman spectroscopy, Acta. Mater., 129, 482–491, https://doi.org/10.1016/j.actamat.2017.03.015, 2017.
Kazak, N. S., Khilo, N. A., Maschenko, A. G., Ropot, P. I., Mukhurov, N. I., and Schreiber, J.: Speckle-photometry method of measuring the coefficient of thermal diffusion, in: Proceedings of International Conference “Optical Techniques and Nano-Tools for Material and Life Sciences”, Minsk, Belarus, 16–19 June, 61–72, 2010.
Kesharaju, M., Nagarajah, R., Zhang, T., and Crouch, I.: Ultrasonic sensor based defect detection and characterisation of ceramics, Ultrasonics, 54, 312–317, https://doi.org/10.1016/j.ultras.2013.07.018, 2014.
Mainjot, A. K., Schajer, G. S., Vanheusden, A. J., and Sadoun, M. J.: Residual stress measurement in veneering ceramic by hole-drilling, Dent. Mater., 27, 439–444, https://doi.org/10.1016/j.dental.2010.12.002, 2011.
Mazzella, A. and Mazzella, A.: The importance of the model choice for experimental semivariogram modelling and its consequence in evaluation process, J. Eng., 2013, 960105, https://doi.org/10.1155/2013/960105, 2013.
Muench, S., Roellig, M., Cikalova, U., Bendjus, B., Chen, L., and Sudip, S.: A laser speckle photometry based non-destructive method for measuring stress conditions in direct-copper-bonded ceramics for power electronic application, in: Proceedings of the 18th International Conference on Thermal, Mechanical and Multi-Physics Simulation and Experiments in Microelectronics and Microsystems (EuroSimE), Dresden, Germany, 2–5 April, 1–8, https://doi.org/10.1109/EuroSimE.2017.7926273, 2017.
Namuq, M. A., Reich, M., and Bernstein, S.: Continuous wavelet transformation: A novel approach for better detection of mud pulses, J. Petrol. Sci. Eng., 110, 232–242, https://doi.org/10.1016/j.petrol.2013.08.052, 2013.
Okuma, G., Watanabe, S., Shinobe, K., Nishiyama, N., Takeuchi, A., Uesugi, K., Tanaka, S., and Wakai, F.: 3D multiscale-imaging of processing-induced defects formed during sintering of hierarchical powder packings, Sci. Rep-UK, 9, 11595, https://doi.org/10.1038/s41598-019-48127-y, 2019.
Rabal, H. J. and Braga Jr., R. A. (Eds.): Dynamic Laser Speckle and Applications, CRC Press, Boca Raton, Florida, USA, 2008.
Schenuit, E., Bolkart, R., Becker, T., and Spinka, O.: Optical strain measurement on small specimens based on laser speckles, Mater. Sci. Forum, 584, 237–242, https://doi.org/10.4028/www.scientific.net/msf.584-586.237, 2008.
Skácel, J., Otáhal, A., Szendiuch, I., and Hejátková, E.: X-ray inspection of ceramic structures, in: Proceedings of the 41st International Spring Seminar on Electronics Technology (ISSE), Zlatibor, Serbia, 16–20 May 2018, 1–4, 2018.
Sun, Z., Lyons, J. S., and McNeill, S. R.: Measuring microscopic deformations with digital image correlation, Opt. Laser Eng., 27, 409–428, https://doi.org/10.1016/S0143-8166(96)00041-3, 1997.
Tausendfreund, A., Stöbener, D., and Fischer, A.: Precise in-process strain measurements for the investigation of surface modification mechanisms, J. Manuf. Mater. Process, 2, 9, https://doi.org/10.3390/jmmp2010009, 2018.
Tripathi, G., Anowarul, H., Agarwal, K., and Prasad, D. K.: Classification of micro-damage in piezoelectric ceramics using machine learning of ultrasound signals, Sensors-Basel, 19, 4216, https://doi.org/10.3390/s19194216, 2019.
Tzou, D. Y.: Macro-to Microscale Heat Transfer: The Lagging Behavior, Second Edition, Wiley, New Jersey, USA, 2014.
Xi, Y., Gao, K., Pang, X., Yang, H., Xiong, X., Li, H., and Volinsky, A. A.: Film thickness effect on texture and residual stress sign transition in sputtered TiN thin films, Ceram. Int., 43, 11992–11997, https://doi.org/10.1016/j.ceramint.2017.06.050, 2017.
Yamaguchi, I.: A laser-speckle strain gauge, J. Phys. E. Sci. Instrum., 14, 1270, https://doi.org/10.1088/0022-3735/14/11/012, 1981.