the Creative Commons Attribution 4.0 License.
the Creative Commons Attribution 4.0 License.
Miniaturized photoacoustic detection of organofluorine-based refrigerants
Mahmoud El-Safoury
Christian Weber
Olaf Kiesewetter
Yvonne Hespos
André Eberhardt
Katrin Schmitt
Jürgen Wöllenstein
Due to the ban on hydrofluorocarbon and haloalkane refrigerants with a high global warming potential, such as R134a, in the automotive industry, the significance of reliable and precise measuring devices for these refrigerants has risen. We present a photoacoustic gas detector for monitoring the organofluorine-based refrigerants R134a and R1234yf. The idea for this sensor is based on the three-chamber concept (a detection chamber, absorption chamber, and filter chamber). The optimal parameters and dimensions of the photoacoustic sensor components were determined via simulations. The simulation results were the cornerstone of our hardware construction. The first measurements with the newly developed sensor showed a sufficient signal-to-noise ratio for a reliable 0.5 vol. % (0.005 m3 m−3) detection resolution. The influence and importance of the filter chamber were examined and validated.
- Article
(5041 KB) - Full-text XML
- BibTeX
- EndNote
Carbon–fluorine-based refrigerants are commonly used by mobile and stationary cooling systems. However, they are classified as greenhouse gases and, therefore, contribute to global warming (Minor and Spatz, 2008). This affects the automotive industry, among others, due to the use of R134a (also referred to as 1,1,1,2-tetrafluoroethane, R-134a, and HFC-134a) for vehicle air conditioning. R134a is a nonflammable gas with a global warming potential (GWP) of 1300 (according to the IPCC Fifth Assessment Report from 2014 when compared with carbon dioxide (Myhre et al., 2013). The high GWP of R134a led to a European ban on this particular refrigerant that came into effect in 2017 for all newly manufactured vehicles (European Union, 2006). Instead, the more expensive hydrofluoroolefin R1234yf (also referred to as 2,3,3,3-tetrafluoropropene, is considered an environmentally less harmful alternative due to its significantly lower GWP of 4 (Minor and Spatz, 2008). Because of the high similarity in the thermodynamic properties of both refrigerants, illegal refilling of cheaper gas mixtures containing the two refrigerants needs to be detectable in order to implement the ban and counteract global warming (Minor and Spatz, 2008). This paper presents and describes a newly developed low-cost photoacoustic-based gas detector for monitoring R134a and R1234yf refrigerants, with special focus on the technical design for the selective detection of both gases.
The newly developed sensor is based on the photoacoustic effect, which was first published by Alexander Graham Bell in 1880 (Bell, 1880). The publication describes the relation between the absorption of emitted light in a constantly held gas volume and the resulting pressure increase within the volume (Bell, 1880). Gas molecules in the ground state are excited when light with a wavelength that coincides with an absorption band of the molecules is absorbed (Bozóki et al., 2011). The molecular absorption of photons transfers the molecules into an excited state, which induces heating of the gas volume in the detection chamber when the excited state loses its energy via collisional relaxation (Miklós et al., 2001). Due to the proportional relation between temperature and pressure within a constant volume (assuming the ideal gas law), an increase in the gas temperature results in an increase in the pressure within the gas-filled chamber. A microphone can detect this change in pressure and transduces it into an electrical signal (Bozóki et al., 2011). The amplitude of the generated sound wave – which complies with the photoacoustic signal (PAS) – is directly related to the concentration of the light-absorbing gas (Bozóki et al., 2011). Modulating the light source at a certain frequency causes a matching frequent change in the pressure, as well as in the detected microphone signal, within the gas-filled chamber (Schmid, 2006).
A functional photoacoustic detector requires a light source, a photoacoustic measurement cell, a transducer, and analysis electronics (Bozóki et al., 2011).
As previously described, the gas molecules in the ground state are excited when light with a specific wavelength is absorbed. A common method is the use of broadband infrared (IR) light sources (like thermal emitters) in combination with optical filters (Harren et al., 2006).
The sensitivity of a photoacoustic-based measurement device is mainly influenced by the design of the photoacoustic cell (Bozóki et al., 2011). Using the nonresonant technical configuration of the photoacoustic detector, the light modulation frequency is far below the lowest resonance frequency of the cell (Bozóki et al., 2011). Unlike the resonant configuration, no signal amplification takes place at a nonresonant detection (Bozóki et al., 2011). Nonresonant photoacoustic systems can be designed as two-chamber (Huber et al., 2016) or three-chamber detectors.
A two-chamber-based photoacoustic detector has a hermetically sealed detection chamber containing the microphone and the target gas (“red” molecules in Fig. 1) (Huber et al., 2016). In addition, an absorption chamber is placed between the light source and the detection chamber. When the absorption chamber is filled with the gas mixture to be tested, a reduction in the microphone signal results (Huber et al., 2016). When the test gas in the absorption chamber and the target gas in the detection chamber are equal, the detected signal is reduced significantly due to the high absorption distance, as shown in Fig. 1b. The leftover photons that reach the detection chamber after being almost completely absorbed by the gas molecules in the absorption chamber result in a large signal change (Fig. 1b). Conversely, when the absorption chamber is filled with an intruding gas (“blue” molecules in Fig. 1), whose large main absorption band coincides with that of the target gas, the microphone signal only shows a slight signal reduction (Fig. 1c). That is because the intruding gas molecules will absorb photons in a similar fashion to the target gas. The leftover photons that reach the detection chamber, after being partially absorbed by the intruding gas molecules in the absorption chamber, lead to a cross sensitivity. As such, the detected photoacoustic signal includes an additional unwanted signal from the intruding gas when a gas mixture comprised of the target and intruding gas is introduced into the absorption chamber, as shown in Fig. 1d. To reduce this cross sensitivity, the three-chamber-based approach has been tested.
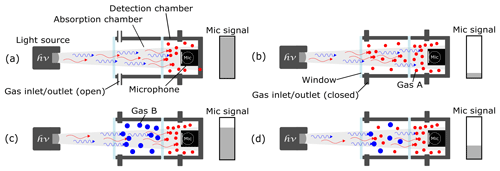
Figure 1The working principle of a two-chamber-based photoacoustic detection. (a) An unfilled absorption chamber and a gas-filled detection chamber generate a maximum microphone signal amplitude. (b) When the target gas A is introduced into the absorption chamber, the microphone signal is reduced to its lowest value. (c) When an intruding gas B – which has similar IR absorption behavior (to gas A) – is filled into the absorption chamber, the microphone signal is slightly reduced due to cross sensitivities. (d) The detected signal of a gas mixture comprising gas A and gas B in the absorption chamber would include the additional signal of the intruding gas B.
The three-chamber approach is identical to the two-chamber approach with respect to the detection and absorption chambers, but it also includes an additional gas-filled filter chamber that is positioned between the light source and the absorption chamber (Fig. 2). The filter chamber manipulates the spectrum of the IR broadband light source, removing the spectra of the nontarget gas. When the filter chamber is filled with a known intruding gas (“blue” molecules in Fig. 2), a cross sensitivity of the photoacoustic detector to this gas is theoretically eliminated. An ideal filter chamber would absorb all of the photons of the intruding gas before they could reach the absorption chamber, which is filled with the measuring gas (“red” molecules in Fig. 2). The leftover photons would be absorbed afterwards by the introduced target gas in the absorption chamber, resulting in a reduction in the amount of photons that reach the detection chamber. The detected signal amplitude drops would then depend solely on the target gas concentration in the absorption chamber and would be independent of the interfering gases, as shown in Fig. 2d.
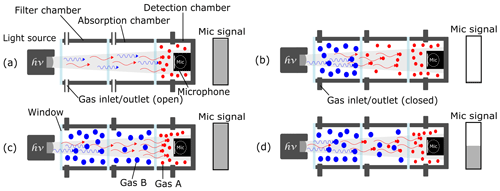
Figure 2The working principle of a three-chamber-based photoacoustic detection. (a) An unfilled absorption and filter chamber and a gas-filled detection chamber generate the maximum microphone signal amplitude. (b) The intruding gas B is filled into the filter chamber and absorbs all of the “blue” photons. When the target gas A is introduced into the absorption chamber, the microphone signal is reduced to its lowest value. (c) When gas B – which has similar IR absorption behavior (to gas A) – is filled into the absorption chamber, the microphone signal stays at its maximum value due to the eliminated cross sensitivities. (d) The microphone signal only depends on the concentration of gas A in the absorption chamber regardless of the amount of the intruding gas B.
4.1 Absorption spectra of R1234yf and R134a
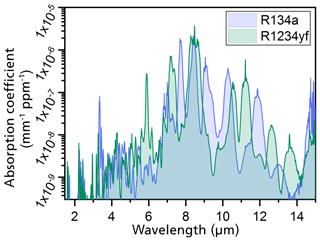
The determination of the primary geometry of the photoacoustic sensor was numerically simulated. The simulations were based on high-resolution FTIR spectroscopy measurements of both refrigerants. The IR spectra were taken for refrigerant concentrations from 0.5 vol. % to 100 vol. % (Weber et al., 2019). The gas samples were filled into a 10 cm long cuvette, which was integrated into the FTIR spectrometer, to determine the absorption spectra at each set gas concentration (Weber et al., 2019). Using the measured spectra, the absorption coefficients of R1234yf and R134a were calculated. Figure 3 shows the dependence of the calculated spectral absorption coefficients on the emitted IR wavelength. The calculated spectra show that both refrigerants absorb at IR wavelengths between 3 and 15 µm. The main absorption band for both R1234yf and R134a is at a wavelength of 8.5 µm, as can be observed in Fig. 3 (Weber et al., 2019). In addition to the main band, both spectra show stronger absorption bands in the region between 7 and 12 µm (Weber et al., 2019).
4.2 Simulation results
The optimal detector geometries for both refrigerants were determined by numerically simulating the IR absorption behavior of the gases. Due to the complexity of the photoacoustic effect, we considered the spectral power density that is absorbed in the detection chamber. The aim of these simulations was to determine the optimal technical implementations of both detectors to achieve a higher sensitivity to the targeted gas while also maintaining a low cross sensitivity to other refrigerants and ambient gases. The detectors were also required to measure the target gases within the complete concentration range between 0 vol. % and 100 vol. %.
The simulations were carried out for the three-chamber-based detection concept. An IR emitter with a 2 mm × 2 mm radiating area, an emissivity of 0.9, and an emitting temperature of 700 ∘C was assumed for the following simulations (Weber et al., 2019).
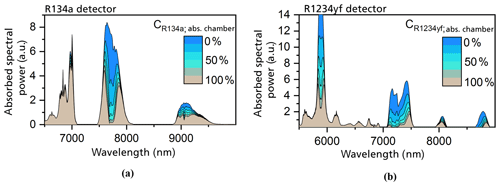
Figure 4The simulated absorbed spectral power densities in the detection chambers with different concentrations of R134a (a) and R1234yf (b) in the respective detectors (Weber et al., 2019). The absorption chamber length is set to an optimal value of 4 mm for the R134a detector and 1 mm for the R1234yf detector. The detection chamber was set to a length of 3 mm and a diameter of 8 mm in both cases, whereas the gas-filled filter chamber length was set to 50 mm.
The primary simulation results showed that an absorption length within the detection chamber of 3 mm was adequate for a complete absorption of the incoming radiation at the wavelength range of the strongest main bands of both refrigerants (Weber et al., 2019). The diameter of the detection chamber was set to 8 mm to ensure the proper inclusion of a commercial MEMS microphone during the realization of the photoacoustic measurement system (Weber et al., 2019).
To reduce the cross sensitivity to the interfering refrigerant and ambient gases, the length of the filter chambers was set to 50 mm (Weber et al., 2019). The simulations were carried out with gas-filled filter chambers. In the case of the R1234yf detector, the filter chamber was set to be filled with 100 vol. % R134a, whereas the filter chamber of the R134a detector contained 100 vol. % R1234yf.
The simulated results proved that the optimal absorption chamber lengths are 1 mm for the R1234yf detector and 4 mm for the R134a detector (Weber et al., 2019). Figure 4 shows the simulated absorbed spectral power densities in the detection chamber of a R1234yf and R134a sensor at variable gas concentrations in the absorption chamber. In both cases, we concluded that the large main bands at 8.5 µm do not contribute to the total generated and detected signal, showing the high effectiveness of the filter chamber. The total signal in the R134a detector is mainly generated by the absorption band at 7.7 µm and by the bands below 7 µm (which are irrelevant for the gas-dependent signal). The photoacoustic signal in the case of the R1234yf detector is caused by the larger bands at 5.8 and 7.3 µm. The smaller spectral bands between 5 and 7 µm contribute to the total generated signal but are of no significance with respect to the gas-concentration-related signal.
Simulations of the integrally absorbed power in the detection chamber further examined the sensitivity and cross sensitivity of both refrigerant detectors. The detector reactions were calculated for the separate introduction of different humidity and CO2 levels as well as the R1234yf and R134a refrigerants into the absorption chamber. The concentration range of the respective gases and the humidity levels considered in the absorption chamber was between 0 vol. % and 100 vol. %.
As shown in Fig. 5b, the simulated sensitivity of the R1234yf detector to the R1234yf gas is about 17 times higher than the simulated sensitivity to R134a. The simulation results in Fig. 5a also show the comparably high sensitivity of the R134a detector to the R134a refrigerant when compared with the detector's response to R1234yf.
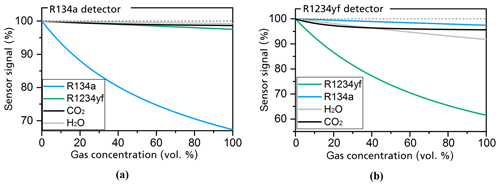
Figure 5Simulations of the detector's response to the R134a (a) and R1234yf (b) refrigerants as well as the ambient gases H2O and CO2 at a respective gas concentration range of between 0 and 100 vol. % (Weber et al., 2019). All set geometries and conditions are the same as those of the simulations in Fig. 4.
The simulations in Fig. 5 further consider the cross sensitivity of the sensor with ambient gases such as CO2 and H2O (humidity), which can occur at relatively high concentrations in the air. CO2 can occur at concentrations of up to 5000 ppm (parts per million), whereas H2O can be found at concentrations of up to 20 000 ppm. The simulations for the R134a detector (in Fig. 5a) show a maximum error of 0.017 % of the full-scale signal for CO2 and 0.016 % for H2O. The simulations for the R1234yf detector (in Fig. 5b) show that the signal is reduced by 0.1 % at 5000 ppm CO2, whereas 20 000 ppm H2O reduces the sensor signal by 0.14 %. A recalibration of the sensors with ambient air or an additional separated measurement of the CO2 concentrations and humidity levels could compensate for these cross sensitivities.
All in all, the simulations showed that the determined geometries of both refrigerant detectors can differentiate reliably between the measured and interfered gases, and they can also measure the target gas concentration.
5.1 Preparation of sensor components
The simulated results were passed on to an external company (Simek GmbH) that developed the hardware for the photoacoustic sensors using the specified geometries. After the components were milled, an additional gold layer was deposited on the smoothed surface of the sensor components to increase the reflectivity within the chambers and reduce signal losses.
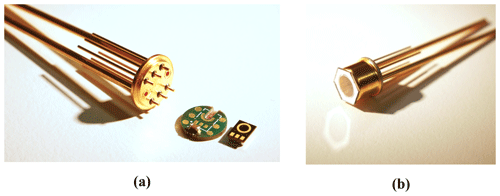
Figure 6The detection chamber. (a) The base of the housing showing six pins and two tubes that were led through glass feedthroughs in the base. (b) The TO-5 housing cap with a soldered silicon window is soldered to the base.
The chamber windows are essential in the photoacoustic detection principle. Metallized silicon windows with about 50 % transmittance at the required IR wavelength range were used (the metallization process was completed in the Fraunhofer IPM clean room). Soldering the windows to the gas-filled photoacoustic chambers guarantees a long-term gas-tight seal which is necessary for the sensor signal stability.
5.2 Detection chamber
A TO-5 housing (manufactured by Simek GmbH and shown in Fig. 6) was used for the detection chamber due to the similarity of its dimensions to the simulated geometries. The outer length of the TO-5 cap was set to 6.60 mm, whereas the inner space diameter was set to 7.66 mm. The optical aperture diameter of the TO-5 cap was set to 6.35 mm. The base of the TO-5 housing (which had an outer diameter of 9 mm, an elevated inner diameter of 7.60 mm, and a total base thickness of 1.25 mm) was extended with six pins and two tubes that were led through glass feedthroughs in the base, as can be seen in Fig. 6a. The tubes are necessary to fill the detection chamber with the target gas, while the six pins are soldered to the microphone interposer circuit board. The interposer circuit board (shown in Fig. 6a) was designed to have a small channel for the transduction of the acoustic waves to the microphone opening. A SMD MEMS microphone was used (ICS-40720; TDK). Both the soldering of the microphone to the specified foot print on the circuit board and the soldering of the interposer circuit to the TO-5 base pins were carried out in a single step in the reflow oven. Furthermore, the TO-5 housing cap with a soldered silicon window was soldered to the base, completing the gas-tight detection chamber (Fig. 6b). After the detection chamber was filled with the target gas, both filling tubes were mechanically shut in a first step. An additional solder sealing of the tube openings was then necessary to ensure that the chamber was gas tight.
5.3 Experimental setup
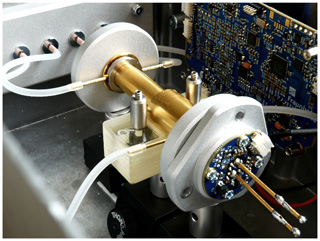
The sensor hardware was fixed to mechanical posts that were secured to a rail system, as shown in Fig. 7. The mechanical rail system with the fixed sensor components was then integrated into an aluminum box. Precalibrated mass flow controllers were used for a precise flow velocity and, thus, concentration adjustment of the respective refrigerants (R1234yf and R134a) and N2 within the absorption chamber of the sensors. Software, which was developed at the Fraunhofer IPM, regulated the mass flow controllers' flow velocity. Silicone tubes were used to guide the gas mixtures to the absorption and filter chambers. The silicone shows low water absorption (about 2 vol. % swelling of the tubes after 168 h immersion into distilled water) (Shin-Etsu, 2016). Because all measurements were carried out during gas flow and at about 41 % ambient humidity in the laboratory, the influence of varying humidity levels on the silicone tubes is negligible. The measurement results shown in this review were obtained with a filter chamber that was only mechanically closed (for flexibility during sensor testing) after filling the chamber with the respective gas.
6.1 Evaluation of the two-chamber-based photoacoustic R134a sensor
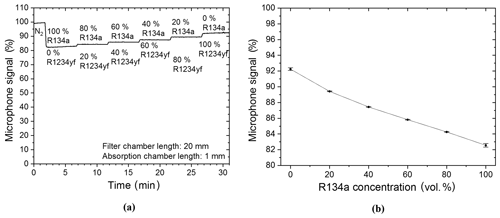
The filter chamber of the R134a sensor was filled with N2 so that it would have no additional effect on the detected signal during the first measurements and, also, so that measurements with a two-chamber-based sensor could be shown. The target gas was filled and hermetically sealed into the detection chamber of the sensor system. Primary measurements were carried out with a R134a–N2 gas mixture. The R134a concentration in the absorption chamber was changed in 20 vol. % increments from 0 vol. % (thus 100 vol. % N2) to 100 vol. % (thus 0 vol. % N2). Figure 8a shows that the detected photoacoustic signal is reduced stepwise with each increased refrigerant concentration increment. A further analysis of the functional relation between the microphone signal and the R134a volume concentration shows an exponential decay with increasing R134a concentration (Fig. 8b).
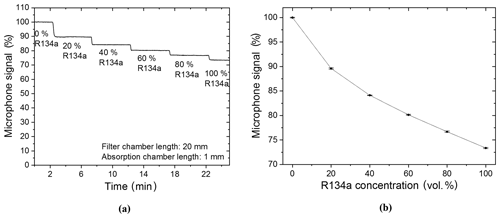
Figure 8(a) Two-chamber-based R134a detector measurements of different concentrations of R134a (mixed with N2). (b) The resulting exponentially decaying relation between the microphone signal and the R134a volume concentration when the R134a concentration is varied in the absorption chamber. A simplified expression of the resulting exponential decay is f(x)=bx, while .
The evaluation of the two-chamber-based detection continued with the measurement of gas mixtures containing the target and intruding gas under conditions identical to those in Fig. 8. The measured gas mixtures contain different concentration ratios of the R134a and R1234yf refrigerants. After a primary N2 flow in the absorption chamber, the refrigerant concentrations were varied in 20 vol. % increments from 100 vol. % R134a (thus 0 vol. % R1234yf) to 0 vol. % R134a (thus 100 vol. % R1234yf). The results in Fig. 9a show an expected decrease in the detected signal at 100 vol. % R134a; however an additional decrease in the signal was also noted when the target gas concentration was reduced to 80 vol. % (thus 20 vol. % R1234yf). This additional decrease in the photoacoustic signal is due to the high cross sensitivity of the two-chamber-based sensor to the intruding gas R1234yf. Furthermore, the functional relation between the microphone signal and the R134a volume concentration shows a quadratic relation (Fig. 9b) when carrying out measurements of R134a and R1234yf mixtures in the two-chamber-based R134a detector, which is clearly different to the behavior observed in Fig. 8b. Accordingly the two-chamber-based detection concept is not suitable for a reliable independent detection of the R1234yf and R134a refrigerants.
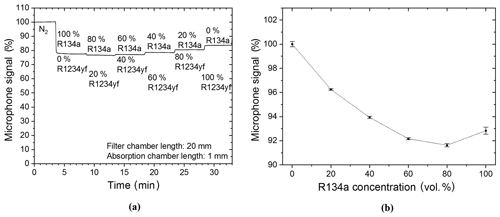
Figure 9(a) Two-chamber-based R134a detector measurements of different mixture ratios (in vol. %) of R134a to R1234yf. (b) The resulting parabolic functional relation between the microphone signal and the R134a volume concentration when both refrigerants are mixed into the absorption chamber of the two-chamber-based detector. A simplified expression of the quadratic functional relation is .
6.2 Evaluation of the three-chamber-based photoacoustic R134a sensor
Following the measurements with the two-chamber-based R134a sensor, the three-chamber-based detection concept was examined. As a first step, the filter chamber was filled with the intruding R1234yf refrigerant and was then mechanically sealed. The exact same measurement (as those in Fig. 9) was then carried out again with the three-chamber R134a sensor. The measurement results with the gas-filled filter chamber are shown in Fig. 10. A comparison of the measurement results in Figs. 9 and 10 shows that the gas-filled filter chamber reduced the influence of the intruding gas on the detected signal. An increase in the signal at a set gas mixture of 80 vol. % R134a and 20 vol. % R1234yf in the absorption chamber can be observed in Fig. 10a. In addition, the functional relation between the microphone signal and the R134a volume concentration shows the exponential decay with increasing refrigerant concentrations (Fig. 10b), which is similar to the behavior in Fig. 8b. The measurement results match the simulated results and show the expected functionality and importance of the filter chamber in reducing the cross sensitivity.
The drift (∼0.1 % of the sensor signal per minute), which can be observed from the measurements in Fig. 10a, is caused by escaping R1234yf due to the fact that the mechanical sealing of the filter chamber is not completely gas-tight. Soldered sealing of the filling tubes results in a hermetic closure of the gas-filled filter chamber (equivalent to the detection chamber), which will be considered for the industrialized sensor systems.
Since the European ban on the refrigerant R134a in the automobile industry due to its high global warming potential, the importance of reliable gas measurement technologies has increased. Due to the high costs of the alternative refrigerant R1234yf, the usage of illegal and low-priced refrigerant mixtures of R134a and R1234yf needs to be prevented. Therefore, a low-cost, reliable, photoacoustic-based gas detector that can differentiate between both refrigerant concentrations in a mixture has been developed. Owing to the high similarity of the main absorption bands of both gases, a three-chamber-based sensor concept was invented. In addition to the detection and absorption chambers, a filter chamber between the light source and the absorption chamber is required. The detection chamber was filled with the target gas, while the absorption chamber was filled with the examination gas mixture. The filter chamber was filled with the intruding gas to reduce the cross sensitivities of the gas on the detected signal. This detection concept was simulated, and the importance of the filter chamber was verified using laboratory measurements. The experiments showed that the gas-filled chambers have to be gas tight to maintain a stable sensor signal; this seal was achieved using soldered seals.
Further research is required, focusing on the optimization of the sensor hardware, to achieve a higher reduction in the total production costs and increase sensor sensitivity.
An additional texturing of the metallized window surface and/or an antireflection coating could increase the transmittance noticeably when using low-cost window materials like silicon.
Data sets are available at https://doi.org/10.24406/fordatis/59 (El-Safoury and Weber, 2020).
JW and OK conceptualized the project. MES and CW conceived and designed the experiments. CW developed the software, the analysis electronics, and performed the simulations. MES designed and developed the experimental setup. YH and AE set up the gas-filled detection chambers. MES and CW performed the experiments and analyzed the data. MES wrote the paper and KS proofread it.
The authors declare that they have no conflict of interest.
This article is part of the special issue “Sensors and Measurement Systems 2019”. It is a result of the “Sensoren und Messsysteme 2019, 20. ITG-/GMA-Fachtagung”, Nuremberg, Germany, 25–26 June 2019.
The authors acknowledge the financial support from the VDI/VDE Innovation + Technik GmbH in the framework of the CONTECT-R project (grant no. 16ES0524).
This research has been supported by the VDI/VDE Innovation + Technik GmbH.
This paper was edited by Tilman Sauerwald and reviewed by two anonymous referees.
Bell, A. G.: On the production and reproduction of sound by light, Am. J. Sci., 20, 305–324, 1880.
Bozóki, Z., Pogány, A., and Szabó, G.: Photoacoustic Instruments for Practical Applications: Present, Potentials, and Future Challenges, Appl. Spectrosc. Rev., 46, 1–37, 2011.
El-Safoury, M. and Weber, C.: Miniaturized photoacoustic detection of organofluorine-based refrigerants, https://doi.org/10.24406/fordatis/59, 2020.
European Union: Directive 2006/40/EC of the European Parliament and of the Council of 17 May 2006 relating to emissions from air-conditioning systems in motor vehicles and Amending Council Directive 70/156/EEC, Off. J. Eur. Union, 12–18, 2006.
Harren, F. J. M., Mandon, J., and Cristescu, S. M.: Photoacoustic spectroscopy in trace gas monitoring, in: Encyclopedia of Analytical Chemistry: Applications, Theory and Instrumentation, John Wiley & Sons Ltd, 2006.
Huber, J., Schmitt, K., and Wöllenstein, J.: Simulation model for the evaluation and design of miniaturized non-resonant photoacoustic gas sensors, J. Sensors Sensor Syst., 5, 293–299, 2016.
Miklós, A., Hess, P., and Bozóki, Z.: Application of acoustic resonators in photoacoustic trace gas analysis and metrology, Rev. Scient. Instrum., 72, 1937–1955, 2001.
Minor, B. and Spatz, M.: HFO-1234yf low GWP refrigerant update, International Refrigeration and Air Conditioning, Conference, paper 937, 14–17 July 2008, Purdue University, West Lafayette, Indiana, USA, 2008.
Myhre, G., Shindell, D., Bréon, F.-M., Collins, W., Fuglestvedt, J., Huang, J., Koch, D., Lamarque, J.-F., Lee, D., Mendoza, B., Nakajima, T., Robock, A., Stephens, G., Takemura, T., and Zhang, H.: Anthropogenic and Natural Radiative Forc-ing, in: Climate Change 2013: The Physical Science Basis, Contribution of Working Group I to the Fifth Assessment Report of the Intergovernmental Panel on Climate Change, edited by: Stocker, T. F., Qin, D., Plattner, G.-K., Tignor, M., Allen, S. K., Boschung, J., Nauels, A., Xia, Y., Bex, V., and Midgley, P. M., Cambridge University Press, Cambridge, UK and New York, NY, USA, 2013.
Schmid, T.: Photoacoustic spectroscopy for process analysis, Analyt. Bioanalyt. Chem., 384, 1071–1086, 2006.
Shin-Etsu: Characteristic properties of Silicone Rubber Compounds, available at: https://www.shinetsusilicone-global.com/catalog/pdf/rubber_e.pdf (last access: 9 December 2019), 2016. '
Weber, C., El-Safoury, M., Eberhardt, A., Schmitt, K., and Wöllenstein, J.: Miniaturisierte photoakustische Detektoren für den Nachweis fluorhaltiger Kältemittel, VDI/VDE-Gesellschaft Meß- und Automatisierungstechnik – GMA, Informationstechnische Gesellschaft – ITG, Düsseldorf, 322–327, 2019.
- Abstract
- Introduction
- Basics of the photoacoustic effect
- Working principle of the photoacoustic detector
- Simulating the technical configuration of the photoacoustic detector
- Sensor realization
- Sensor concept evaluation
- Summary
- Outlook
- Data availability
- Author contributions
- Competing interests
- Special issue statement
- Acknowledgements
- Financial support
- Review statement
- References


