the Creative Commons Attribution 4.0 License.
the Creative Commons Attribution 4.0 License.
 | 19 Nov 2021
High-temperature behavior of housed piezoelectric resonators based on CTGS
Michal Schulz
Rezvan Ghanavati
Fabian Kohler
Jürgen Wilde
Holger Fritze
A temperature sensor based on piezoelectric single crystals allowing stable operation in harsh environments such as extreme temperatures and highly reducing or oxidizing atmospheres is presented. The temperature dependence of the mechanical stiffness of thickness shear mode resonators is used to determine temperature changes. The sensor is based on catangasite (Ca3TaGa3Si2O14 – CTGS), a member of a langasite crystal family. CTGS exhibits an ordered crystal structure and low acoustic losses, even at 1000 ∘C.
The resonance frequency and quality factor of unhoused and of housed CTGS resonators are measured up to about 1030 ∘C. A temperature coefficient of the resonance frequency of about 200 Hz K−1 for a 5 MHz device is found and enables determination of temperature changes as small as 0.04 K. Housed CTGS resonators do not show any significant change in the resonance behavior during a 30 d, long-term test at 711 ∘C.
- Article
(3126 KB) - Full-text XML
- Companion paper
- BibTeX
- EndNote


Piezoelectric devices based on high-temperature, stable single crystals are of increasing interest due to a wide range of potential applications, such as actuators or temperature sensors. In the case of the latter, two aspects describing the quality of the sensor need to be considered, namely the absolute accuracy of the measurement and the uncertainty of the measurement, which affects the ability to detect the smallest temperature changes. Conventional temperature sensing devices based, e.g., on thermocouples provide great absolute accuracy; however, their low signal in the range of several millivolts is much more sensitive to electromagnetic noise than, e.g., a measurement of resonance frequency of a piezoelectric sensor. Furthermore, due to the poisoning of the thermocouple wires, only very few types of such sensors can offer sufficient stability in oxidizing and/or reducing atmospheres (Edler, 2007). Gas sensors for solid oxide fuel cells (SOFCs), gas reformers and others (Zhang and Yu, 2011) can use piezoelectric devices as gravimetric detectors to monitor gas–atmosphere-induced mass changes of films deposited on the resonators (Tuller and Fritze, 2002; Sauerwald et. al., 2011). There, the devices are exposed to harsh environments such as extreme temperatures or highly reducing or oxidizing atmospheres. However, many of the piezoelectric materials used in such devices cannot be applied above 400 ∘C due to the decreasing resonance quality factor Q, decomposition or changes in crystal structure. Non-stoichiometric lithium niobate (LiNbO3) decomposes already above 300 ∘C (Bruckner et. al., 2003; Fachberger et. al., 2004). The phase transformation from α to β quartz limits its operation, in principle, to 573 ∘C, whereas the drastically dropping Q factor governs the practical application limit of 520 ∘C.
The crystals from the langasite family with the general formula of A3BC3D2O14 do not suffer from the aforementioned limitations. The majority of the family members exhibit the same trigonal crystal structure as quartz and do not undergo any phase transformations up to their melting point. The already well-known langasite (La3Ga5SiO14 – LGS) has been proven to operate reliably at high temperatures and in harsh environments (Fritze, 2011). However, due to a disordered crystal structure, LGS exhibits considerably high losses at elevated temperatures. Catangasite (Ca3TaGa3Si2O14 – CTGS) gained considerable attention since it exhibits an ordered crystal structure and, thus, shows significantly lower electromechanical losses (Johnson et. al., 2014; Suhak et. al., 2019). Similar to LGS, it does not undergo any phase transformations up to the melting point of about 1370 ∘C (Yu et. al., 2011). The electromechanical coupling coefficient k12, defined as follows:
where e26, c66 and ε11 are the piezoelectric coefficient, stiffness coefficient and dielectric permittivity, respectively, equals 11 % at room temperature and constantly increases up to about 15 % at 1000 ∘C (Zhang et. al., 2009; Zhang and Yu, 2011; Suhak et al., 2018; Suhak et. al., 2019). CTGS single crystals are commercially available from at least two different providers.
This paper focuses on the characterization of temperature sensors based on CTGS resonators operated in the thickness shear mode (TSM). This mode enables the use of robust and high-temperature stable electrodes which are the precondition for the experiments presented in the following. The influence of housing on the acoustic loss of the resonators is analyzed by means of impedance spectroscopy. The CTGS crystals are coated with Pt electrodes and pre-characterized. Subsequently, the resonance frequency and loss (expressed as inverse resonator quality factor Q−1) of unhoused and housed CTGS sensors are measured up to 1030 ∘C and compared. The response time for temperature changes and the long-term stability of the measured properties are determined and discussed.
2.1 Sample preparation
Polished Y-cut CTGS blanks with a diameter of 10 mm and a thickness of about 260 µm were purchased from Shanghai SICCAS High Technology Corporation (Shanghai, China) and from Fomos-Materials (Moscow, Russia). The resonance frequency of the thickness shear mode is about 5 MHz. Keyhole-shaped electrodes with a diameter of 5 mm are deposited using a screen printing technique. Thereby, a standard Pt paste (Ferro; 64120410) is applied through a masked stainless steel mesh. After Pt deposition, the CTGS specimens are tempered in the furnace up to a temperature of 1000 ∘C. The thickness of the electrodes obtained by this technique equals roughly 3 µm. For a comparison of loss, an additional set of resonators is prepared. Here, the electrodes with thickness of 200 nm are deposited by pulsed laser deposition (PLD). Instead of pure platinum, a Pt–Rh alloy is used due to its improved stability with such thin film electrodes at high temperatures (Richter et. al., 2013).
After the deposition of the electrodes, the CTGS resonators are pre-characterized in the temperature range from RT to 1000 and 850 ∘C for screen-printed and PLD electrodes, respectively. Thereby, the resonance frequency and the Q factor are determined. Subsequently, the housed sensors are assembled. Small supporting structures of Al2O3 are machined using computer numerical controlled (CNC) ultrasonic milling. Subsequently, they are glass soldered on an Al2O3 single crystal substrate provided with two Pt connection pads. After thermosonic bonding of the contact wires, the resonator is installed in the support. Finally, the device is sealed until gas tight, using a polycrystalline alumina cup fixed on the Al2O3 base plate. A scheme of resonator support and completely assembled housed CTGS temperature sensor is shown in Figs. 1 and 2, respectively.
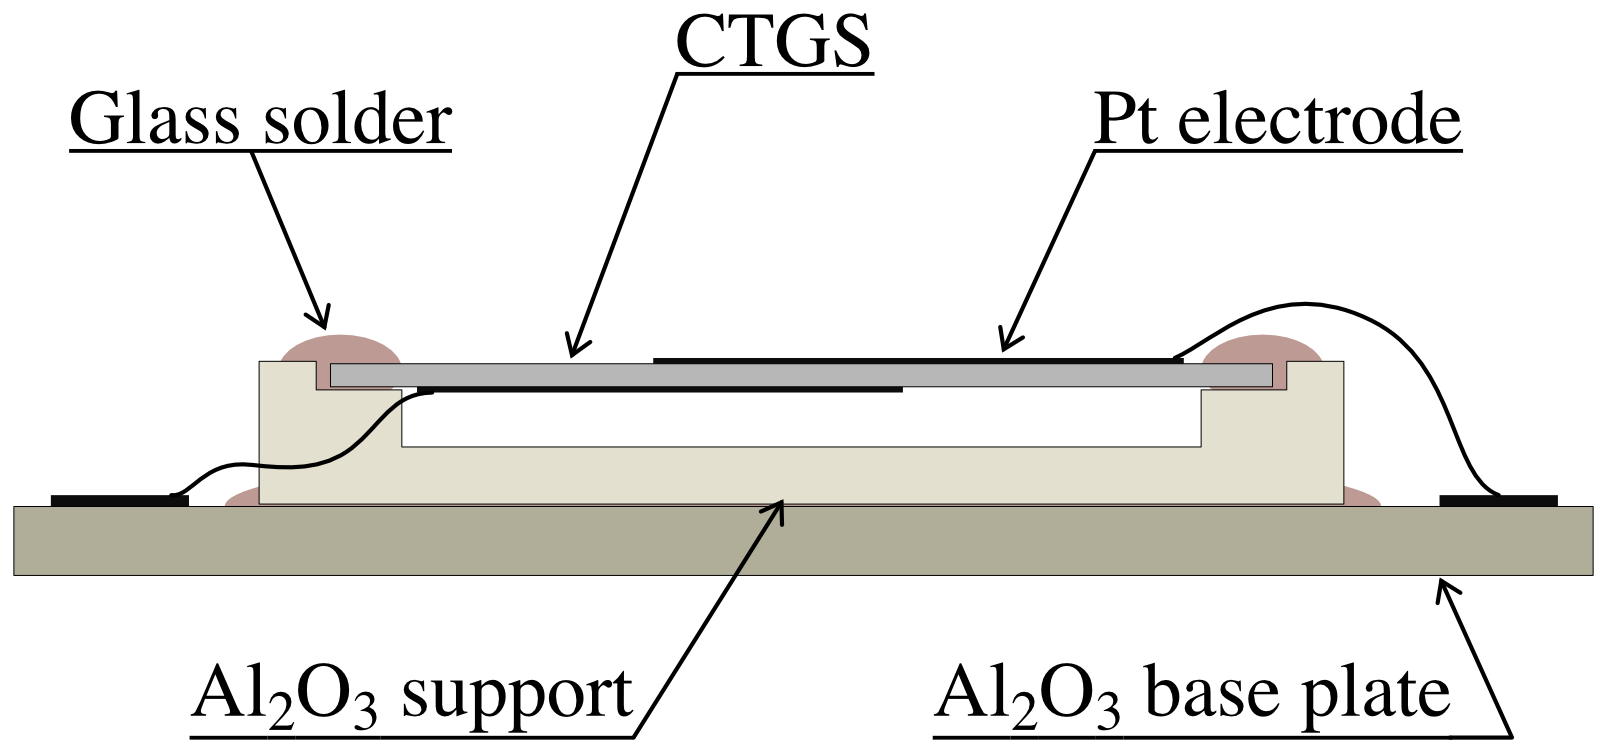
Figure 1Schematic of housed resonator's inner design. The CTGS crystal is mounted in a support made of polycrystalline alumina. The support is installed on a single crystal Al2O3 base plate. The CTGS electrodes are connected with the pads using bond wires. All elements are fixed using a glass solder.
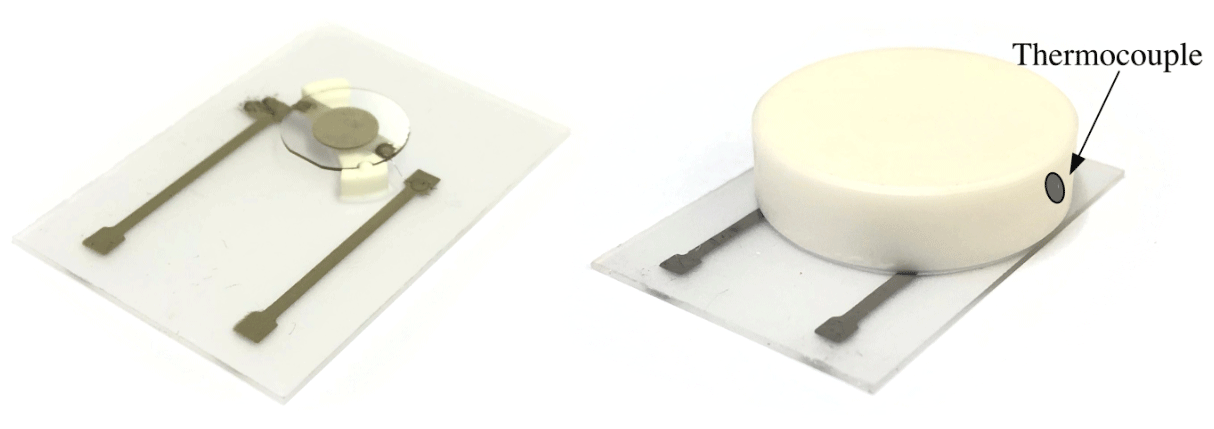
Figure 2CTGS resonator with two connectors screen-printed on a sapphire surface without (left) and with (right) the top cap made from polycrystalline alumina. The gray point is marking the position where an additional thermocouple type S subsequently is attached.
2.2 Impedance analysis
2.2.1 Conductivity of Al2O3
The impedance measurements reveal information about the conductivity of the housing consisting of single and polycrystalline alumina, as well as of a glass solder. Whereas the conductivity of two former components is expected to be negligibly low, the glass solder resistance might be an important factor influencing the behavior of housed sensors. If the glass conductivity is too high, the solder acts as a resistor connected in parallel with the resonator, resulting in electric loss and weaker excitation of CTGS. The conductivity of catangasite has been investigated previously (Suhak et al., 2018). Its conductivity at 800 ∘C yields about 10−4 S m−1, corresponding to a resistance of about 300 kΩ for typical Y-cut 10 mm resonator with 260 µm thickness and keyhole-shaped electrodes of 5 mm in diameter.

Figure 3The geometry of the interdigital electrodes for conductivity measurement (a) and schematic cross section of the specimen with two fingers visible (b). Due to the inhomogeneous electric field, a conversion from the xy space is necessary. Details follow in the text.
For conductivity measurements of Al2O3, separate polished sapphire specimens with interdigital electrodes (shown in Fig. 3a) are prepared. Thereby, the spacing s between the fingers and the width w of the fingers equals 40 µm. The length L of the fingers equals 10 mm. The total number N of fingers equals 124. Prior to this experiment, the furnace is calibrated for stray capacitance and resistance using a blank sapphire plate without electrodes. The measurements are performed in a frequency range from 0.1 Hz to 1 MHz, with 28 points per decade using a Solartron 1260 gain–phase analyzer. Since the expected impedance is very high, an additional dielectric interface (Solartron 1296) is used, enabling impedance measurements up to 1012 Ω.
The resistance R of an alumina specimen depends on its conductivity σ and a geometry factor κ; . The latter denotes the ratio of the sample thickness to the electrode's area for simple geometries. However, in the case of an interdigital structure, such a simple approximation of the geometry factor is not feasible. In this case, one has to convert the finger arrangement in the xy space (see Fig. 3b) to the uv space with two perpendicular electrodes of equal surface attached to the investigated specimen of a given thickness. The resulting geometry factor κ after a conversion from the xy space to the uv space is given by Olthuis et. al. (1995) as follows:
where K(k) is the complete elliptic integral of first order, as follows:
and k is related to real-world dimensions. In a case of a periodic finger structure, it can be approximated as follows:
Using the geometry of the finger structure mentioned above, one calculates the geometry factor of κ=1.63 m−1.
2.2.2 Conductivity of a glass solder
The conductivity of a glass solder is measured using a Keysight E4980A Precision LCR Meter at 500 kHz, 1 MHz and 2 MHz. Thereby, the interdigital electrodes are covered entirely with the glass. In addition to the AC experiments, a DC measurement is performed, where a voltage drop across a glass solder path is measured. Knowing the geometry factor κ of the path, the applied current I and the voltage drop ΔU, the glass conductivity is calculated as follows: .
During the experiment, the specimen is heated to 950 ∘C at a rate of 0.3 K min−1. The conductivity of the Al2O3 substrate and of the glass solder is calculated from the fit, using in-house developed software, of the electric equivalent circuit describing the interdigital structure. The circuit consists of a resistor connected in parallel with a constant-phase element. The former corresponds to the bulk conductivity of the analyzed material, and the latter reflects the dielectric permittivity. Furthermore, an additional small value resistor attributed to the resistance of the wires is connected in series with the aforementioned circuit.
2.2.3 Resonant piezoelectric spectroscopy
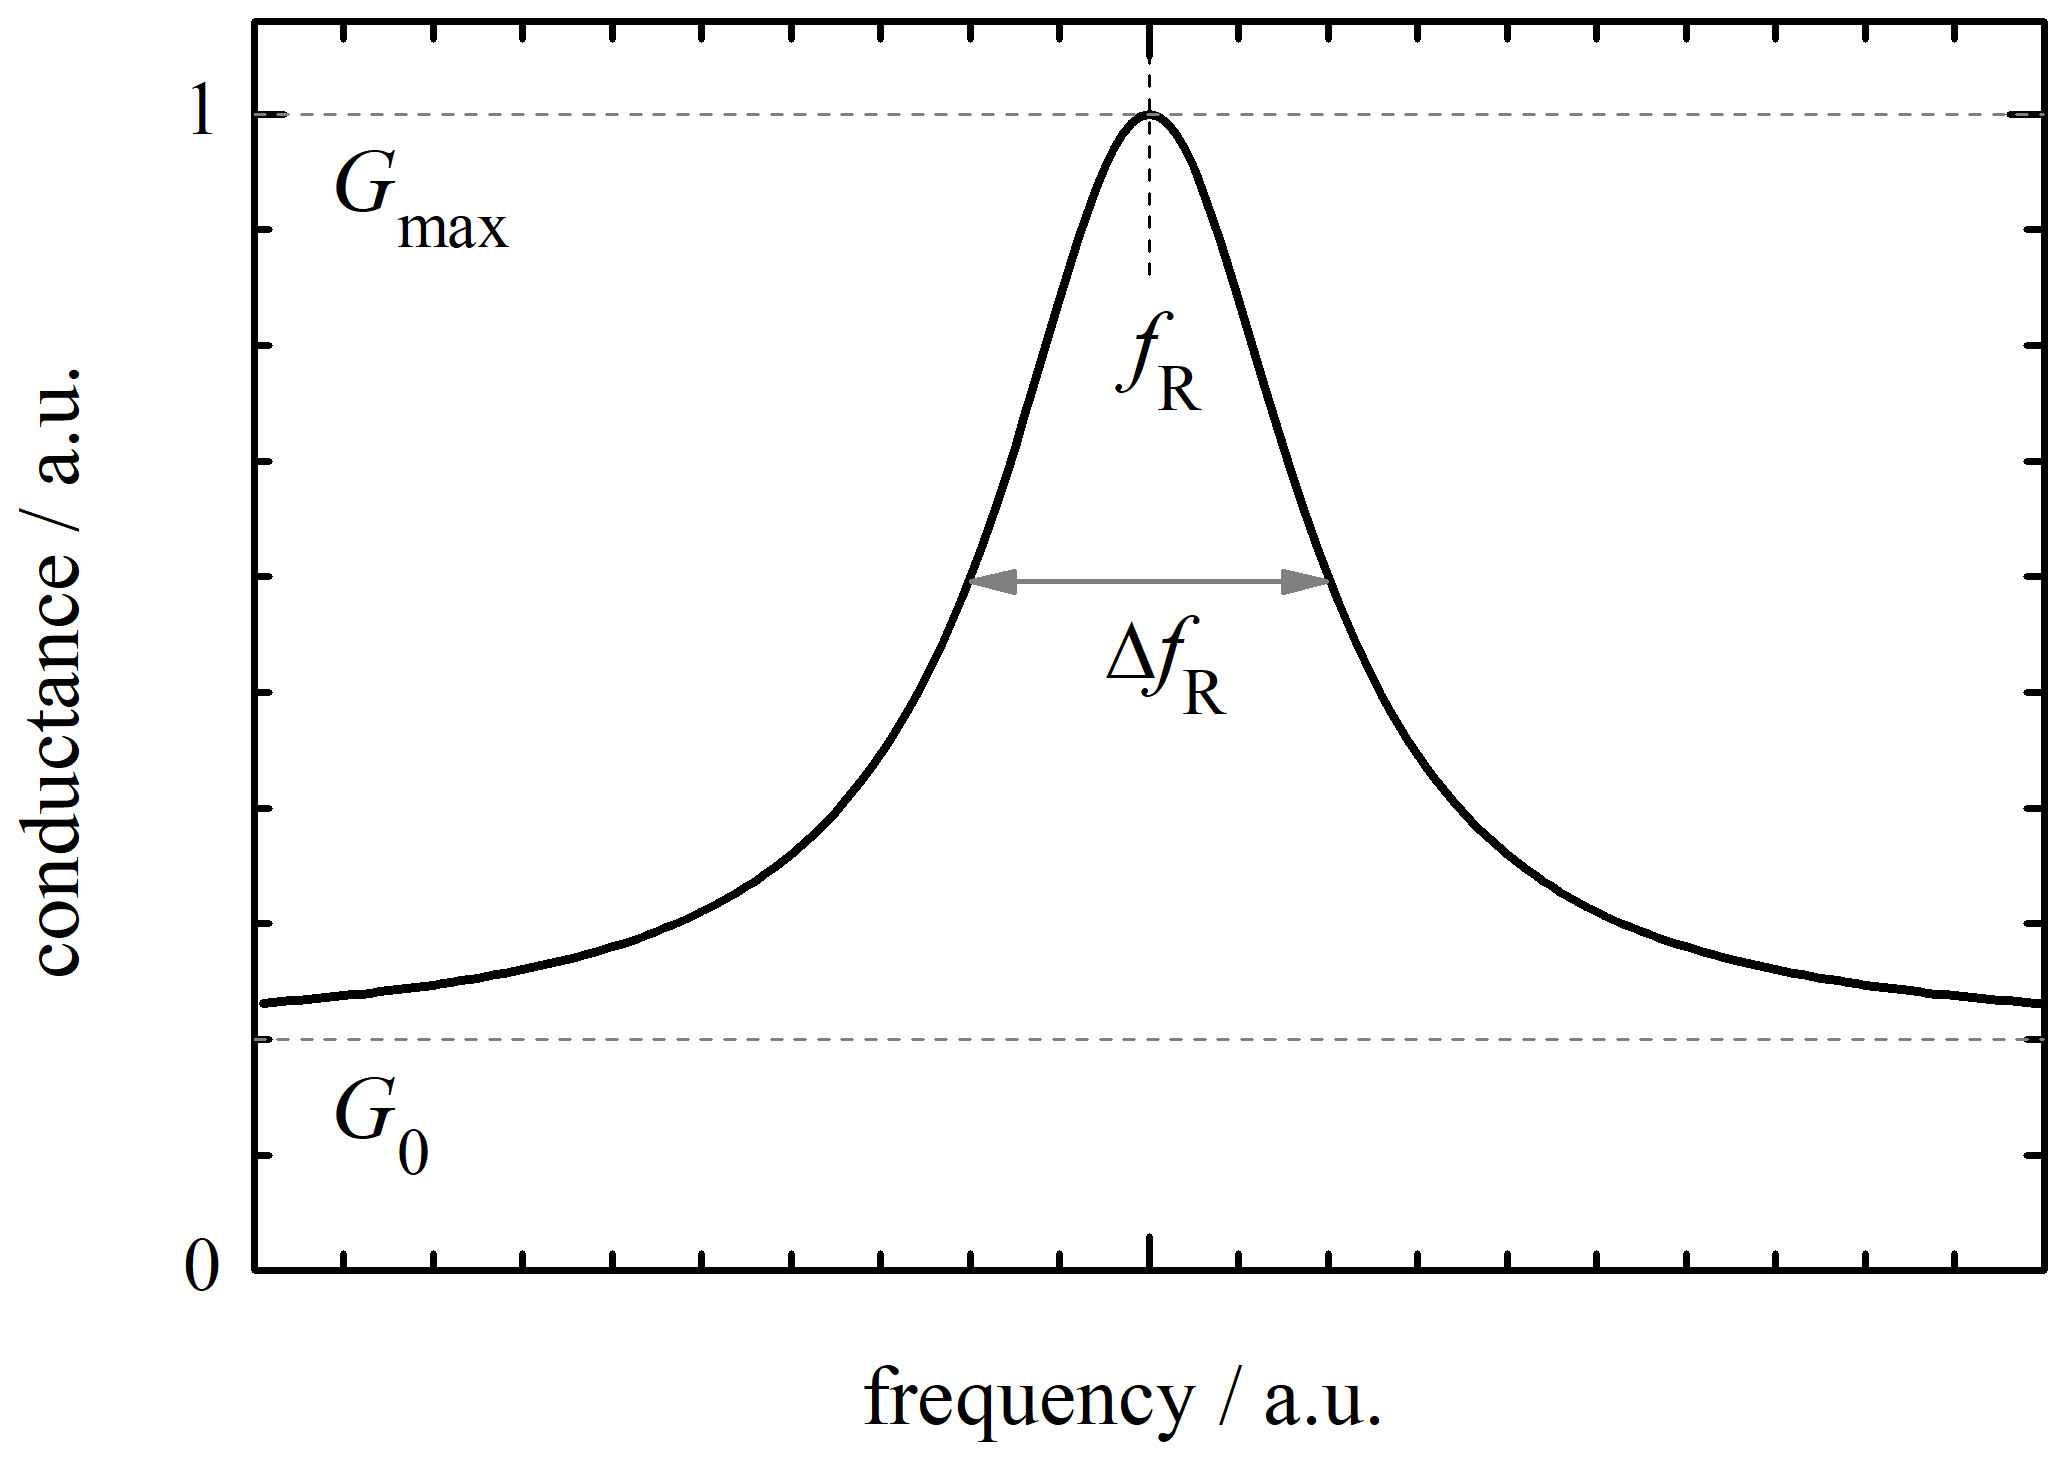
The temperature-dependent resonance frequency fR and the figure of merit, denoted by the Q factor, of CTGS are obtained by means of resonant piezoelectric spectroscopy (RPS). Here, the impedance spectra are acquired in the vicinity of fR, using a high-speed network analyzer (Agilent E5100A) and subsequently fitted to one of the models describing the piezoelectric device. In a simplified approach, fR and Q are obtained from a fit of a Lorentz function (see Fig. 4) to the conductance in the vicinity of the resonance frequency as follows (Fritze, 2011):
where Gmax and ΔfR are the maximum of conductance and full width at half maximum (FWHM) of G, respectively. The FWHM can be determined properly only if the bulk conductance, G0, caused by the bulk conductivity of the material is negligible. If this is not the case, as shown in Fig. 4, the equation needs to be adjusted accordingly, and the FWHM is calculated from the G0 baseline to Gmax as follows (Fritze, 2011):
Here, the value of G0 is taken from previously performed conductivity measurements of the piezoelectric material.
The figure of merit of a resonator is denoted by the Q factor. It is defined as a quotient of the resonance frequency and the FWHM of conductance squared, i.e., . Using an approximation between the FWHM of G and G2, , one obtains the following (Fritze, 2011):
The dependence of the resonance frequency on the temperature allows one to design a temperature sensor based on a piezoelectric device. In the case of a thickness shear mode of vibration, the resonance frequency of a Y-cut CTGS is given by the following (Sauerbrey, 1959; Mason, 1964):
where x, ρ and c66 are the thickness, density and stiffness coefficient of the resonator. All these parameters depend on the temperature, whereas the changes in the thickness and density, caused by thermal expansion of the material, are small with respect to the temperature dependency of c66. Therefore, it can be approximated that the shift in the resonance frequency is related to changes in the stiffness coefficient only. It must be noted that this technique allows a precise determination of temperature changes; absolute T measurement requires calibration of the resonator using several fixed point references.
During experiments, housed CTGS sensors are annealed in air in a temperature range from RT to 1030 ∘C, with ramps of 0.3 to 1 K min−1. Thereby, impedance spectra in the vicinity of the resonance frequency are measured, and subsequently, the fR and Q are calculated. For reference, both values are compared with unhoused CTGS resonators.
For an investigation of the long-term stability, housed sensors are annealed at about 710 ∘C for 30 d. There, the fR and the temperature calculated from Eq. (8) are compared against the temperature of the furnace and the temperature determined by a type S thermocouple glued directly to the housed CTGS. The position of thermocouple is shown in Fig. 2b.
Finally, the response time of the housed CTGS resonators is compared against the aforementioned type S thermocouple. Thereby, the temperature in the furnace is changed periodically by about ±50 K around 735 ∘C at five different ramps, i.e., 0.5, 1, 2, 3 and 4 K min−1. In order to improve the calculation in this temperature sweep of ΔT=100 K, the frequency to temperature conversion is done by applying a polynomial whose coefficients are determined by fitting to the initially characterized fR(T) curve of housed CTGS devices. Thereby, the degree of the polynomial depends on the required temperature range and on the linearity of the temperature dependence of the resonance frequency. For small temperature ranges, a low polynomial degree of 1 to 3 is sufficient to ensure that the deviations between fit and measurement are smaller than 0.1 K.
3.1 Unhoused resonators
The unhoused CTGS resonators with PLD and screen-printed electrodes are characterized up to 850 and 1030 ∘C, respectively. The absolute values of fR show small deviations of ca. 2 %–3 %, which are related to the variation in the crystal thickness during the manufacturing process. The relative change in the resonance frequency with respect to a reference temperature of 100 ∘C shows almost the same behavior for different specimens. There is no hysteresis in the data, neither during the heating up and cooling down phases nor during subsequent measurements. The exemplary data for one CTGS specimen are shown in Fig. 5. Below 800 ∘C no significant impact of the housing on absolute resonance frequency is visible; above that temperature, a slight difference between housed and unhoused specimens becomes visible.
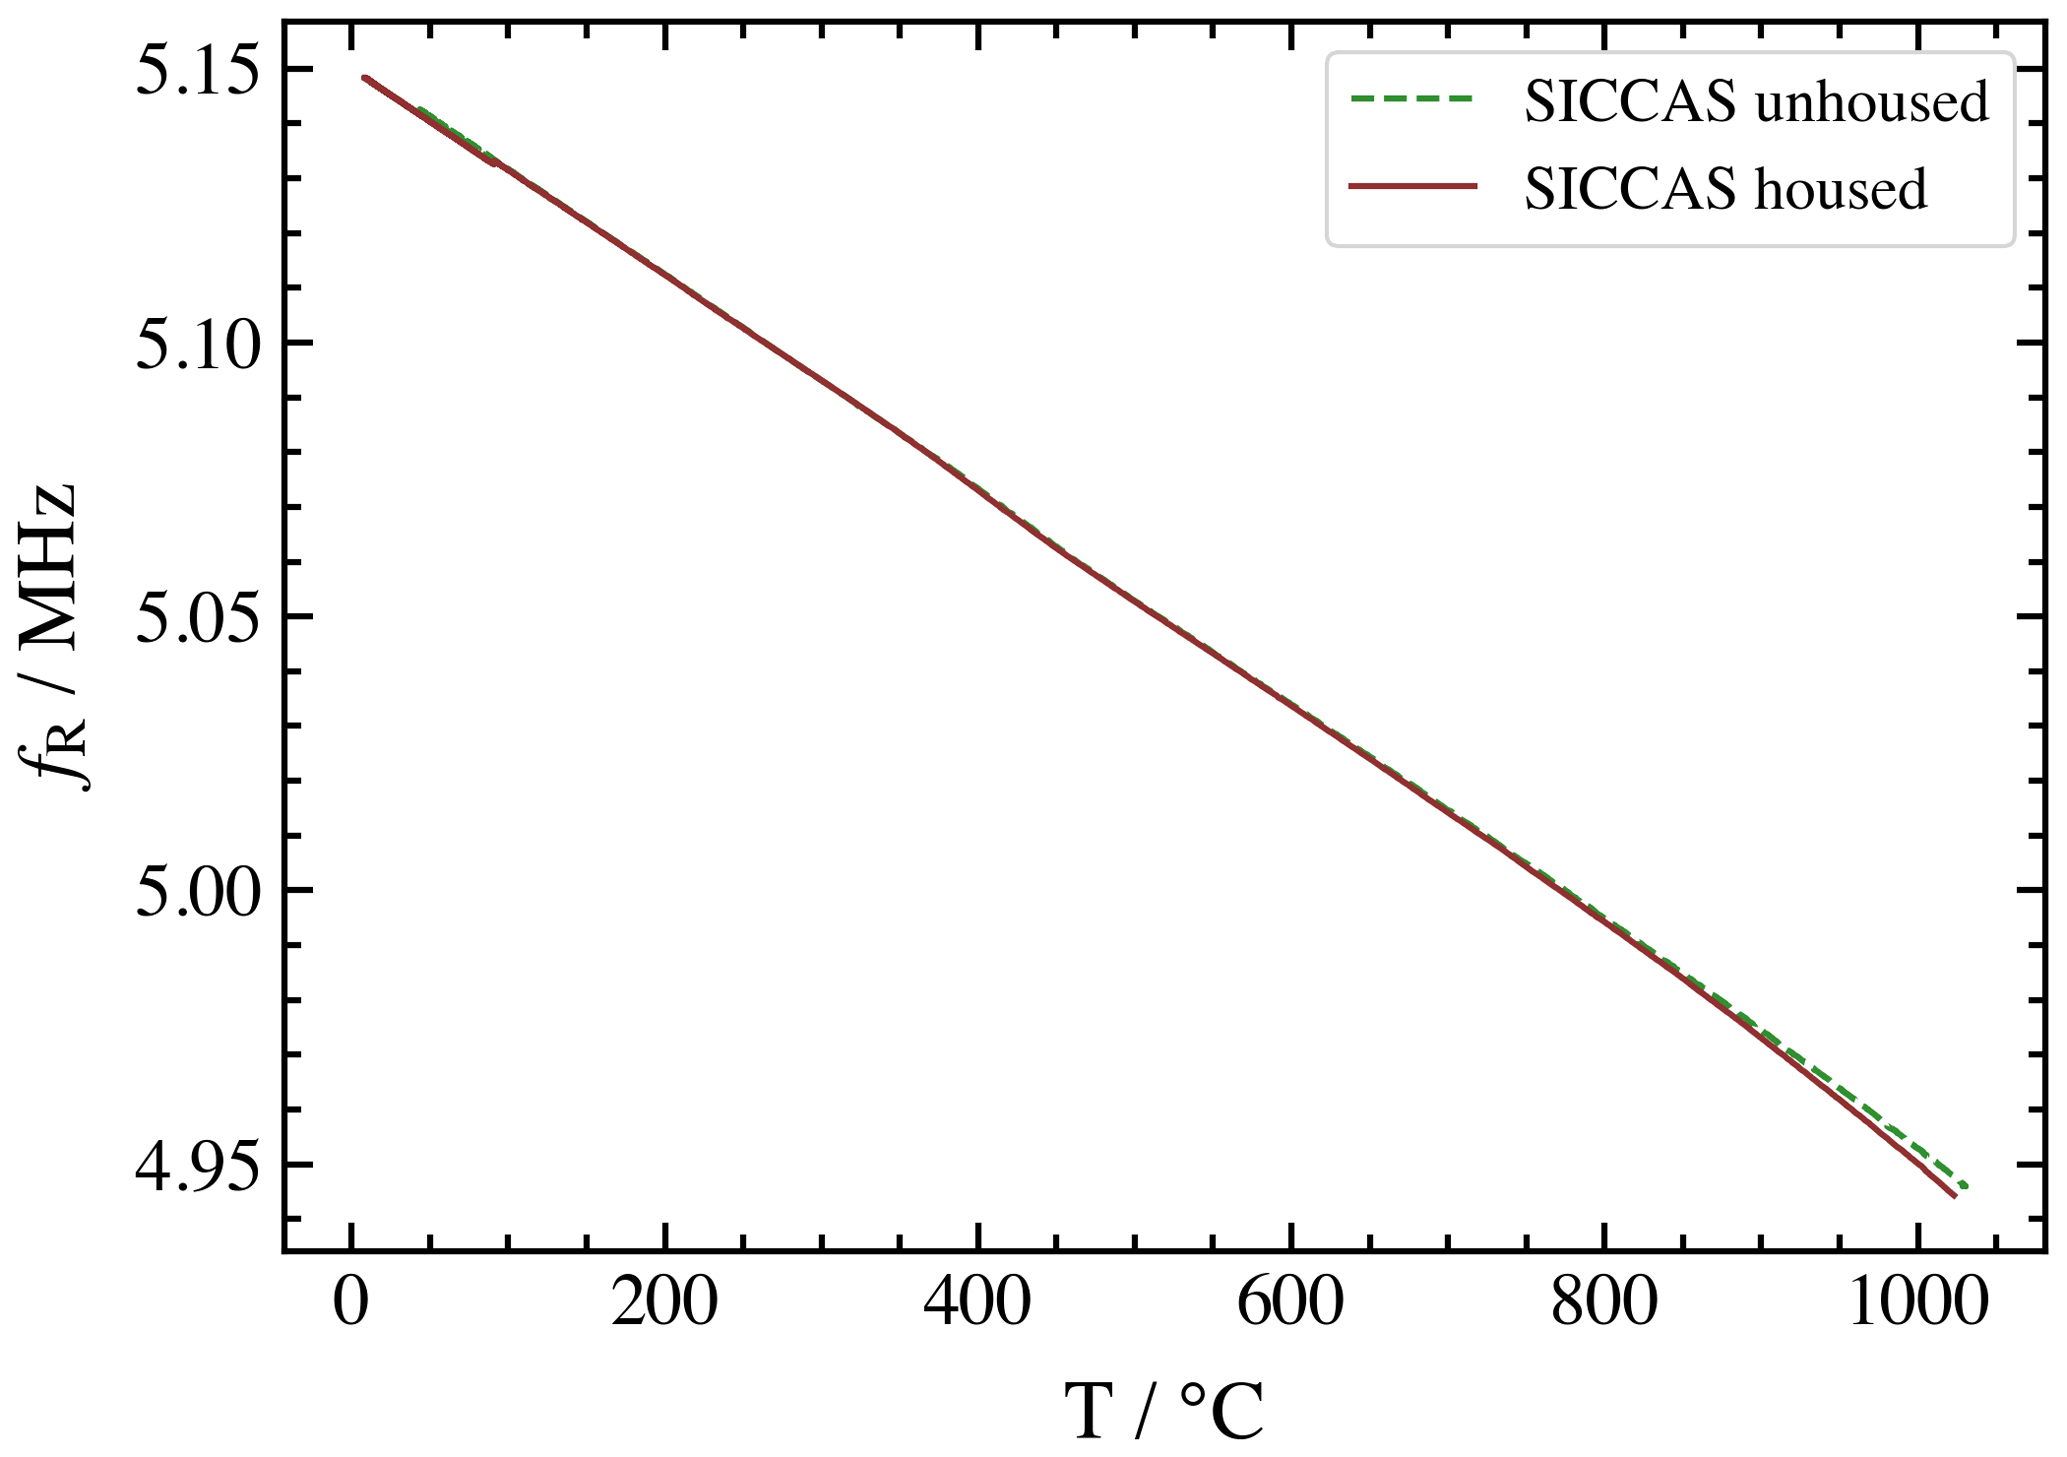
Figure 5Temperature-dependent resonance frequency of an unhoused CTGS resonator (green dashed line) and of the same CTGS specimen after integrating it in the housing (red solid line). Up to about 800 ∘C, no significant impact of housing is visible.
The modulus of the impedance shown in Fig. 6 shows a slight flattening at both series and parallel resonance frequencies at 1030 ∘C. In the case of the former, it is related to an increased loss at an elevated temperature. For the latter, the flattening is attributed to an increased loss and an increased bulk conductivity of CTGS. For comparison, the modulus of the impedance for resonators based on langasite spans only within less than 1 order of magnitude at 800 ∘C already, making a precise determination of the resonance frequency hardly possible. Since the impedance of sapphire is still in the 106 Ω range at 1000 ∘C, i.e., it exceeds the bulk impedance of the resonator by several orders of magnitude, its influence on the resonant properties of CTGS is negligible. The high temperature loss in CTGS is described by Suhak et al. (2018) and Suhak et. al. (2019). The distance between the series and the parallel resonance frequency increases. This is caused by an increase in the dielectric coefficient ε11, which, in turn, affects the bulk capacity of the resonator. The latter has an impact on the parallel resonance frequency, whereas the series resonance frequency is determined by the parameters of resonators motional arm only. At 1030 ∘C, the phase angle of the impedance (see Fig. 7) shows a less pronounced switch from −90 to +90 ∘C at the series resonance frequency.
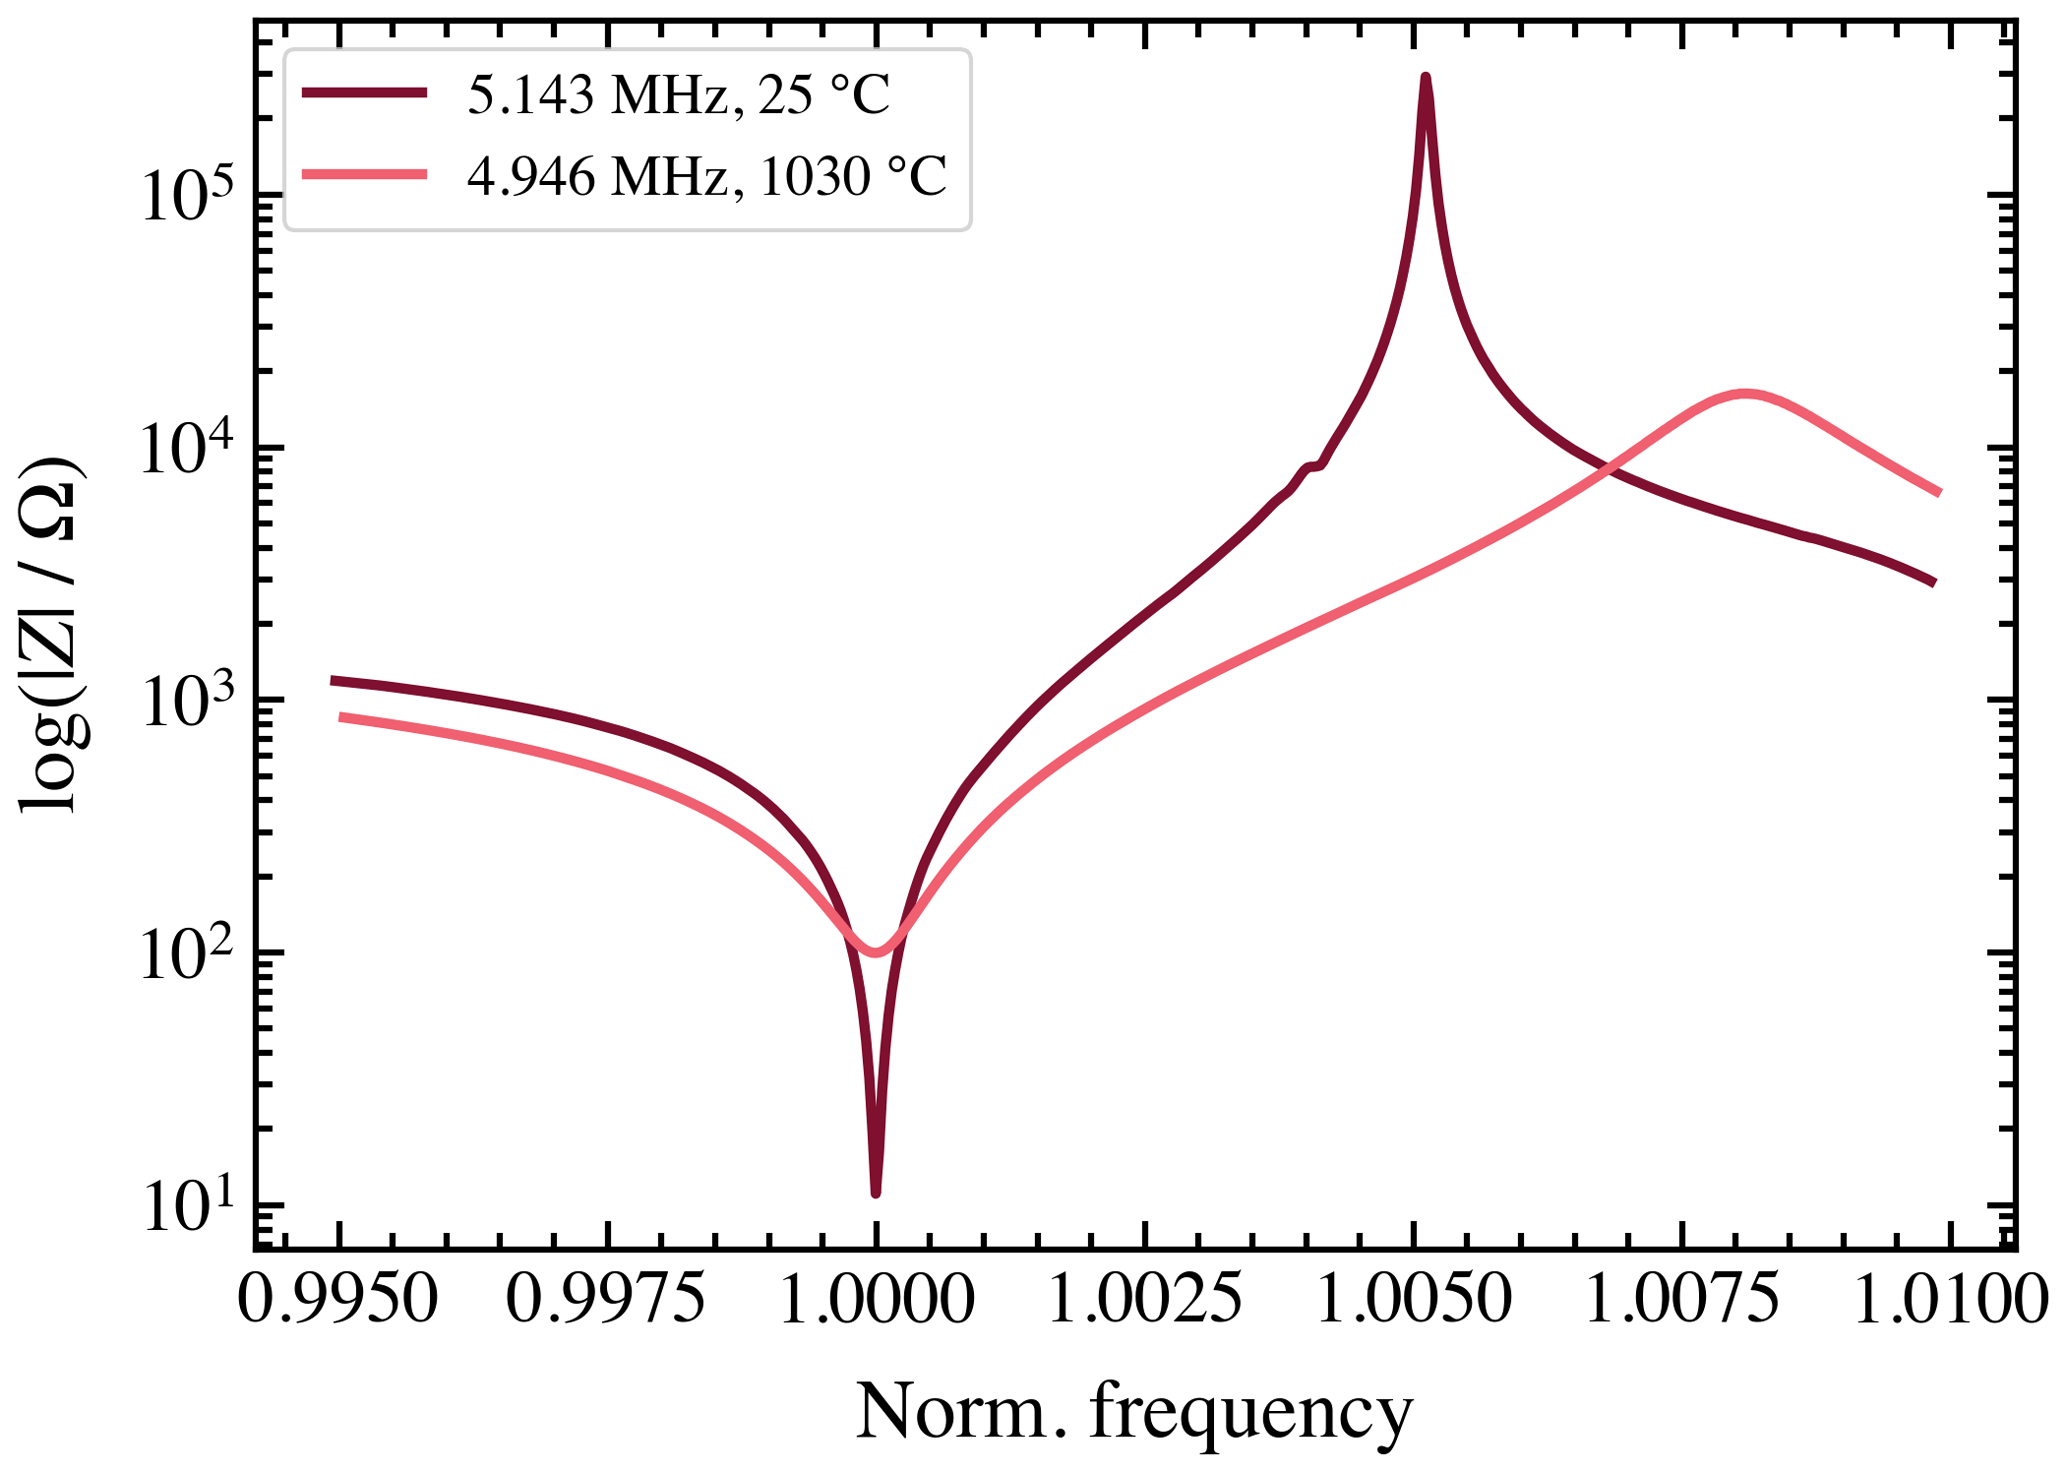
Figure 6Modulus of CTGS impedance measured at room temperature and at 1030 ∘C. The frequency is normalized to the resonance frequency (see the legend) at a given temperature.
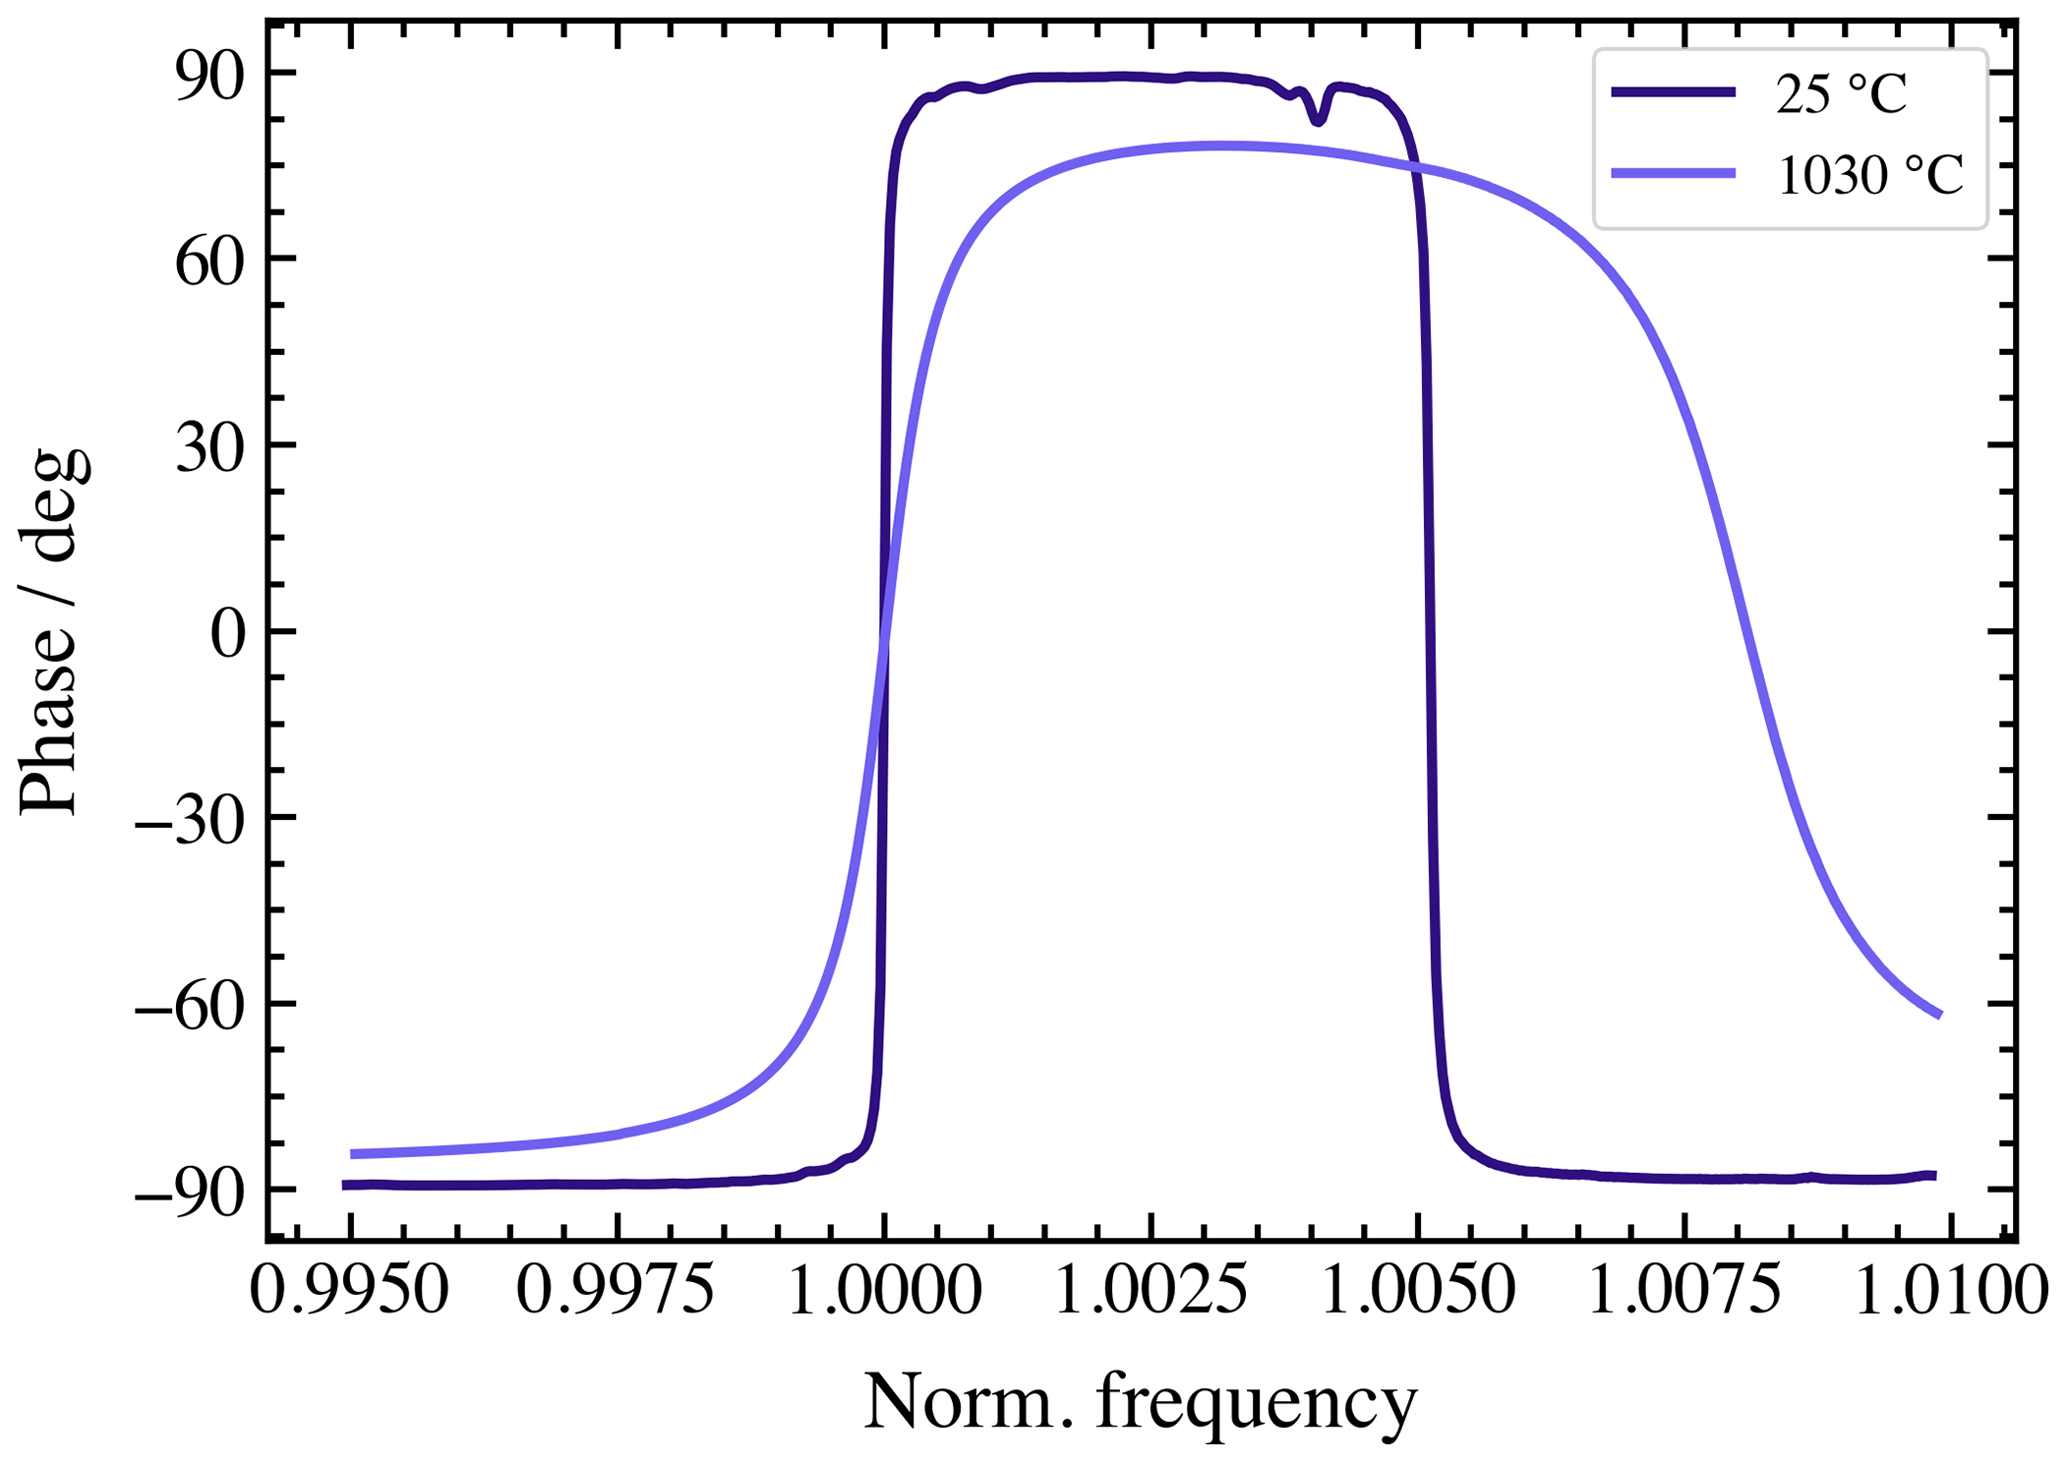
Figure 7Phase shift of the impedance in the vicinity of the resonance frequency. The shift from −90 to +90∘ corresponds to the series resonance; the shift from +90 to −90∘ occurs at parallel resonance.
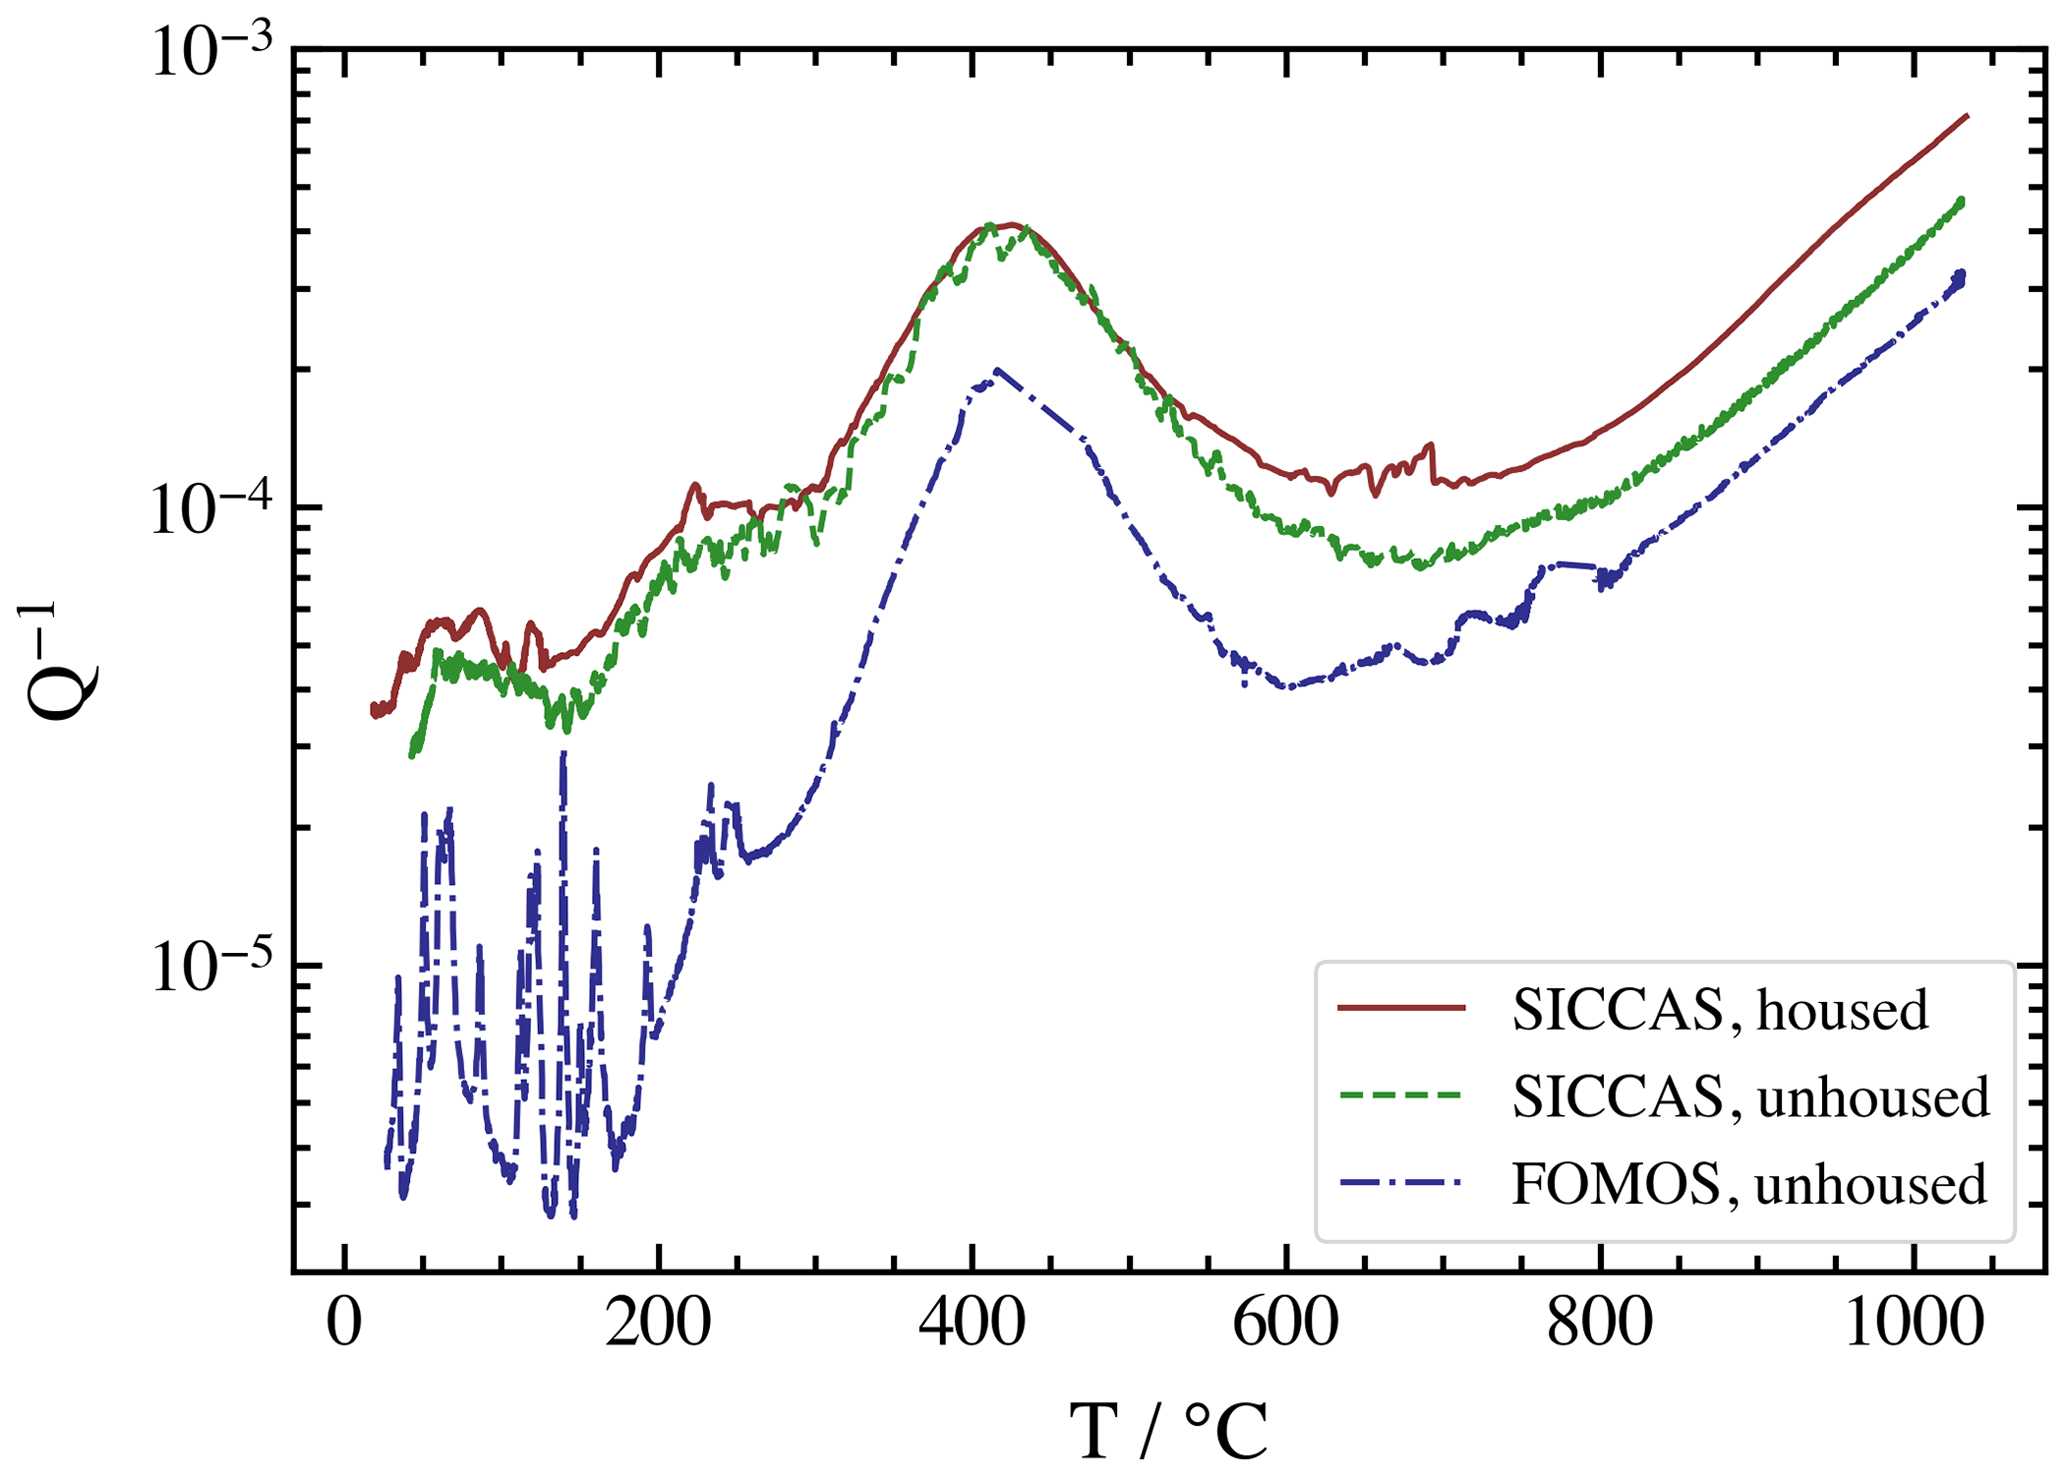
The value of Q−1 shows very similar behavior for all CTGS specimens purchased at SICCAS (see Fig. 8). In contrast, the crystals manufactured at Fomos show significantly lower loss within the entire temperature range; however, the difference is less pronounced at higher T. At the highest measured temperatures, lower loss correlates with bulk conductivity that is lower by about 1 order of magnitude in the case of Fomos CTGS. This difference is most likely related to the crystal growth process; at Fomos, the crystals are grown from Pt/Rh crucibles, which results in a slight color tint. Here, Rh impurities may have lead to a compensation of unintended defects. Furthermore, the inverse Q factor shows a maximum at about 400 ∘C; it can be attributed to anelastic relaxations of point defects (Suhak et al., 2018; Suhak et. al., 2019). Above 650 ∘C, the losses are governed by piezoelectric/conductivity relaxation (Suhak et. al., 2019). The origins of the losses are not the focus of this publication and, therefore, not discussed in detail.
3.2 Housed resonators
3.2.1 Impedance data
The impedance data of Al2O3 single crystals (see Fig. 9) are acquired in a temperature range from about 350 to 980 ∘C. Thereby, the temperature is changed in 100 K steps at a rate of 3 K min−1. Once a stable temperature is reached, the measurement is started, and the temperature is held constant for at least 5 h. The impedance spectra are subsequently fitted to an equivalent electrical circuit presented in Sect. 2.2 consisting of a resistor connected in parallel with a constant phase element. The conductivity data resulting from the fit is shown in Fig. 10. The comparison with the literature shows good agreement of the data (Özkan and Moulson, 1970; Will et. al., 1992).

Figure 9Bode plot of sapphire impedance (points) measured at 820 ∘C and a fit of equivalent circuit (line) of the data.
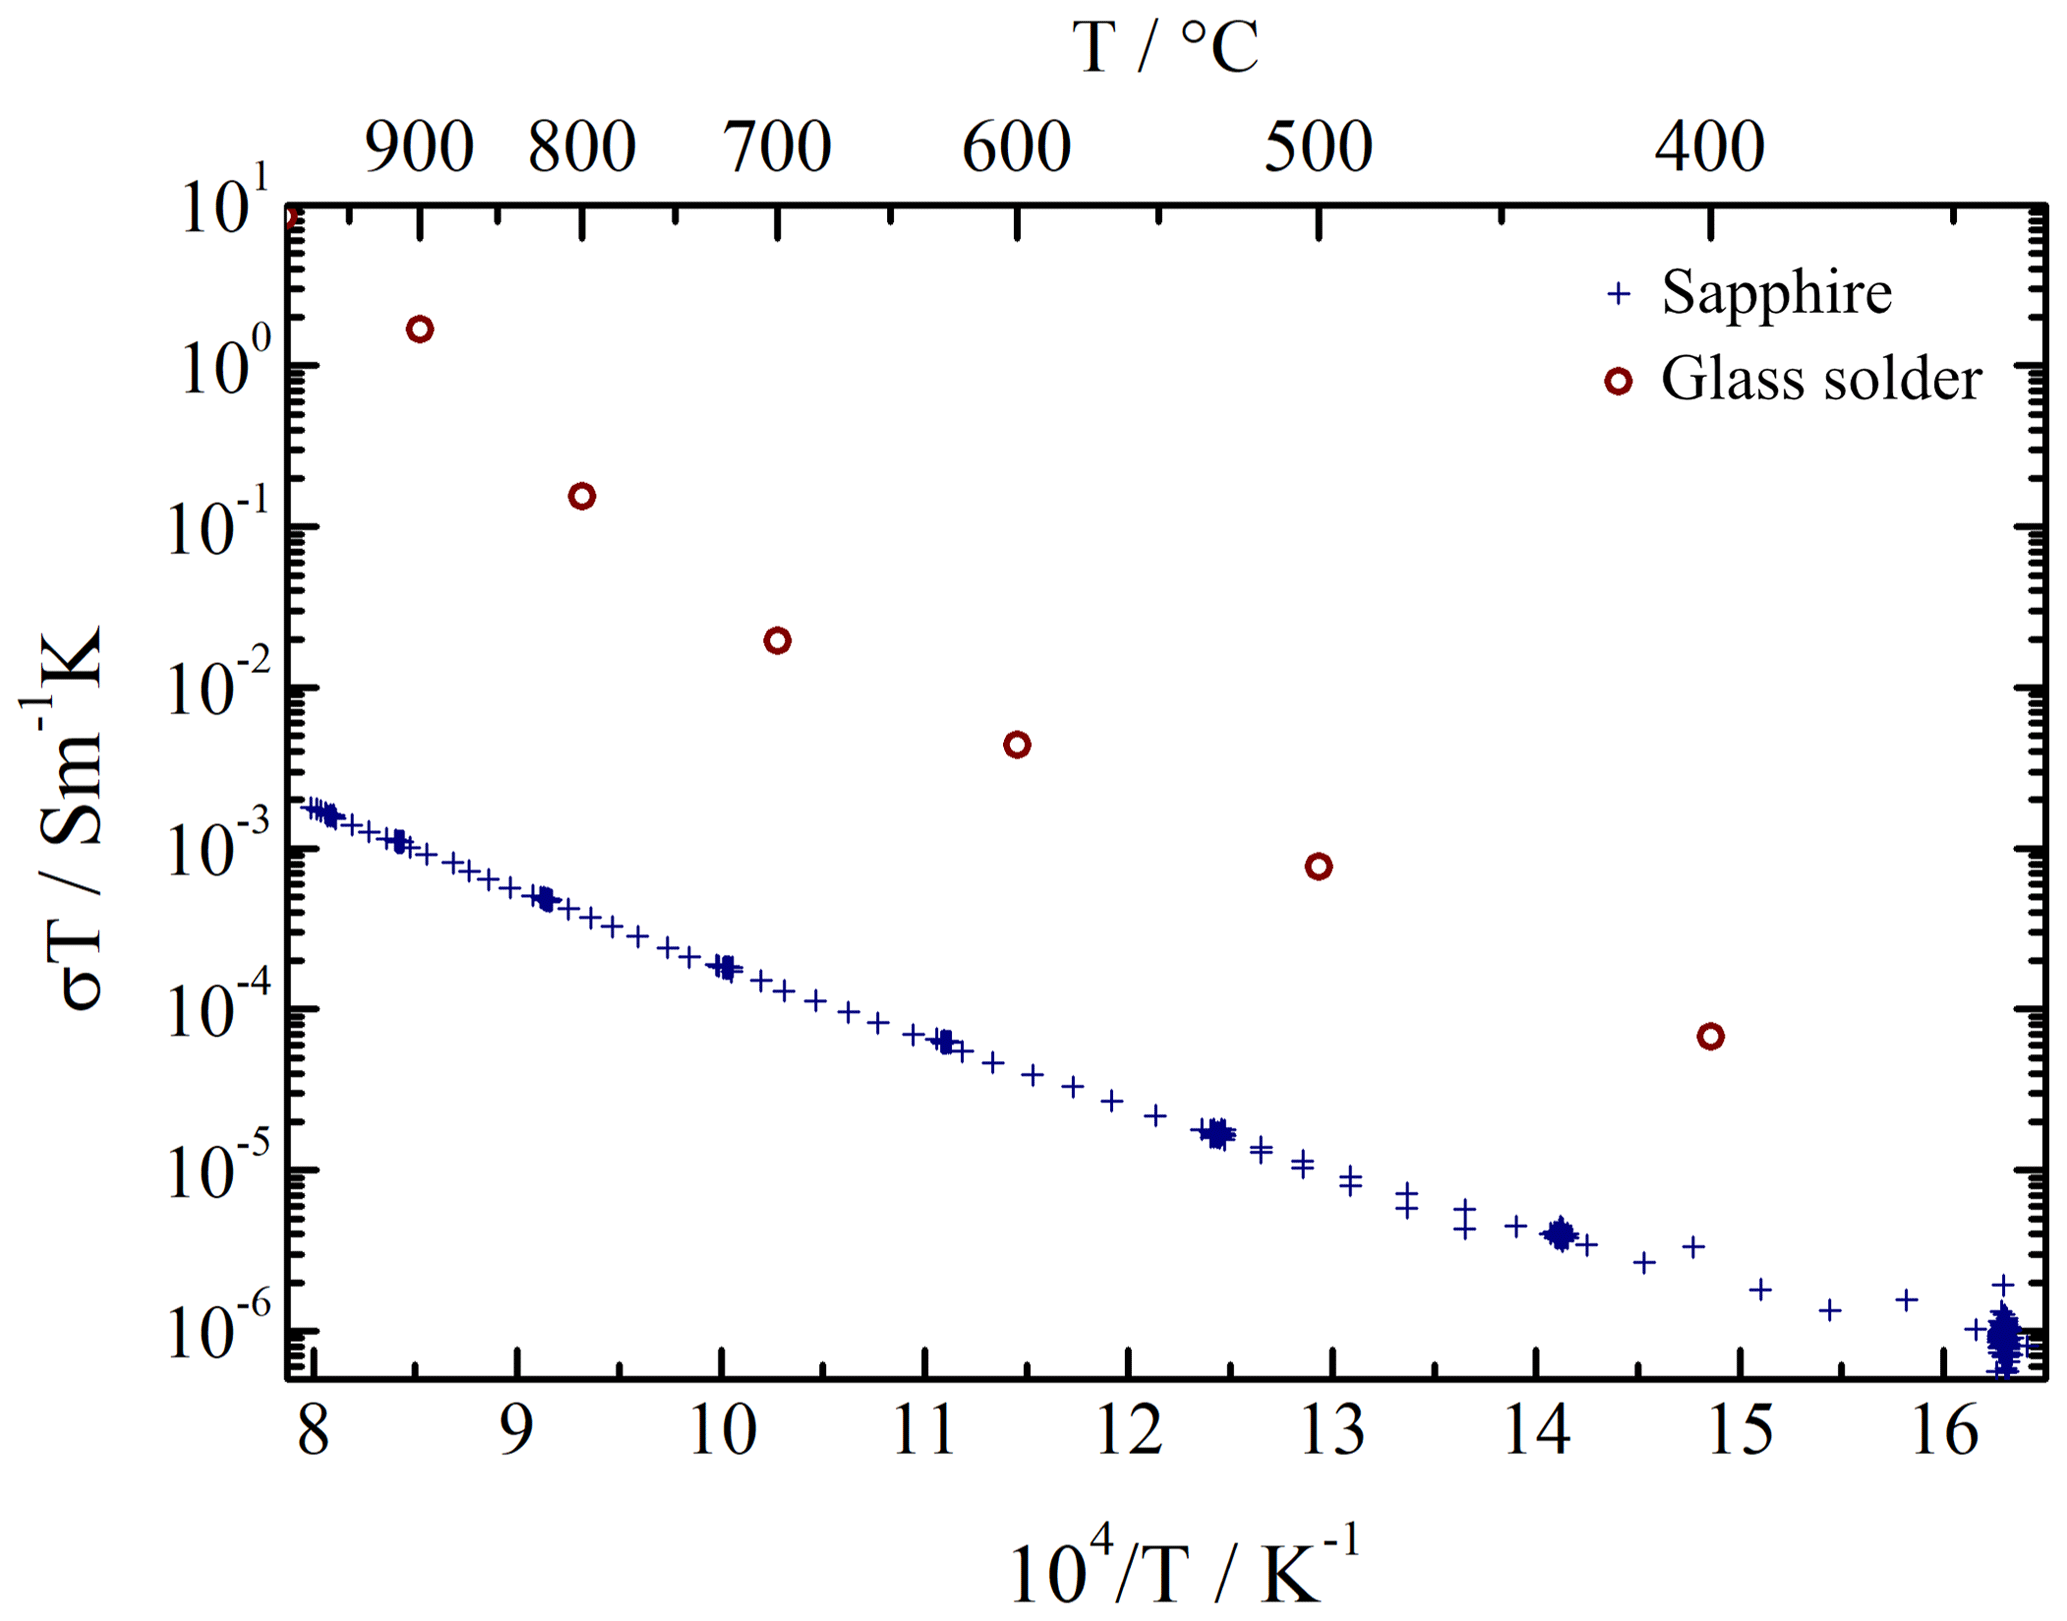
Figure 10The conductivity of an Al2O3 single crystal measured using the dielectric interface in conjunction with an impedance analyzer (crosses) and of the glass solder (circles).
In order to estimate influence of the Al2O3 on the electric characteristic of the housed CTGS resonator, a geometry factor has to be taken into account. In case of device presented in this work, the expected resistivity of an Al2O3 plate, which short-circuits the resonator, is in the range of 1.7 GΩ at a temperature of 900 ∘C. Under the same conditions, the bulk resistance of CTGS resonator is as low as 80 kΩ. Since the resistance of alumina is higher than that of CTGS by nearly 5 orders of magnitude, it can be assumed that Al2O3 has a negligible impact on the performance of the housed resonator.
The glass solder exhibits conductivity, which is higher by 4 orders of magnitude at 1000 ∘C and 2 orders of magnitude at 400 ∘C than that of alumina (see Fig. 10). Since the glass solder is used to bond the base plate and the cup together, it short-circuits the platinum electrodes. Considering a distance between both electrodes of 10 mm, a cup wall width of 2 mm and a thickness of a glass solder of about 20 µm, the geometry factor necessary to calculate the glass resistance can be estimated. It turns out that the solder short-circuits the platinum electrodes with an effective resistance of about 140 MΩ at 900 ∘C. This value is still about 3 orders of magnitude higher than the CTGS bulk resistance at the same temperature, and its impact on the performance of CTGS is, like in the case of Al2O3, negligible.
3.2.2 Resonance data
Resonance frequency stability and measurement uncertainty
The resonance frequency of housed CTGS devices is recorded up to a temperature of 1030 ∘C. The results are shown in Fig. 5, and the resonant quality factor in comparison with unhoused resonators is shown in Fig. 8. A slightly larger magnitude of the temperature coefficient than in case of unhoused specimens is observed above 800–900 ∘C. This change is reproducible, as several repetitions of the measurement show. A possible reason is an increased loss at elevated temperatures in the case of housed CTGS (see Fig. 8) caused by mechanical stress due to the glass bonding. Up to a temperature of 550 ∘C the Q factors of unhoused and housed CTGS resonators are virtually identical. Above 600 ∘C, the Q factor of housed device decreases compared to unhoused CTGS by a factor of about 1.5. Nevertheless, the loss is still much lower than, e.g., in langasite. The applicability of oscillator circuits instead of impedance analyzers for frequency determination up to about 1000 ∘C is expected.
The first derivate of resonance frequency with respect to temperature is shown in Fig. 11; from these data, one can conclude that a linear approximation of fR(T) dependency is appropriate only for short temperature ranges of about 50 K. A linear approximation over the entire temperature range would introduce an error of up to 200–300 Hz, heavily limiting the applicability of CTGS as a temperature sensor. Therefore, in order to cover the entire temperature range visible in Fig. 5, a polynomial of a higher degree is necessary. Such a wide range of polynomials is used to convert between T and fR in either direction.

Figure 11Temperature coefficient, i.e., the first derivate of the resonance frequency with respect to temperature, of CTGS.
The estimation of measurement uncertainty could not be performed at a steady temperature, since such a setup would require a system with stability in the range of millikelvin. Instead, the precision of resonance frequency determination is estimated using temperature ramps. In such a configuration, the thermal mass of the furnace governs the smoothing of the temperature increase or decrease. Thereby, the temperature in the vicinity of housed CTGS is monitored using a type S thermocouple. Since the observed range does not exceed ±10 K, the CTGS temperature TRPS is calculated from the resonance frequency, using a linear approximation of fR(T). The difference between measured fR, TRPS and current furnace temperature and expected resonance frequency is shown in Fig. 12. With this approach, an uncertainty of fR of up to about ±4 Hz is obtained. The related standard deviation of frequency data for the measurements varies from 1.0 to 1.3 Hz. Taking an exemplary temperature coefficient of 200 Hz K−1, housed CTGS resonators enable the measurement of temperature changes with a resolution of about 0.04 K, which is comparable to or better than that of conventional thermocouples. Using Welch's method, an estimate of power spectral density is calculated (Welch, 1967). Here, the measurement uncertainty of the CTGS resonator is determined to be in the range from 10 mK to 30 mK, depending on the temperature of interest.
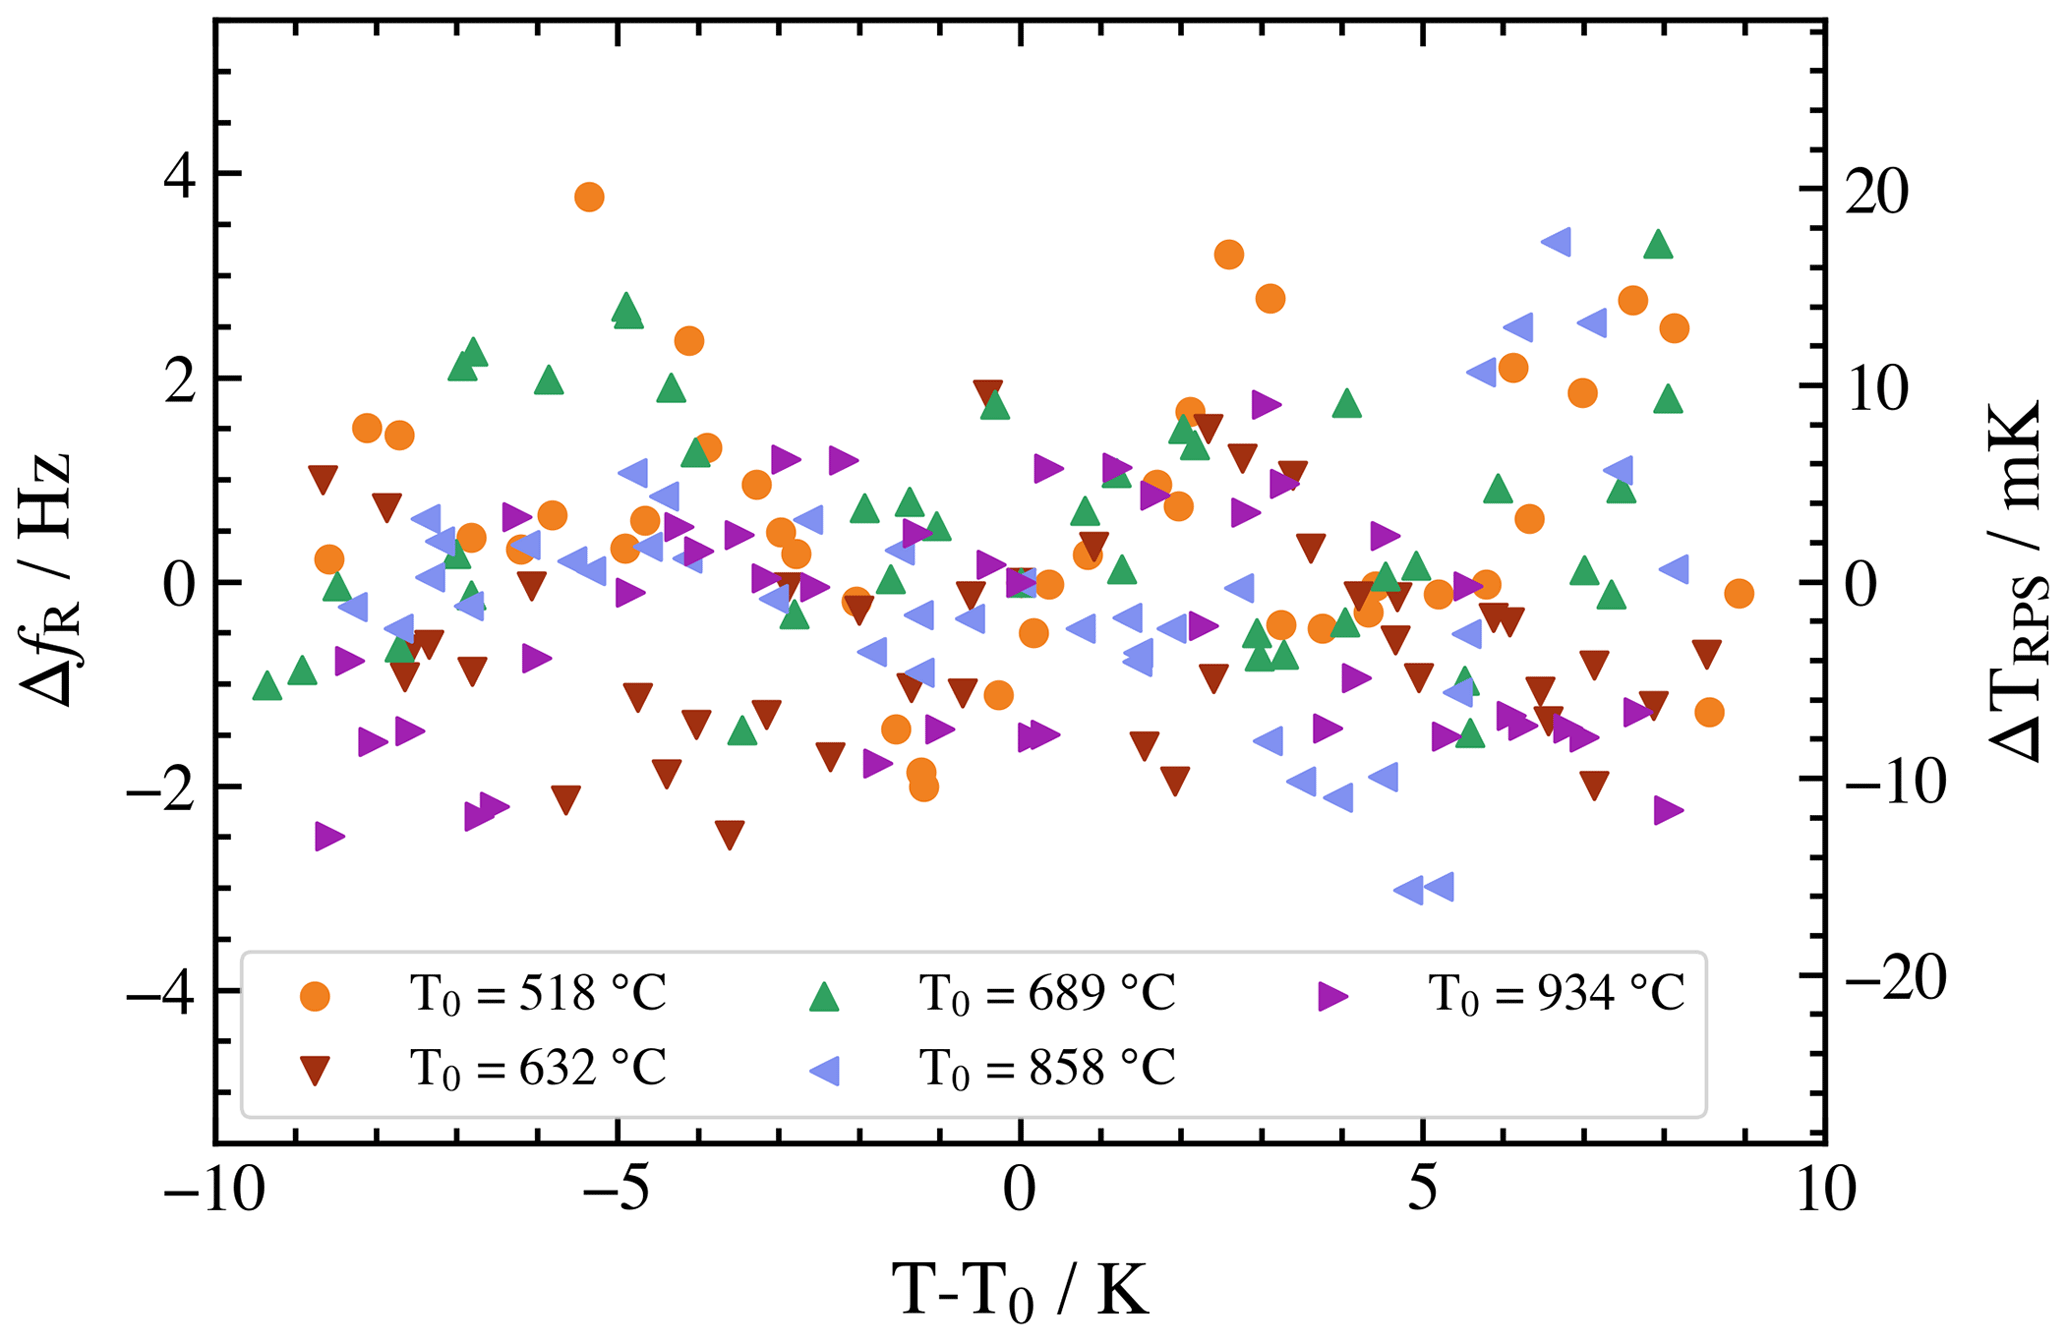
Figure 12Deviation in the temperature-compensated resonance frequency during the heating of CTGS as recorded at five different temperature ranges. The right scale shows a change in the temperature during the measurement for temperature of 518 ∘C. Measurements at other temperatures closely follow the behavior shown here.
Response time
For the measurement of the response time, a temperature range of 100 K around 740 ∘C is chosen. As mentioned above, the linear approximation of the temperature dependence of fR cannot be applied in that case. Therefore, the temperature of CTGS is obtained from the resonance frequency using a degree 9 polynomial. The calculated temperature of the resonator, TRPS, is subsequently compared against the temperature of a type S thermocouple, TTC, attached to the cup of the housing (see Fig. 2).
The results of this experiment are shown in Fig. 13. At a temperature ramp below 1 K/min, both temperature readings change synchronously, i.e., the response delay between them is negligibly low, and the TRPS(TTC) curve in Fig. 13 is visible as a single line. At higher temperature ramps, the response delay between CTGS and thermocouple increases to values which can be easily detected. At a ramp of 4 K min−1, the TTC lags up to 10 K behind TRPS. This unexpected lag can be explained by the amount of thermal mass attached to the thermocouple and by the optical properties of the used materials. The latter allows us to explain why the inner elements of the housing heated up faster by infrared radiation than the outer parts.

Figure 13Comparison of the temperature reported by a type S thermocouple attached to housed CTGS resonator and the temperature calculated from the resonance frequency.
The single crystalline polished alumina plate exhibits a transparency window with a transmission of 85 % for wavelengths from about 220 nm to 5.5 µm (Crystran, 2019). For the temperature T, at which the experiment was conducted, a black body radiation B as a function of wavelength λ is calculated as follows (Planck and Masius, 1914):
where h, c and kB are the Planck constant, speed of light and Boltzmann constant, respectively. Considering the transmittance window of a single crystalline alumina, it turns out that over 58 % of the spectral irradiance at aforementioned temperature can be passed through. This, in turn, can lead to faster heating up of CTGS in comparison to the housing.
The observed differences in the heat transport of thermocouple and CTGS need to be considered in sensor applications where the thermocouple-based temperature compensation of the resonance frequency is necessary. Such a technique can be applied only if the temperature changes are slower than or equal to 1 K min−1. In case of environments where rapid temperature changes are expected, internal temperature compensation techniques based on, e.g., a third overtone have to be applied (see, e.g., Fritze, 2011). Alternatively, temperature sensing components such as resistance temperature detector (RTD) structures or thermocouples can be applied directly on the surface of the CTGS resonator.
Long-term stability
For the investigation of long-term stability, a housed CTGS resonator is annealed at a temperature of about 711.5 ∘C or more than 600 h. During this time, the temperature from a type S thermocouple and impedance spectra in the vicinity of the resonance frequency are recorded every 15 s. Subsequently, the resonance frequency is obtained by fitting Eq. (6). Finally, the inverse temperature coefficient is applied to convert the frequency to a temperature of the resonator. Since the temperature variations are low, a linear approximation is used in this case.
During the first 200 h of the annealing, an exponentially decaying shift in the fR by about 200 Hz is observed. Such an initial drift of the conductivity and resonance frequency of CTGS was reported previously by Suhak et al. (2018). After that time, the changes in the resonance frequency correspond to the temperature only. As shown in Fig. 14, the temperature reading from CTGS follows precisely the measurement from a thermocouple. Slight variations in T, due to changes in the environment conditions, are clearly visible. As expected, the measurement uncertainty for housed CTGS device is much lower.
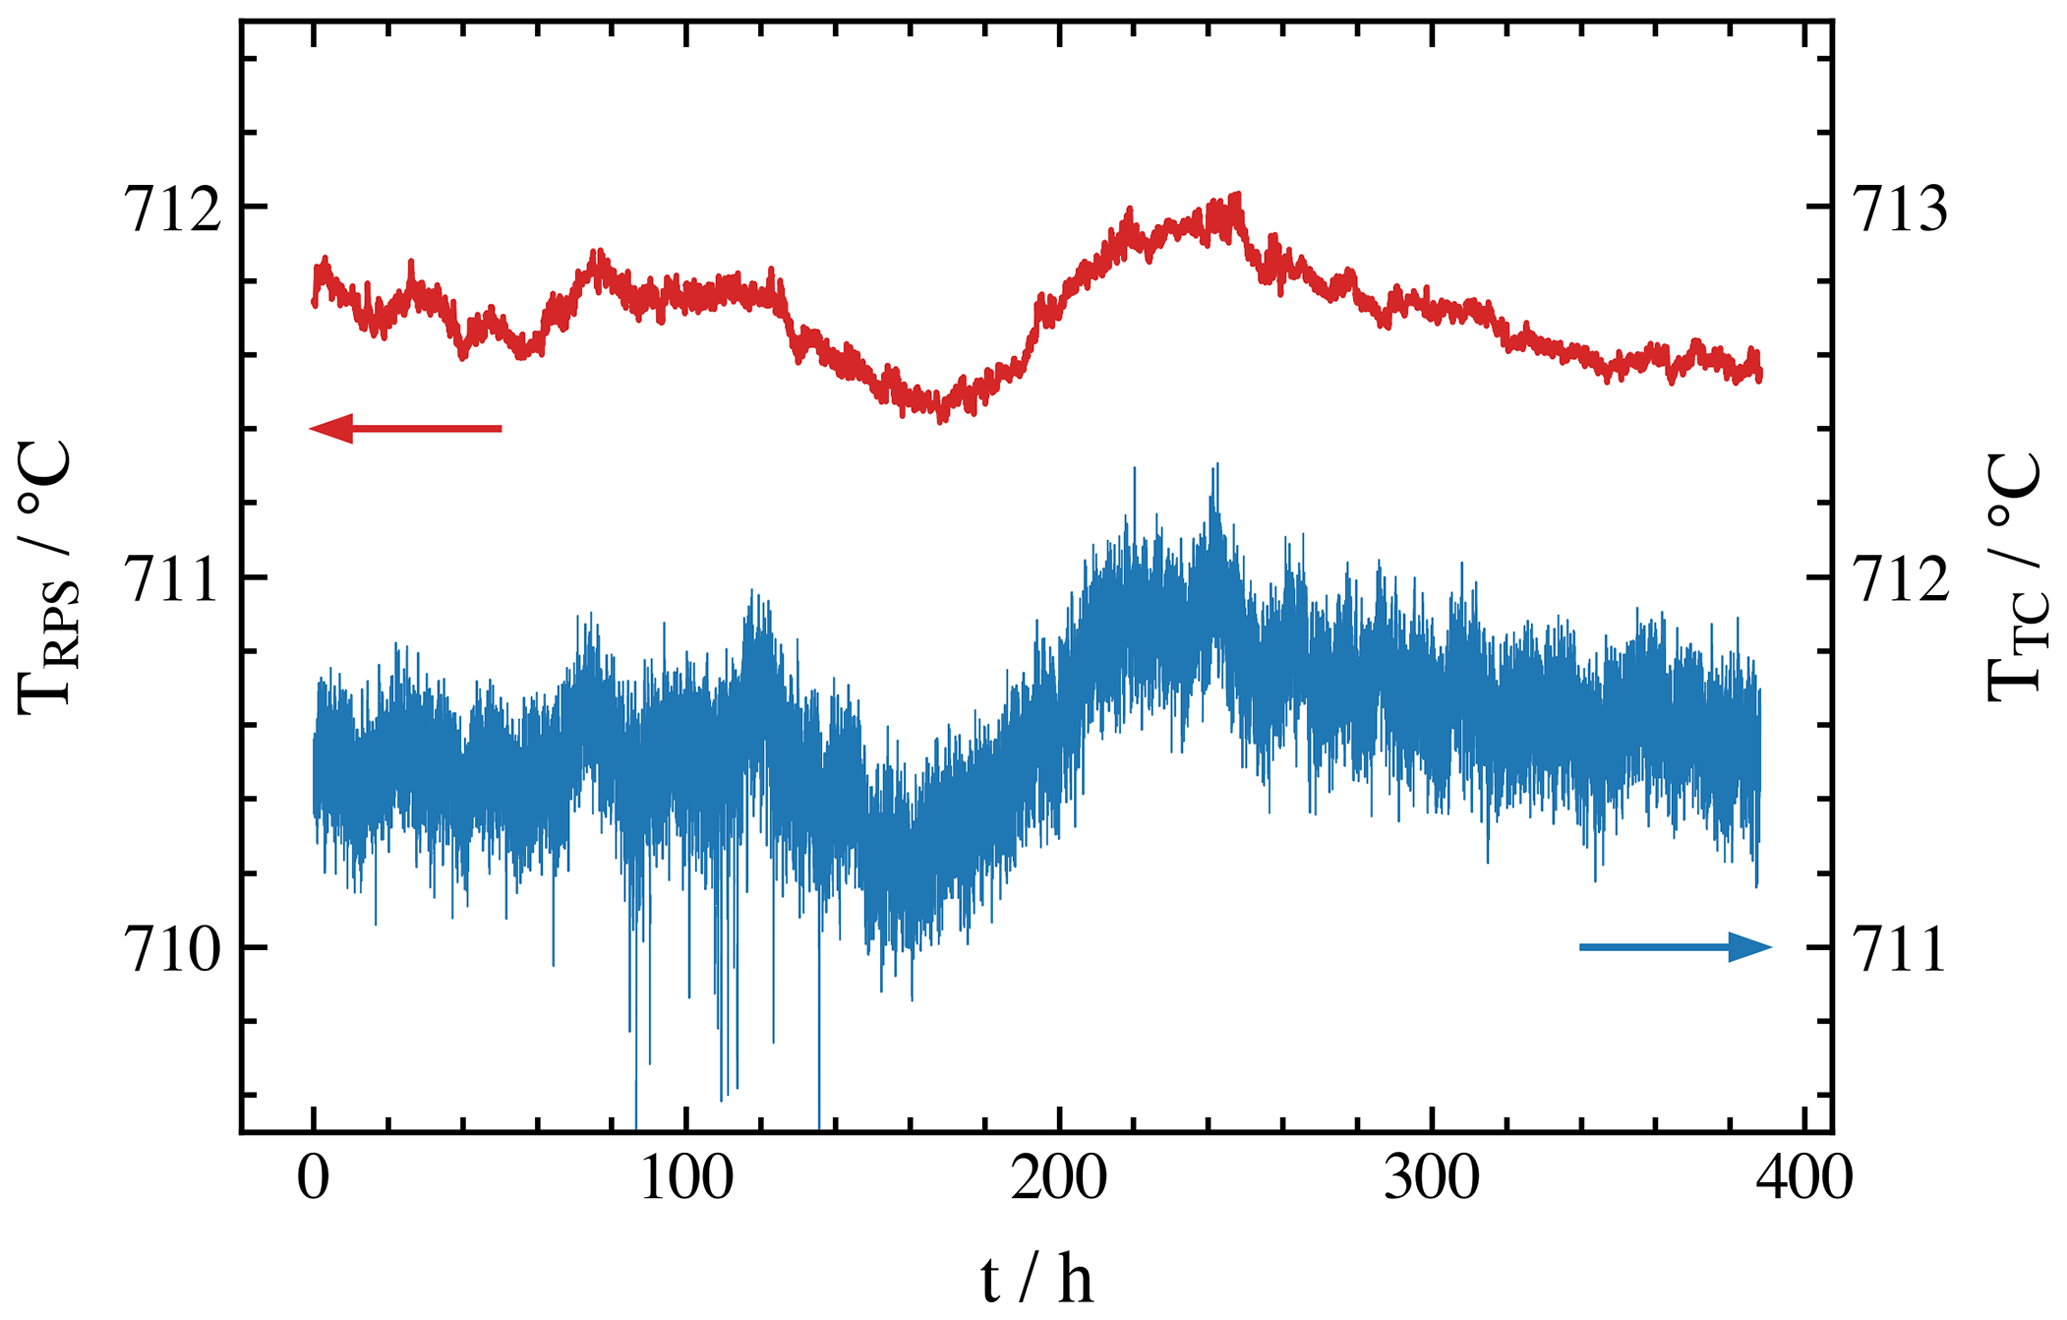
Figure 14Temperature obtained by means of the resonance piezoelectric spectroscopy, TRPS, using housed resonator and temperature obtained from a type S thermocouple, TTC. The temperature scales are shifted by 1 K for clearance.
A piezoelectric temperature sensor based on housed CTGS thickness shear mode resonators is presented. The sensor measures relative changes in temperature with a very good resolution of about 40 mK. The obtained temperature resolution is better than that of conventional thermocouples; the measured signal is much less prone to externally inducted noise in the case of a piezoelectric temperature sensor. Furthermore, the stability of CTGS allows one to use the sensor at extreme conditions, such as reducing atmospheres or with gases poisoning platinum electrodes of conventional thermocouples and impacting the Seebeck coefficient. In terms of absolute temperature measurement, a CTGS-based sensor would require calibration using fixed point references, such as zinc at 419.58 ∘C or gold at 1064.43 ∘C. The housing, based on poly- and single crystalline alumina, has no significant influence on the performance of the CTGS resonator. The temperature sensor is operated successfully up to 1030 ∘C, and no degradation of performance was observed after 30 d of continuous annealing at 711 ∘C. With respect to the response time, the housed CTGS device outperformed a type S thermocouple glued to the housing with ceramic cement significantly. Thanks to the low loss, oscillator circuits are expected to be applicable for frequency determination.
The data presented in this article are stored in an internal system according to the guidelines of the DFG. Research data are available upon request to the authors.
MS was responsible for the preparation and characterization of the CTGS resonators and housed devices. FK was responsible for bonding and assembling the complete devices. RG prepared the electrodes and performed the initial characterization of the CTGS resonators. MS performed the experiments on housed devices, analyzed the data and wrote initial paper. HF and JW initiated the research project and supported MS and FK with data interpretation and discussion. HF and JW revised the paper and led the project. MS and HF approved the final version of the paper.
The contact author has declared that neither they nor their co-authors have any competing interests.
Publisher's note: Copernicus Publications remains neutral with regard to jurisdictional claims in published maps and institutional affiliations.
This article is part of the special issue “Sensors and Measurement Science International SMSI 2021”. It is a result of the Sensor and Measurement Science International, 3–6 May 2021.
The authors thank the German Research Foundation (Deutsche Forschungsgemeinschaft – DFG) for the financial support (grant nos. FR 1301/21-2, FR 1301/35-1 and WI1987/6-1).
This open-access publication was funded by Clausthal University of Technology.
This paper was edited by Alexander Bergmann and reviewed by two anonymous referees.
Bruckner, G., Hauser, R., Stelzer, A., Maurer, L., Reindl, L., Teichmann, R., and Biniasch, J.: High temperature stable SAW based tagging system for identifying a pressure sensor, IEEE International Frequency COntrol Symposion and PDA Exhibition Jointly with the 17th European Frequency and Time Forum, 4-8 May 2003, Tampa, FL, USA, 942–947, 2003. a
CRYSTRAN: Sapphire IR Transmission data table, Crystran Ltd. [data set], available at: https://www.crystran.co.uk/optical-materials/sapphire-al2o3 (last access: 2 June 2021), 2019. a
Edler, F.: Precise temperature measurement above 1000 ∘C using thermocouples, Proc. Estonian Acad. Sci. Eng., 13, 310–319, 2007. a
Fachberger, R., Bruckner, G., Knoll, G., Hauser, R., Biniasch J., and Reindl, L.: Applicability of LiNbO3, langasite and GaPO4 in high temperature SAW sensors operating at radio frequencies, in: IEEE T. Ultrason. Ferroelect. Freq. Control, 51, 1427–1431, 2004. a
Fritze, H.: High-temperature bulk acoustic wave sensors, Meas. Sci. Technol., 22, 012002, https://doi.org/10.1088/0957-0233/22/1/012002, 2011. a, b, c, d, e
Johnson, W. L., Schulz, M., and Fritze, H.: High-temperature electroacoustic characterization of Y-cut and singly-rotated Ca3TaGa3Si2O14 resonators, IEEE T. Ultrason. Ferroelect. Freq. Control, 61, 1433–1441, 2014. a
Mason, W. P.: Physical Acoustics, Principles and Methods, Academic Press, New York, 1964. a
Olthuis, W., Streekstra, W., and Bergveld, P.: Theoretical and experimental determination of cell constants of planar-interdigitated electrolyte conductivity sensors, Sensor. Actuat. B, 24–25, 252–256, 1995. a
Özkan, O. T., and Moulson, A. J.: The electrical conductivity of single-crystal and polycrystalline aluminium oxide, J. Phys. D, 3, 983–987, 1970. a
Planck, M., and Masius, M.: The Theory of Heat Radiation, Blakiston, Philadelphia, 1914. a
Richter, D., Schulz, M., Sakharov, S., Davis, Z. J., and Fritze, H.: Surface acoustic wave devices: materials stability in harsh environments, MRS Proc., 1519, 329, https://doi.org/10.1557/opl.2012.1716, 2013. a
Sauerbrey, G.: Verwendung von Schwingquarzen zur Wägung dünner Schichten und zur Mikrowägung, Z. Phys., 155, 206–222, 1959. a
Sauerwald, J., Richter, D., Ansorge, E., Schmidt, B., and Fritze, H.: Langasite based miniaturized functional structures: Preparation, high-temperature properties and applications, Phys. Status Solidi A, 208, 390–403, 2011. a
Suhak, Y., Schulz, M., Johnson, W. L., Sotnikov, A., Schmidt, H., and Fritze, H.: Electromechanical properties and charge transport of Ca3TaGa3Si2O14 (CTGS) single crystals at elevated temperatures, Solid State Ionics, 317, 221–228, 2018. a, b, c, d, e
Suhak, Y., Johnson, W. L., Sotnikov, A., Schmidt, H., and Fritze, H.: Transport and electromechanical properties of Ca3TaGa3Si2O14 piezoelectric crystals at extreme temperatures, MRS Adv., 4, 515–521, 2019. a, b, c, d, e
Tuller, H. L. and Fritze, H.: High temperature balance, US Patent No. 6,370,955 B1, 2002. a
Welch, P.: The use of the fast Fourier transform for the estimation of power spectra: A method based on time averaging over short, modified periodograms, IEEE T. Audio Electroacoust., 15, 70–73, 1967. a
Will, F. G, deLorenzi, H. G., Janora, K. H.: Conduction mechanism of single-crystal alumina, J. Am. Ceram. Soc., 75, 295–304, 1992. a
Yu, F., Zhang, S., Zhao, X., Yuan, D., Qin, L., Wang, Q., and Shrout, T. R.: Investigation of Ca3TaGa3Si2O14 piezoelectric crystals for high temperature sensors, J. Appl. Phys., 109, 114103, https://doi.org/10.1063/1.3592347, 2011. a
Zhang, S. and Yu, F.: Piezoelectric materials for high temperature sensors, J. Am. Ceram. Soc., 94, 3153–3170, 2011. a, b
Zhang, S., Zheng, Y., Kong, H., Xin, J., Frantz, E., and Shrout, T. R.: Characterization of high temperature piezoelectric crystals with an ordered langasite structure, J. Appl. Phys., 105, 114107, https://doi.org/10.1063/1.3142429, 2009. a