the Creative Commons Attribution 4.0 License.
the Creative Commons Attribution 4.0 License.
 | 24 Feb 2021
Characterization of sand and sand–binder systems from the foundry industry with electrical impedance spectroscopy
Luca Bifano
Alice Fischerauer
Alfred Liedtke
Gerhard Fischerauer
The global economy consumes an estimated 4×10¹⁰ t of sand per year, with only 2×10¹⁰ t of sand being reproduced by natural sedimentation (Götze and Göbbels, 2017; Peduzzi, 2014). Among other things, sand is also used as a basic material for the production of molds and cores in the foundry industry. The consumption and the economic as well as ecological savings' potential in this area of application can be appreciated by way of an example: the environmental certificate of a single, albeit big German foundry (5160 employees) can be consulted, which states that 39 820 t of sand for casting molds had to be purchased in 2017 (Denes, 2018). In order to avoid having to dispose of the used sand in landfills and to reduce the use of new sand, it is therefore advantageous to renew the used sand in a so-called regeneration process and reuse it as a substitute for new sand in the production of molds and cores. It would be very advantageous if the condition of molding materials (sand–binder systems) in regenerator units could be monitored in real time because of the economic and ecological advantages of a monitored and optimized regeneration process. This work presents the results of investigations in this direction. The objects of investigation in this work are typical molding materials in the foundry industry, e.g., quartz sand, chromite sand, and bentonite as a binder, which are measured impedimetrically with the help of a plate capacitor measuring cell which is connected to an LCR meter (Agilent E4980A). The impedance of the filled capacitor is measured in a frequency range from 1.2 kHz to 1 MHz, containing 123 frequency points. The aim of this research is to work out if the mentioned substances can be measured with the presented measuring method and classified on the basis of impedance characteristics and thus whether impedance spectroscopy can be considered for process monitoring in the molding industry. It is shown that the condition monitoring can possibly be based on impedance spectroscopy because the resulting curves are characteristic of the material used. New and used sands as well as two-component mixtures of sands and binders showed a systematic behavior, which allows the sand or the composition of the mixture to be identified (classified) in the future. The examination of the scatter of the measurement results shows that the impedance data obtained with this method can be measured reproducibly. A descriptive model for multi-component systems is developed in order to be able to interpret the impedance scatter results and their representation in Nyquist plots. From this model, the filling density of the measurement cell and the density of conduction paths can be extracted as essential influence quantities.
- Article
(5495 KB) - Full-text XML
-
Supplement
(1474 KB) - BibTeX
- EndNote


The raw material sand is mined more than the natural regeneration of the sand deposits can compensate for (Götze and Göbbels, 2017; UNEP, 2019). One reason for this is that the foundry industry needs the sand to produce so-called lost forms and cores with binders like bentonite. As a consequence, used sand is now routinely recycled to save on raw material and to avoid the expensive disposal of used sand in landfills.
The aim of the used sand regeneration is to process the used sand, which consists of the molding base material (e.g., quartz sand), molding material binder (e.g., bentonite), and other molding material additives (e.g., lustrous carbon former), so that at the end of the regeneration process the molding base material is in a reusable state (Tilch et al., 2019).
As the type and quality of sand play an important role in foundry applications, the qualification of the raw and regenerated materials is defined by industry regulations. In Germany, e.g., the guidelines are drafted by the Bundesverband der Deutschen Gießerei-Industrie (Federal Association of the German Foundry Industry, BDG). As yet, laboratory tests are the standard method (Tilch et al., 2019).
To achieve optimum results at the lowest possible cost, the sand condition needs to be monitored during the recycling process. Our goal is to base such a condition monitoring on electrical impedance spectroscopy (EIS). Known results from the literature indicate that the characteristics of different raw materials such as grain size distribution, crystal structure, and moisture may be distinguishable with this method. For example, Kaden et al. (2013) show how the permittivity of bentonite depends on its water content. Belyaeva et al. (2017) describe the complex permittivity of sand–bentonite–water mixtures with a plausible model.
Preliminary investigations showed that the different composition of molding materials led to different Nyquist curves (Bifano et al., 2020). It turned out that there is a systematic relation between electrical conductivity and the proportion of molding sand and chromite sand, which was revealed by an impedance measurement at 100 kHz. With the conventional measurement method of the foundry, these findings could only be worked out for the correlation between the conductivity and the relation of molding sand (Bifano et al., 2020). This underlines the existing potential of EIS for process monitoring.
We have now extended this approach and have investigated whether the various molding materials can be characterized by impedance measurements.
The different types of material under test (MUT) investigated in this work are listed in Table 1. MUT 1 was a quartz sand suitable for foundries. MUT 2 was a chromite sand used for molded parts subject to high thermal loads. The average grain diameter was 0.2 mm for MUT 1 and 0.3 mm for MUT 2. A sample of MUT 1 (“MUT 1a” in Table 1) was exposed to 800 ∘C for more than 88 h, then cooled and measured again. This simulated the casting process and the associated thermal load on the sand. The two differently processed samples of the quartz sand are referred to as “new sand” (MUT 1) and “used sand” (MUT 1a) in the following. The materials termed MUT 3a through 3e in Table 1 were samples of MUT 1 mixed with various amounts of bentonite. Figure 1a–d show microscope images, Fig. 1e–h SEM (scanning electron microscope) images of the different materials.
Table 1Chemical composition (percentage mass fractions) and corresponding picture in Fig. 1 for the examined types of material under test (MUT). B. denotes bentonite.
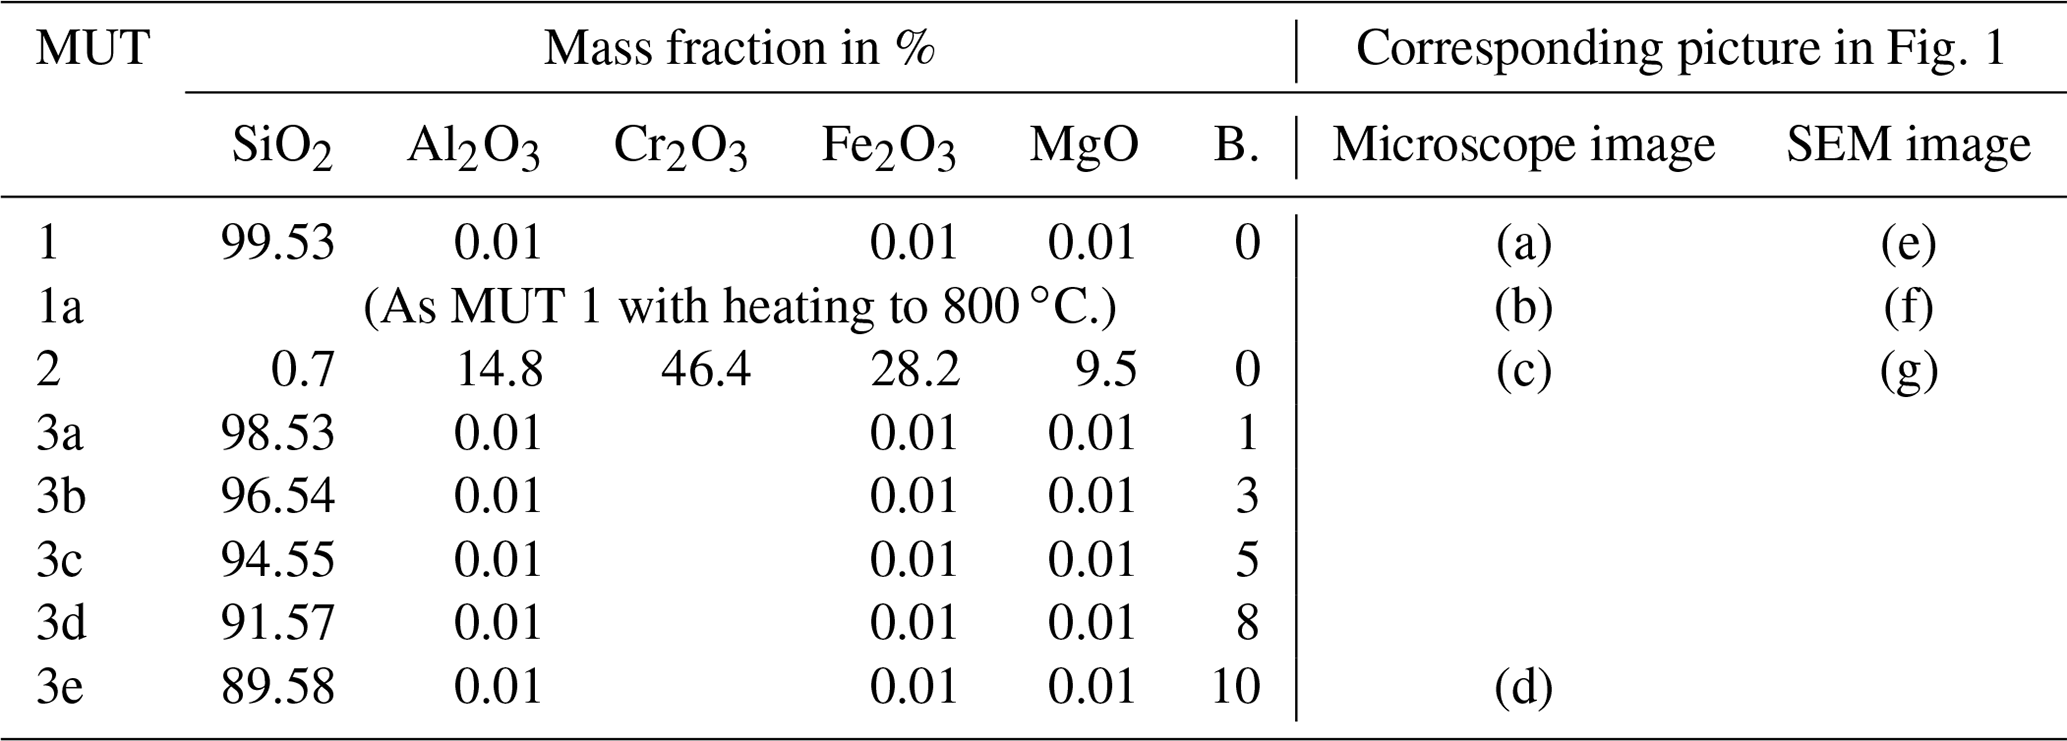
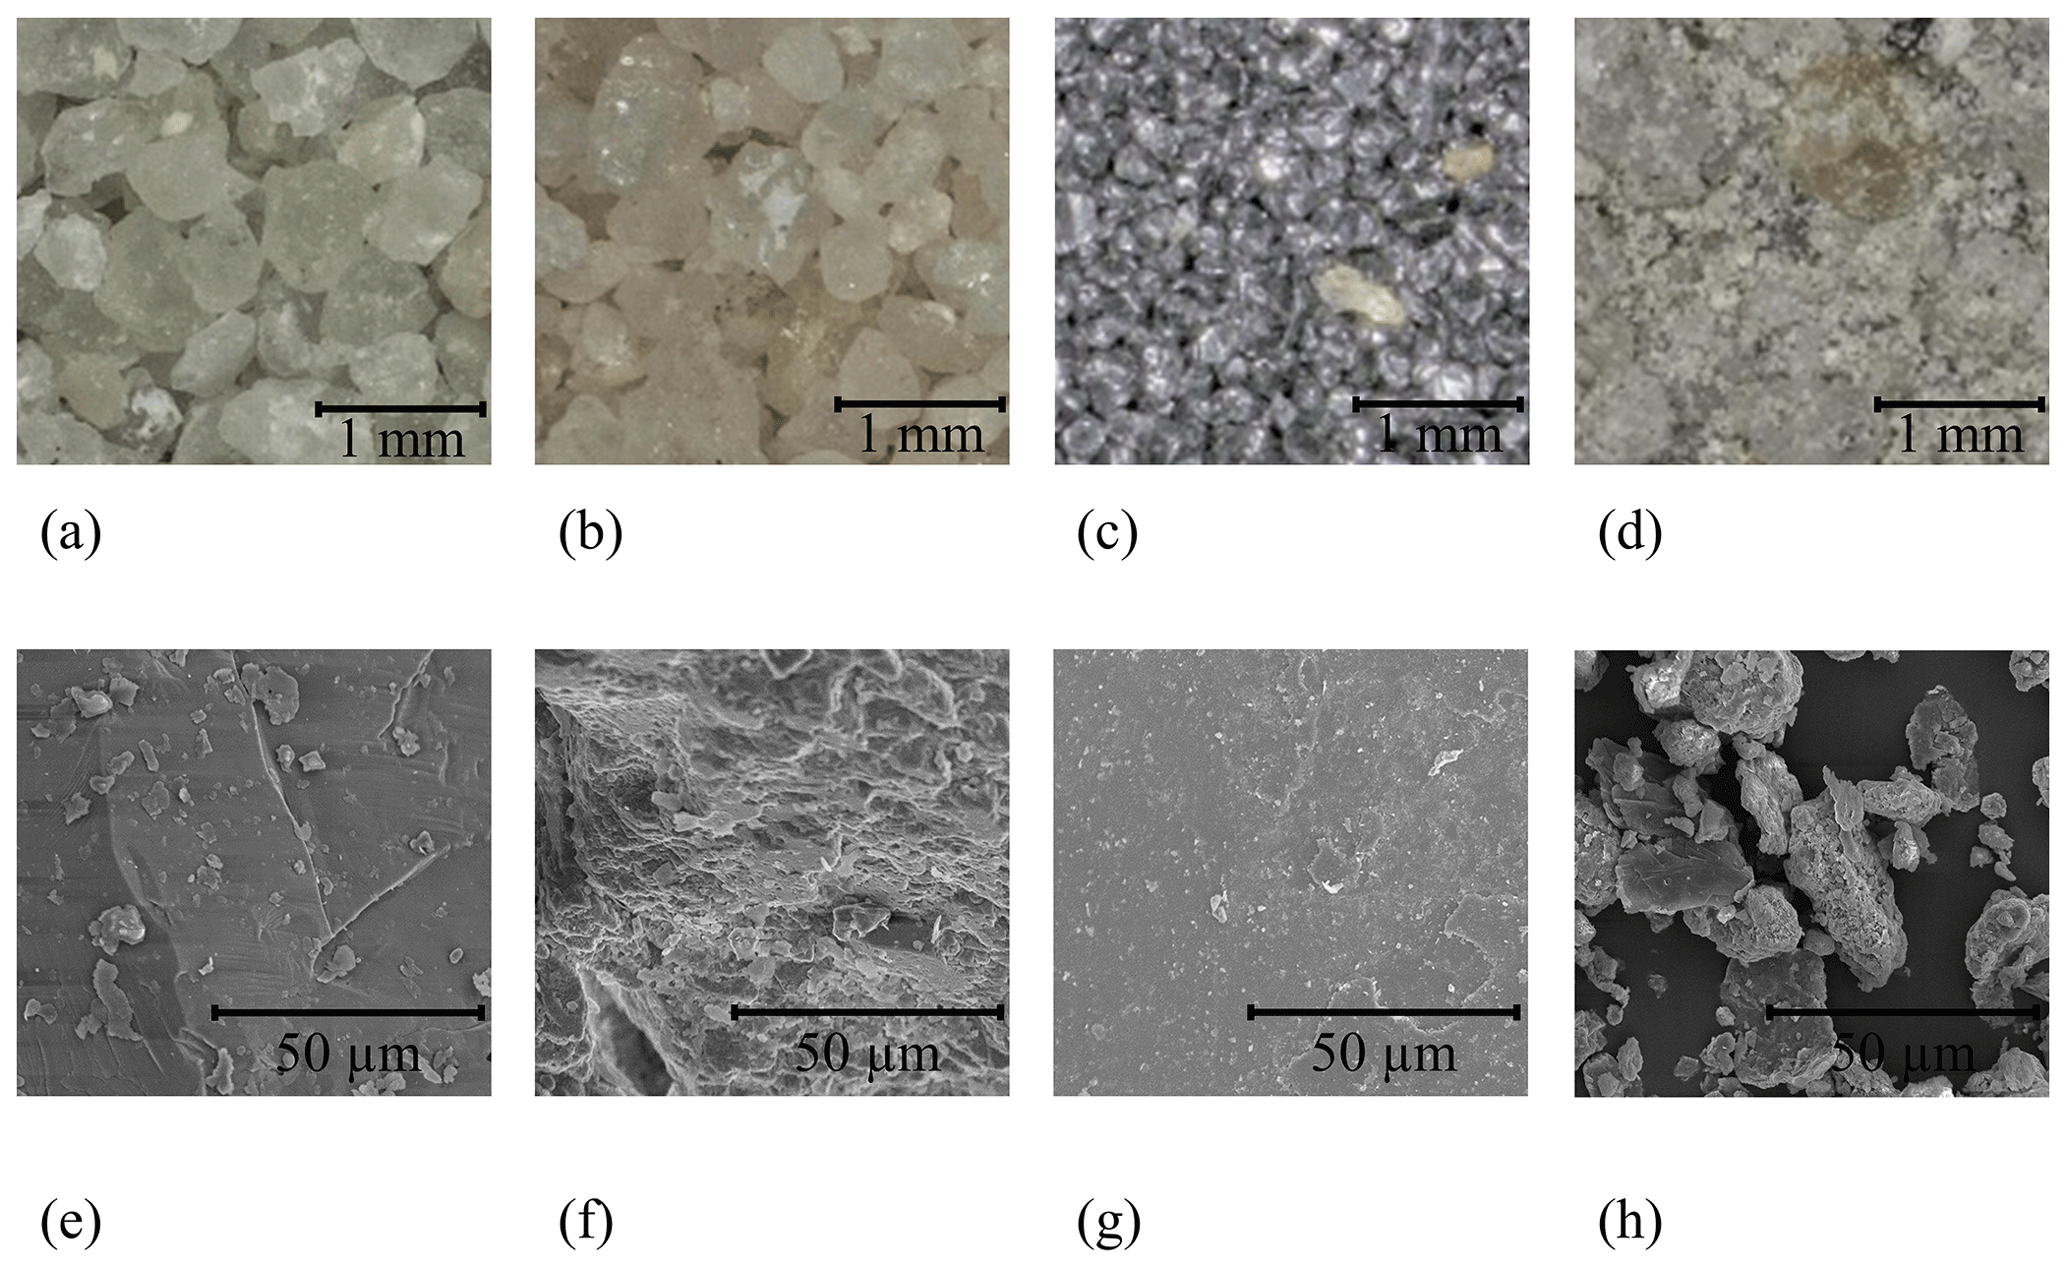
Figure 1High-resolution pictures of the materials under investigation. (a) Microscope image of MUT 1. (b–d) Same as before for MUT 1a, MUT 2, and MUT 3e. (e) SEM images of MUT 1. (f–h) Same as before for MUT 1a, MUT 2, and bentonite.
Quartz sands are used, e.g., in the construction, metal, and glass industries (Götze and Göbbels, 2017). The quartz sand used in foundries for mold and core construction should have a quartz content of at least 94 %. The temperature-dependent change in crystal structure of SiO2 is associated with a change in volume of quartz, which is initiated by the casting process (Götze and Göbbels, 2017; Tilch et al., 2019). The crystal conversion of SiO2 described in Götze and Göbbels (2017) and Tilch et al. (2019) appears to be confirmed by the microscope images in Fig. 1a, b, e, and f. On the one hand, one recognizes red discoloration of the actually white quartz sand in Fig. 1a and b. This occurs due to the temperature load. On the other hand, the SEM image in Fig. 1f reveals a crack structure on the quartz grain surface. This suggests that the volume and thus the crystal structure of SiO2 could have changed due to the temperature load.
Chromites are refractory materials that are used as raw materials, e.g., for the production of pig iron mixers or furnaces (Routschka and Wuthnow, 2007). In the foundry-specific application, the higher packing density of chromite sand and the associated higher rate of heat removal are used for molds and cores that are exposed to special thermal loads (Tilch et al., 2019). Figure 1c shows that the individual grains of sand are packed more densely than with quartz sand. For this reason, the number of grain contacts and grain–grain interfaces in the chromite sand is significantly larger than in the quartz sand since there are more air–grain interfaces due to a higher porosity.
Bentonite is a three-layer silicate; its main component is montmorillonite (Götze and Göbbels, 2017). In addition to its use as an inorganic binder (so-called active clay) in the foundry industry, it is used primarily in the petroleum industry and in landfill construction to seal against water (Götze and Göbbels, 2017; Kaden et al., 2013). The bentonite particles have grain diameters of < 20 µm (Tilch et al., 2019). Figure 1h shows the typical platelet structure, as also described in Tilch et al. (2019). In the foundry-specific application, the bentonite is used as a binding component; its proportions in the molding sand mixture lie between 5 % and 12 %. It loses its ability to bind irreversibly (so-called inactive state) when heated to 500–700 ∘C, and a rearrangement of its crystal lattice results from the loss of the bound crystal water (Tilch et al., 2019). It is clear from Fig. 1 that the bentonite contributes to a change in the structure by lying on the sand particle surface and thus closing the cavities between the individual sand particles (Fig. 1d). In addition to the material change (compared to pure quartz sand), there are changed contact conditions and associated changed interfaces. In summary, it can be stated that the different molding sand materials differ by their chemical components. Moreover, the characteristic shape of the grains in each material causes a change in the number of grain contacts and, as a result, interfaces. Since these characteristics are subject to constant change during regeneration, the progressive regeneration process should be observable by EIS. The results of this will be presented in the following sections.
Our measurement setup comprised a circular cylindrical cell (Fig. 2), which could be filled with the material under test (MUT). The cell was equipped with two opposing copper electrodes (diameter 13 cm, plate spacing 4 cm), which were soldered to two coaxial cables. The bottom and top electrodes were respectively glued to a wooden plate and a Makrolon cylinder. The casing of the cell was made of a polymer.

Figure 2Schematic representation of the measuring cell used. (1) Wooden base plate. (2) Makrolon cylinder. (3) Polymer surround. (4) Molding material. (5) Upper and lower copper electrodes (Bifano, 2020).
The complex impedance Z of the MUT-filled cell was measured by an E4890A LCR meter from Agilent. The results presented in this work pertain to the materials listed in Table 1. Figure 3 shows both the system architecture and the physical realization of the measurement setup.
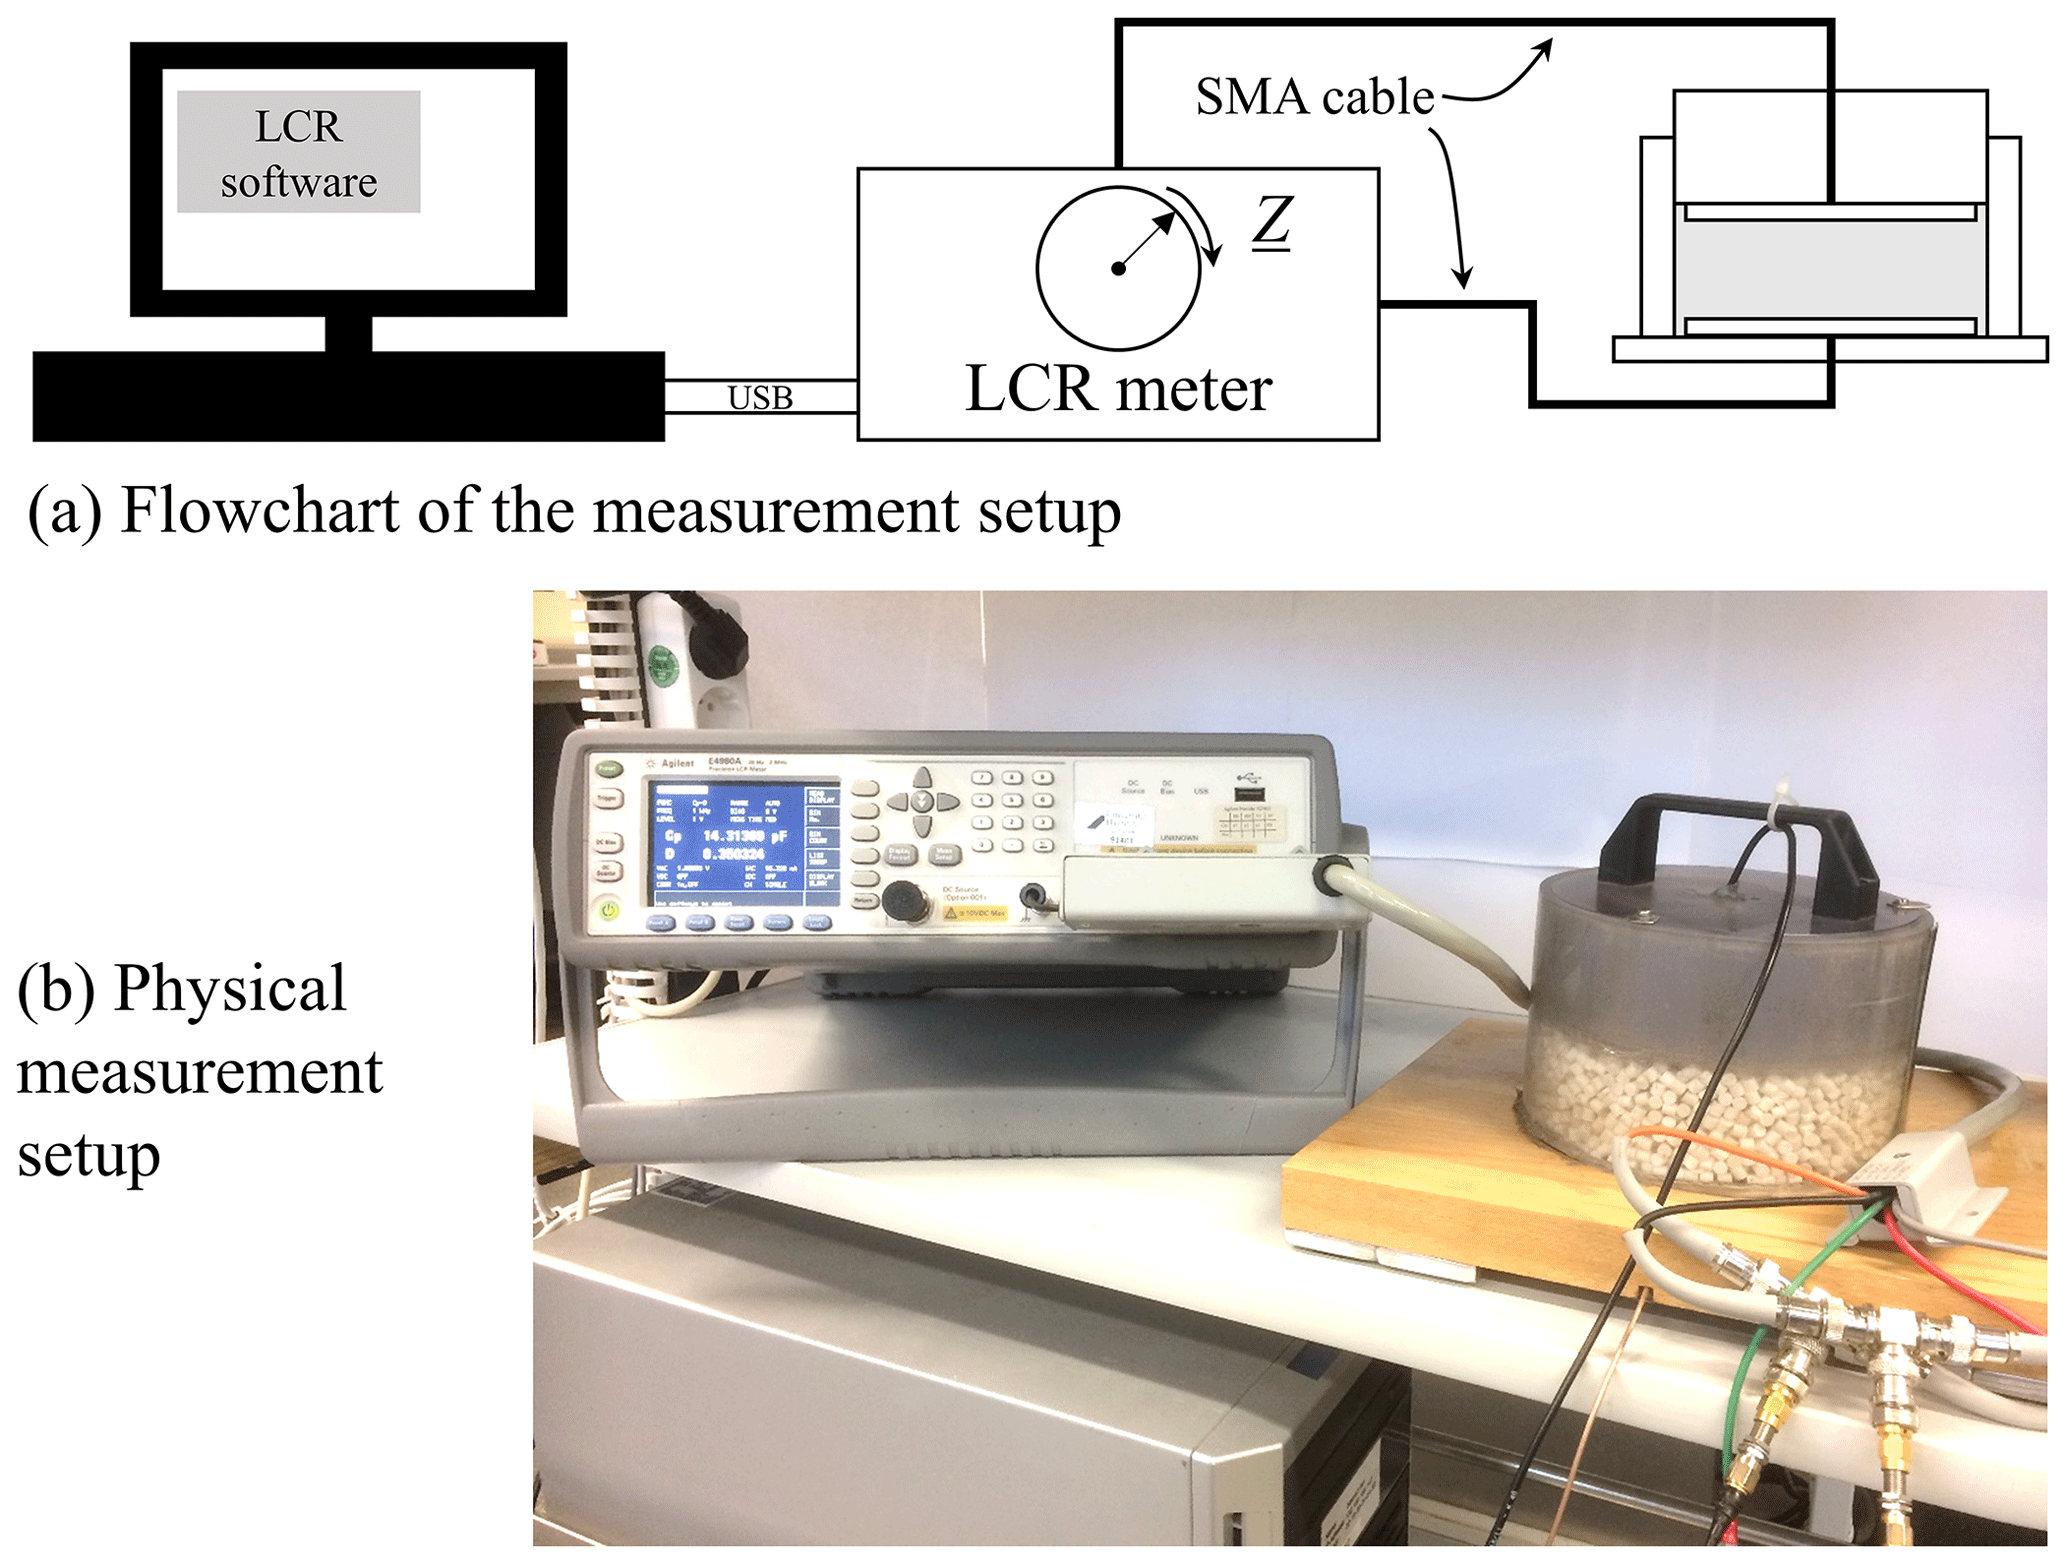
The actual impedance measurements were carried out at a laboratory temperature of 23 ∘C. The material density within the cell was recorded. The measured sands were in a dry state, i.e., with a relative humidity less than 0.3 %. After filling the measuring cell, the measurement was started without delay, so that any compression processes that might occur in the measuring cell were uniform for each measurement. As a consequence of the measuring range specified by the manufacturer of the LCR meter, the start frequency was set to 1.2 kHz, the end frequency to 1 MHz. One frequency sweep contains 123 frequency points and takes less than 1 min to complete. The LCR meter was connected to the PC via a USB cable and controlled by a custom-specific program written in LabView. To shed light on random deviation we repeated each measurement 20 times. In this way, the scatter of the measurement results obtained with a given cell filling could be assessed. In addition, we emptied and refilled the measuring cell 10 times with the same MUT and then repeated the measurement as described before.
The measured impedance spectra were evaluated with MATLAB. The uncertainty of the measured impedance at a given frequency was estimated at a confidence level of 95 % from the empirical covariance matrix.
The mathematical theory can be found in Hald (1952) and Paradowski (1997). The uncertainty is visualized by plotting the error ellipse in the complex impedance plane. A statistical correlation between real and imaginary parts is revealed by an inclination of the main axes of the ellipse with respect to the coordinate axes.
Figure 4 shows the Nyquist plots of measured impedances for quartz sand (average of 10 independent MUT 1 and 1a measurements, respectively), for chromite sand (MUT 2), and for various mixtures of new sand and bentonite (MUT 3a–e from Table 1). The results of 10 independent measurements of MUT 2 were plotted to convey an idea of the reproducibility of the measurement of this material.
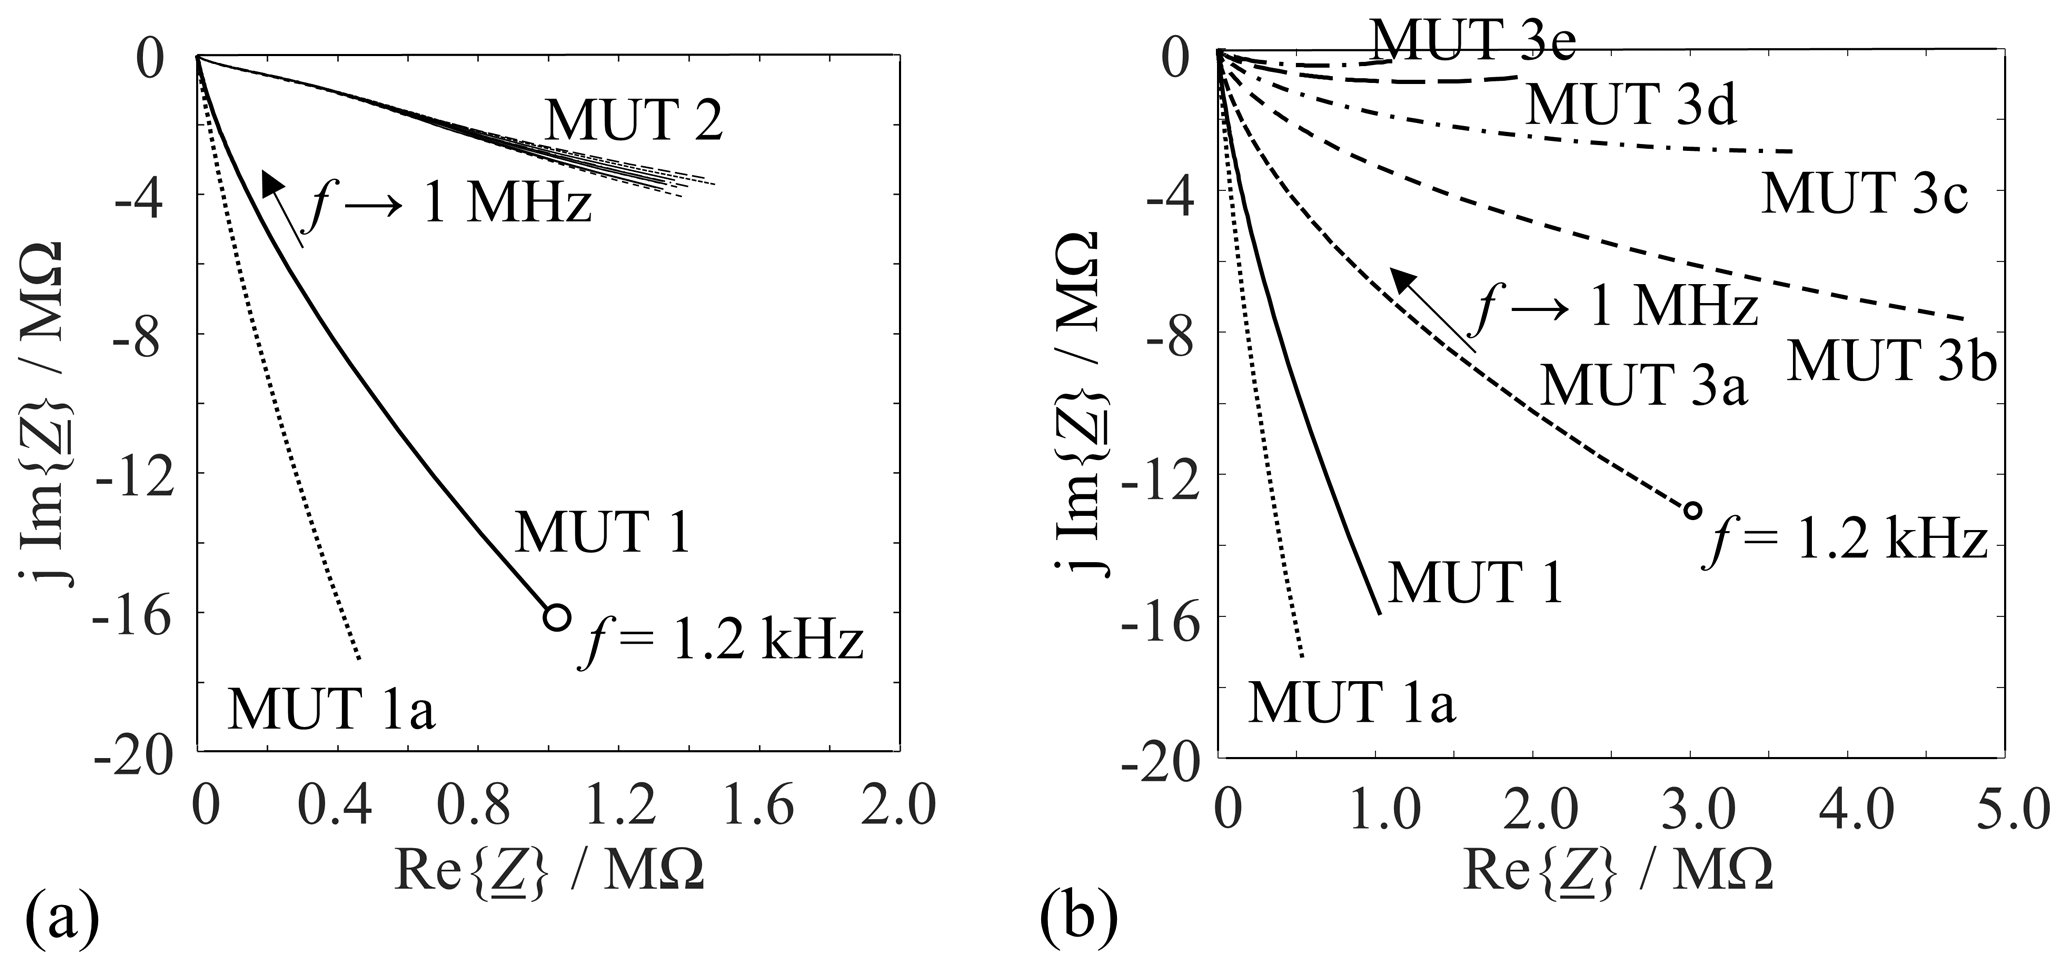
Figure 4Nyquist plots of the measured molding materials from Table 1 in the frequency range from 1.2 kHz to 1 MHz.
At equal frequencies, thermally processed sands (MUT 1a) lead to steeper slopes than the other sands, corresponding to higher values of R, i.e., lower electrical conductivities. This is attributed to the fact that the sand grain surface partly bursts when heated. This leads to an increased porosity and more air in and between the sand grains. SEM images of the grain surface (Fig. 1f) and a decrease in the bulk density corroborate the explanation. By a similar line of reasoning, MUT 2 is more conductive than the quartz sands. The reason is the higher packing density (more conduction paths) and the different composition (Fe2+ ions in the crystal lattice) (Tilch et al., 2019; Okrusch and Matthes, 2005). The measurement results for sand–bentonite mixtures (MUT 3a through 3e in Table 1) are visualized in Fig. 4b. The electrical conductivity obviously increases with the bentonite content. This is plausible as bentonite contains cations and water molecules in its lattice (Tilch et al., 2019).
Figure 5 provides details about statistical deviations by way of an example. The MUT in this case was new sand (MUT 1), measured at a frequency of 100 kHz.
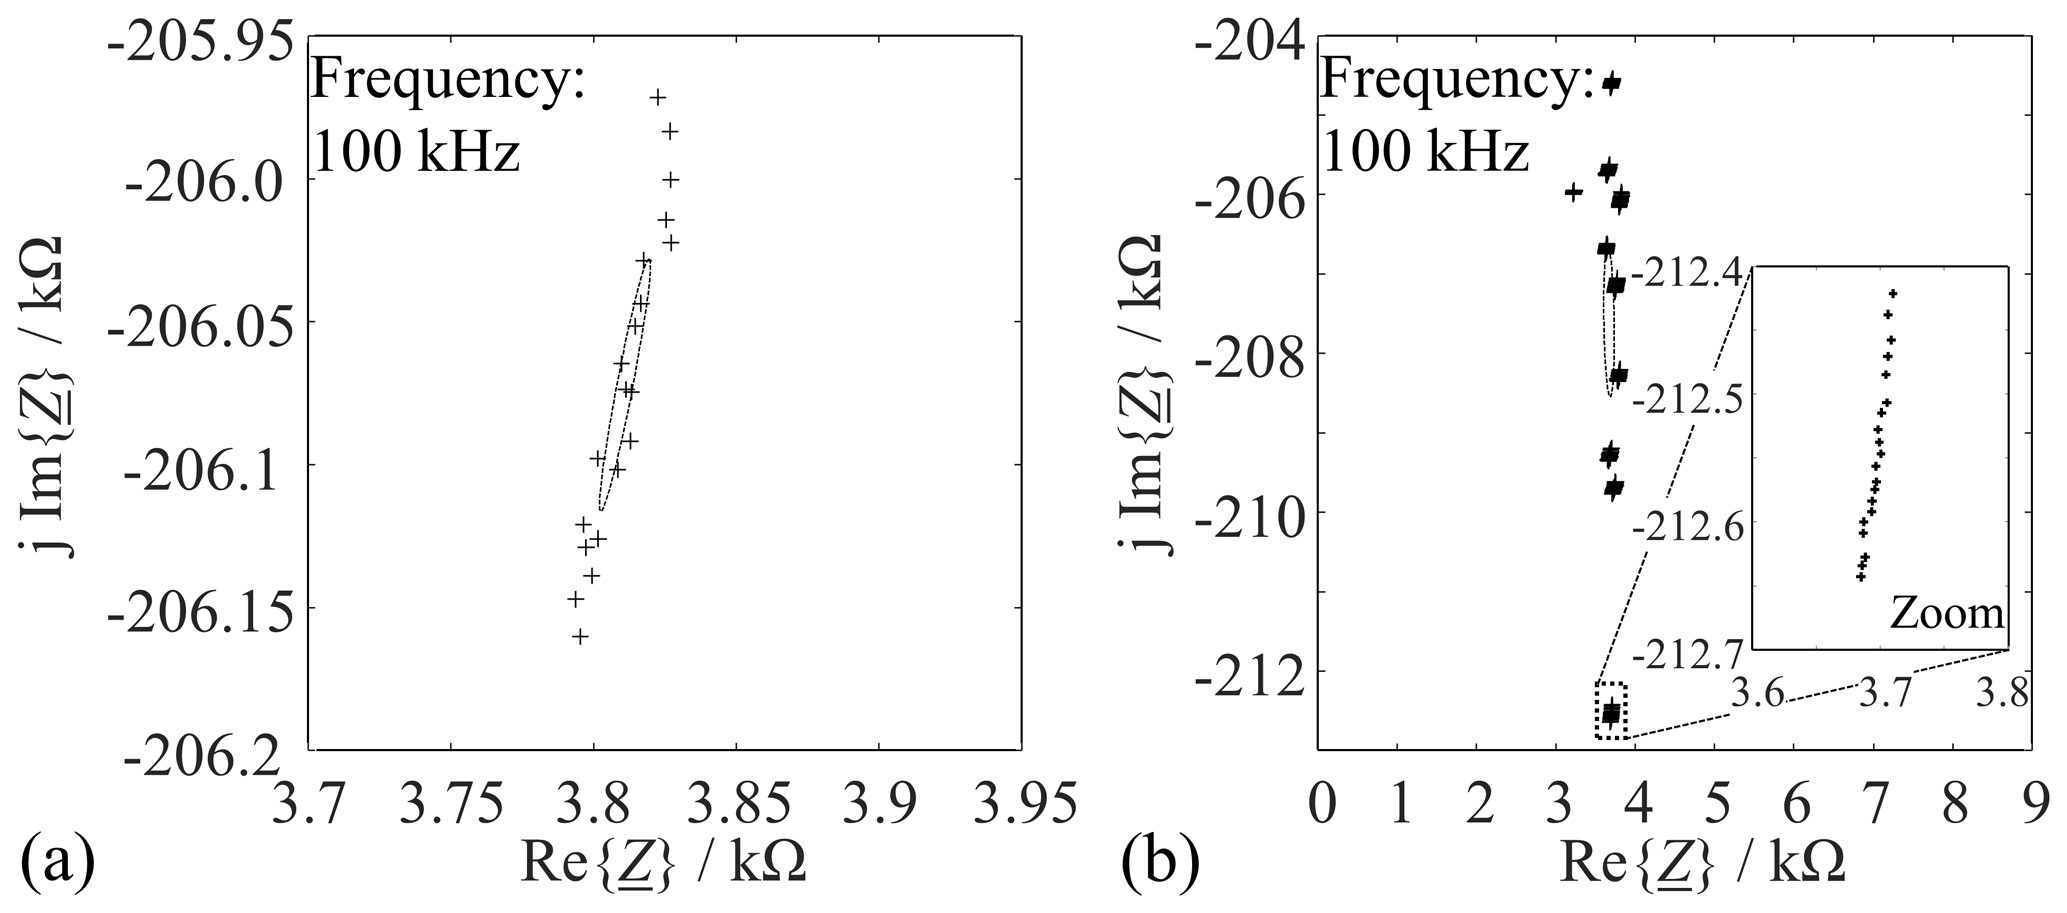
Figure 5Uncertainty ellipses at a confidence level of 95 % for samples of new sand (MUT 1) at a frequency of 100 kHz. (a) Measuring cell filled once and measured 20 times. (b) Measuring cell emptied and refilled 10 times and measured 20 times each.
The scatter is actually small. The main influence is from dimensional variations when the cell is filled with the MUT (Fig. 5b). The scatter in the reactance Im{} is much larger than the scatter in the resistance Re{}, which results from the fact that the Nyquist curve has a very steep slope at the measurement frequencies. In the same way, the scattering behavior of the other types of MUT at 100 kHz was investigated, and it was found that there were no significant differences in the scattering behavior of the different types of MUT. For this reason, only the results of MUT 1 are presented here. Altogether, there is a negligibly small correlation between the errors in the measured reactance and resistance as the uncertainty ellipse axes are almost aligned with the coordinate axes by Fig. 6 (Hald, 1952).
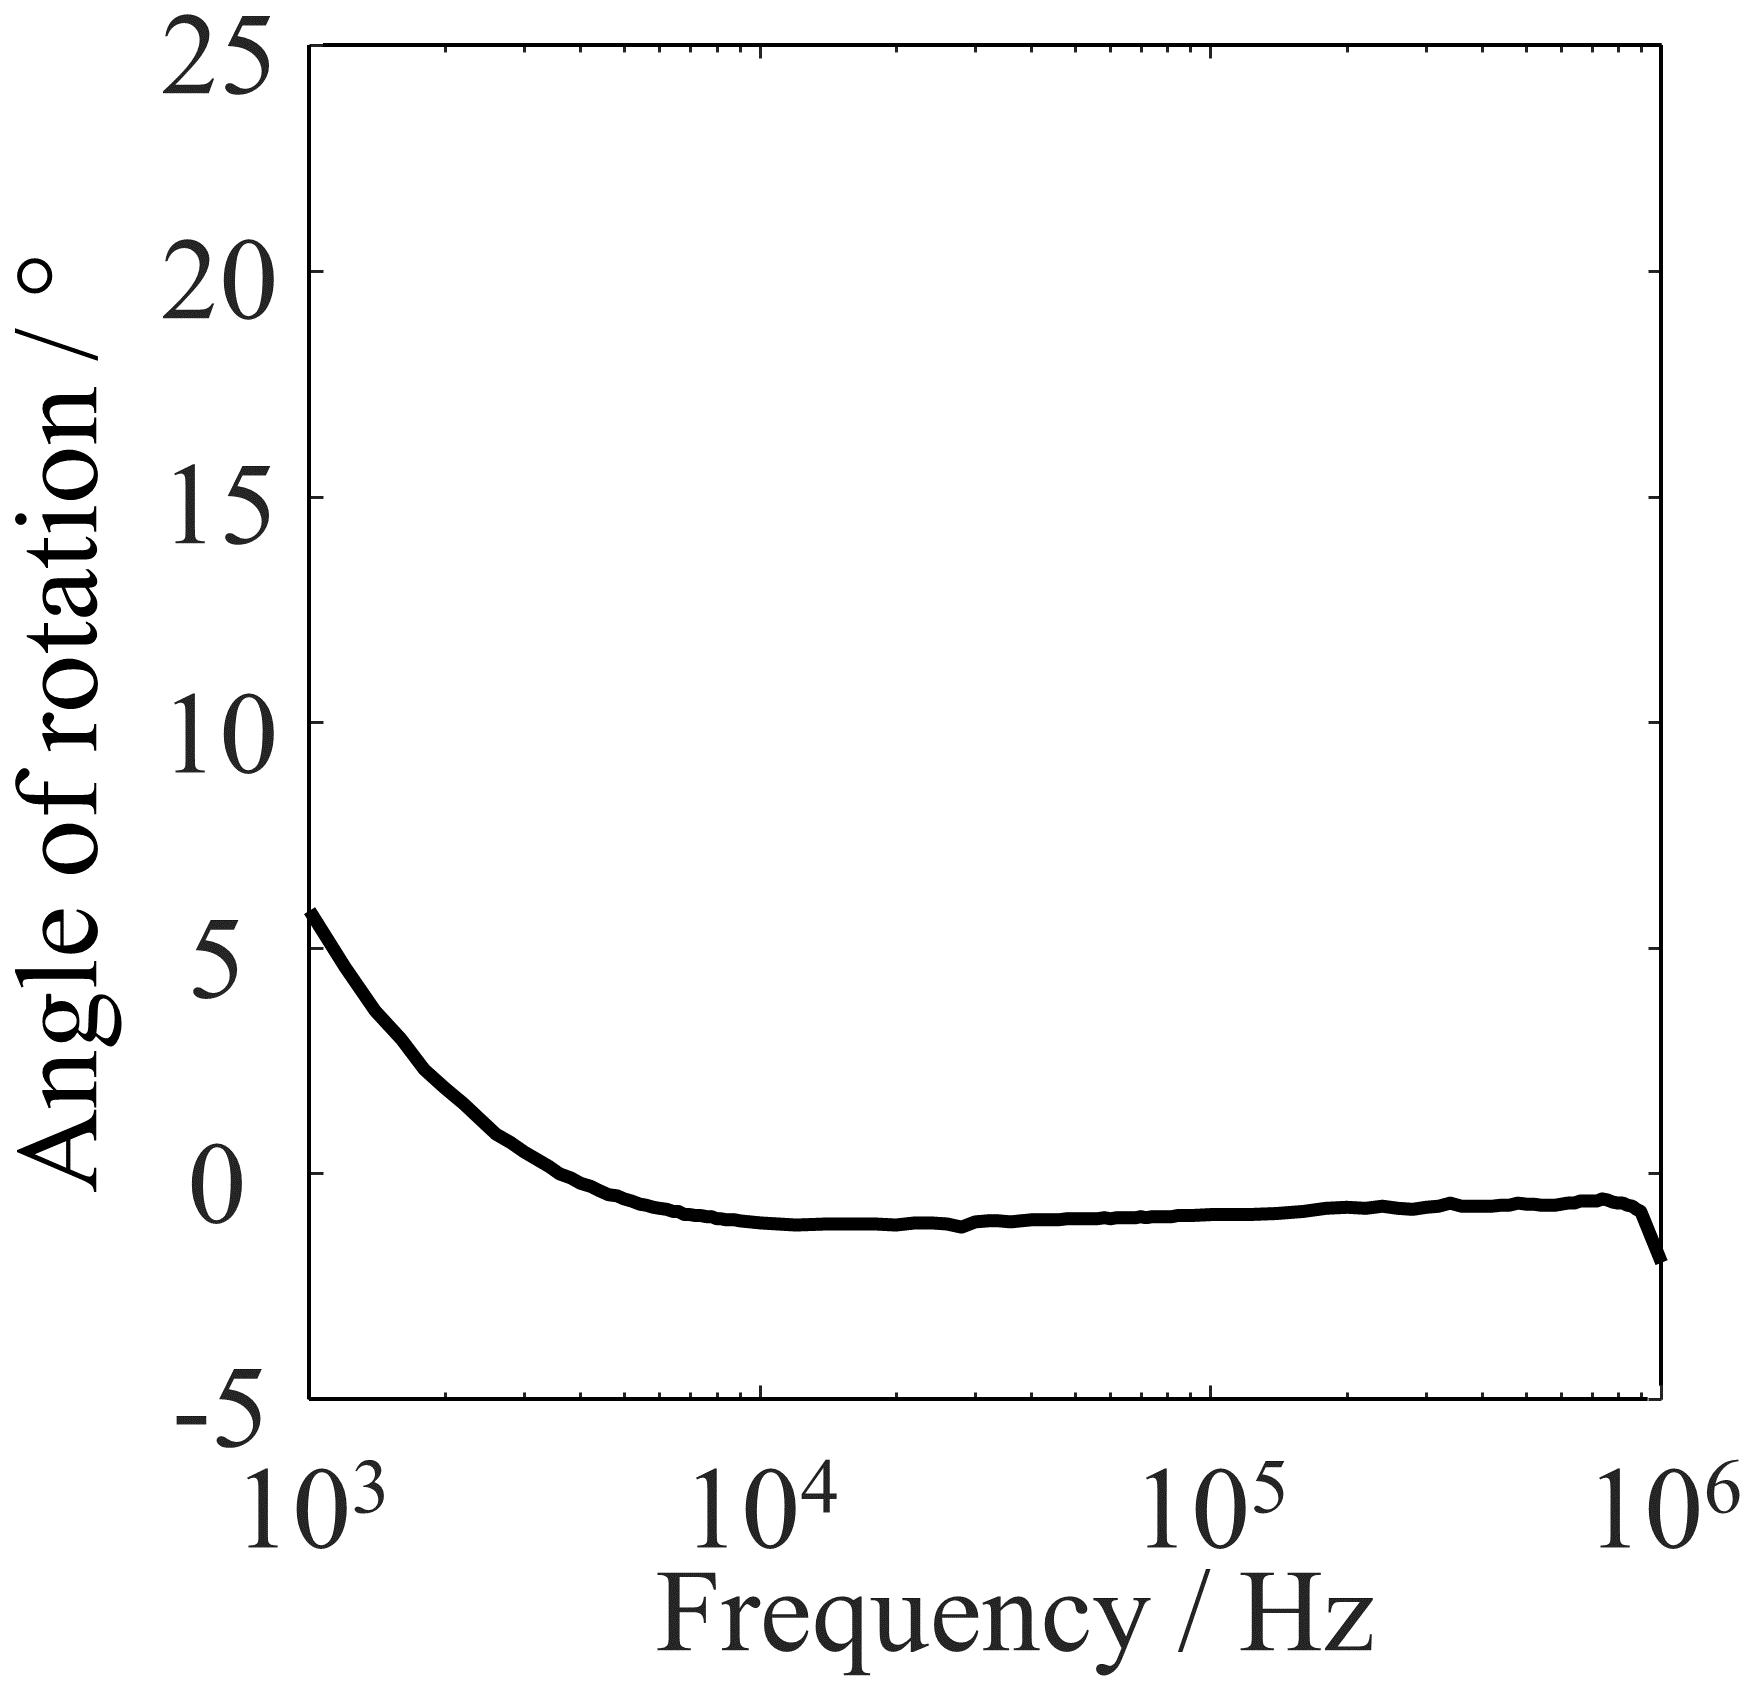
Figure 6Angle between the major axis of the uncertainty ellipse and the real-part axis of the impedance plane, plotted against the frequency. The curve shows the data evaluation of the 10-fold emptied and refilled measuring cell with MUT 1. Each filling was measured 20 times.
In the literature, the Kramers–Kronig relations (KKR) are often cited as a means of checking the plausibility of measured impedance spectra (Dambrowski, 2013; Schönleber and Klotz, 2014). If the real part of an impedance is known over a wide frequency spectrum, KKR and the known resistance can be used to determine the reactance spectrum. Here, the KKR method turns out to be useless for several reasons. As we aim at process monitoring in real time, the measurement must necessarily be fast. As a result, the available frequency range is limited towards small frequencies. In addition, the measuring device limits the spectrum towards high frequencies. Together, the available frequencies only extend from the low kHz range up to 1 MHz. This is too narrow for the application of the KKR method (which only states that Im{(f)} can be computed from Re{(f)}–R∞ if the real part is known at all frequencies). Furthermore, the measured impedances lie in a range in which the reactance changes strongly and the resistance varies very little (see Fig. 4a). The resistance is already close to its high-frequency limit R∞, in which case the KKR method cannot be used.
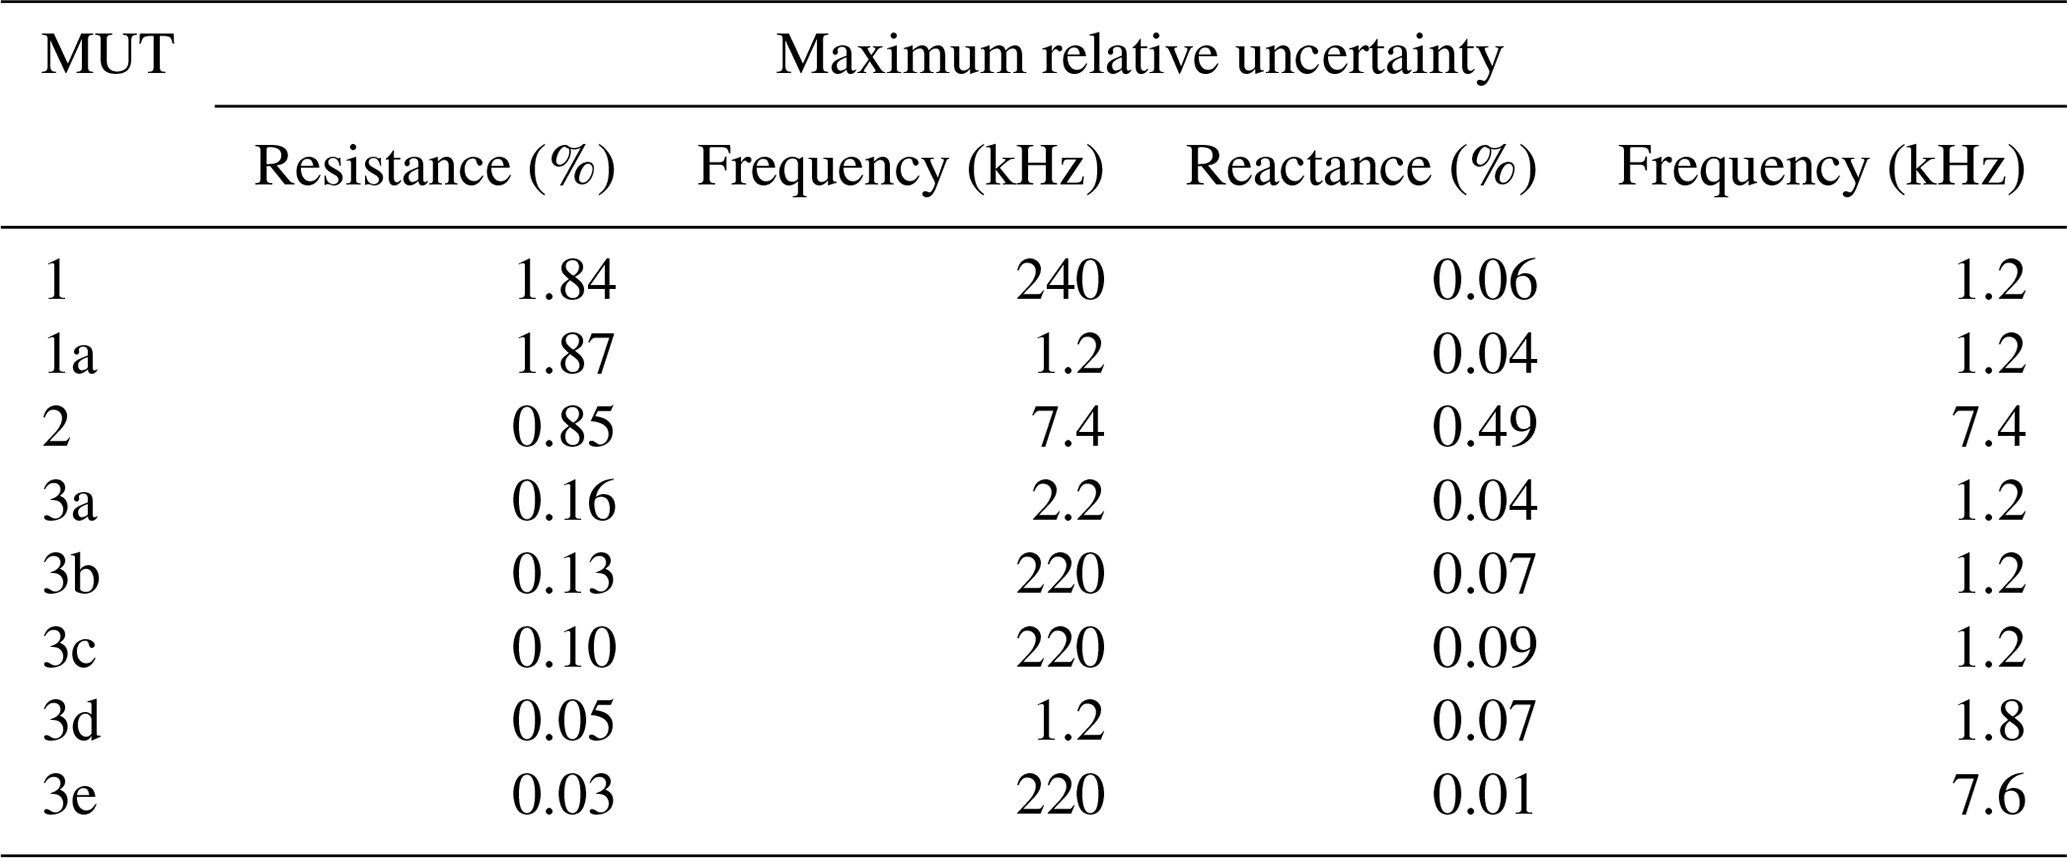
In order to describe the reproducibility of these results in numbers, the maximum relative uncertainty in the real and imaginary axis direction is used. The values are plotted as functions of frequency in Fig. 7. The relative uncertainty for MUT 1, 1a, and 2 is at a pleasantly acceptable level for large frequency ranges, although the cell has been emptied, refilled, and measured 10 times. The data of a cell that has been filled once and measured several times are scattered even less. Table 2 shows the maximum relative uncertainties for this case.
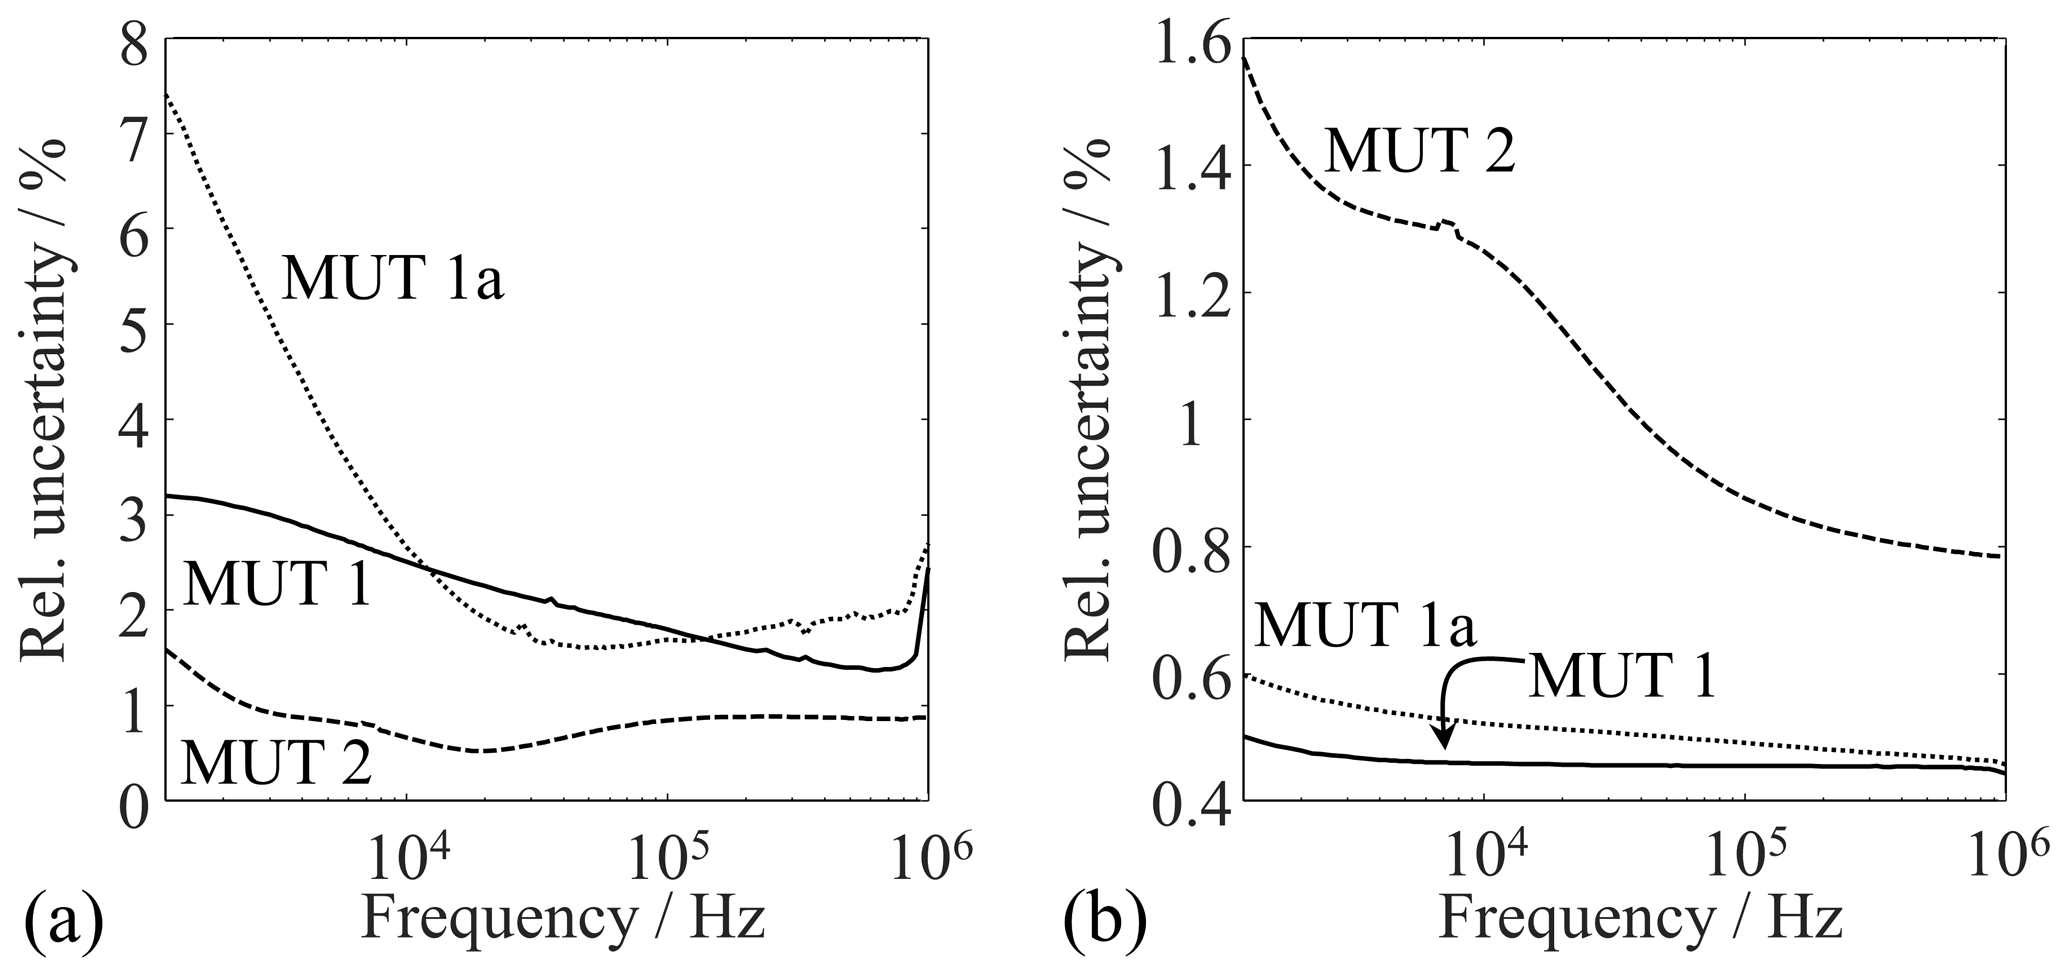
Figure 7Relative uncertainties plotted over the frequency for (a) the measured resistance and (b) the measured reactance with various materials.
Table 2Maximum relative uncertainty of the measured cell impedance with different types of material under test (MUT) and the respective frequency at which it occurs. All uncertainties were determined at a confidence level of 95 %.
A qualitative model of the materials investigated treats them as a two-component mixture of spheres (i.e., sand grains) and air (background). A similar arrangement is shown in Kirichek et al. (2017). In this qualitative approach, all spheres are assumed to have the same shape and size. As an example, Fig. 8 shows three different arrangements of the spheres.
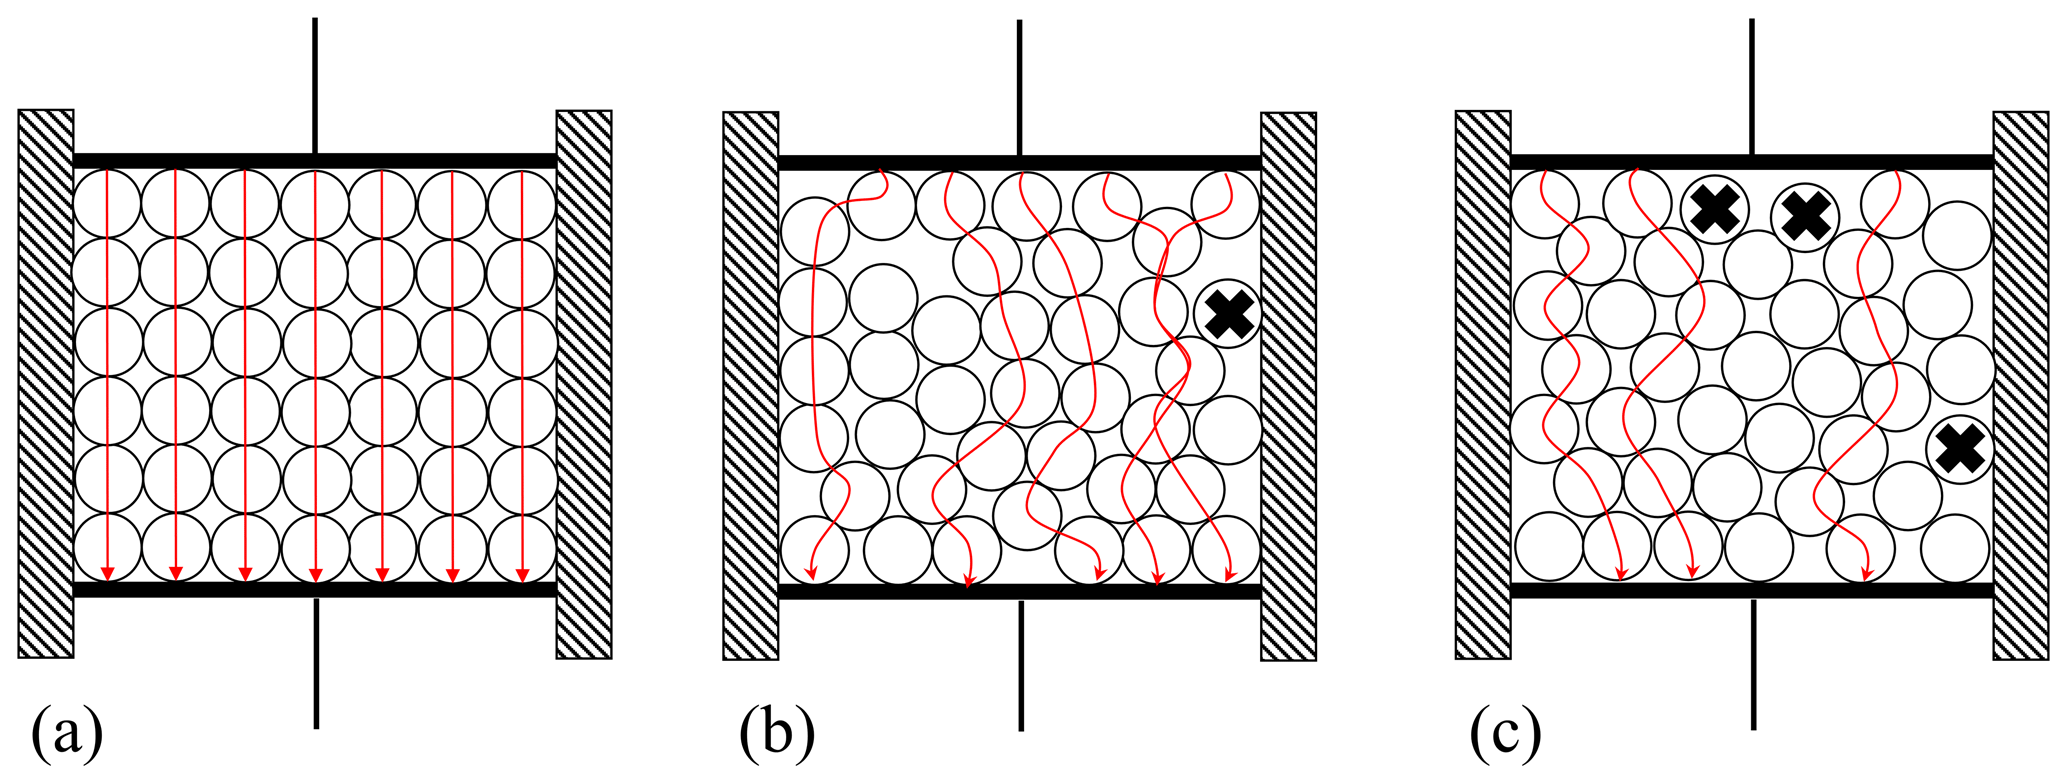
Figure 8Schematic model of the two-component system of sand (spheres) and air. The arrows represent the direct, i.e., shortest, conduction paths for the electric current. The particles marked with x are so-called dead grains of sand since they do not contribute to the conduction path.
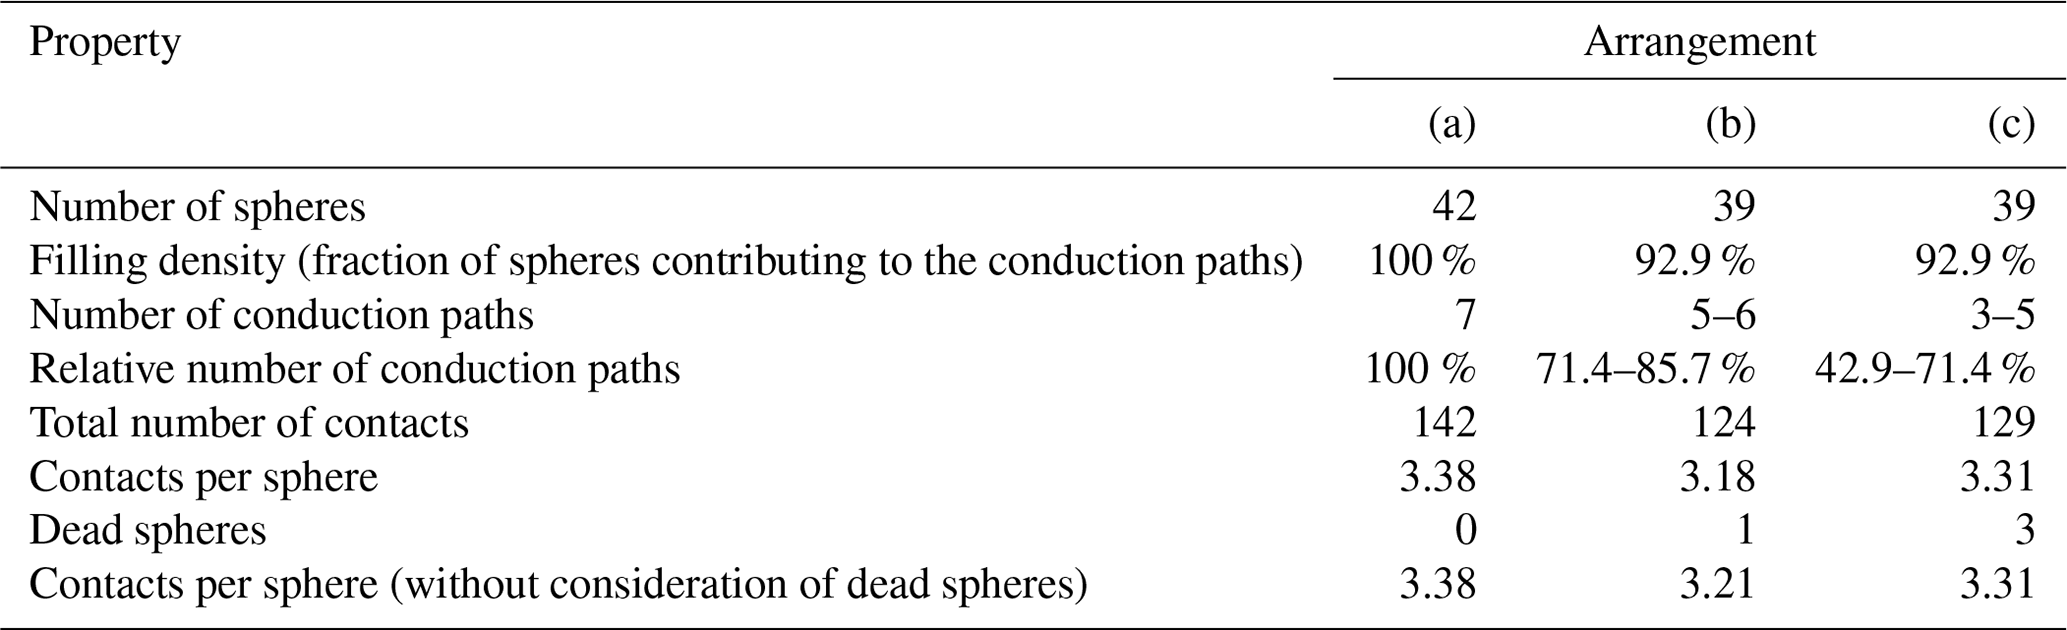
The properties of the states (a)–(c) in Fig. 8 are summarized in Table 3. The conduction path describes the shortest path of the electric current that can flow between the electrodes (or vice versa). For the arrangements shown, this means that this current path can lead over a maximum of seven balls. The dead spheres mentioned in Table 3 are grains of sand which do not contribute to the conduction current as they sit on the edge of the sand mass and have no contact with the electrodes.
Table 3Properties of the three filling states shown in Fig. 8.
The literature describes a number of effective media models for multi-component systems. Examples are the Maxwell–Garnett model (Robinson and Friedman, 2003), the Bruggeman model (Pandey and Kumar, 2013), the Rayleigh mixing formula (Sihvola and Kong, 1988), and special cases derived from them. The effective permittivity or conductivity of a mixture is determined with their help as a function of compositional properties, such as the number of different components, material behavior of the respective components, geometric shape of the components, or the packing density (Sihvola and Kong, 1988). It is also possible to specify upper and lower limits, the so-called Hashin–Shtrikman limits, within which the effective material properties must lie (Sahimi, 2003). However, the aim of this work is to explore possibilities for process monitoring, for which effective material properties are less relevant. The simple qualitative reasoning visualized by Fig. 8 therefore suffices to explain why the measured data scatter more when the measuring cell is emptied, refilled, and remeasured than when it is only filled and measured once.
From the dimensions of the measuring cell (electrode spacing d, electrode area A), one can determine the empty capacitance C0. The effective complex relative permittivity can then be extracted from the impedance of the measuring cell filled with MUT according to Kremer and Schönhals (2003) by
This results in the following real or imaginary part:
In Eqs. (1) and (2), ω is the angular frequency, σ is the electrical conductivity, and ε0 is the permittivity of vacuum. In the following, the mean data of measurements with a single cell filling are used for the discussion of the model visualized in Fig. 8. This is justified because it is clear from Table 2 that the empirical variance of the data measured with a single cell filling is small. The data obtained for MUT 1 and 2 in this way are plotted in Fig. 9.
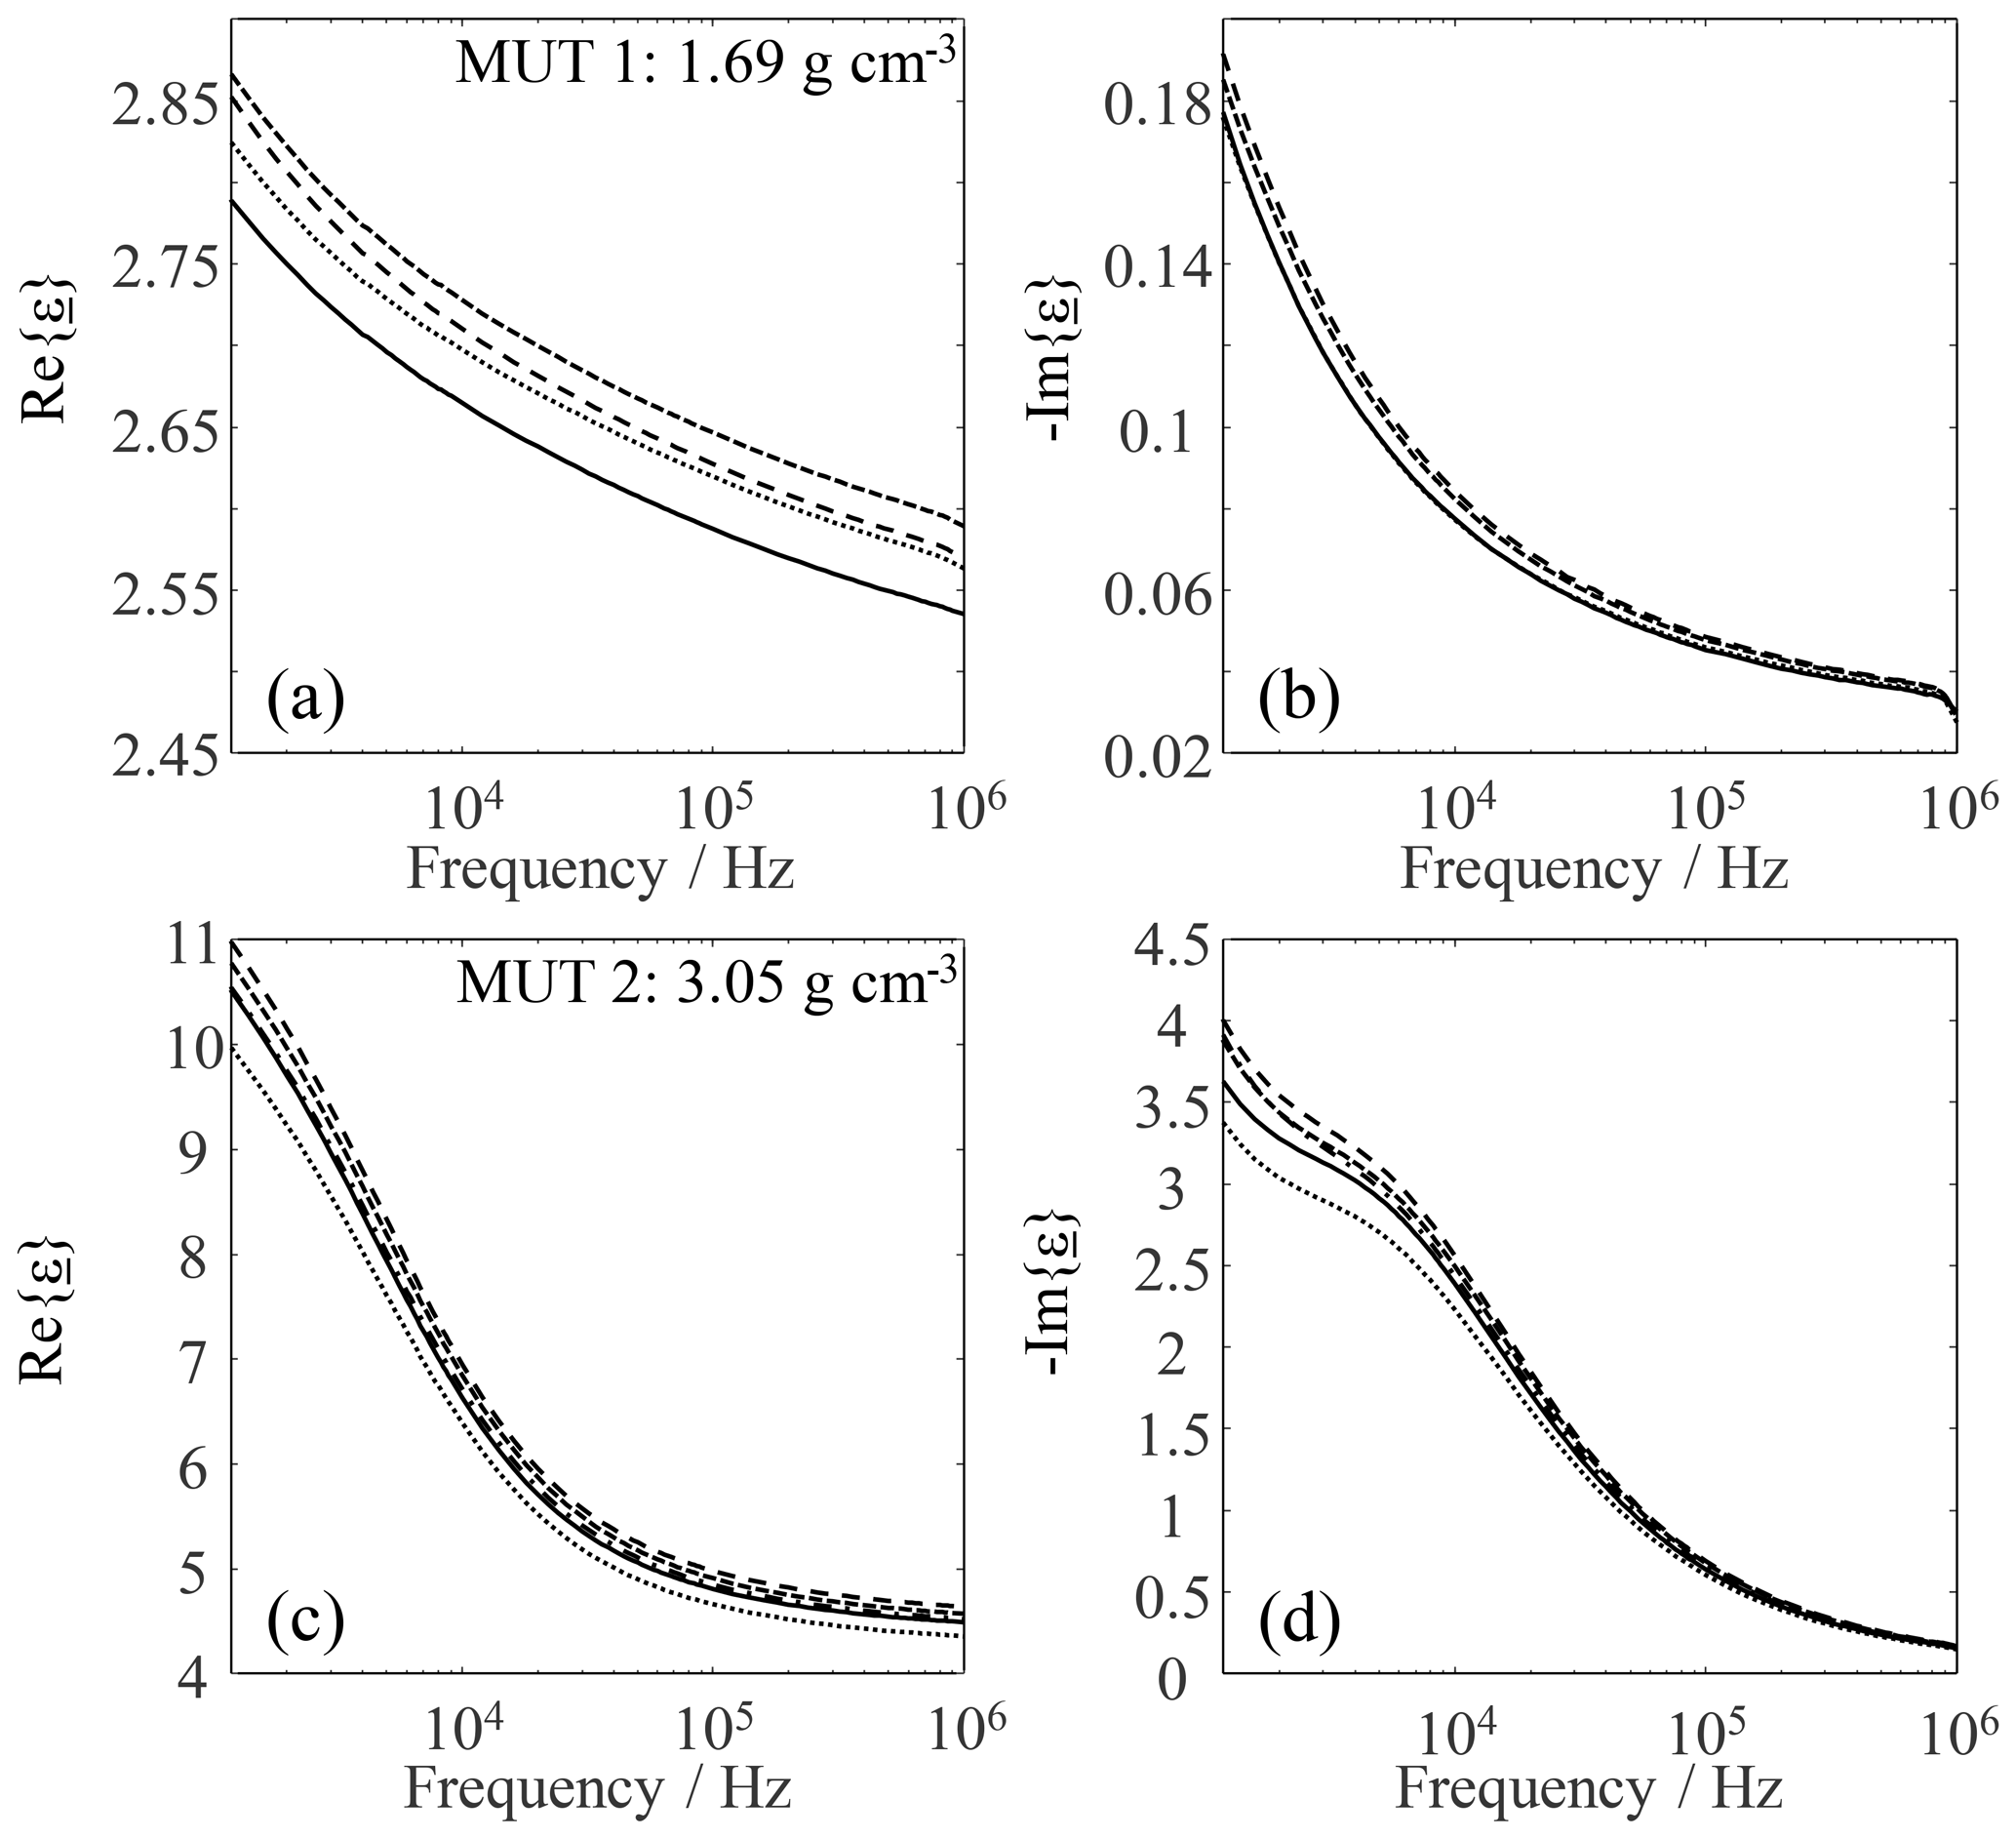
Figure 9Respective complex permittivity of MUT 1 (a, b) and 2 (c, d) for a given cell filling. Each curve is the average of 20 individual measurements.
The real and imaginary parts plotted in Fig. 9 support the model presented in Fig. 8: despite the same filling density of the measuring cell, both parts vary. The idea that the arrangement and orientation of the individual sand particles in the measuring cell space decisively influence the measurement result is confirmed by the variance of the measurement data. That the variance visible in Fig. 9 was not generated by scatter produced by the LCR meter follows from Fig. 5 and the associated conclusion that the measurement uncertainty of the LCR meter is negligible with respect to errors introduced by emptying and refilling the measuring cell. Since 10 different filling densities of the measuring cell were set in MUT 1a, a similar investigation to MUT 1a is omitted. It can be assumed that comparable results would be obtained for MUT 1a because it is a modified (thermally treated) form of MUT 1. Especially the real part of the complex permittivity of MUT 1 and 2 tended to increase with increasing filling density.
When bentonite is added, a three-component system is formed. Due to its large specific surface in comparison to quartz sand area (300–500 m2 g−1 in Gremming, 2003, and 0.01–0.016 m2 g−1 in Winterhalter et al., 1992), and due to the addition of, among other things, mobile Na cations, the bentonite contributes to the fact that the impedance data of the system differ significantly from those of the pure substances. The bentonite particles, which are also fine, can be deposited in cavities, thus shortening some conduction paths and opening up new conduction paths. Shortening conductive paths and opening up new ones leads to increasing conductivity. To support this model assumption with our measured data, the permittivities values obtained for MUT 3a–3e are shown in Fig. 10.
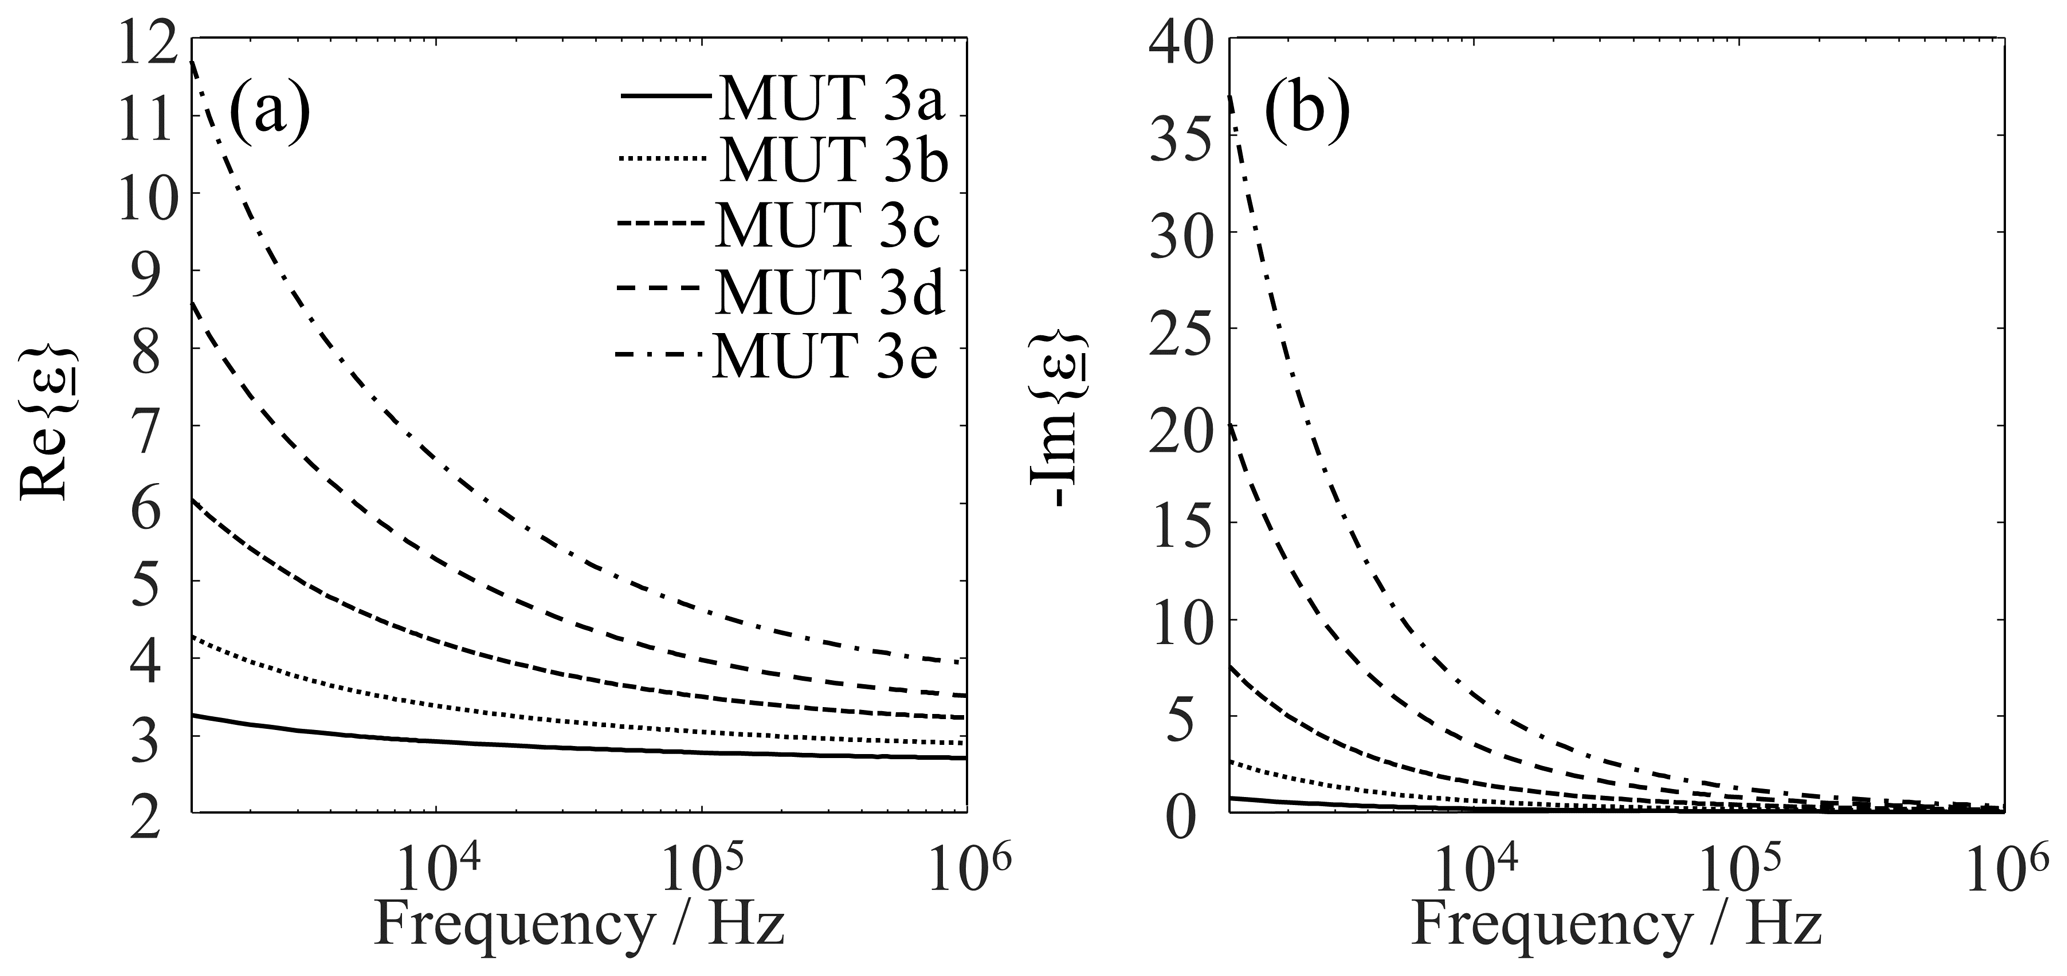
Figure 10Complex permittivity of MUT 3a–e. (a) Real part. (b) Imaginary part. Each curve is the average of 20 individual measurements.
Both the real and the imaginary part increase in magnitude with increasing bentonite content. The real part increase can be explained, among other things, by the increasing filling density (from 1.69 to 1.82 g cm−3) and again corroborates the notion that the filling or packing density affects the effective permittivity. The behavior of the imaginary part can be attributed to an increase in electrical conductivity (cf. Eq. 2). The fine bentonite particles can settle into voids between quartz sand grains, which increases the number of conductive paths and also shortens the effective length of these paths. Changes in material composition might be partially responsible for electrical conductivity increases, but this has not been thoroughly investigated and will be studied in the future. Anyway, our current work did not aim at an extraction of the electrical conductivity, which is why a qualitative check of the filling states shown in Fig. 8 on the basis of the effective complex permittivity will suffice here.
Our study of sand and sand–binder mixtures clearly demonstrates that it is possible to classify the materials based on impedance measurements. The transfer of these results to a measurement system usable for the in-process condition monitoring within sand regenerators in foundries appears highly desirable.
It has been shown that the measurement results were reproducible. This was true both for the case that the measuring cell was filled with sand once and then measured several times in succession and for the repeated filling and measurement with the same type of sand. In all cases, the errors in the measured real and imaginary parts were almost uncorrelated. The data scatter increased when the measuring cell was filled, emptied, and refilled repeatedly. This could be explained by qualitative reasoning and quantified by experimental investigations.
The Nyquist curves obtained with the various types and compositions of sand appear to be characteristic of each material, which suggests that extraction of certain curve features enables classification of the molding material. Machine learning methods, such as support vector machines, can enhance the usefulness of impedance spectroscopy for process monitoring in the field if suitable databases are available.
The impedimetric analysis of other foundry-specific molding materials, the possibility of extracting impedance features, and their use and application for molding material classification using machine learning methods are part of further research work.
A code listing describing the programs is included in the Supplement. The data are stored in an archive and are publicly available under the following DOI: https://doi.org/10.15495/DO_UBT_1734 (Bifano et al., 2021). If you wish to receive more information about this article, please send your request to the following e-mail address: mrt@uni-bayreuth.de.
The supplement related to this article is available online at: https://doi.org/10.5194/jsss-10-43-2021-supplement.
LB researched the background information, carried out the investigation and wrote the original draft. The methodology was implemented by LB, AF and GF. The project administration was conducted by AF. AF and AL were responsible for funding acquisition. The experimental resources were procured by AL. Supervision, writing review and editing were the responsibility of GF.
The authors declare that they have no conflict of interest.
This article is part of the special issue “Sensors and Measurement Science International SMSI 2020”. It is a result of the Sensor and Measurement Science International, Nuremberg, Germany, 22–25 June 2020.
This research has been supported by the German Federal Ministry for Economic Affairs and Energy (grant nos. ZF4152305DB8 and ZF4556201DB8).
This open-access publication was funded
by the University of Bayreuth.
This paper was edited by Marco Jose da Silva and reviewed by two anonymous referees.
Belyaeva, T. A., Bobrov, P. P., Kroshka, E. S., Lapina, A. S., and Rodionova, O. V.: The effect of very low water content on the complex dielectric permittivity of clays, sand-clay and sand rocks, Meas. Sci. Technol., 28, 014005 , https://doi.org/10.1088/1361-6501/28/1/014005, 2017.
Bifano, L., Fischerauer, A., and Fischerauer, G.: Investigation of complex permittivity spectra of foundry sands, Technisches Messen, 87, 372–380, https://doi.org/10.1515/teme-2019-0121, 2020.
Bifano, L., Fischerauer, A., Liedtke, A., and Fischerauer, G.: MUT 1-3 / Characterization of Sand and Sand-Binder Systems from the Foundry Industry with Electrical Impedance Spectroscopy, Universität Bayreuth, https://doi.org/10.15495/DO_UBT_1734, 2021.
Dambrowski, J.: Validation of impedance-data and of impedance-based modeling approach of electrochemical cells by means of mathematical system theory, in: Proceedings of the 39th Annual Conference of the IEEE Industrial Electronics Society, Vienna, Austria, 10–13 November 2013, 1–7, 2013.
Denes, M.: Umwelterklärung 2018: Daimler AG Standort Mannheim (Environmental Certificate: Daimler AG Mannheim plant, Daimler, Mannheim, 60 pp., 2018 (in German).
Götze, J. and Göbbels, M.: Einführung in die Angewandte Mineralogie (Introduction to Applied Mineralogy, Springer, Berlin, Germany, 2017 (in German).
Gremming, H.: Prozesssicherheit in der Formstoffaufbereitung mit Hilfe der Fuzzy-Logik (Process security in processing of moulding mateial), PhD thesis, TU Bergakademie Freiberg, Freiberg, Germany, 107 pp., 2003 (in German).
Hald, A.: Statistical theory with engineering applications, John Wiley and Sons, London, UK, 1952.
Kaden, H., Königer, F., Stromme, M., Niklasson, G. A., and Emmerich, K.: Low-frequency dielectric properties of three bentonites at different absorbed water states, J. Colloid Interface Sci., 411, 16–26, https://doi.org/10.1016/j.jcis.2013.08.025, 2013.
Kirichek, A., Chassagne, A., and Ghose, R.: Dielectric spectroscopy of granular material in an electrolyte solution of any ionic strength, Colloid. Surface. A, 533, 356–370, https://doi.org/10.1016/j.colsurfa.2017.07.040, 2017.
Kremer, F. and Schönhals, A.: Broadband Dielectric Spectroscopy, Springer, New York, USA, 2003.
UNEP: Sand and sustainability: Finding new solutions for environmental governance of global sand resources, GRID-Geneva, United Nations Environment Programme, Geneva, Switzerland, 56 pp., 2019.
Okrusch, M. and Matthes, S.: Mineralogie (Mineralogy), Springer, Heidelberg, Germany, 2005 (in German).
Pandey, G. and Kumar, R.: Real time detection of soil moisture and nitrates using on-board in-situ impedance spectroscopy, in: Proceedings of the 2013 IEEE International Conference on Systems, Man and Cybernetics, Manchester, UK, 13–16 October 2013, 1081–1086, https://doi.org/10.1109/SMC.2013.188, 2013.
Paradowski, L. R.: Uncertainty Ellipses and Their Application to Interval Estimation of Emitter Position, IEEE T. Aero. Elec. Sys., 33, 126–133, https://doi.org/10.1109/7.570715, 1997.
Peduzzi, P.: Sand, rarer than one thinks, UN Environment Program Global Environmental Alert Service (GEAS), available at: http://hdl.handle.net/20.500.11822/8665 (last access: 23 February 2021), 2014.
Robinson, D. A. and Friedman, S. P.: A method for measuring the solid particle permittivity or electrical conductivity of rocks, sediments, and granular materials, J. Geophys. Res., 108, 2076, https://doi.org/10.1029/2001JB000691, Feb. 2003.
Routschka, G. and Wuthnow, H.: Taschenbuch Feuerfeste Werkstoffe (Manual for refractory materials), Vulkan, Essen, Germany, 2007 (in German).
Sahimi, M.: Heterogeneous Materials I, Springer, New York, USA, 2003.
Schönleber, M. and Klotz, D.: A method for improving the robustness of linear Kramer-Kronig validity tests, Electrochim. Ac., 131, 20–27, https://doi.org/10.1016/j.electacta.2014.01.034, 2014.
Sihvola, A. H. and Kong, J. A.: Effective permittivity of dielectric mixtures, IEEE T. Geosci. Remote, 26, 420–429, 1988.
Tilch, W., Polzin, H., and Franke, M.: Praxishandbuch bentonitgebundener Formstoff (Practical manual for bentonite-bound molding material), Schiele and Schön, Berlin, Germany, 2019 (in German).
Winterhalter, J., Toussaint, D., Mauersberger, G., and Bars, P.: Vermeidung von Abfällen durch abfallarme Produktionsverfahren – Gießereialtsand aus Eisen-, Stahl- und Tempergießereien (Prevention of waste by low-waste production processes – used foundry sand from iron, steel, and malleable foundries), Frauenhofer-Publica, Karlsruhe, Germany, 1992 (in German).
- Abstract
- Background
- Basic characteristics of the examined materials
- Measurement setup
- Measurement results
- Interpretation of the measurement results
- Conclusion
- Code and data availability
- Author contributions
- Competing interests
- Special issue statement
- Financial support
- Review statement
- References
- Supplement