the Creative Commons Attribution 4.0 License.
the Creative Commons Attribution 4.0 License.
 | 13 Jun 2022
Precision measurement of the application-dependent current consumption of a wireless transceiver chip in the time and frequency domain
Thomas Robert Doebbert
Christoph Cammin
Gerd Scholl
Modern production concepts generate a demand for reliable, energy-efficient, fast, and secure wireless communication solutions. Therefore, the current consumption should not increase substantially due to additional cryptographic operations. This paper shows a principle current measurement method that is exemplary of a transceiver for the IO-Link Wireless protocol. Low-pass filtering and single-sided amplitude spectrum analysis are used to evaluate the main information of the current measurement. An uncertainty estimation is realized using statistical measurement data and considering the measurement setup in order to approximate the combined standard uncertainty. The results show that the current consumption only increases slightly when using additional cryptographic operations. This can be measured with acceptable uncertainty.
- Article
(559 KB) - Full-text XML
- BibTeX
- EndNote


Reliable and secure radio-based communication systems are an important component for the enhancement of modern production concepts like Industry 4.0 and wireless communication networks. Even though 5G is currently being marketed as a universal solution, the high density of sensor and actuator nodes in industrial manufacturing environments in connection with the requirements with respect to latency times and reliability still represents an enormous technical challenge (Doebbert et al., 2021c). Thus, different energy- and cost-effective standards could arise in the various domains of wireless automation.
An essential requirement, especially in an industrial production environment, is to guarantee fixed cycle times, even for secured transmissions, where cryptographic operations influence the power consumption and the timing of the data transmission of wireless transmission protocols. Due to typical timing demands in the order of 1 ms and the low power requirements of hardware modules, these investigations represent a demanding measurement task, as broadband measurements need to be realized with a high amplitude resolution. In this paper, the current consumption of the data transfer in plaintext and in ciphertext using a PHYTEC module based on a CC2650 system-on-chip (SoC) radio transceiver chip (PHYTEC, 2018) is investigated. The IO-Link Wireless protocol is used, as it directly addresses the special requirements in the field of production automation in terms of latency, reliability, and the number of sensors (Heynicke et al., 2018).
This paper is structured as follows: Sect. 2 provides a detailed description of IO-Link Wireless (IOLW); in Sect. 3, the principle measurement method is presented; Sect. 4 depicts the measurement setup, including the equipment utilized and its characteristics as well as the low-pass filtering and the single-sided amplitude spectrum method used to evaluate the signal information (Sect. 4.1); in Sect. 5, an abbreviated uncertainty estimation is presented; and the paper ends with a conclusion in Sect. 6.
IO-Link Wireless (IOLW) is a manufacturer-independent standard that was initially introduced in 2018 and addresses the particular requirements of wireless factory automation (IO-Link Community, 2018, 2021). With some further developments, IOLW is currently in the standardization process, as outlined in IEC Commitee Draft (65). Comprehensive descriptions of IOLW are available in publications such as Heynicke et al. (2018) and Rentschler et al. (2018). For completeness, some key features are shown here as well.
IOLW is a compatible extension to the established wired IO-Link protocol. It operates in the 2.4 GHz ISM (industrial, scientific, and medical) band. This offers license-free and, thus, very cost-effective operation; however, as a drawback, wireless coexistence might be an issue (Cammin et al., 2016; Krush et al., 2021). The physical layer is based on Bluetooth Low Energy (BLE) v4.2. Thus, Gaussian frequency-shift keying (GFSK) is used as the modulation scheme at a 1 Mbit s−1 on-air bit rate. However, the timing and media access have been significantly modified. A combined frequency/time division multiple access (F/TDMA) scheme is utilized as follows: up to eight W-Devices (i.e., sensors or actuators) are organized via TDMA to a single (frequency) track. A W-Master (i.e., a wireless base station) can have one to five tracks, which operate using FDMA. Overall, a star-shaped topology is utilized. IOLW specifies single-slot (SSlot) and double-slot (DSlot) W-Devices. The former devices offer 2 (1) octets (octet) for payload and are intended for simple sensors or actuators, like switches, whereas DSlot W-Devices offer 15 (14) octets for payload and are thus capable of smart sensor applications (the values in parentheses include the obligatory protocol control octet). The media access (MAC) scheme is shown in Fig. 1. DL denotes the downlink from the W-Master towards the W-Devices, and UL denotes the uplink in the opposite direction. In Fig. 1, four (DSlot) W-Devices are indicated, and the given numbers for the time slots correspond to the IOLW standard.

Figure 1Sketch of the physical layer and media access of IOLW according to IO-Link Community (2018), Heynicke et al. (2018), and Cammin et al. (2018). DL denotes the downlink from the W-Master towards the W-Devices, and UL denotes the uplink in the opposite direction.
Up to 78 frequency channels with a channel spacing of 1 MHz are specified for cyclic-data communication. Frequency hopping is implemented to mitigate fading effects and to increase the coexistence behavior. If a wireless packet is lost on air, it will automatically be repeated for a configurable number of retries. The repetition is performed on a different frequency, which is outside of the typical coherence bandwidth Bc of radio channels in factory environments, as indicated in publications such as Cammin et al. (2018). Furthermore, the (sub)cycle duration is (well) below the typical coherence time Tc. By combining the two, any possible repeats can be considered independent, ensuring very robust communication. The minimum possible wireless communication cycle time is 5 ms, which can also be seen in Fig. 1. This latency is ensured with a residual error probability of less than 10−9, according to publications such as Rentschler et al. (2018). However, IOLW also offers potentials for additions, such as wireless safety and security (Doebbert et al., 2021b, a). Therefore, a principle current measurement method to prove the feasibility of using cryptographic operations is needed and is presented in the following.
Figure 2 shows the principle approach of the measurement for the application- and time-dependent current. Preliminaries for the principle measurement approach are, among other things, the option to add an external shunt circuit to the power probe to approximate the measurement range. Furthermore, a constant-voltage source is needed as well as a precision ohmmeter (or multimeter) to measure the final external shunt with its connectors.
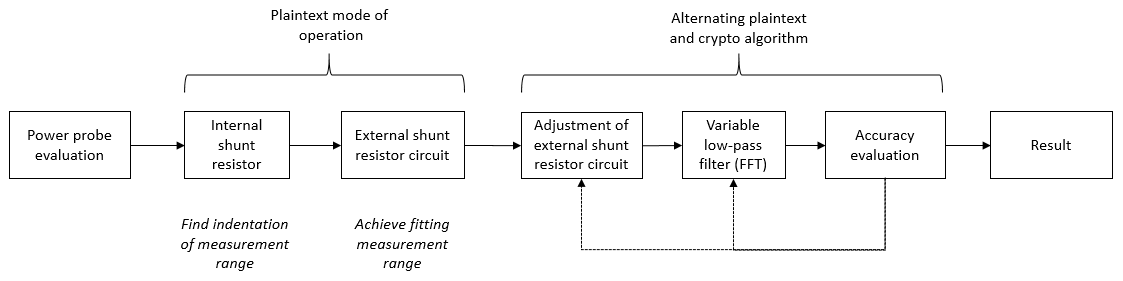
Figure 2Principle measurement approach presenting the chronological sequence of the individual steps.
In the first step of the preparations, power probes are benchmarked depending on the measurement task; therefore, market research is performed, and data sheets are evaluated. The first measurement is then realized with the internal shunt resistor of the selected power probe to find an indentation of the measurement range using the transceiver in plaintext mode of operation. In the next step, an external shunt resistor circuit is selected to achieve a fitting measurement range for the plaintext mode of operation, as an external exchangeable shunt resistor achieves a better fitting measurement range using the full internal analog-to-digital converter (ADC) resolution of the measurement device. When enabling the W-Device to send alternating plaintext and encrypted messages, the external shunt resistor circuit is adjusted. This alternating mode is used for the measurement of the application-dependent current. In the following step, a variable low-pass filter using fast Fourier transform (FFT) is employed to eliminate noise and observe the frequency ranges in which the information of the current measurement signal is located. An accuracy evaluation consisting of a statistical evaluation is performed. If the result is considered to be accurate enough, the measurement is finished by an overall uncertainty estimation; if not, the external shunt resistor circuit and/or the variable low-pass filter is adjusted again. This paper mainly focuses on the last steps: the low-pass filtering, the accuracy evaluation, and the uncertainty estimation.
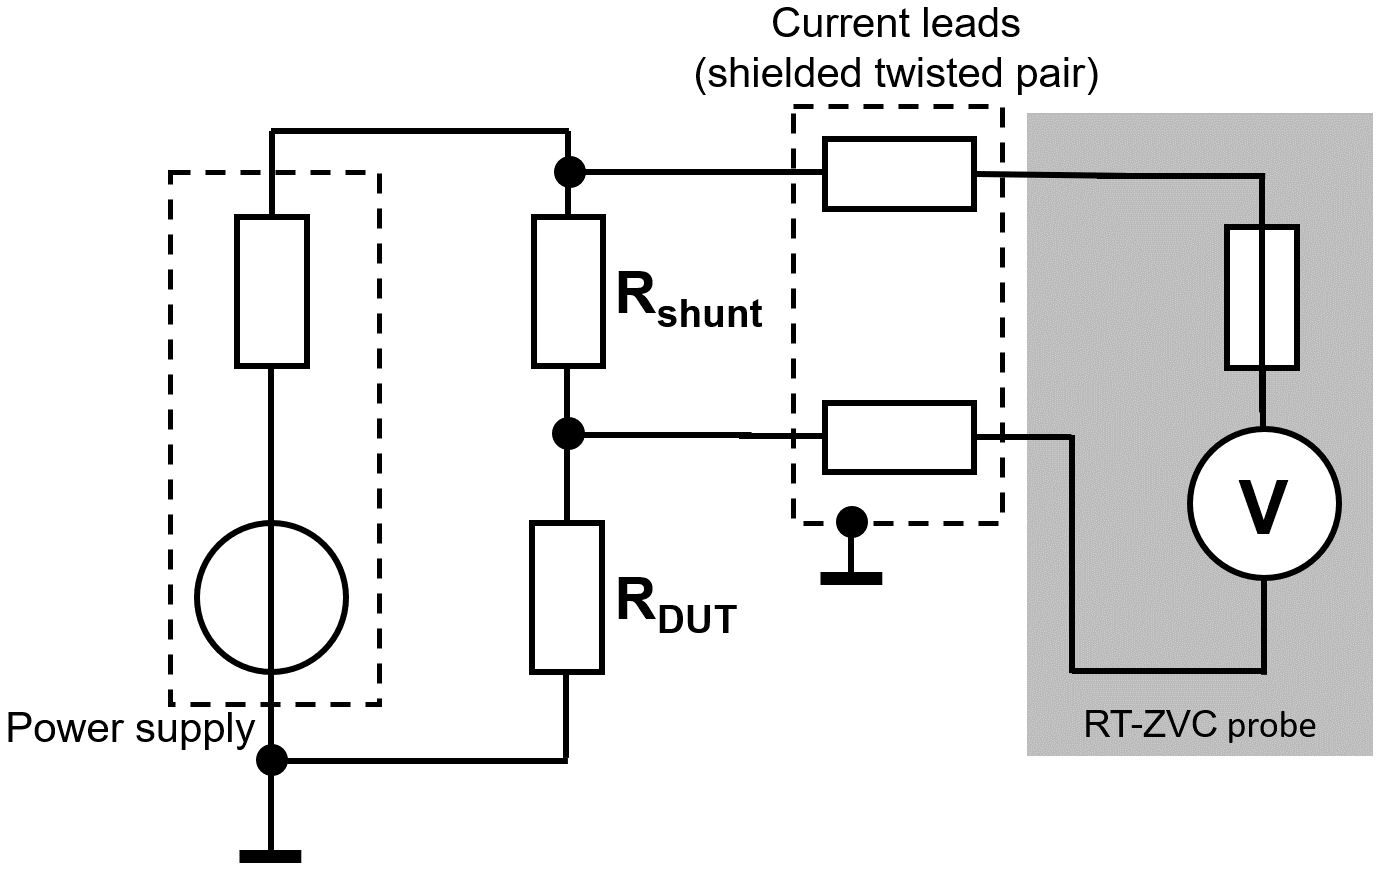
Current measurements via a shunt resistor are very common (e.g., Ziegler et al., 2009; Sanoh et al., 2014). This approach is also utilized here, as described in the following. A measurement setup with an external shunt is used (Doebbert et al., 2021b), as shown in Fig. 3, in order to achieve a more appropriate (and accurate) measurement range compared with the setup with an internal shunt. A RT-ZVC power probe (Rohde & Schwarz, 2018) is used to measure the current consumption. As the device under test (DUT), a PHYTEC module based on a CC2650 SoC radio transceiver is used (PHYTEC, 2018). The external debugger connected to the DUT is not depicted here. A constant-voltage source (Rohde & Schwarz, 2022) provides a stable voltage supply for the DUT.
4.1 Measurement assessment
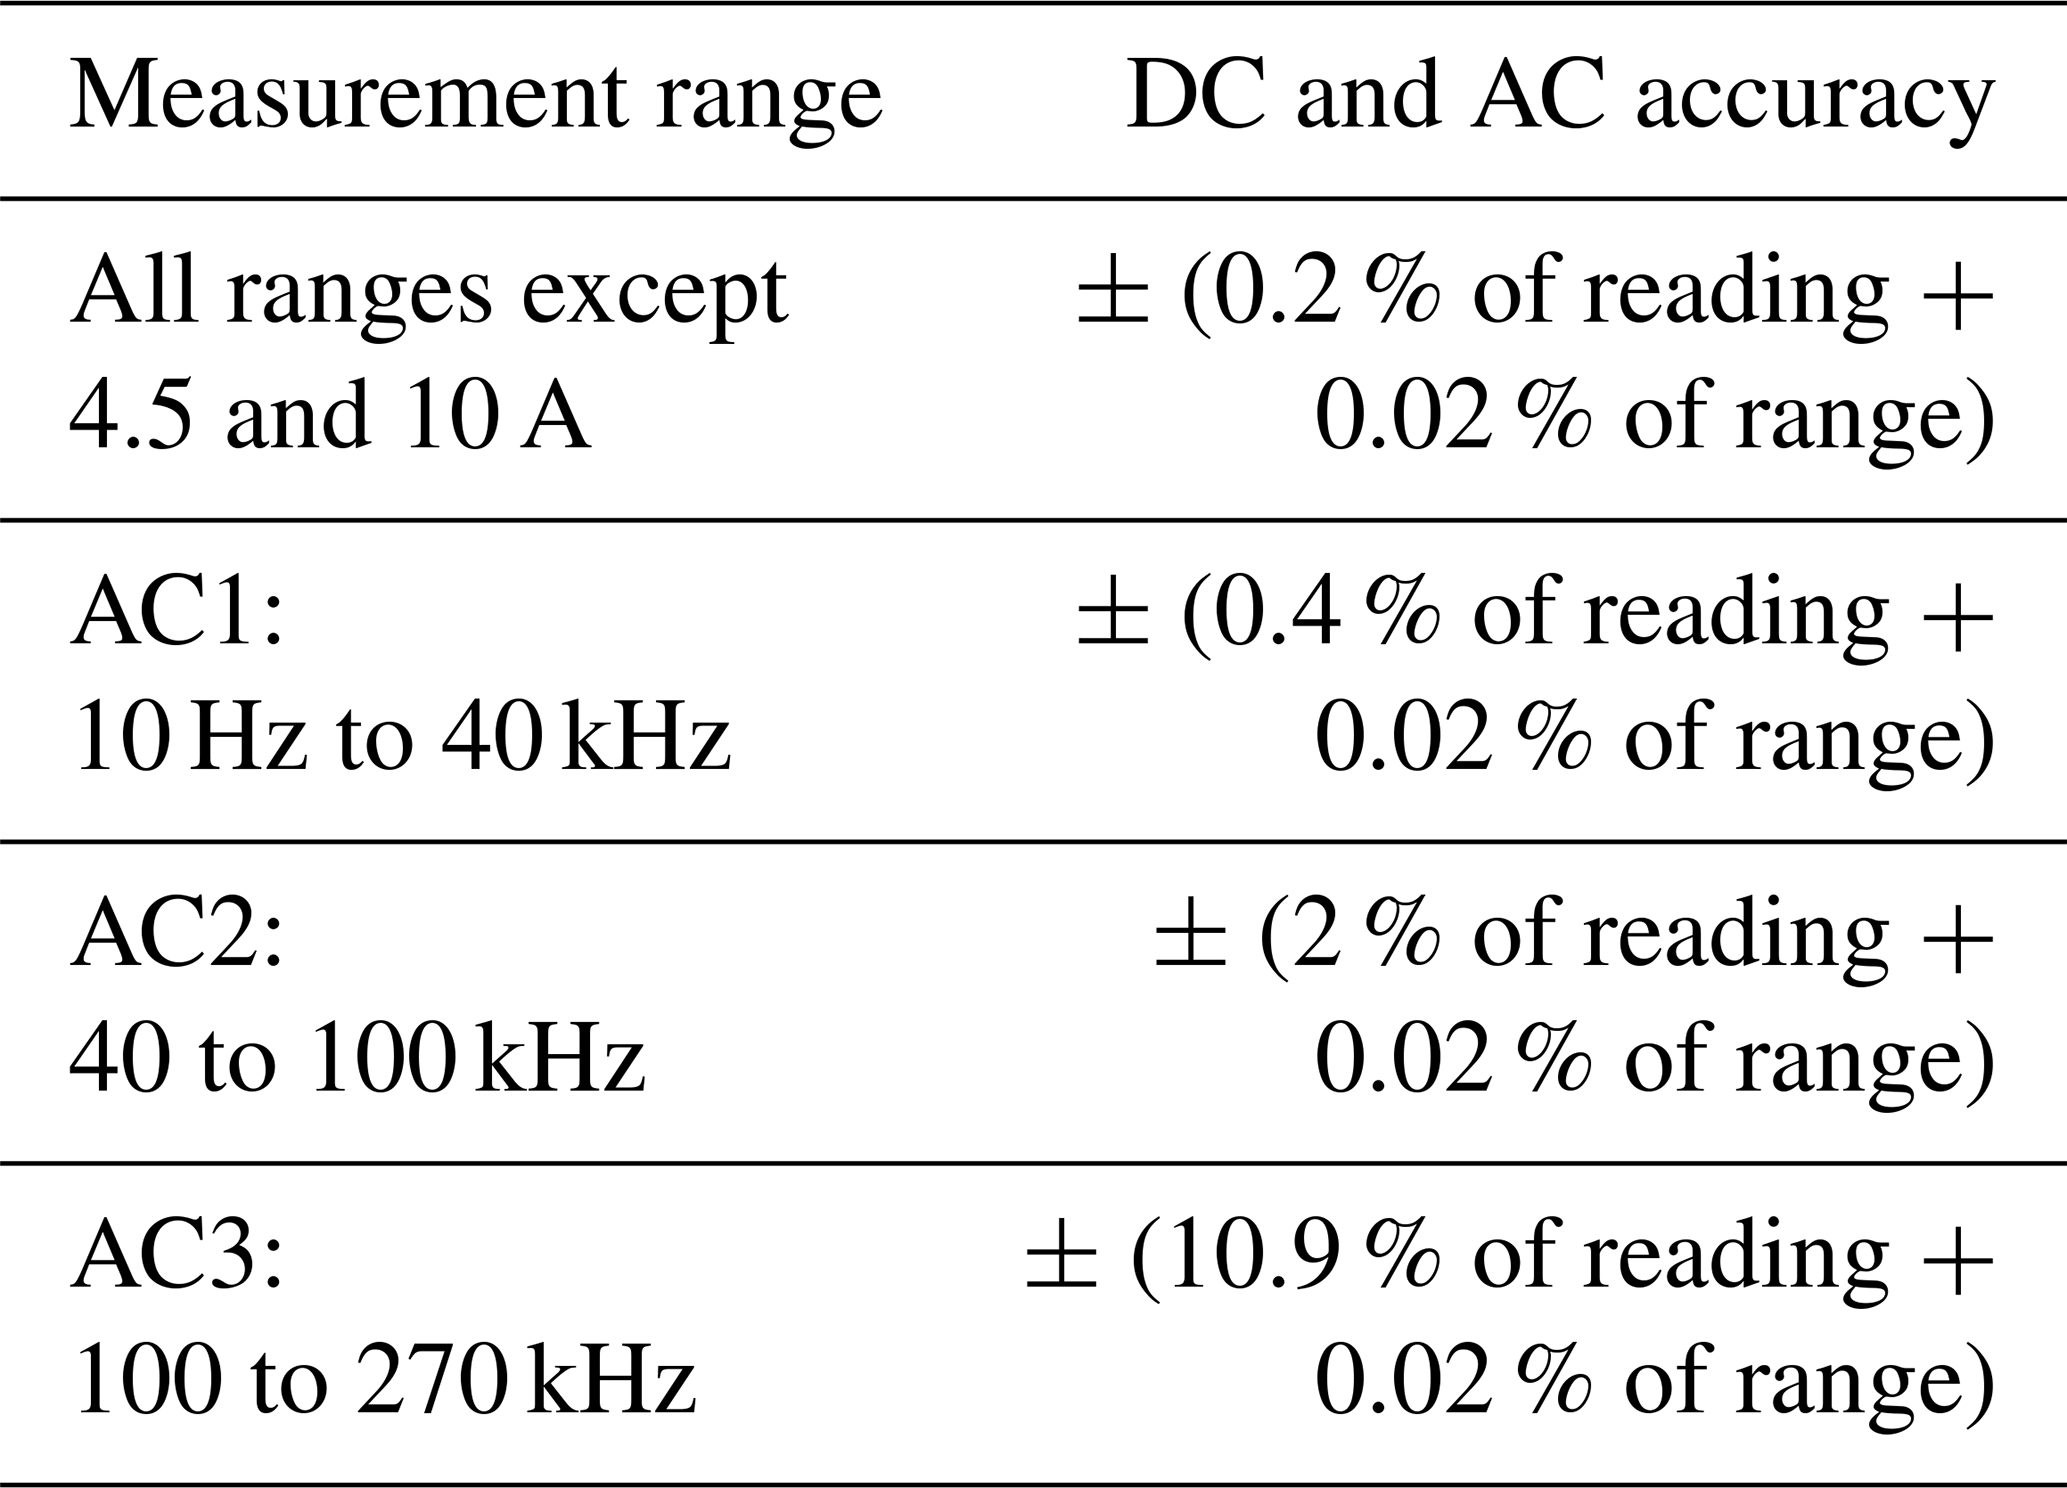
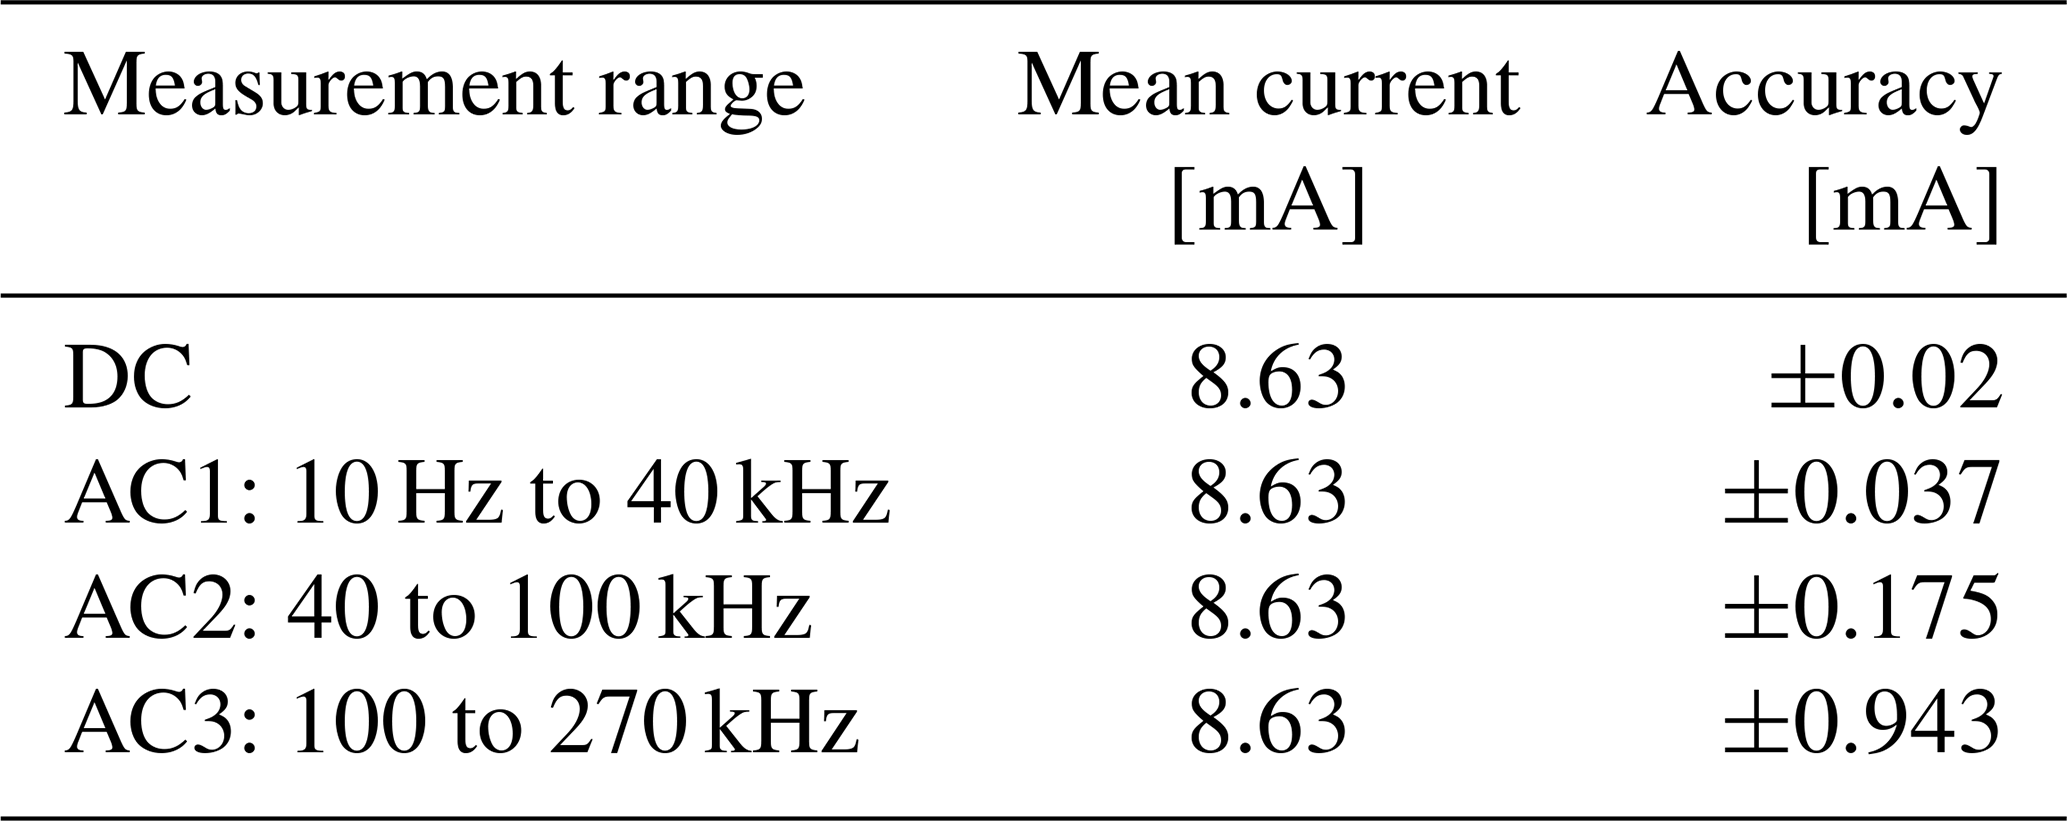
For each measurement series, 445 datasets consisting of 50 000 respective samples (at 5×10⁶ samples s−1) are recorded within a period of 10 ms, which results in a total of 2.225×10⁹ samples. The period of 10 ms corresponds to two IOLW cycles or six IOLW subcycles in total (i.e., six DL and UL messages). The appropriate measurement range of 13.81 mA was chosen by selecting a shunt resistor measured with a precision multimeter (Keysight, 2021) with a value of 3.259Ω. Note that the current measurement range corresponds to the internal measurement range of 45 mV in the RT-ZVC power probe. The accuracy of the current measurement can be approximated by selecting the appropriate type of current (direct current, DC, or alternating current, AC) according to the data sheet of the power probe. Table 1 depicts the measurement range of the DC and AC signals of the power probe. Theoretically, the 18 bit ADC resolves 105.3 nA steps over an input range of 13.81 mA. Practically, the accuracy is usually not limited by the internal ADC resolution but rather by other effects, as described in the following.
Table 1DC and AC characteristics of the R&S RT-ZVCxx (Rohde & Schwarz, 2018, p. 5).
4.1.1 Low-pass filtering
In this section, a comparison of different low-pass filtering is performed in order to determine a suitable frequency-related accuracy range of the measurement device. The current measurement without additional low-pass filtering, in the following referred to as “unfiltered current measurement”, is compared with low-pass-filtered signals with cutoff frequencies of 100, 40, and 5 kHz. These cutoff frequencies correspond to the characteristic measurement ranges referred to in Table 1 with the addition of a cutoff frequency of 5 kHz resulting from the iterated process described in Fig. 3.
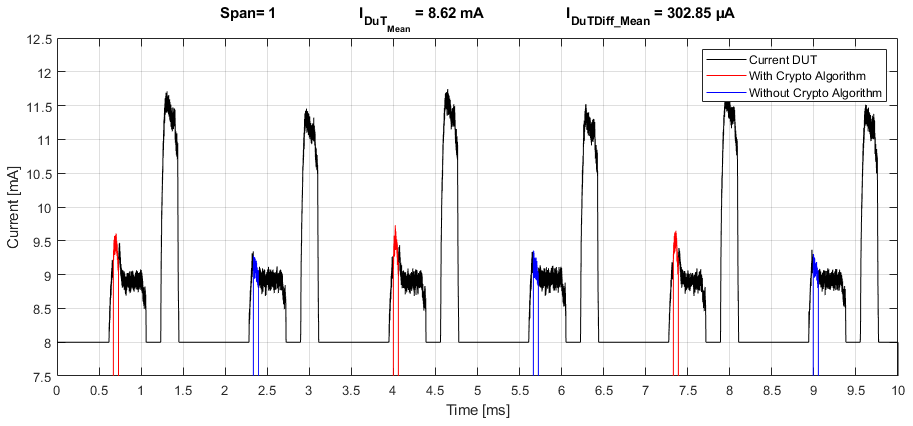
Figure 4 shows one example measurement series of an Advanced Encryption Standard (AES) Electronic Codebook (ECB) encryption of 16 B using the on-chip hardware accelerator without any filtering. The current of the DUT is presented (Fig. 4, in black) over a time of 10 ms with six subcycles. The mean current value of the example measurement is 8.62 mA. The lower current ripple is always the downlink message, and the higher current ripple is the uplink to the W-Master. The red mark in Fig. 4 shows when a crypto algorithm is performed, and the blue mark shows when the signal is transferred using plaintext. Using MATLAB, the same time interval in the next uplink is evaluated and marked in blue without the crypto algorithm. IDuT_Diff_Mean_ifft represents the mean current difference of the measurement signal of the red (with cryptographic operation) and blue (without cryptographic operation) current consumption. In the following, it is referred to as the “mean current crypto difference”.
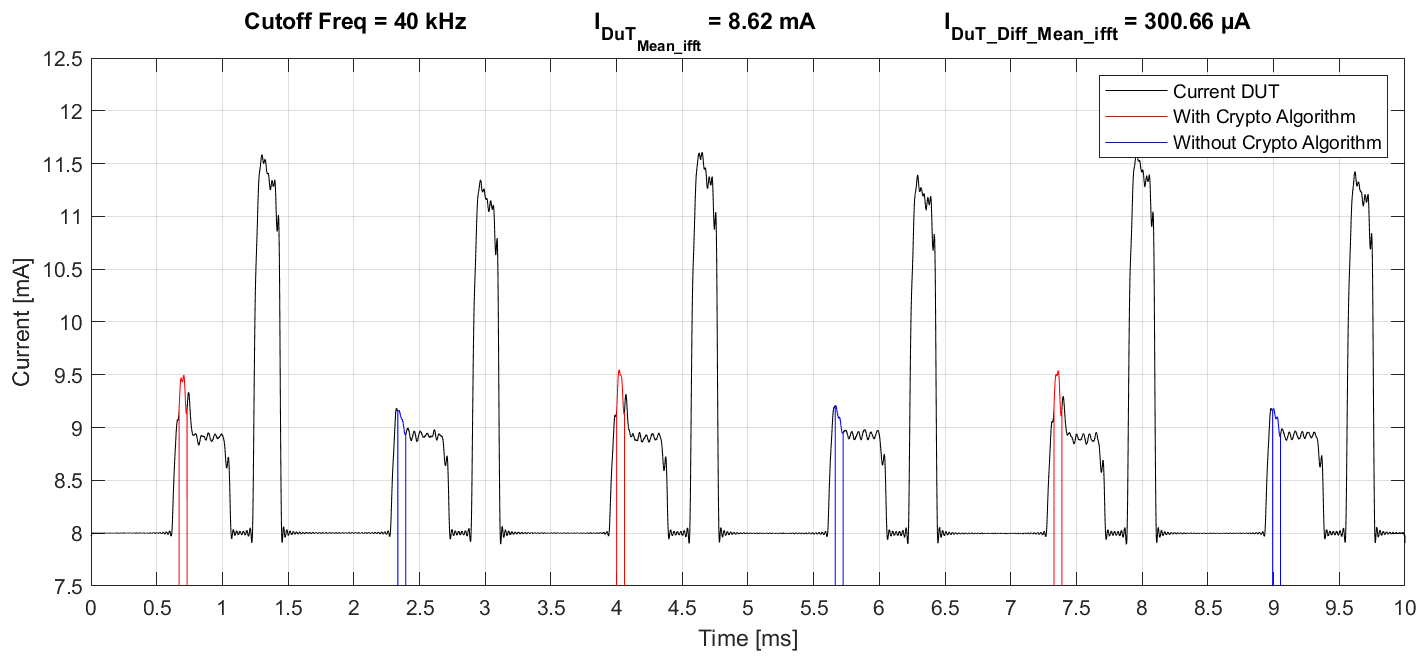
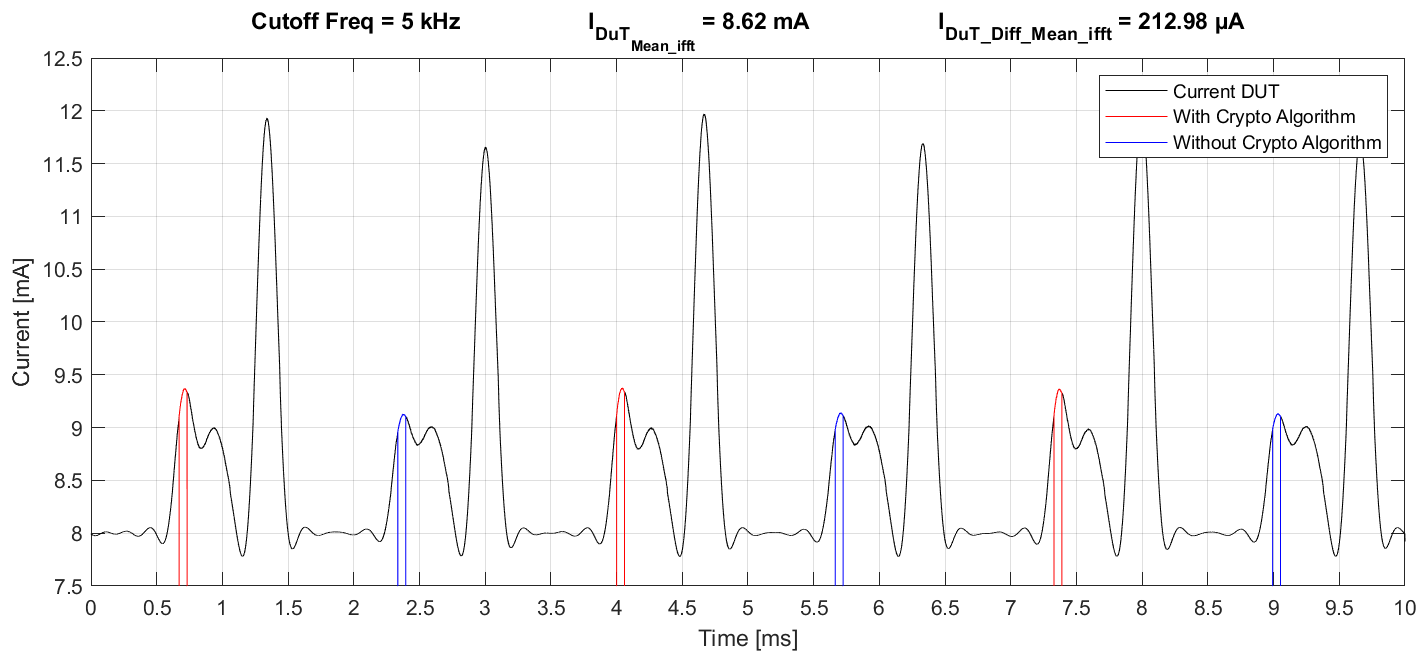
The measurement is performed for cutoff frequencies of 100 kHz (Fig. 5), 40 kHz (Fig. 6), and 5 kHz (Fig. 7). Here, a variable low-pass filter using FFT was employed to eliminate noise and to observe the frequency ranges in which the information of the signal is located.
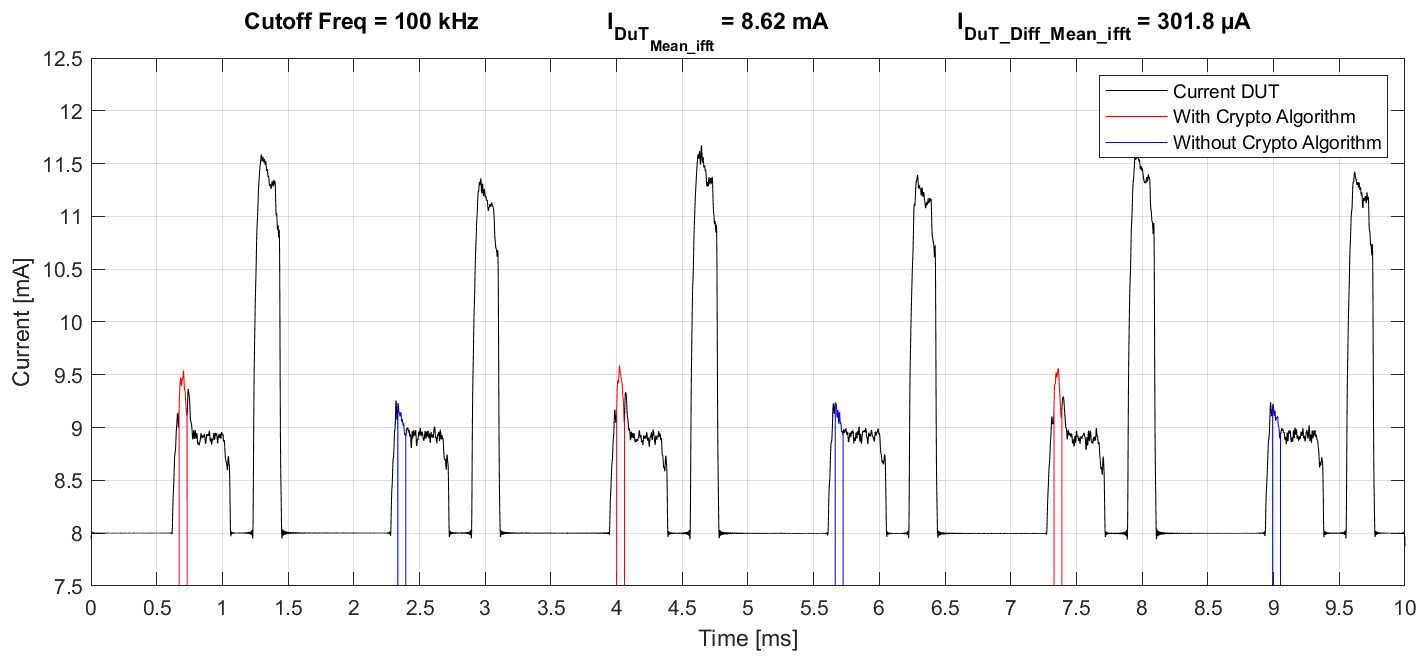
If the unfiltered current measurement is compared to the signal with a cutoff frequency of 100 kHz, the mean current of the DUT is similar to the value of the unfiltered current measurement. Comparing the value of the mean current crypto difference (100 kHz) to the value of the unfiltered current measurement results in a difference of about 1 µA.
When low-pass filtering using a cutoff frequency of 40 kHz is applied, the mean current of the DUT is still similar to the mean current value of the unfiltered current measurement. The mean current crypto difference is about 301 µA, which corresponds to a difference of about 2 µA compared with the unfiltered current measurement.
When low-pass filtering at a cutoff frequency of 5 kHz is performed, the mean current of the DUT still remains at 8.62 mA, but the value of the mean current crypto difference is about 90 µA compared with the value of the unfiltered current measurement.
Table 2 shows the mean current crypto difference and its difference compared with the unfiltered current measurement. The difference at a cutoff frequency of 5 kHz is around 30 % compared with the unfiltered current measurement. This deviation is orders of magnitude above the accuracy specified for the AC1 range in Table 1. In addition, it is already optically recognizable that the current signal in Fig. 7 clearly deviates from the unfiltered current measurement with a substantial amount of information loss. Further research on the single-sided amplitude spectrum and a statistical evaluation shall define the suitable frequency-related accuracy range.
Table 2Mean current crypto difference compared with the value of the unfiltered current measurement.

4.1.2 Single-sided amplitude spectrum
The single-sided amplitude spectrum obtained using FFT is evaluated in the following. In Fig. 8, the full spectrum of the measured current without low-pass filtering is displayed. Figure 9 depicts the single-sided amplitude spectrum with a cutoff frequency of 100 kHz, which shows similar information to the original spectrum. Figure 10 represents the spectrum with a cutoff frequency of 40 kHz, showing most of the information content. The main information seems to be presented in the area up to about 30 kHz; therefore, Fig. 11 shows that the main information is cutoff, which might be necessary to represent the signal.
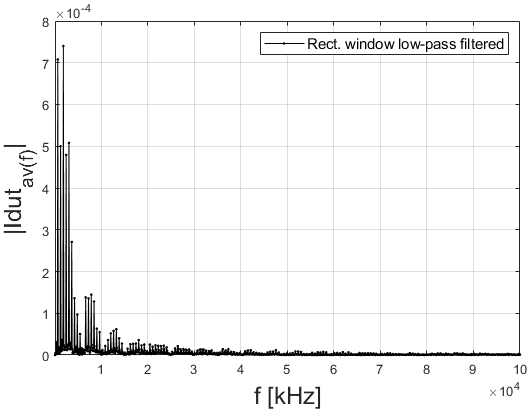
Figure 8Single-sided amplitude spectrum of the current measurement signal without additional low-pass filtering.

Figure 9Single-sided amplitude spectrum of the current measurement signal with low-pass filtering (cutoff 100 kHz).

Figure 10Single-sided amplitude spectrum of the current measurement signal with low-pass filtering (cutoff 40 kHz).

Figure 11Single-sided amplitude spectrum of the current measurement signal with low-pass filtering (cutoff 5 kHz).
4.1.3 Comparison of signals with different cutoff frequencies
Generally, the frequency components above 40 kHz can be neglected in this case, as the main information is in the area up to about 30 kHz. The accuracy in terms of the current can be calculated, for example, with AC1, with a range of 13.81 mA, a reading of 8.63 mA, and measurement accuracy of the power probe as given in Table 1.
For example, if using the AC1 range (10 Hz to 40 kHz) for a measurement of 8.63 mA, an accuracy of ±37.3 µA can be achieved according to the data sheet, as shown in Eq. (1):
Table 3 shows the DC and AC characteristics of the power probe applied to the measurement. As it is assumed that the main information is in the AC1 range, the corresponding accuracy will be considered in Sect. 5.2.2.
Table 3Applied DC and AC characteristics of the R&S RT-ZVCxx from the measurements.
4.2 Intermediate results
The mean values and experimental standard deviations were calculated for the mean current of the DUT and the current difference of the crypto compared with the plaintext mode, respectively. Table 4 shows the intermediate measurement results.
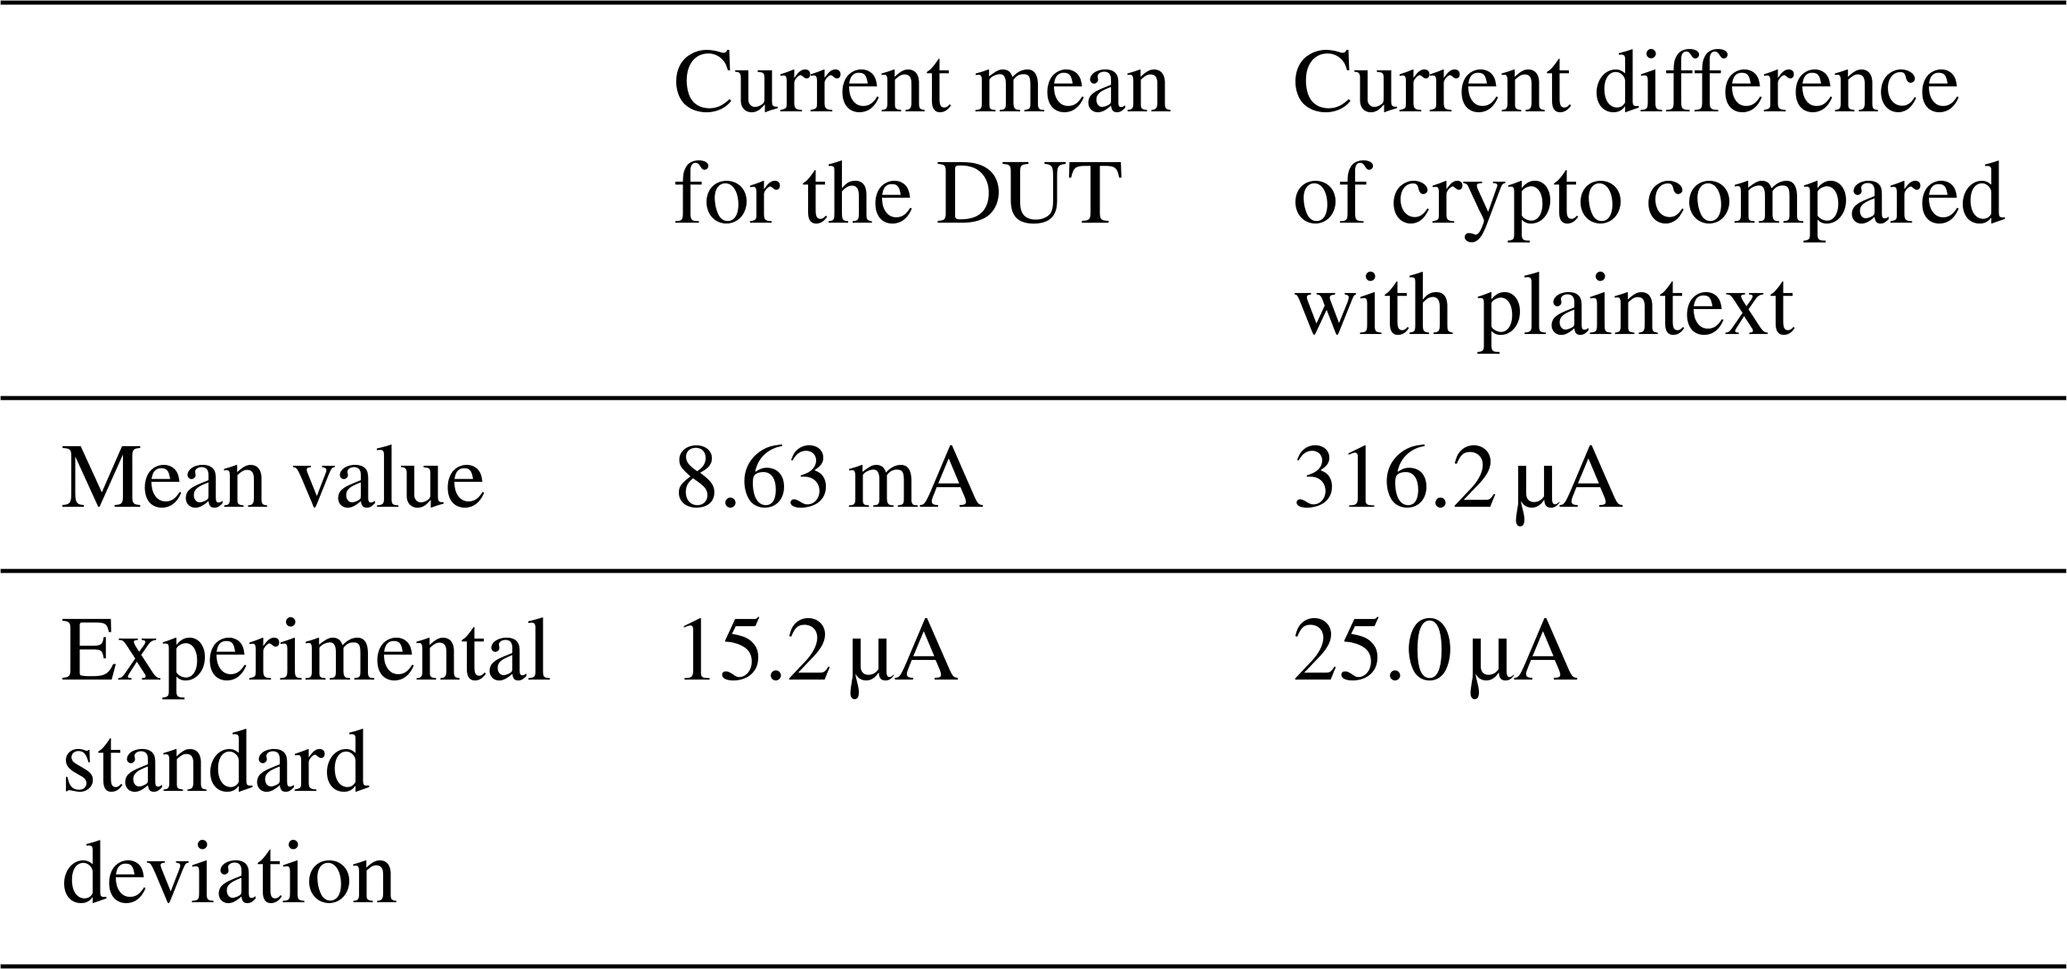
The experimental standard deviations of the mean currents are factor of 2.5 smaller than the accuracy according to the data sheet of the measurement equipment and, therefore, about 2 orders of magnitude larger than the theoretical step size of the ADC. The mean value of the current difference has a value of 316 µA, resulting in a minor influence on the potential battery lifetime. The experimental standard deviation of the current difference of crypto compared with plaintext is 25 µA, which is significantly smaller than the mean current difference of crypto compared with plaintext and also smaller than the calculated accuracy of the AC1 measurement range of the power probe.
Based on the Guide to the Expression of Uncertainty in Measurement (GUM) (JCGM 100:2008, 2008), an abbreviated uncertainty estimation is presented in this section. An integrated measurement instrument is used, which is specified with respect to the measurement uncertainty (see Table 1). Therefore, the focus is on the parameters that have an additional influence on the measurement results. In publications such as Wolf et al. (2002), Laopoulos et al. (2003), Macii and Petri (2007), Jevtic and Carreras (2011), and Nakutis (2013), the current consumption of different chips under various operational conditions or configurations is presented. This work will adopt some of the uncertainty estimation approaches presented in Nakutis (2013) and Macii and Petri (2007).
For the modeling of the current measurement, it can be assumed that the uncertainty of the measurand depends (at least) on the shunt resistor, the frequencies of the signal, the sampling, the temperatures of the individual components and their environment, and the supply voltage and the device characteristics of the power supply unit as well as of the measuring device. However, the focus lies on the influencing factors for which the expected impact is greatest, as outlined in Sect. 5.1.
5.1 Uncertainty sources
The abovementioned components are discussed here in detail. In particular, Table 1 lists the accuracy according to the data sheet, which is at least 0.2 % of the reading value. This best-case value is taken as a reference in order to consider if single uncertainty components might be negligible.
5.1.1 Frequency dependence
As indicated in Sect. 4.1.1, the frequency of the signal or its components determines the measurement range considered for the RT-ZVC power probe; therefore, this is a critical factor. In the frequency ranges considered here, however, other frequency-dependent effects are comparatively negligible. First, the overall circuit is small compared with the relevant wavelength. Second, in a typical SMD (surface-mounted device) shunt resistor, the skin effect often becomes secondary, according to Ziegler et al. (2009). Furthermore, for frequencies far below 1 MHz, the SMD shunt resistor can even be assumed to be purely resistive, with almost constant characteristics over frequency.
5.1.2 Supply voltage dependence
A precision power supply was used in this work, and its characteristics are given in the data sheet from Rohde & Schwarz (2022) as voltage ripple and noise <500 µV(RMS), where RMS denotes the root-mean-square. Furthermore, the PHYTEC CC2650 module has a typical operating voltage of 1.8–3.8 V, as the module has internal power regulation (PHYTEC, 2018). The nominal operating voltage is 3.3 V; thus, the relative voltage ripple and noise from the power supply are about and are small in comparison with the tightest accuracy of the power probe.
5.1.3 Shunt resistor
As indicated in Fig. 3, the current measurement is essentially based on a voltage measurement across the shunt resistor Rshunt. Thus, the measurement device outputs a value for the current to be measured that is calculated from the internally measured voltage and the entered value of the external shunt resistor.
5.1.4 Measurement instrument
The main uncertainty contribution is estimated to be related to the RT-ZVC power probe (see Table 1). The values given in Table 1 are treated as type B uncertainties according to GUM. Basically, the shunt resistance, the measuring device, and the current consumption of the chip itself influence the measurement result. However, temperature effects will not be considered here in detail for the following reasons:
-
The DUT and the measurement device were switched on for a while before the measurements; therefore, a stationary state is assumed for their temperature.
-
The ambient temperature was kept constant during the measurements.
-
The temperature coefficient of the shunt resistor is ppm , according to Stackpole Electronics, Inc. (2021). Even an unrealistically large assumed temperature difference of 20 K would consequently only cause a relative change of 40 ppm, which can be neglected with respect to the other uncertainty sources.
-
The temperature coefficient of the power probe is stated as 0.15 × specified accuracy per degree Celsius outside the nominal specified temperature range, according to Rohde & Schwarz (2018). As the nominal specified temperature range covers an ambient temperature interval of 6 ∘C, it was ensured that this was not exited during the measurements. As a result, no additional temperature-related effect has to be considered here.
Furthermore, due to the applied measurement principle based on the difference between measurements with and without crypto algorithms, effects caused by changing temperature are neglected for the following reason: the mass as well as the heat capacity of the transceiver chip utilized is such that its temperature can be assumed to be unchanged during the period of time considered for evaluation.
5.2 Combined uncertainty assessment
Generally, the combined uncertainty uc can be derived according to GUM as follows:
where uA denotes the type A uncertainty obtained using statistical methods, and uB denotes the type B uncertainty, obtained from sources such as data sheets.
5.2.1 Type A uncertainty analysis
To determine the current IDUT_Mean, the mean value of 10 measurements was calculated, each consisting of 445 datasets with each 50 000 respective samples, according to Sect. 3. Furthermore, the experimental standard deviation was calculated according to JCGM 100:2008 (2008) and is presented in Table 4. It was assumed that the values obtained from the 10 measurements (each with 445 datasets) are uncorrelated, as they represent resultant quantities of different evaluations that have been made independently. This assumption is motivated by the fact that both the temporal behavior of the DUT and the power probe are sufficiently fast, resulting in no (temporal) correlation among the samples. Furthermore, the common setup is accounted for by an independent standard uncertainty, which is considered in the following section. This approach is based on JCGM 100:2008 (2008) (Sect. 5.2.4). Using the same approach, the mean value as well as the experimental standard deviation of the current difference between the crypto and plaintext mode were determined. The results are listed in Table 4.
5.2.2 Type B uncertainty analysis
As reasoned in Sect. 4.1.3, the AC 1 measurement range according to Table 1 is considered here. According to Example 2 in Sect. 4.3.7 in JCGM 100:2008 (2008), a uniform distribution is assumed for this data sheet statement, resulting in a half-width aZVC of the assumed symmetric uniform distribution with aZVC≈37.3 µA, as calculated in Eq. (1) and stated in Table 3. Using Eq. (7) in JCGM 100:2008 (2008), i.e., , this results in
As a second aspect, the uncertainty of the shunt resistor is also considered as type B uncertainty here, as it is not purely based on statistical evaluation but also on the data sheet of the multimeter utilized. A symmetric uniform distribution is assumed. Thus, using the given values in its data sheet (Keysight, 2021) results in a half-width of . Employing Eq. (7) from JCGM 100:2008 (2008), this yields
As an approximation, a linear influence of the relative uncertainty of Rshunt is assumed for the current IDUT_Mean. Thus, will be considered as another type B uncertainty for the current as , resulting in
For the (overall) type B uncertainty, is considered in the following.
5.3 Resulting uncertainties
The combined uncertainty of the mean current IDUT_Mean is obtained from Eq. (2) using the experimental standard deviation and the uncertainties associated with the ZVC probe as well as the shunt resistor. This results in uc(IDUT_Mean)≈27 µA.
For the current IDUT_Diff_Mean, the uncertainty is estimated using the same approach as for the uncertainty of IDUT_Mean, with another empirical standard uncertainty as the type A component. The individual samples of the current differences were also considered to be uncorrelated, as they represent resultant quantities of different evaluations that have been made independently. The type B uncertainty components are assumed to apply both the minuend (i.e., the current in crypto mode) and the subtrahend (i.e., the current in plaintext mode) equally prior to subtraction. Thus, the combined uncertainty uc of IDUT_Diff_Mean results in uc(IDUT_Diff_Mean)≈33 µA. The results of the uncertainty estimation are presented in Table 5.

In addition to the mean values of the currents, Table 5 also contains the relative combined measurement uncertainties related to the mean value. The mean current IDUT_Mean was determined with a relative uncertainty of about , which is a precise measurement considering the bandwidth of the pulsed current. The current IDUT_Diff_Mean is comparatively lower and could be determined with a relative uncertainty of about , which is still sufficient to determine a reliable statement about the additional power consumption for, e.g., a specific crypto algorithm.
The measurement of application-dependent currents of components such as a wireless transceiver chip is challenging due to the small currents and bandwidth. In this paper, a method has been shown to measure the current accurately: an external shunt resistor was selected to exploit the measuring range of the power probe and to achieve a high accuracy.
This approach was used to measure the current consumption of an IO-Link Wireless transceiver during normal operation (plaintext mode) and encrypted operation (ciphertext mode). Furthermore, the current difference between normal operation and encrypted operation was determined within one experimental measurement. The relevant signal frequencies were determined using variable FFT-based low-pass filtering. These findings were incorporated into the analysis of the combined measurement uncertainty. Finally, the application-dependent current consumption could be precisely measured with a feasible uncertainty.
The raw data and parts of the software code for evaluation used in this paper can be made available upon request from the authors. However, the protocol stack utilized in the transceiver chips as well as the embedded software and firmware, e.g., of the measurement devices, contains intellectual property of the respective right holders and cannot be made available.
TRD was responsible for conceptualizing the study; developing the methodology; curating the data; undertaking the formal analysis; carrying out the investigation and measurements; and writing, reviewing, and editing the paper. CC contributed to conceptualizing the study; developing the methodology; undertaking the formal analysis; and writing, reviewing, and editing the paper. GS was responsible for conceptualizing the study, acquiring funding, and supervising the study. All authors have read and agreed upon the published version of the paper.
The contact author has declared that neither they nor their co-authors have any competing interests.
Publisher’s note: Copernicus Publications remains neutral with regard to jurisdictional claims in published maps and institutional affiliations.
This article is part of the special issue “Sensors and Measurement Science International SMSI 2021”. It is a result of the Sensor and Measurement Science International, 3–6 May 2021.
This work is the continuation of ideas and work that were partially presented at the “Sensors and Measurement Science International SMSI 2021” conference (Doebbert et al., 2021a). The authors would like to acknowledge Jonas Jockram and Ralf Heynicke for their support as well as Kunbus GmbH.
This work has been supported by the Federal Ministry of Defense dtec.bw program in the framework of the “Digital Sensor-2-Cloud Campus Plattform (DS2CCP)” project as well as by the Federal Ministry for Economic Affairs and Energy (BMWi; grant no. 03TN0005A) and the Project Management Juelich (PTJ) WIPANO program in the framework of the “IOLW-4-IEC” project.
This paper was edited by Rosario Morello and reviewed by two anonymous referees.
Cammin, C., Krush, D., Heynicke, R., Scholl, G., Schulze, C., Thiede, S., and Herrmann, C.: Coexisting Wireless Sensor Networks in Cyber-Physical Production Systems, in: 2016 IEEE 21st International Conference on Emerging Technologies and Factory Automation (ETFA), Berlin, Germany, 6–9 September 2016, 1–4, https://doi.org/10.1109/ETFA.2016.7733593, 2016. a
Cammin, C., Krush, D., Heynicke, R., and Scholl, G.: Test method for narrowband F/TDMA-based wireless sensor/actuator networks including radio channel emulation in severe multipath environments, J. Sens. Sens. Syst., 7, 183–192, https://doi.org/10.5194/jsss-7-183-2018, 2018. a, b
Doebbert, T., Cammin, C., and Scholl, G.: Precision Measurement of the Application-dependent Current Consumption of a Wireless Transceiver Chip, in: SMSI 2021 – Measurement Science, Nuremberg, Germany, online, 3–6 May 2021, 281–282, https://doi.org/10.5162/SMSI2021/D8.4, 2021a. a, b
Doebbert, T., Krush, D., Cammin, C., Jockram, J., Heynicke, R., and Scholl, G.: IO-Link Wireless Device Cryptographic Performance and Energy Efficiency, in: 2021 22nd IEEE International Conference on Industrial Technology (ICIT), vol. 1, Valencia, Spain, 10–12 March 2021, 1106–1112, https://doi.org/10.1109/ICIT46573.2021.9453590, 2021b. a, b
Doebbert, T. R., Cammin, C., Scholl, G., and Kärcher, B.: Study of a Safe and Secure Ecosystem based on IO-Link Wireless and a 5G Campus Network, 2021 26th IEEE International Conference on Emerging Technologies and Factory Automation (ETFA ), 2021, Vasteras, Sweden, 7–10 September 2021, 01–04, https://doi.org/10.1109/ETFA45728.2021.9613484, 2021c. a
Heynicke, R., Krush, D., Cammin, C., Scholl, G., Kaercher, B., Ritter, J., Gaggero, P., and Rentschler, M.: IO-Link Wireless enhanced factory automation communication for Industry 4.0 applications, J. Sens. Sens. Syst., 7, 131–142, https://doi.org/10.5194/jsss-7-131-2018, 2018. a, b, c
IEC Commitee Draft (65C/1140/CD) 61139-3 ED1: Industrial networks – Single-drop digital communication interface – Part 3: Wireless extensions, https://www.iec.ch/dyn/www/f?p=103:38:2356035810530::::FSP_ORG_ID,FSP_APEX_PAGE,FSP_PROJECT_ID:1376,20,104747 (last access: 2 June 2022), 2021. a
IO-Link Community: IO-Link Wireless System Extensions – Specification Version 1.1, March 2018, Order No: 10.112, https://io-link.com/share/Downloads/System-Extensions/IO-Link_Wireless_System_10112_V11_Mar18.pdf (last access: 11 May 2022), 2018. a, b
IO-Link Community: IO-Link Wireless System Extensions – Specification Draft V1.1.3 for Review, December 2021, Order No: 10.112, https://io-link.com/share/Downloads/System-Extensions/IO-Link_Wireless_System_Specification_10112_d113_Dec21.pdf (last access: 11 May 2022), 2021. a
JCGM 100:2008: Guide to the Expression of Uncertainty in Measurement, https://www.bipm.org/en/committees/jc/jcgm/publications (last access: 2 June 2022), 2008. a, b, c, d, e, f
Jevtic, R. and Carreras, C.: Power Measurement Methodology for FPGA Devices, IEEE T. Instrum. Meas., 60, 237–247, https://doi.org/10.1109/TIM.2010.2047664, 2011. a
Keysight: Keysight 3458A Multimeter User's Guide, https://www.keysight.com/de/de/assets/7018-06796/data-sheets/5965-4971.pdf (last access: 12 May 2022), 2021. a, b
Krush, D., Cammin, C., Doebbert, T. R., Heynicke, R., and Scholl, G.: Coexistence Management Methods and Tools for IO-Link Wireless, in: 2021 17th IEEE International Conference on Factory Communication Systems (WFCS), Linz, Austria, 9–11 June 2021, 151–158, https://doi.org/10.1109/WFCS46889.2021.9483594, 2021. a
Laopoulos, T., Neofotistos, P., Kosmatopoulos, C., and Nikolaidis, S.: Measurement of current variations for the estimation of software-related power consumption [embedded processing circuits], IEEE T. Instrum. Meas., 52, 1206–1212, https://doi.org/10.1109/TIM.2003.816837, 2003. a
Macii, D. and Petri, D.: Accurate Software-Related Average Current Drain Measurements in Embedded Systems, IEEE T. Instrum. Meas., 56, 723–730, https://doi.org/10.1109/TIM.2007.894919, 2007. a, b
Nakutis, Z.: A Current Consumption Measurement Approach for FPGA-Based Embedded Systems, IEEE T. Instrum. Meas., 62, 1130–1137, https://doi.org/10.1109/TIM.2013.2245036, 2013. a, b
PHYTEC: phyWAVE-CC26xx Hardware Manual, https://www.phytec.eu/fileadmin/user_upload/images/content/1.Products/IoT/L-824e_1.pdf (last access: 30 May 2022), 2018. a, b, c
Rentschler, M., Ladruner, W., Gaggero, P., Zigman, E., Wolberg, D., Blonsky, O., Kaptur, R., Scholl, G., Heynicke, R., Ritter, J., and Kaercher, B.: IO-Link Wireless: The new Standard for Factory Automation, 15th Wireless Congress: Systems & Applications, Munich, 14–15 November 2018, 1–13, 2018. a, b
Rohde & Schwarz: R&S RT-ZVC Multi-Channel Power Probe User Manual – Version 03, https://scdn.rohde-schwarz.com/ur/pws/dl_downloads/dl_common_library/dl_manuals/gb_1/r/rt_zvc/RT-ZVC_UserManual_en_03.pdf (last access: 12 May 2022), 2018. a, b, c, d
Rohde & Schwarz: R&S NGM200 Power Supply Series Data Sheet- Version 3.00, https://scdn.rohde-schwarz.com/ur/pws/dl_downloads/dl_common_library/dl_brochures_and_datasheets/pdf_1/NGM200_dat_en_3609-1685-32_v0300.pdf (last access: 12 May 2022), 2022. a, b
Sanoh, M., Mikata, A., Tokuno, K., Hanazawa, M., and Kakitani, H.: A calibration method for a commercial coaxial shunt at high pulse current, in: 29th Conference on Precision Electromagnetic Measurements (CPEM 2014), 630–631, https://doi.org/10.1109/CPEM.2014.6898543, iSSN 2160-0171, 2014. a
Stackpole Electronics, Inc.: RNCF Series – Precision Thin Film Chip Resistor – Data sheet, https://www.seielect.com/catalog/sei-rncf.pdf (last access: 12 May 2022), 2021. a
Wolf, F., Kruse, J., and Ernst, R.: Timing and power measurement in static software analysis, Microelectr. J., 33, 91–100, https://doi.org/10.1016/S0026-2692(01)00108-2, 2002. a
Ziegler, S., Woodward, R. C., Iu, H. H.-C., and Borle, L. J.: Current Sensing Techniques: A Review, IEEE Sens. J., 9, 354–376, https://doi.org/10.1109/JSEN.2009.2013914, 2009. a, b