the Creative Commons Attribution 4.0 License.
the Creative Commons Attribution 4.0 License.
 | 20 Jul 2022
Measurement uncertainty analysis of a measurement flexure hinge in a torque standard machine
Kai Geva
Holger Kahmann
Christian Schlegel
Rolf Kumme
An alternative method to using strain gauges to measure FT (please see Appendix A for a list of definitions) and TM under a static multi-component load by using a hinge flexure (also called measurement flexure or MF) is presented. Its usage in the 5 MN m torque standard machine (TSM) at the Physikalisch-Technische Bundesanstalt (PTB) to detect calibration torque moment shunts is described. The working principle consists of a displacement measurement by an interferometer and the determination of the MF stiffness in a special CSU. Essential measurement uncertainty influences, such as stiffness determination and measurement conditions, are discussed and quantified. The measurement uncertainty budget for this measurement principle is presented. A FE validation for the MF is discussed.
- Article
(2981 KB) - Full-text XML
- BibTeX
- EndNote


The growing wind energy demand led to increasing research in wind turbine optimisation. A key aspect is the wind turbine's efficiency, which was determined in a nacelle test bench. For a precise efficiency determination, a precise torque measurement is elementary. Although the Physikalisch-Technische Bundesanstalt (PTB) transfer standard already exists to calibrate the test benches' internal torque measurement, it is not possible to calibrate the transfer standard beyond 1 MN m (Schlegel et al., 2016).
At PTB, a new torque standard machine (TSM) is built to calibrate such torque transducers up to 5 MN m (Kahmann et al., 2017). The TSM set-up is depicted in Fig. 1. Its set-up is divided into a measurement and an actuator side. In between, the device under calibration (DUC) is placed. The actuator side holds six hydraulic servo cylinders to apply a load onto the DUC. The two main actuators are aligned vertically and attached to the actuator lever to create the calibration torque moment about a horizontal axis. The remaining four actuators are able to superpose axial forces or a calibration bending moment to assess the DUC's cross-sensitivity if needed. The DUC is flange mounted to the actuator lever and receives the load from the actuator side. The same load is transmitted to the measurement side, where the DUC is again flange mounted to the measurement lever. The lever itself is jointed on six hinge flexures (also called MF for measurement flexure hereafter) to receive the lever forces axially and measure them with attached reference force transducers.
The measurement side and the moment shunts are depicted in Fig. 2. The MFs support the reference force transducers measuring either the lever forces of the calibration torque moment or calibration bending moment. The main task of the MF is to reduce FT (please see Appendix A for a list of definitions), which is directed tangentially to the horizontal calibration torque moment axis and corresponding bending and torque moment on the attached force transducers. Nevertheless, FT and TM cannot be avoided completely, and both components contribute to the overall reaction torque of the measurement side. It is necessary to measure the complete reaction torque comprising the axial lever forces of the calibration torque moment reference transducer, the transversal forces on both MF types, and the torque moment (only on the bending moment MF or BMMF). The measured reaction torque is used as standard for DUC calibration.
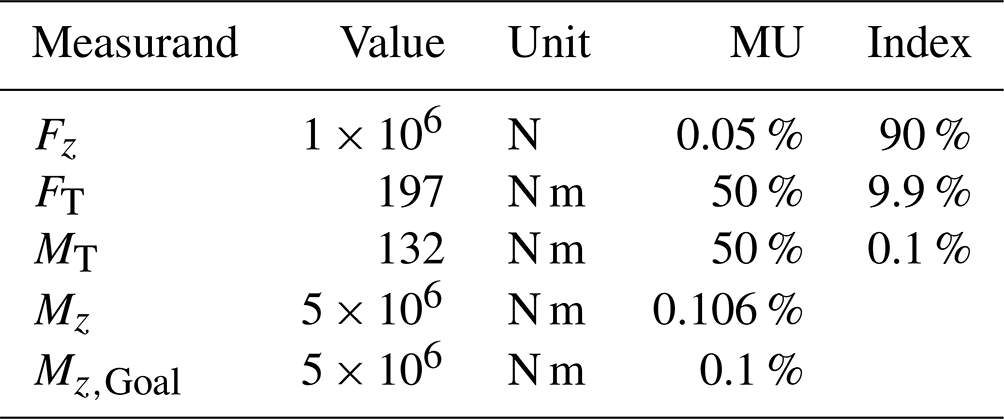
Table 1 shows, in a simplified measurement uncertainty budget, the influence of the moment shunt if these quantities are not measured, and this must be considered with an uncertainty of 50 %. It is necessary to provide a better measurement accuracy so that the measurement uncertainty of the calibration torque moment can be reduced.
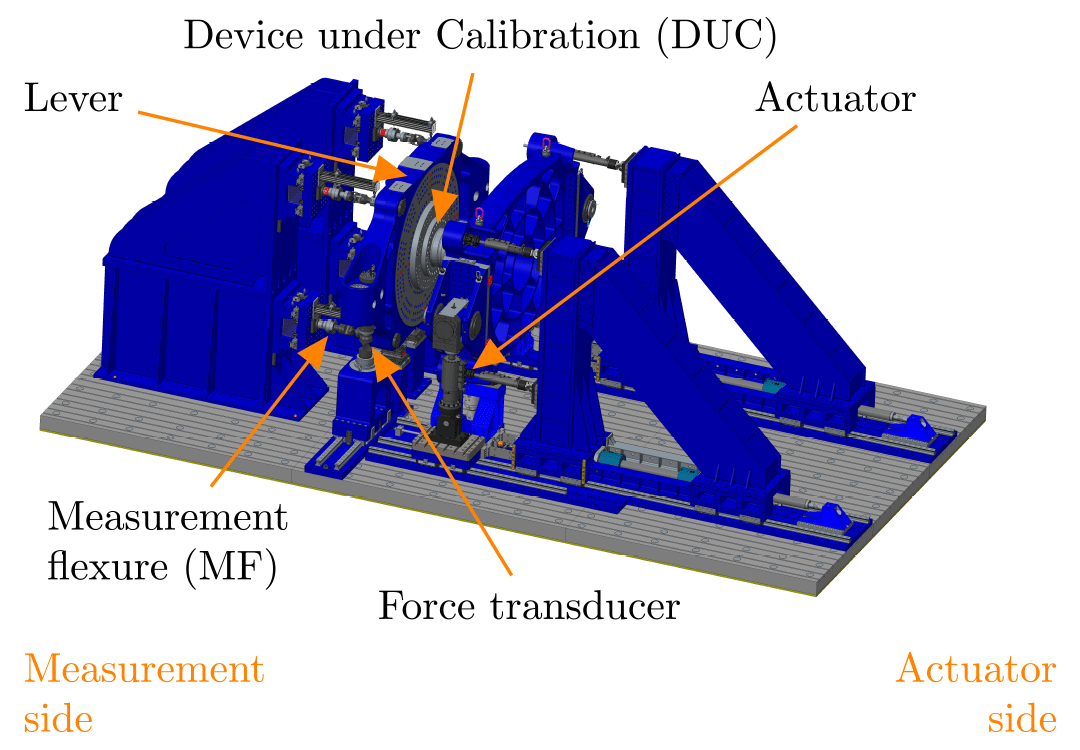
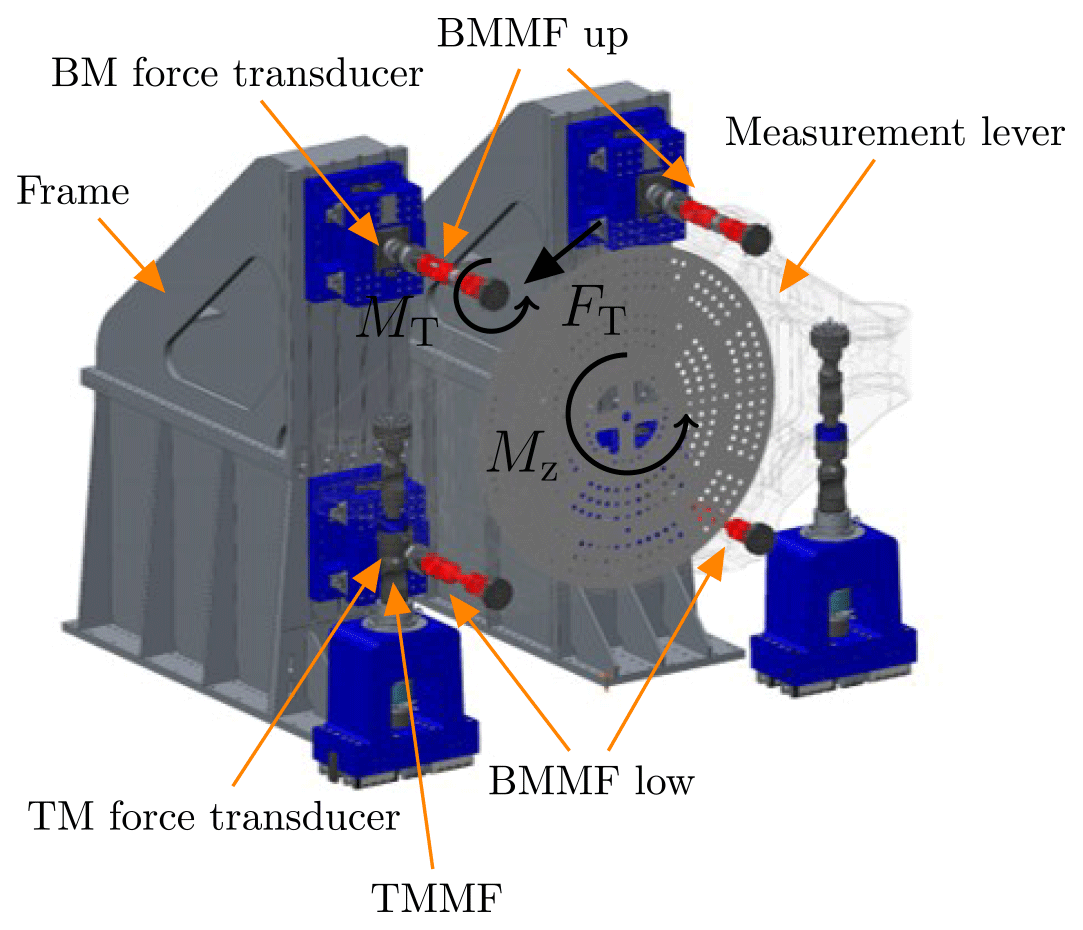
Table 1Measurement uncertainty budget of the calibration torque moment Mz in TSM without the FT and MT measurement.
Usually, mechanical quantities such as force and moments can be measured easily with strain gauges. In this particular application, the objective measurands only appear with a high axial force and other similar bending and torque moments. The combined load would lead to cross-talk at the strain gauges which cannot be calibrated sufficiently at PTB. Therefore, another method is presented here to overcome these difficulties.
The alternative method uses the unique deflection line or angle of twist given to a specific load combination. A specific point on the deflection line can be observed with a high-resolution and high-accuracy length measurement system. The paper shows that the deflection in a special load scenario can be reproduced in an external calibration set-up. The result is a fixed ratio of deflection or twist compared to the corresponding FT or TM, called FT stiffness or TM stiffness. The stiffness is determined in an MF CSU providing a traceable force and torque moment. To provide a traceable calibration torque moment in TSM, the MF force and torque measurement must be characterised by a measurement uncertainty analysis, which is the main objective of this paper.
The presented method works for both types of MF (for torque moment and bending moment). The measurement uncertainty of this method is highlighted here so that it is sufficient to only focus on the bending moment MF. There are two types of bending moment MF on upper and lower level. The upper level MFs have a bigger diameter in the middle shaft than the ones on the lower level to compensate for the varying stiffness of the frame at the fixation. The varying middle shaft leads to varying stiffness that must be considered.
2.1 Measurement principle
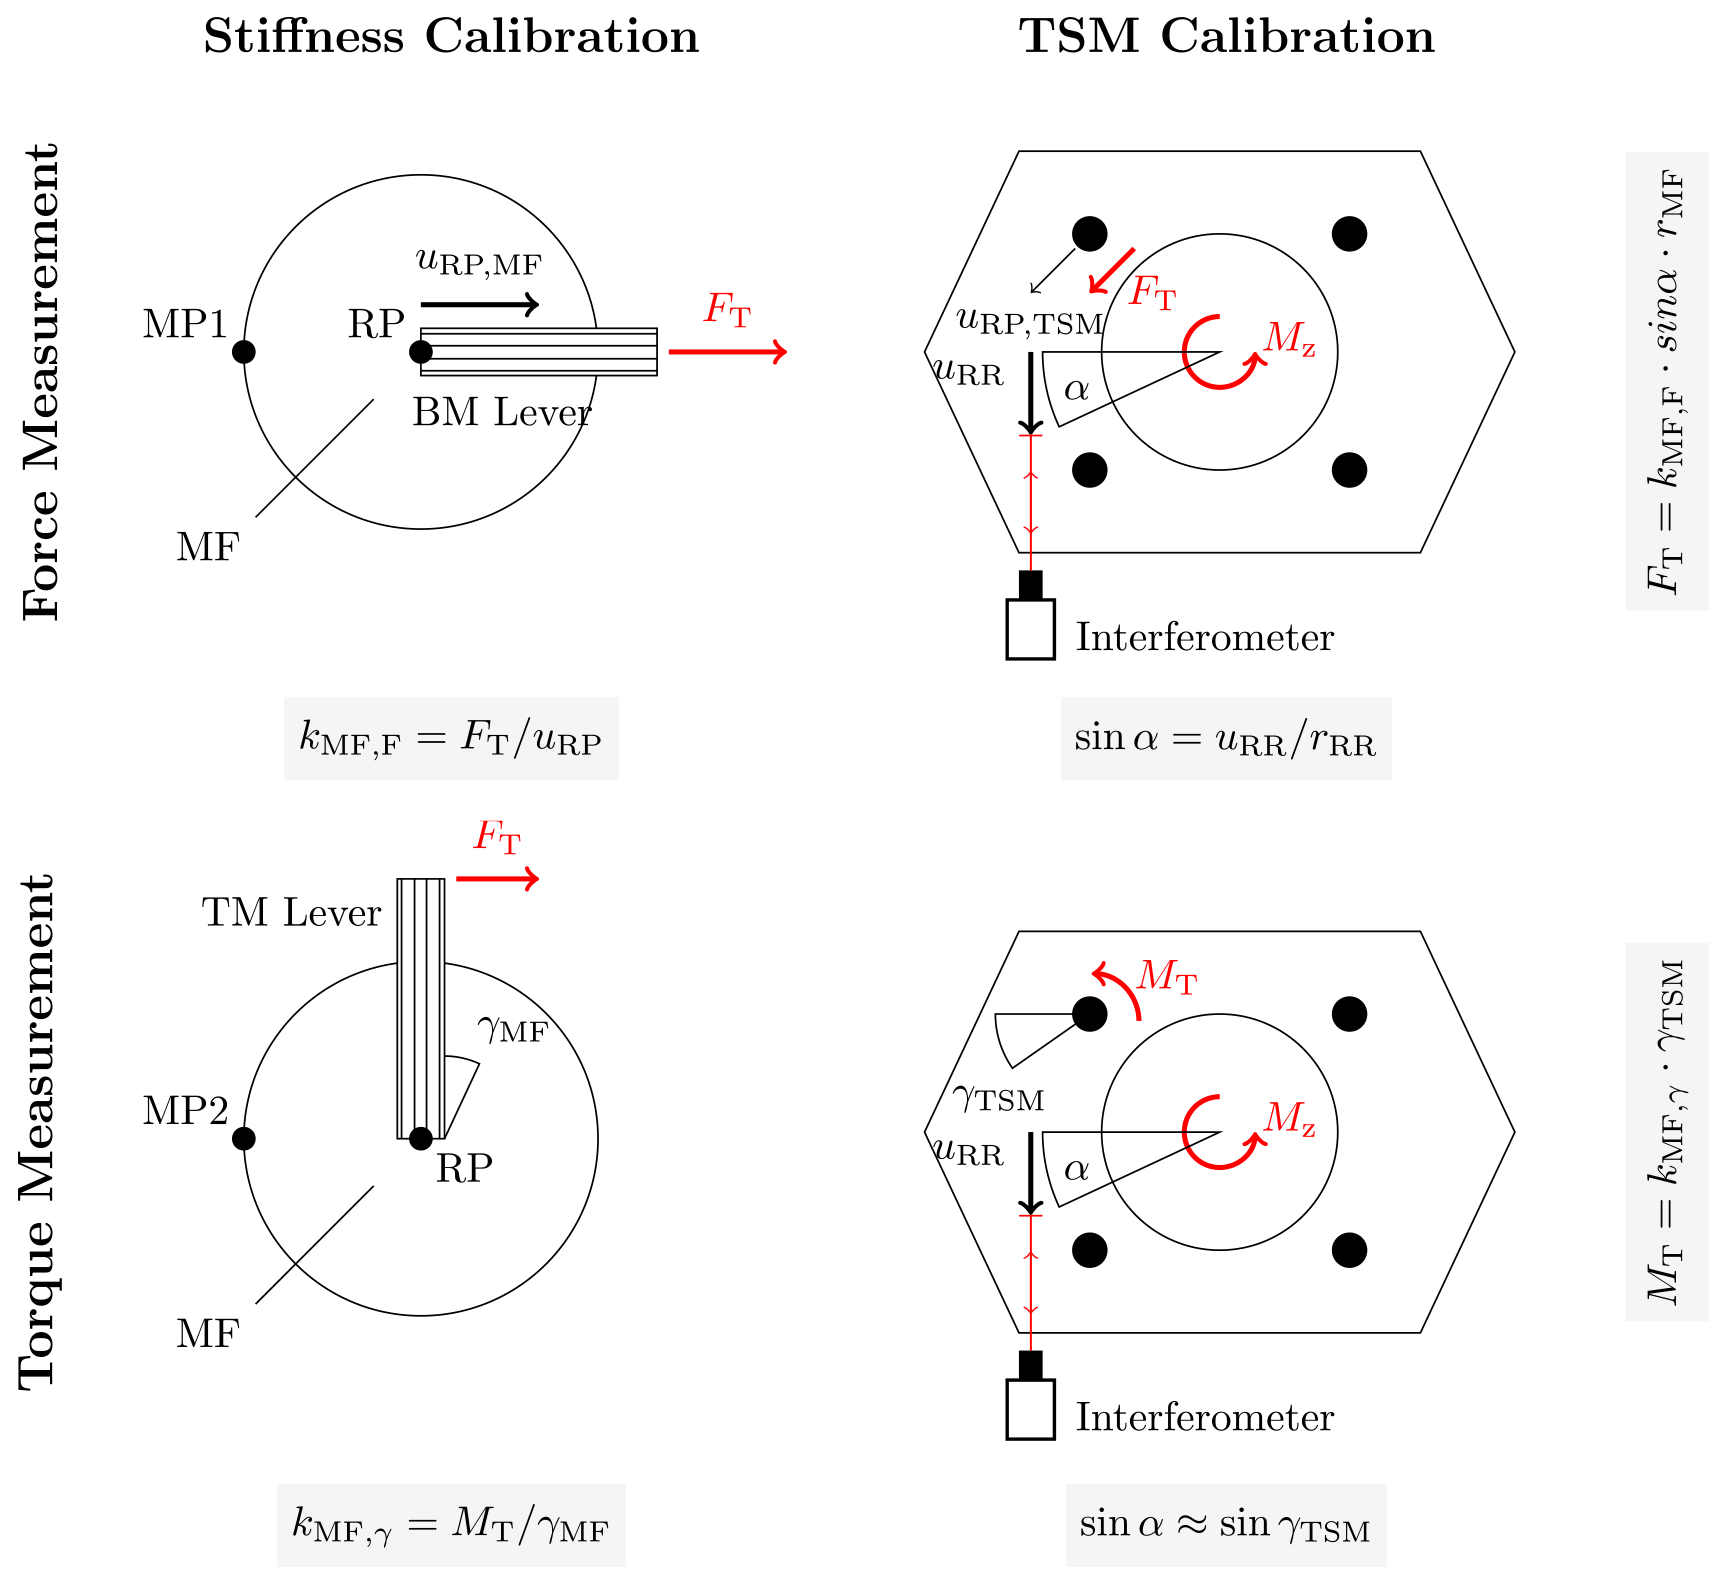
Figure 3 depicts the working principle of the MF when used for measuring FT and TM during the TSM calibration. The key feature of the MF is the FT stiffness kMF,F and the TM stiffness kMF,γ, respectively. Both MFs' stiffness depend on the static multi-component load applied onto them. The MF is loaded with all six components of different magnitudes simultaneously in the TSM operation. The MF's stiffness is only valid in this particular force and moment combination. Therefore, a special calibration set-up has been constructed to meet these measuring conditions in a simplified way and to evaluate the stiffness of each MF. The CSU is constructed to work in two load scenarios to evaluate the stiffness, and it is described in Sect. 2.2.1. With the stiffness known, the FT and the TM can be measured indirectly by measuring the MF deflection and the angle of twist, respectively. Only a two-channel interferometer is provided for this task, so the simultaneous measurement of all MF deflection and torsional angles is not possible. For that reason, the required deflections and angles are measured indirectly. The displacement is measured by the aforementioned interferometer at the flange of the measurement lever. With the distance from the retro reflector to the pivot centre determined, it is possible to calculate the pivot angle α. The radius of each MF's RP is known, so the calculation of the deflection at these points is given. The pivot angle correlates very well with the MF angle of twist. All the deflections and angle calculations are used to calculate the FT and the TM by multiplying them with the determined stiffness factors.
2.2 Uncertainty influences
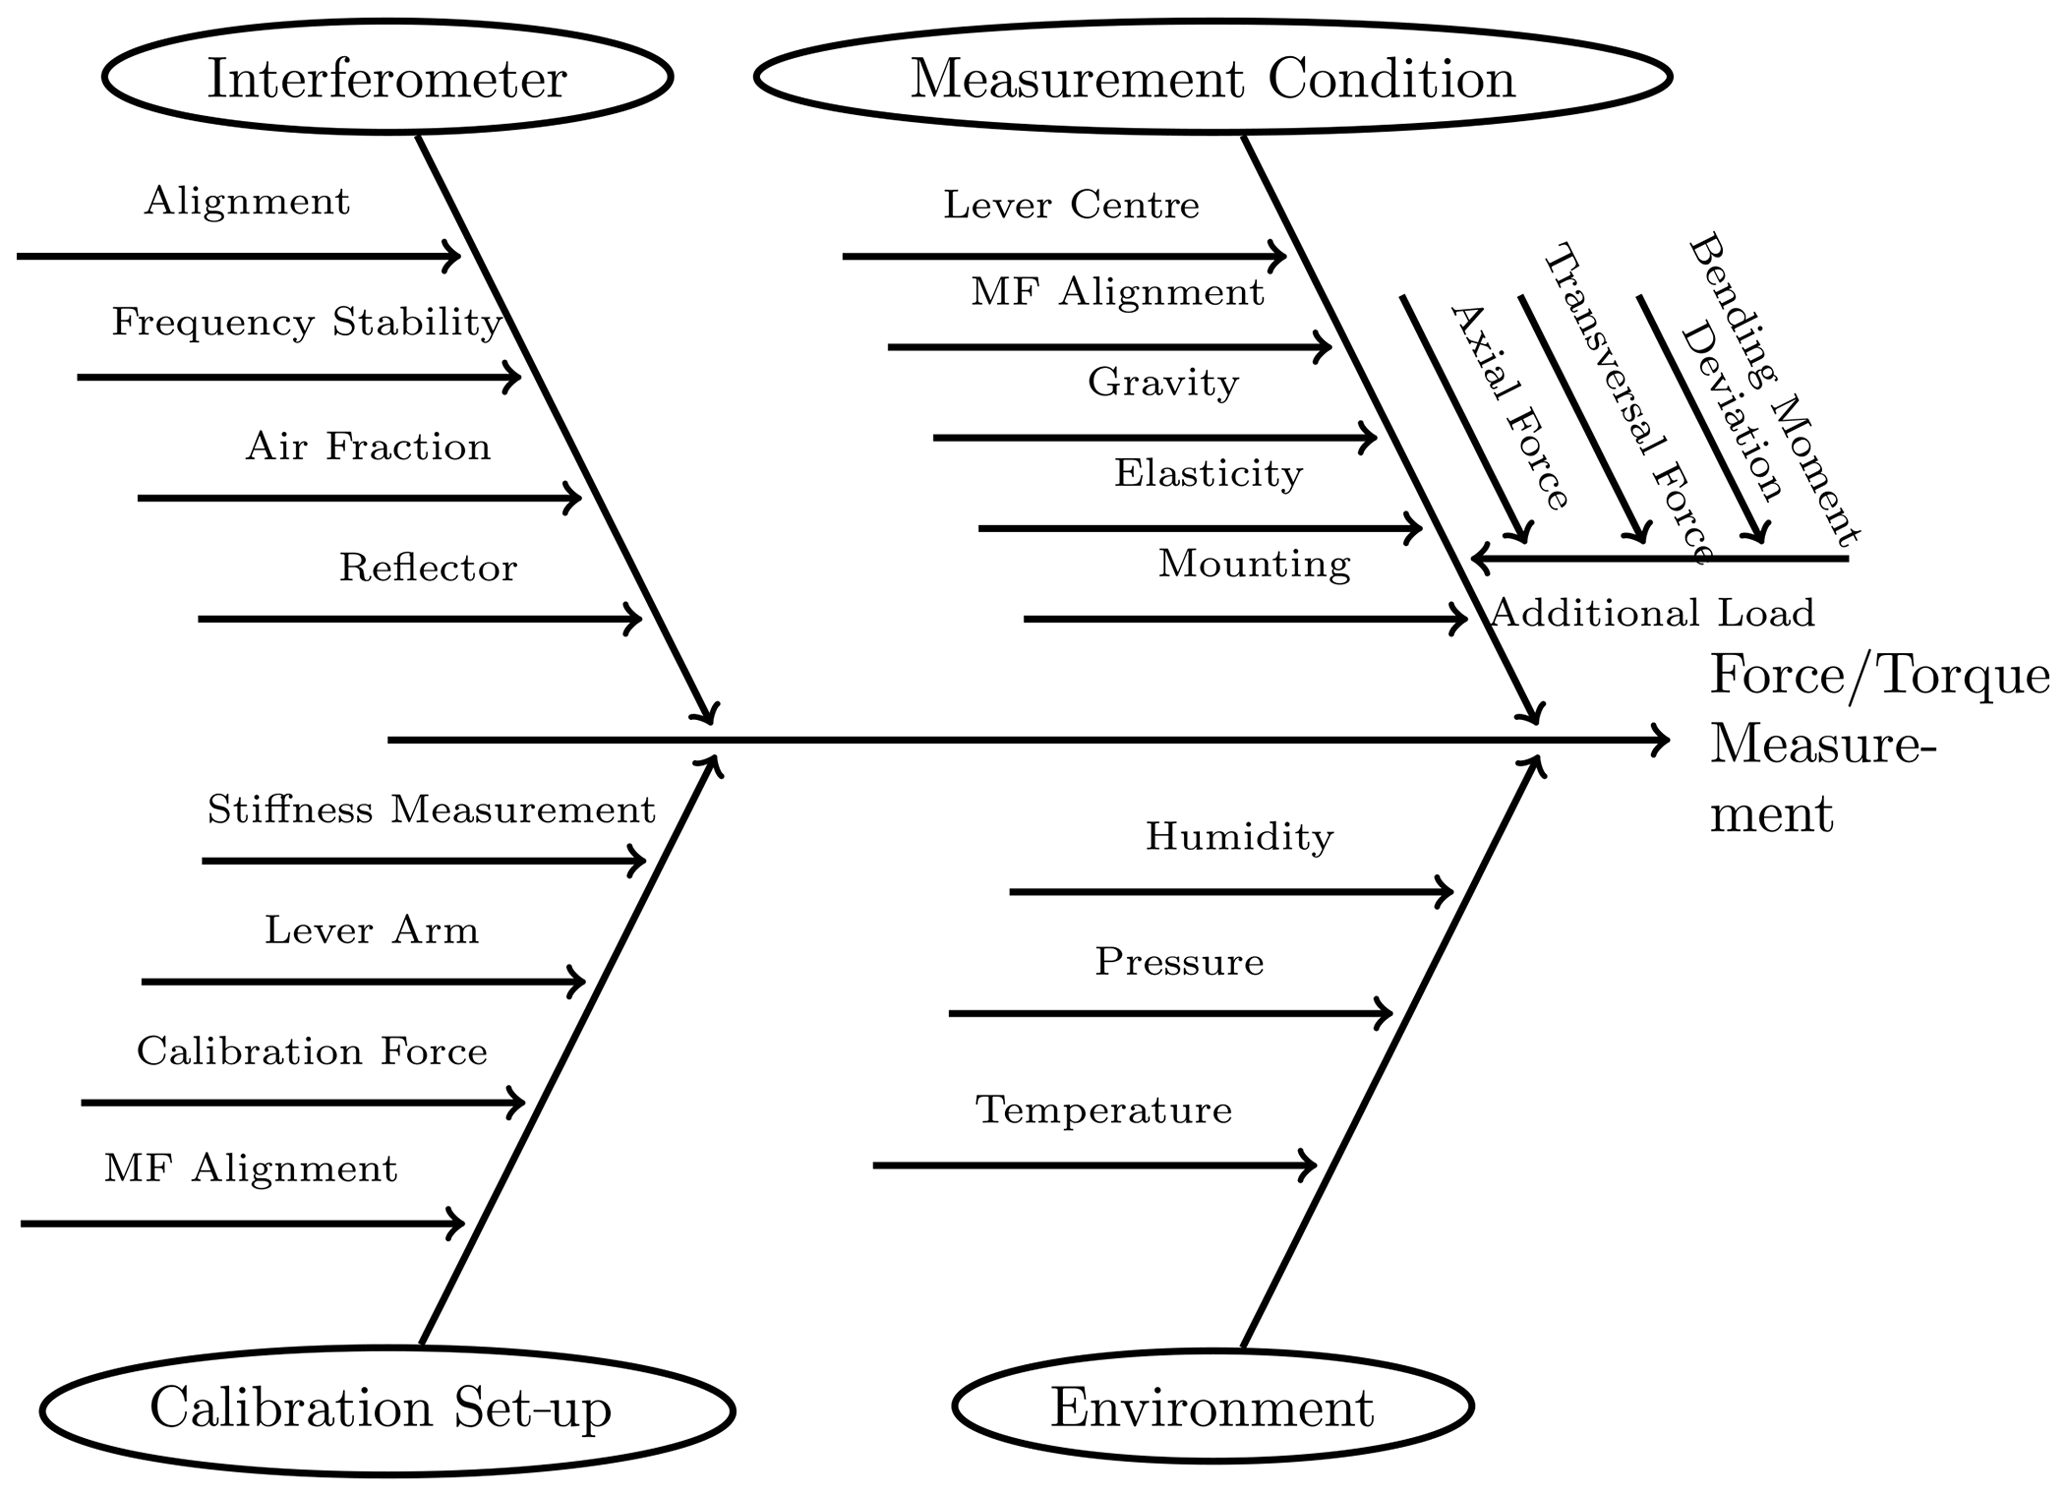
A range of measurement uncertainty influences exists, which diminishes the accuracy of the described measurement principle. Figure 4 lists the influence quantities in an Ishikawa diagram. The following subsections describe the behaviour of the measurement uncertainty influences and quantify them. Not all quantities are covered here, and only the most essential effects are described extensively. As a result, the quantities can be summed up in a measurement uncertainty budget and can be provided for the overall measurement uncertainty of the calibration torque moment in TSM.
2.2.1 Stiffness measurement
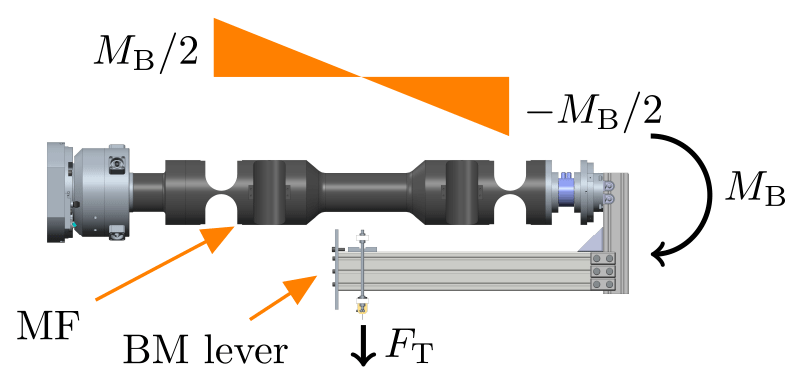
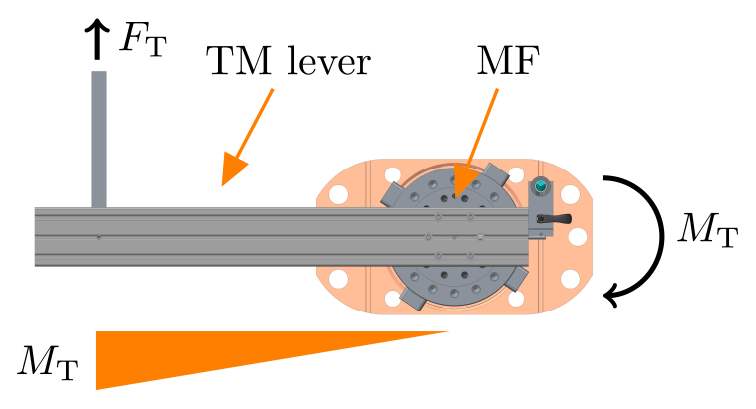
As presented in Sect. 2.1, the calibration set-up for the MF must provide static load scenarios where the TSM operation conditions are maintained and thus enable a correct stiffness measurement. In both cases, the MF is mounted vertically on the ground, and a load-scenario-specific lever is attached to the MF top to receive forces and create load-scenario-specific moments. The force is provided from calibrated mass discs introduced into a thin metal foil and redirected by a pulley towards the lever. There were two load scenarios established, and they are depicted in Figs. 5 and 6. LS1 provides the conditions for a valid FT stiffness measurement. In LS1 only, a FT and a bending moment are created. The bending moment is generated by the same FT, but the force introduction lies in the MF in the middle of the tapering of both joints. A special cantilever creates a bending moment, increasing the behaviour over MF, as depicted in Fig. 5, which matches the behaviour during the TSM operation. LS2 imitates the condition in the TSM operation for a valid stiffness. In its basic configuration, LS2 is a simple lever on which a FT is applied, thus creating a uniform TM all over the MF.
A theoretical analysis of the measurement uncertainty of the CSU providing the calibration of FT and TM is described in Geva et al. (2020). Load steps at 50, 100, 150, and 200 N and their corresponding moments were analysed. The measurement uncertainty of FT is proportional to its value and can be expressed by the following:
For TM, the measurement uncertainty stays constant at 1.7 % over the whole set-up load step range.
To calculate the stiffness, it is necessary to measure the MF's displacement or the angle of twist precisely during load application. The required accuracy is provided by an interferometer. A dual channel He–Ne laser interferometer (model type MI 2–5000 from SIOS Meßtechnik GmbH) is used. Cui et al. (2019) used the same interferometer for a similar measurement to calibrate strain gauge cylinders and assumed a measurement uncertainty of less than m.
To guarantee a reproducible measurement in CSU and TSM, the position at which the displacements are measured with a retro reflector need to be fixed. The MF deflection is characterised by the centre of the top flange circle area and is called RP. Both displacement measurements in CSU and TSM cannot be measured directly with the retro reflector because they are hidden beneath connection components when both are mounted in CSU and TSM. In the CSU, the retro reflector is aligned with the force vector and the RP at the outer cylinder surface near the top flange and is called measurement point 1 (MP1). A FE analysis shows that displacement deviations in LS1 at RP and MP1 are negligible. The translational movement at the RP of MF is as follows:
with i indicating the CSU load step and 0 as the initial position. The MF top and bottom are indicated with j. While all translational movements can be captured with the displacement , the rotational displacement caused by TM needs a measurement point 2 (MP2) at the outer cylinder surface near the top flange. A line drawn from RP to MP2 must be perpendicular to the force vector. The radius of the cylinder rMF is tolerated, and thus, its measurement uncertainty can be estimated. In this case, the angle of twist is calculated by the following:
MP1 and MP2 are depicted in Fig. 3.
The FT stiffness under a TSM load condition is defined as follows:
The TM stiffness under a TSM load condition is defined as follows:
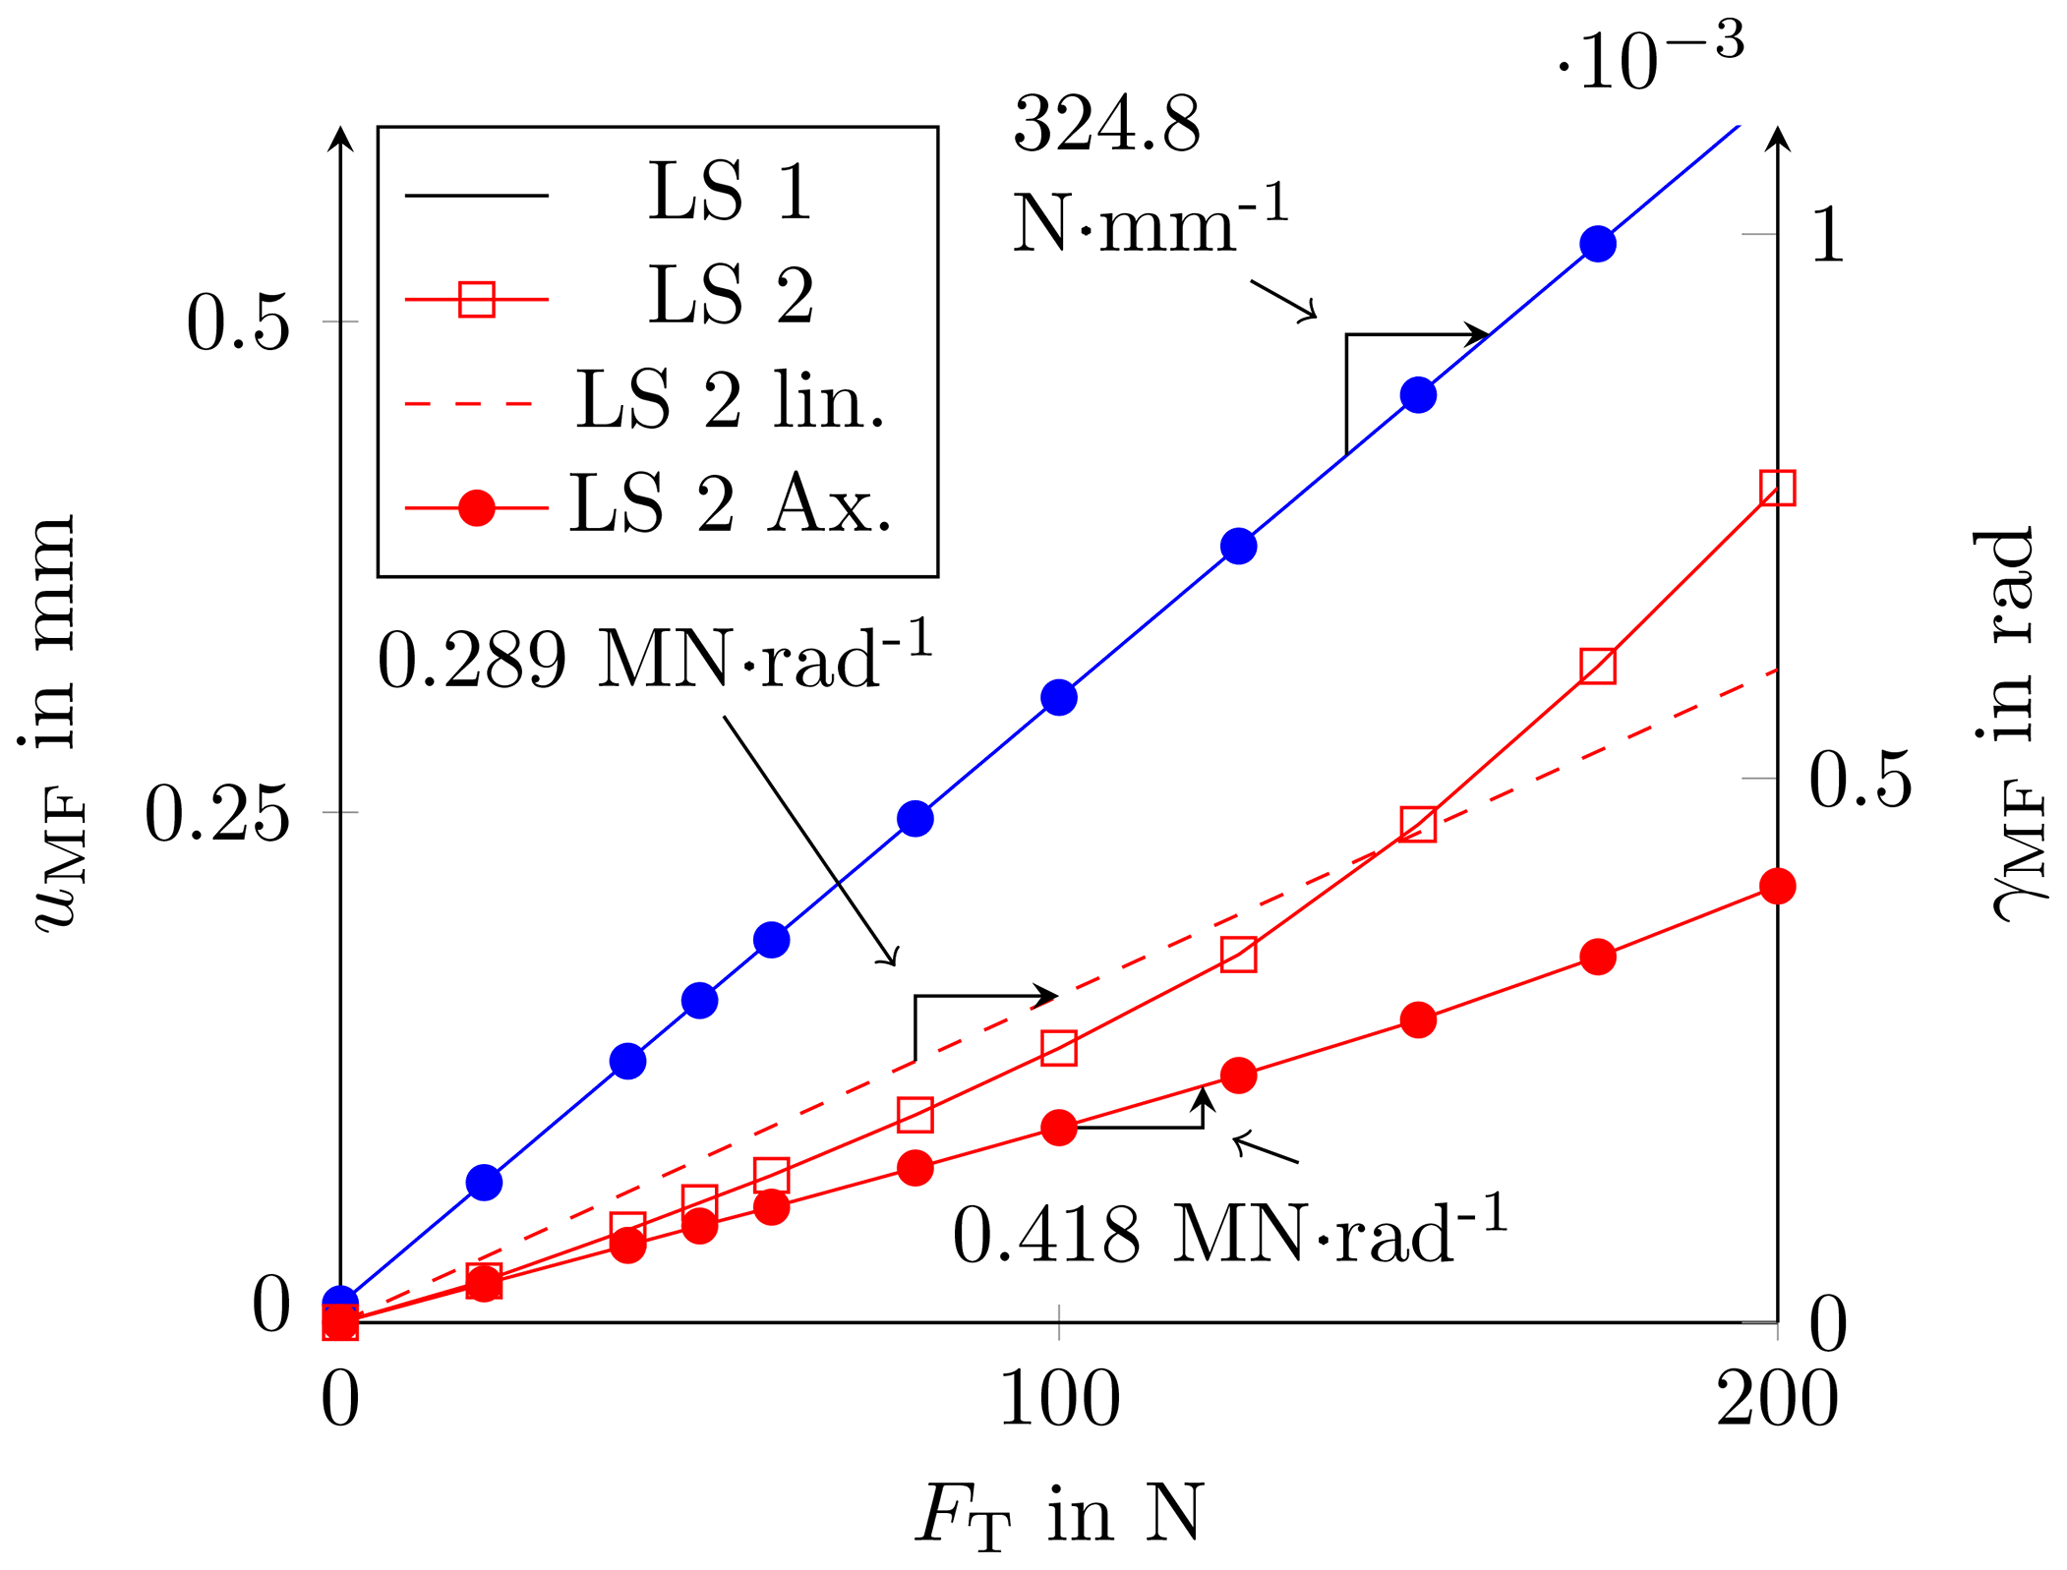
The MF under load in a CSU operation was simulated using the FE method. The results are presented in Fig. 7. The displacement of RP and the angle of twist are plotted over the CSU load steps. The load step ranges from 20 to 200 N in LS1 in a FT and a corresponding bending moment which is m. In LS2, the load step corresponds to a FT and a TM which is m. The blue graph depicts LS1 and shows a linear behaviour. The reciprocal slope yields the average FT stiffness and is 324.86 N mm−1, with a standard deviation of 0.54 N mm−1. The graph indicates that the FT stiffness is constant at all load steps, and a fixed stiffness factor can be used in FT measurement during TSM operation. The red graph with an empty square marks the angle of twist over the load steps. The deviation to the dashed red line, which marks the linear regression curve, indicates a nonlinear behaviour. The average TM stiffness is 0.289 MN m rad−1, and the standard deviation is 5.67×10⁴ N m−1, which is 20 % of the average. In Sect. 3.2, it can be seen that the stiffness is not valid under TSM operation conditions and will result in a false TM measurement. A subsequent FE analysis repeated for the TM stiffness measurement with an additional axial load and is represented by the red graph with filled square markers. The repeated investigation shows a linear behaviour again, with a value of 0.481 MN m rad−1 and a standard deviation of 1.38×10⁴ N m−1, which is 3.6 % of the average. The stabilising effect of the axial force leads to a higher TM stiffness and a constant reciprocal slope. Section 3.2 will show that the axial load is necessary for a precise TM measurement in a TSM operation. The CSU needs to be modified to improve the TM calibration in LS2, which is not part of this paper.
2.2.2 Environment
The CSU and TSM are both situated in an air-conditioned hall. At this point, the environmental condition could not be monitored due to ongoing TSM construction work. Experiences from other standard machines at varying locations show minimum changes to the environmental conditions. To cover the environmental influences on the measurement uncertainty budget (MUB) theoretically, the environmental parameters in Baumgarten (2016) were taken into account. The temperature is ∘C, the pressure is hPa, and the humidity is %. The environment affects the interferometer measurement and the CSU calibration conditions. The uncertainty of the interferometer and of the FT and TM in the CSU already includes the environmental effects. The effect on the TSM is not investigated here.
2.2.3 Measurement condition in TSM
The measurement condition in TSM differs slightly from that in CSU. First of all, the measurement position is different. The MF is mounted vertically to the ground in the CSU. In TSM, the MF will be mounted horizontally. There are gravitational effects which may affect the measurement. A compensation construction was set up using a spring and a force transducer to compensate the gravity and avoid influences on the deflection line. Consequently, gravitational effects are not investigated any further here.
Furthermore, the MF alignment of the MF is different in the TSM and in the CSU. In both cases, a Leica Absolute Tracker laser (model AT960 LR from Hexagon Metrology) is used to align the MF. In the CSU, the MF rotation in relation to the FT direction is aligned with the laser tracker and is already covered in the CSU MU. The tilt of the MF top flange in relation the calibration force cannot be adjusted so that the tolerances of each component of the CSU are summed up. The influence is already covered in the measurement uncertainty of FT and TM. In TSM, the fixation point at the machine frame can be moved up and down and sideways. The fixations position is aligned with the MF flange of the lever using the laser tracker. The tilt deviation ϵTSM is rad.
The rotation of the lever is calculated according to following equation:
The retro reflector for the interferometer is placed at the flange where the DUC is attached to near the neutral fibre and measures the displacement tangential to the lever rotation. The distance rRR lies between the retro reflector position and the pivot centre. A FE analysis showed that the pivot centre coincides almost perfectly with the lever centre. The displacement is less than 6 µm at all load steps and thus can be neglected. The distance is measured with the laser tracker. Furthermore, the position depends on the clearance of the lever boreholes for DUC centring. The measurement uncertainty adds up to 0.333 mm. When the rotation angle α is known, the displacements at each MF RP and the angle of tilt can be calculated.
The distance rMF,j of each MF to the lever centre is measured separately with the tracker. Its uncertainty is mm (with an assumed measuring distance of 5 m). The full FT calculation is as follows:
with i indicating the load step at TSM and j indicating upper and lower MF.
Equation (8) needs the correction coefficient kα. This coefficient considers the elasticity of the lever and adjacent components. An ideally hinged lever would move in a perfect circle when the calibration torque moment is applied on it. In this particular case, kα would be one. The FE analysis shows that kα is not one but constant over all TSM load steps, with an average value of 0.9775 for the upper MF and 0.9662 for the lower MF, with a standard deviation of and . The full TM calculation is as follows:
In Eq. (9), the correction coefficient kγ is defined to compensate for the deviation in the lever rotation and MF angle. The ratio of lever rotation and MF rotation is constant. The value is 0.956 for the lower MF and 0.958 for the upper MF. The standard deviations are and . The low standard deviation proves this method.
Another measurement uncertainty influence arises when looking at the CSU LS1 calibration. The ratio of the FT and bending moment is fixed because of the fixed lever arm length used in CSU. The lever arm length is calculated from a FE analysis, where the FT to the bending moment ratio was found to be half the distance between the MF joints. An analysis has been performed to investigate the uncertainty effect if there is a bending moment deviation to the bending moment calculated from the fixed CSU relationship.
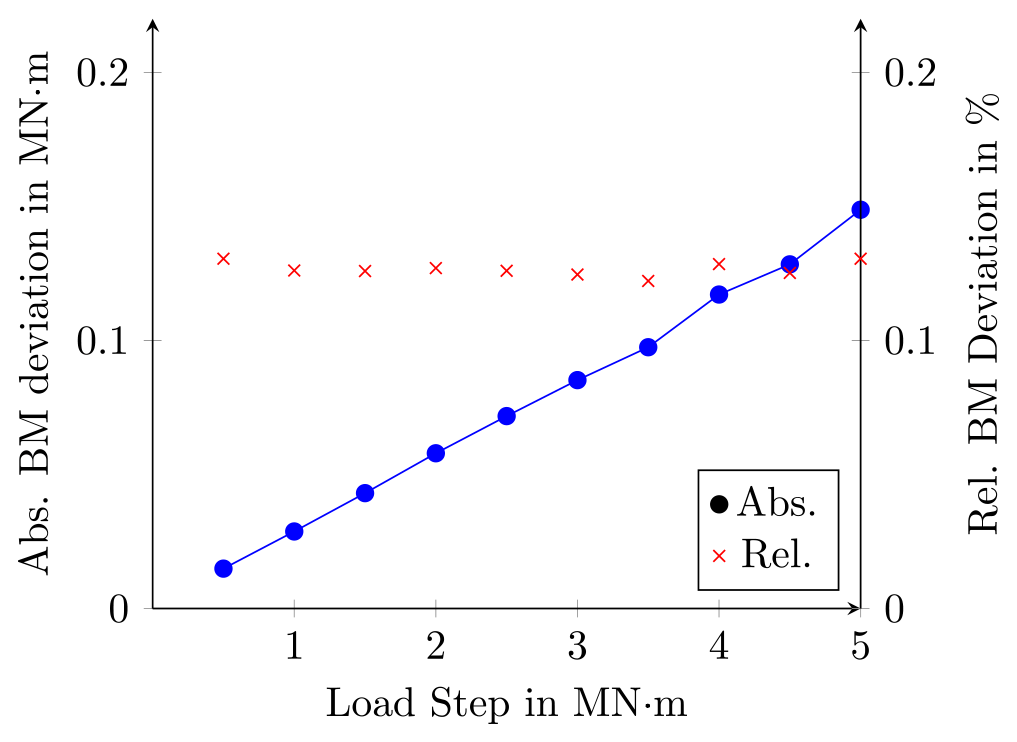
In FE, all four MFs were investigated, and the maximum bending moment deviation for all MFs to the calculated bending moment from the fixed CSU ratio is plotted at each load step. The results are depicted in Fig. 8. A sensitivity coefficient kBM was calculated to find the displacement caused by a BM deviation. This sensitivity coefficient, the maximum bending moment deviation found, and the force stiffness multiplied yields the following:
Figure 9 shows the maximum possible force measurement deviation from the bending moment deviation. The maximum force deviation is less than N.
The following section sums up the results, the model equations, and the measurement uncertainty budgets. After this description, a performance of the presented measurement method is assessed in FE.
3.1 Measurement uncertainty budget
All analysed influence quantities are used to calculate the overall measurement uncertainty of FT and TM at the MF. The following model equations apply for the FT and TM calculation:
Table 2Measurement uncertainty budget of FT with a calibration torque moment of 5 MN m at the upper MF.
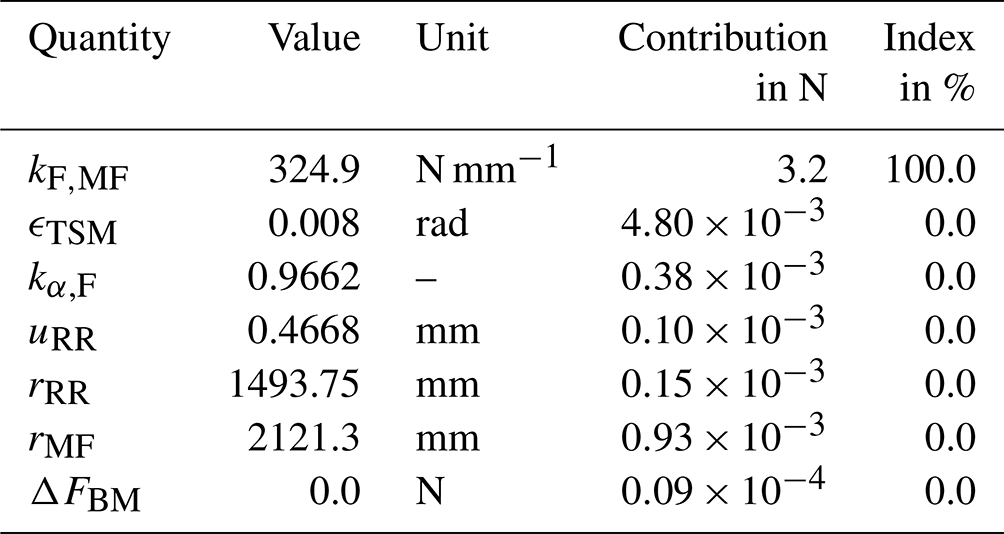
Table 3Measurement uncertainty budget of TM with a calibration torque moment of 5 MN m at the upper MF.
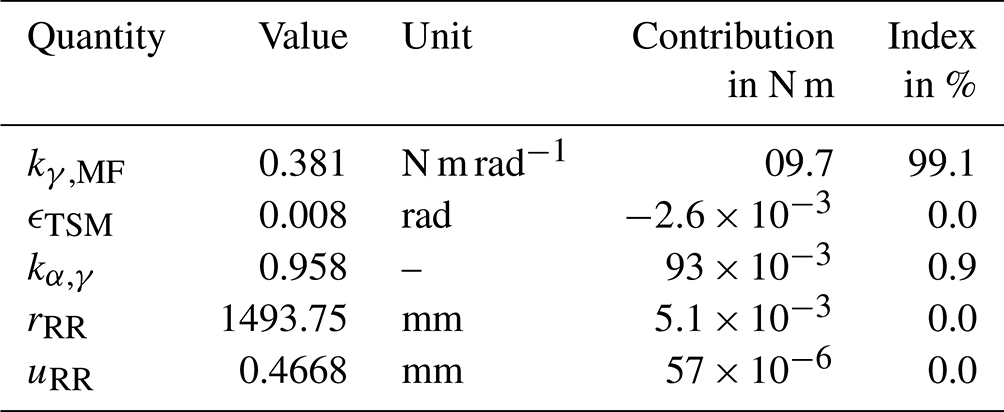
The resulting measurement uncertainty budget of FT and TM at 5 MN m is depicted in Tables 2 and 3. The measurement uncertainty budget was developed with the software tool GUM Workbench. It is evident that, in both measurement procedures, the crucial influence is the stiffness determination uncertainty. For FT, a measurement uncertainty ranging from 0.6 % to 3 % due to the CSU calibration uncertainty is the dominating factor. The next-highest contribution from TSM alignment has a magnitude that is smaller by a factor of 1×10³ compared to the contribution from stiffness. For TM, the uncertainty for the stiffness calibration is lower because the measurement uncertainty is constant over all CSU load steps. That is why the stiffness index is 99.1 % and the uncertainty from elasticity coefficient makes up the remaining 0.9 %. In both cases, the stiffness determination uncertainty dominates the measurement uncertainty for FT and TM measurement.
Table 4Measurement uncertainty of FT and TM at different load steps for the upper MF.
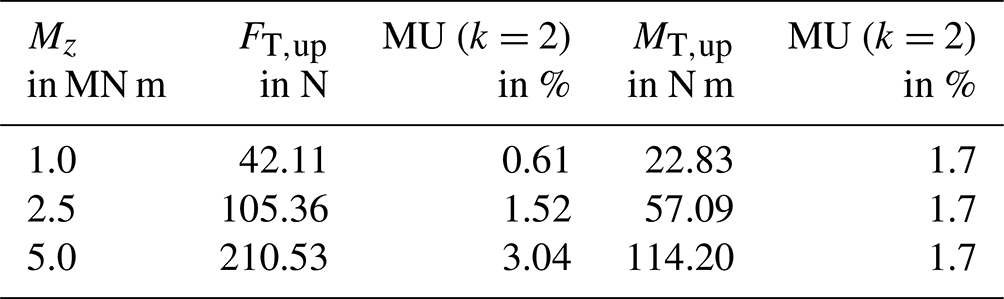
Table 4 lists the measurement uncertainty for MF at three different load steps. Even though the parameters vary slightly for the upper and lower MF levels, the measurement uncertainty does not change significantly. As pointed out before, the stiffness uncertainty is the dominating factor here. FT has an increasing uncertainty with increasing lead steps in CSU, so it is not surprising that the measurement uncertainty ranges from 0.6 % up to 3 %. The TM measurement uncertainty in the CSU stays constant; thus, the TM measurement in TSM stays constant.
3.2 FE validation
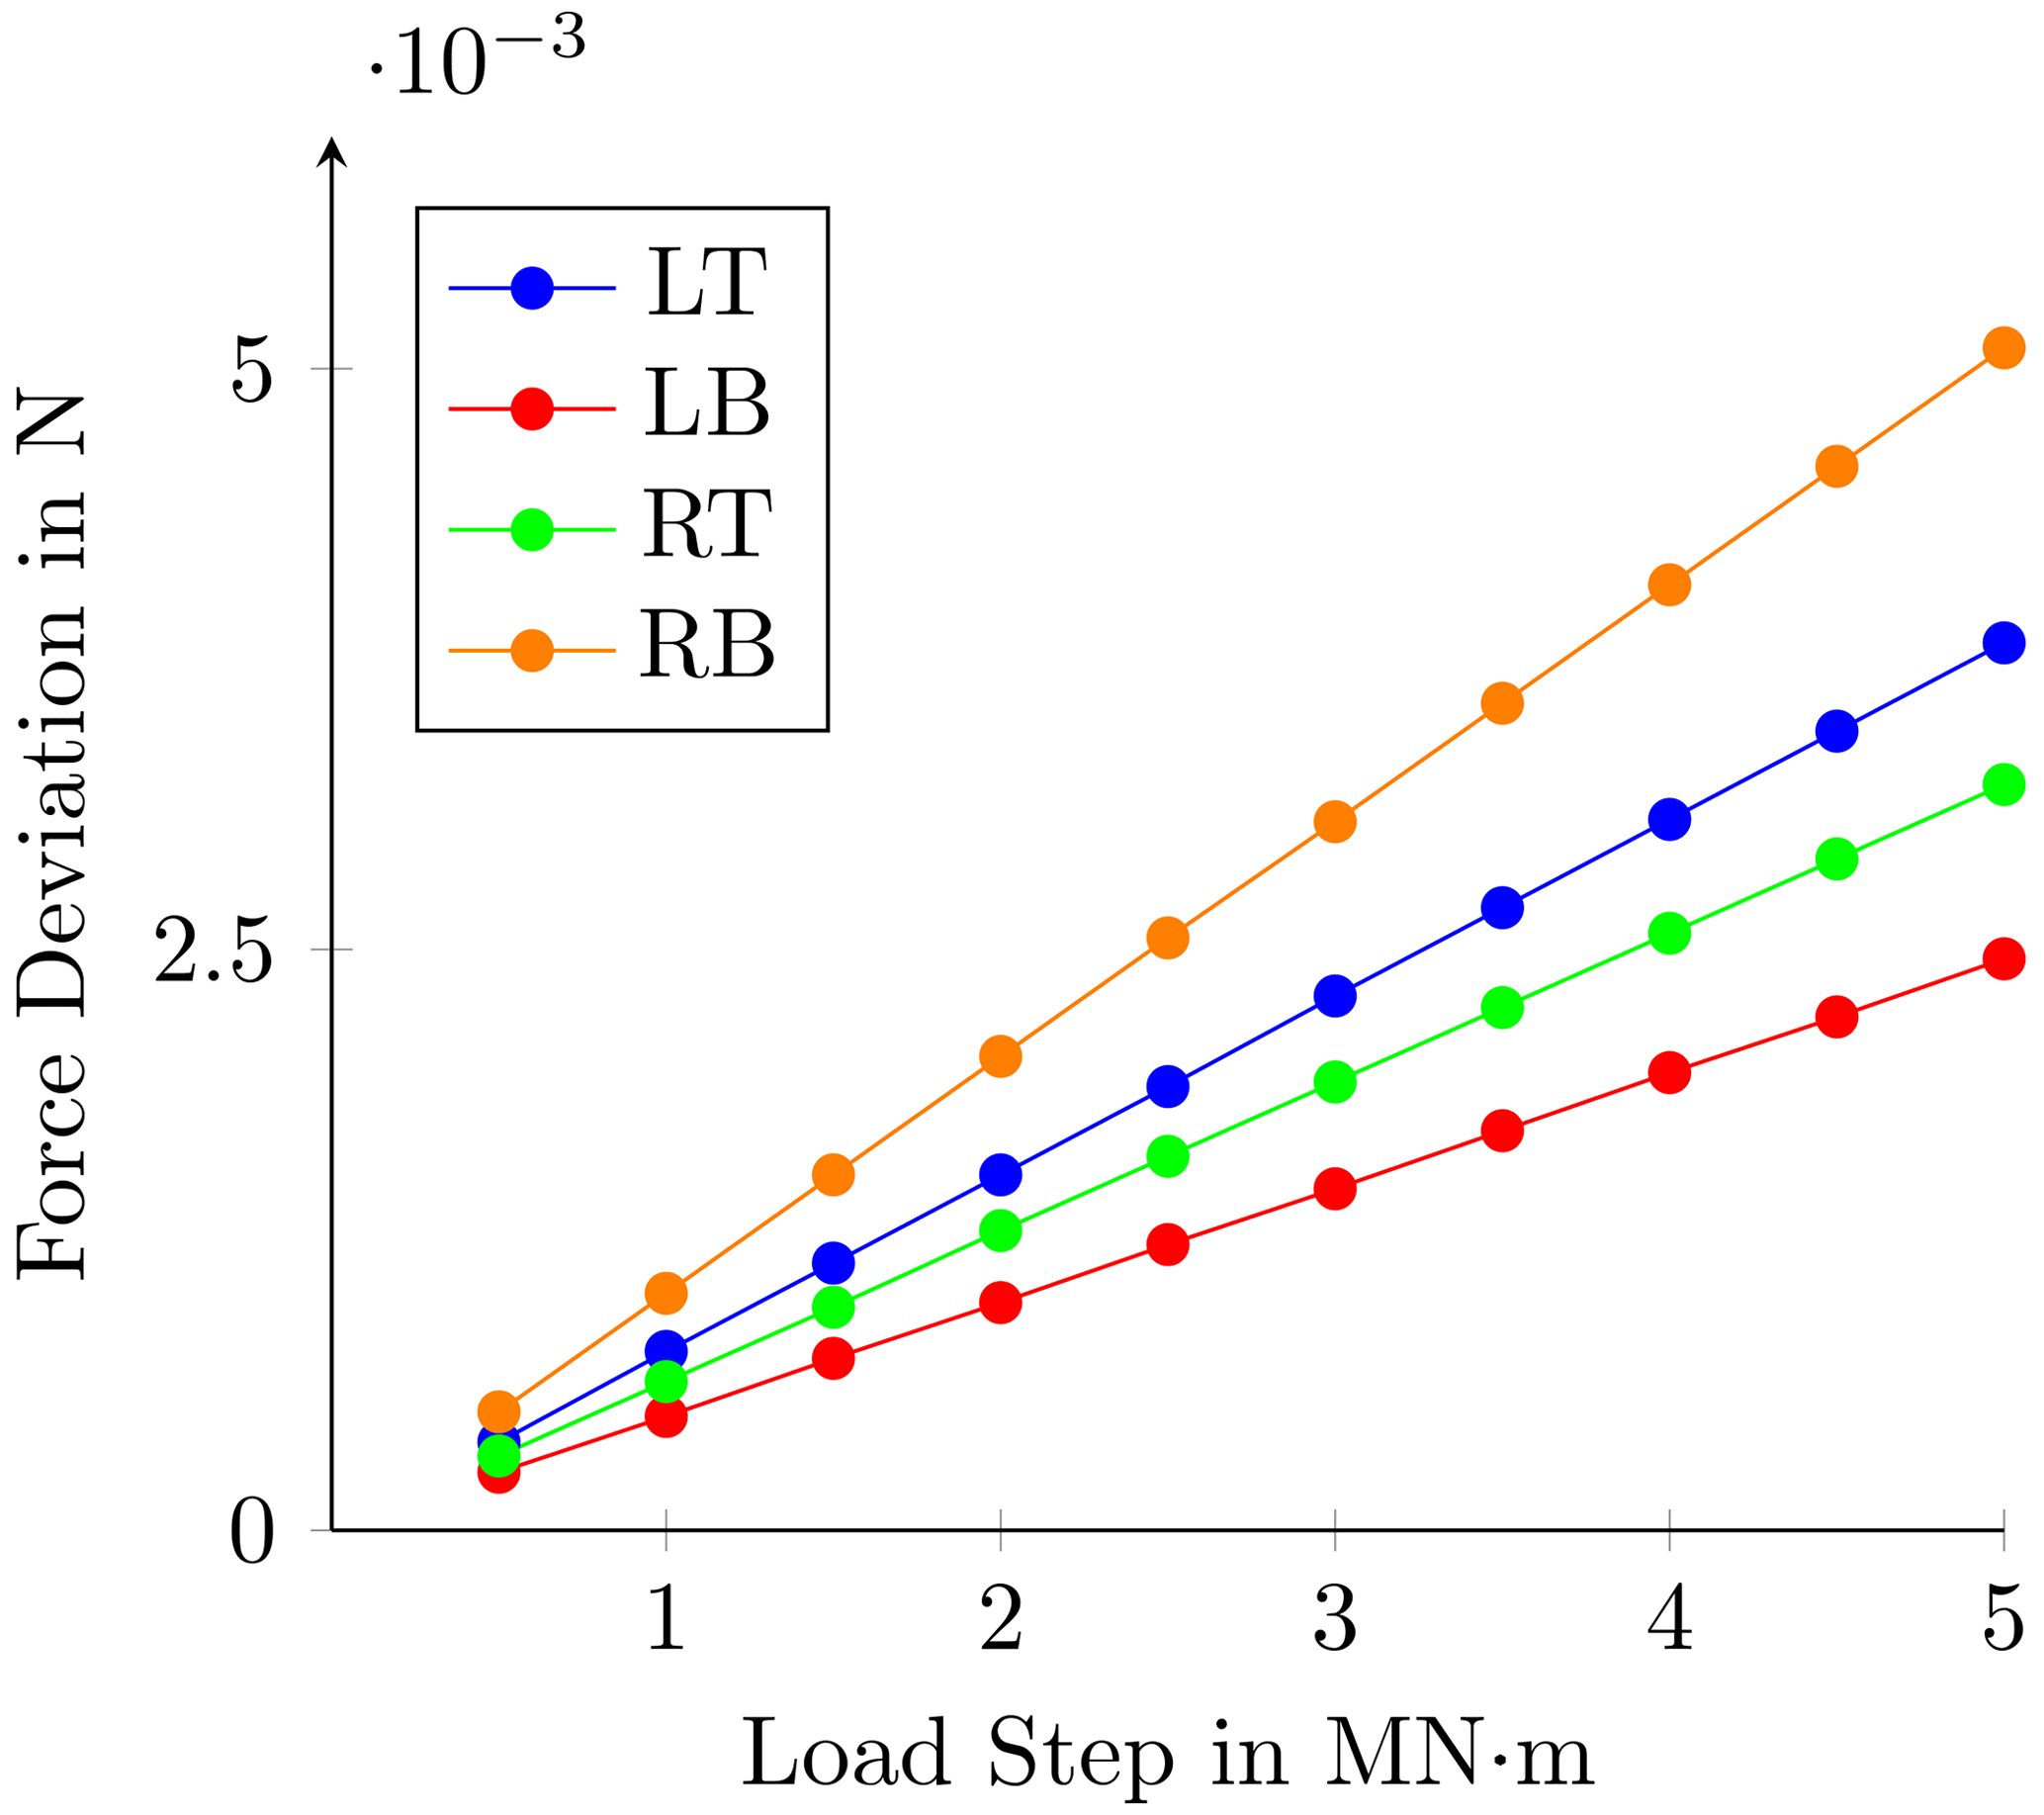
The lacking experimental data for verifying a FE analysis are used to show that the measurement principle works in theory. This FE validation follows the same procedure as described in Sect. 2.1. First, the CSU is analysed by applying FT and TM on the MF. The displacement and the rotation are calculated in FE and used to determine the FT and TM FE stiffness. Next, the FE analysis investigates the displacement of the retro reflector position. The lever rotation is calculated from the retro reflector displacement and determines the MF displacement and rotation with the found elasticity factor. With the aforementioned FE stiffness, FT and TM can be found in FE at each MF for several load steps. This measurement, performed in FE, can be used to compare the FE results directly probed at MF. Figures 10 and 11 depict the FE measurement results and the probes from FE. On the x axis, all MF are listed, with LT meaning top left and RB meaning bottom right. In both diagrams, the square marker show the FE probes of force and torque at all MF, while the cross-shaped markers present the force measurement if the forces had been calculated from displacement and stiffness. For the FT measurement, the probes and the measurement values are very close. The maximum deviation is −6.4 %. For the torque measurement, there are three different markers. The square markers show the FE probes at all MFs, and the asterisk markers show the calculation performed with a stiffness measurement that leaves out the additional axial force. The deviation is unacceptable and gives a deviation of around −36.7 %. After the measurement was repeated with axial forces combined, the torque probes and measurement values came closer and are presented with cross-shaped markers. The maximum deviation is −7.8 %.
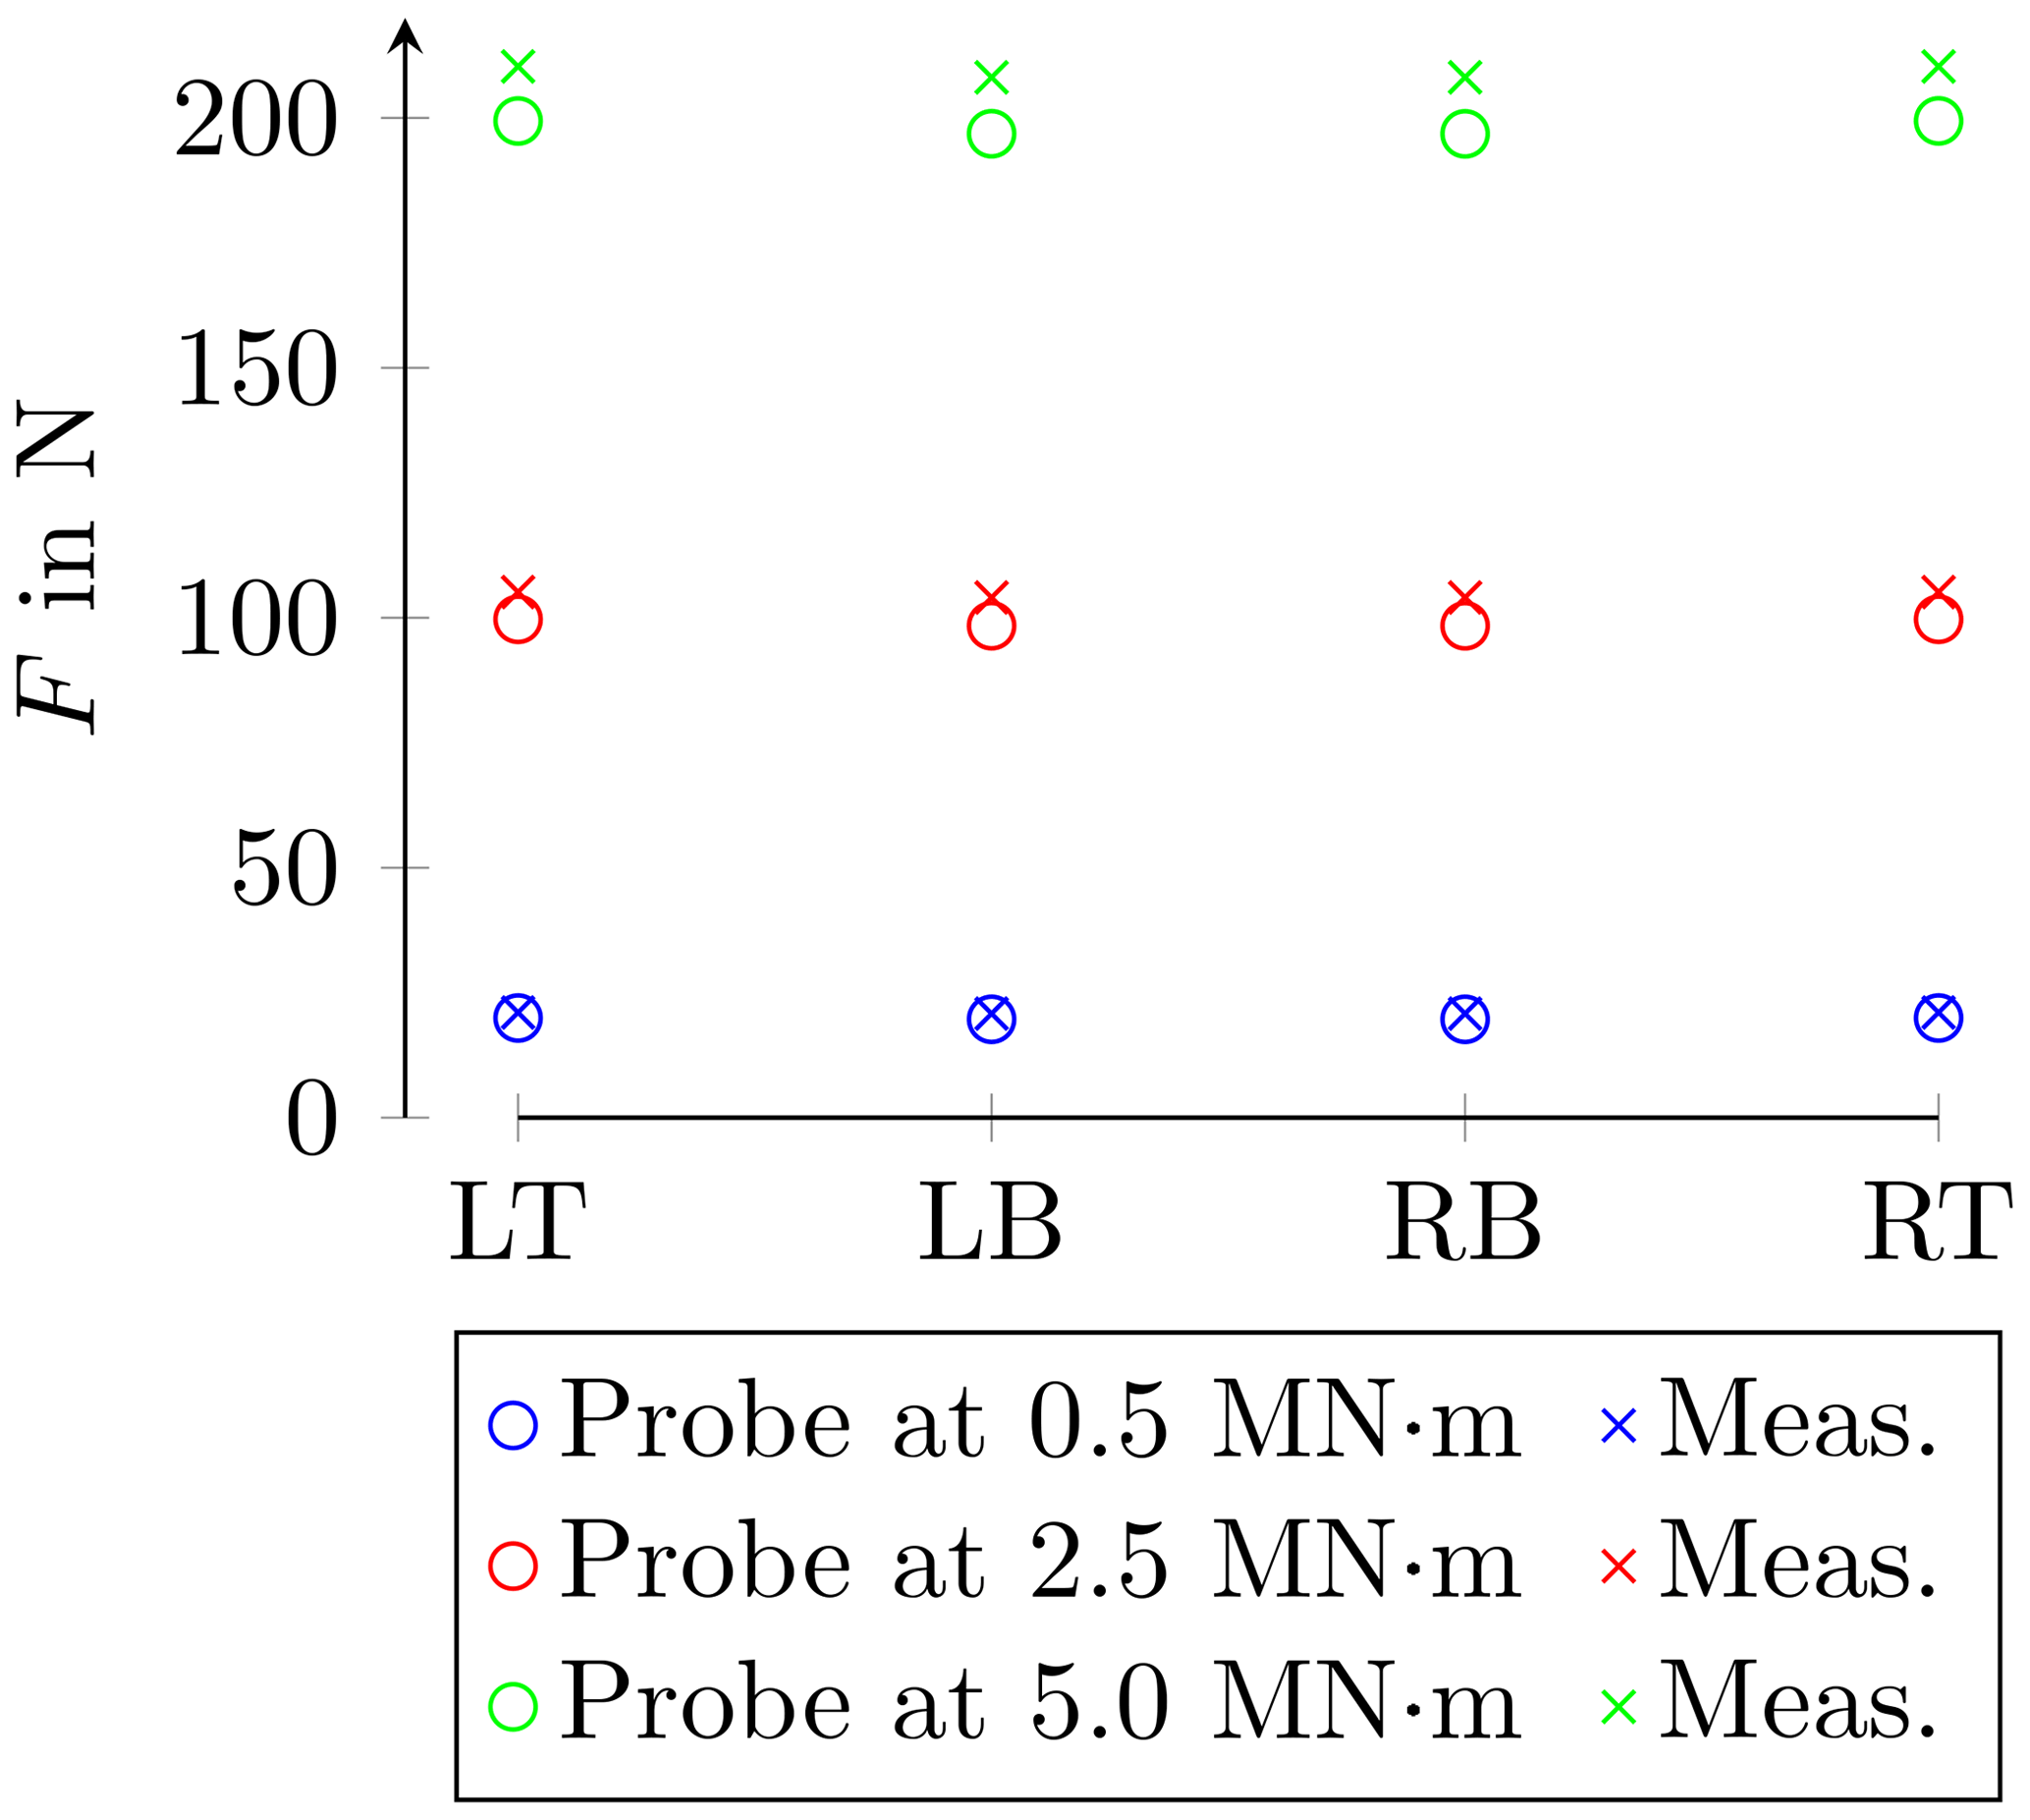
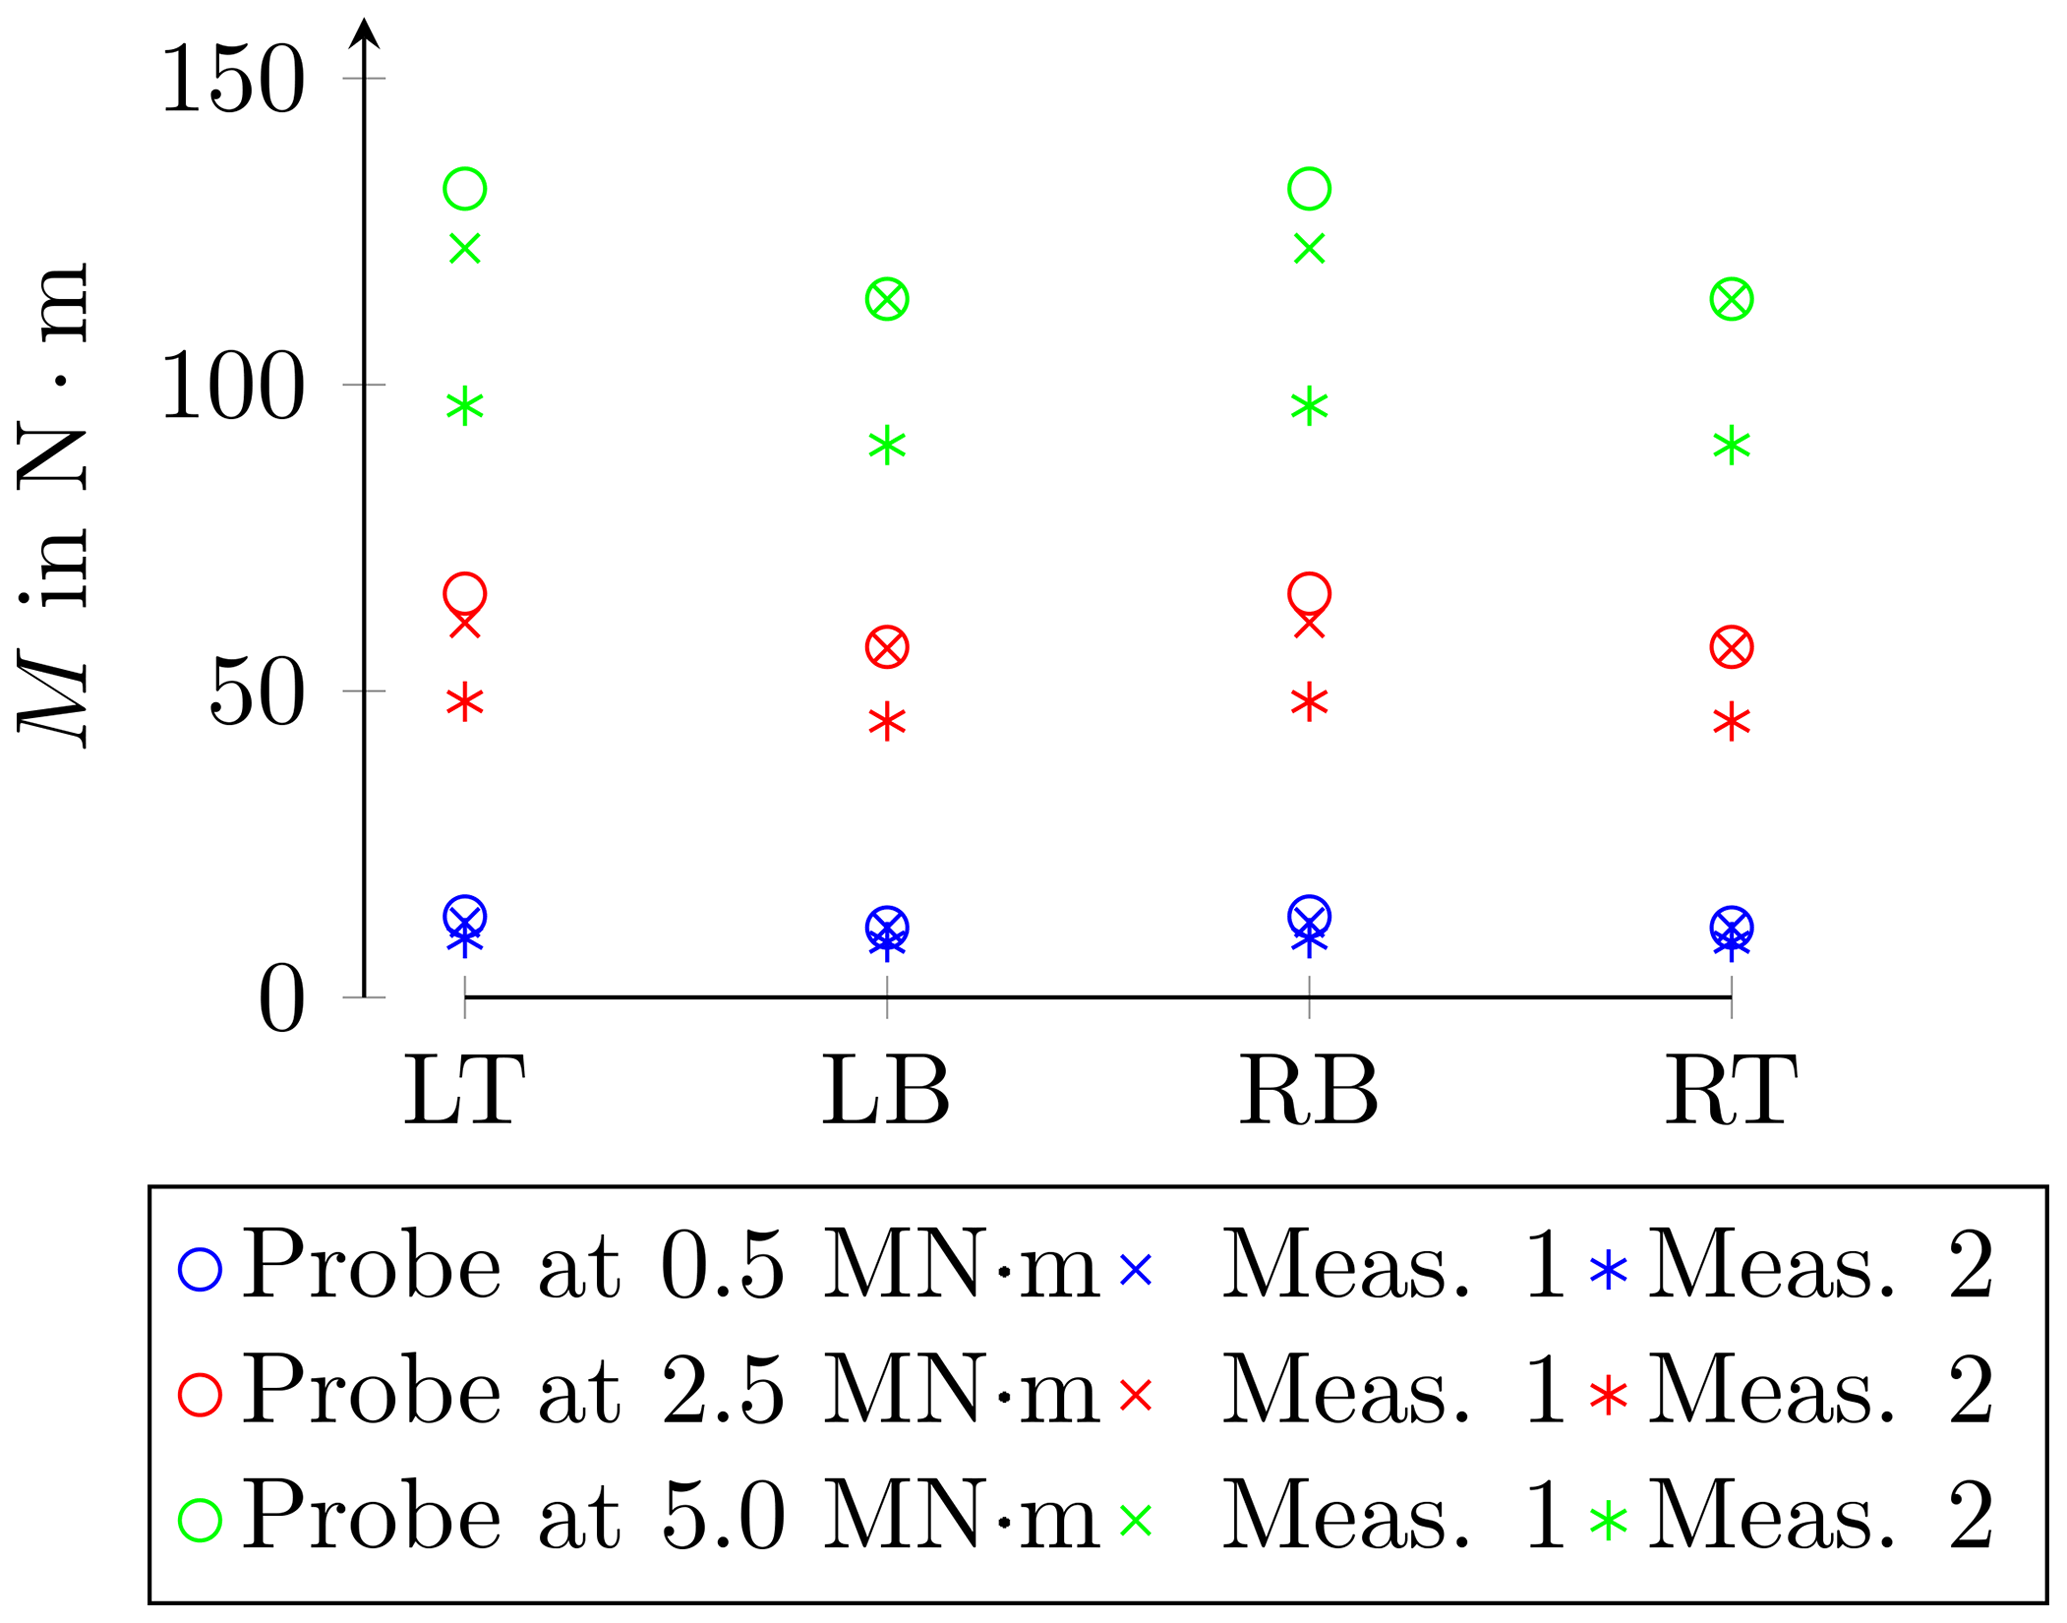
Table 5Calibration torque moment measurement uncertainty reduction by the MF measurement.
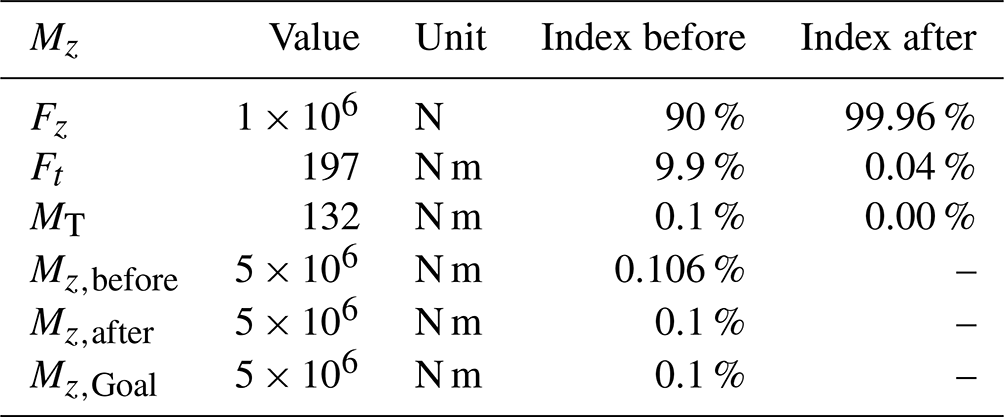
An alternative method to using strain gauges is presented in this paper. The method shows how to measure calibration torque moment shunts in the 5 MN m TSM using a displacement measurement with an interferometer and the predefined stiffness. All measurement uncertainty influences were analysed and quantified. The paper shows that the measurement uncertainty of the FT measurement at the MF ranges from 0.6 % to 3 %. The measurement uncertainty of the TM measurement stays constant at 1.7 %. The dominating measurement uncertainty influence is the stiffness determination in the CSU, which must be improved if a better accuracy is needed. FE analyses were performed to show that the suggested measurement principle works in theory.
Even though the measurement uncertainty is rather high compared to uncertainties known from ordinary strain-gauge-based sensors, it is a useful measurement technique regarding the effect on the calibration torque moment uncertainty of the torque standard machine. Table 5 depicts the indices from the calibration torque moment shunt with and without FT and TM measurements at the MFs and shows how much the measurement uncertainty was decreased. The contribution of FT and TM measurements is reduced. Applying this measurement method will shift the focus of future measurement uncertainty analyses to the biggest measurement uncertainty contribution of TSM, namely the reference force transducers. Further reduction in the calibration torque moment will only be possible if the uncertainty of the force transducers can be reduced. Future investigations must prove the practicability of the presented MF measurement method. In particular, the measurement flexure stiffness determination must be carefully compared to the results of the finite element analysis. Furthermore, a way must be found to verify the correction terms for the measurement flexure displacement and twist as the values are only computed in a simulation. A possible solution would be to measure the displacement with the less precise absolute laser tracker, which might be optimised if more precise length measurement devices are available.
| CSU | Calibration set-up |
| DUC | Device under calibration |
| FE | Finite element |
| FT | Transversal force |
| LS1 | Load scenario 1 |
| LS2 | Load scenario 2 |
| MF | Measurement flexure |
| MUB | Measurement uncertainty budget |
| RP | Reference point |
| TM | Torque moment |
| TSM | Torque standard moment |
The data set for this publication can be accessed in https://doi.org/10.7795/710.20220715 (Geva et al., 2022).
KG led the editing and review process and contributed to the investigation and writing of the original draft. HK created the conceptual idea. CS and RK reviewed the paper.
The contact author has declared that neither they nor their co-authors have any competing interests.
Publisher's note: Copernicus Publications remains neutral with regard to jurisdictional claims in published maps and institutional affiliations.
This article is part of the special issue “Sensors and Measurement Science International SMSI 2021”. It is a result of the Sensor and Measurement Science International, 3–6 May 2021.
The authors want to thank the Projektträger Jülich (PTJ) and the Bundesministerium für Wirtschaft (BMWI) for funding this project (grant no. 0325945).
This research has been supported by the Bundesministerium für Wirtschaft und Energie (grant no. 0325945).
This open-access publication was funded by the Physikalisch-Technische Bundesanstalt.
This paper was edited by Klaus-Dieter Sommer and reviewed by two anonymous referees.
Baumgarten, S.: 2.1.3 – Mehrkomponentenmesseinrichtung für Kräfte bis 1 MN und Drehmoment bis 2 kN m – Funktionsprinzip und Messunsicherheitsbudget, in: Tagungsband, AMA Service GmbH, Von-Münchhausen-Str. 49, 31515 Wunstorf, Germany, 107–111, https://doi.org/10.5162/sensoren2016/2.1.3, 2016. a
Cui, J., Kumme, R., and Kahmann, H.: A new method for the calibration of strain cylinders using laser interferometry, ACTA IMEKO, 8, 25–32, https://doi.org/10.21014/acta_imeko.v8i1.659, 2019. a
Geva, K., Kahmann, H., Schlegel, C., and Kumme, R.: Analysis of the measurement uncertainty of a new measurement flexure calibration set-up, ACTA IMEKO, 9, 173–178, https://doi.org/10.21014/acta_imeko.v9i5.963, 2020. a
Geva, K., Kahmann, H., Schlegel, C., and Kumme, R.: Data set for measurement uncertainty analysis of a measurement flexure hinge in a torque standard machine, PTB Open Access Repository [data set], https://doi.org/10.7795/710.20220715, 2022. a
Kahmann, H., Schlegel, C., Kumme, R., and Röske, D.: Principle and design of a 5 MN m torque standard machine, in: Proceedings of IMEKO 2017 TC3, https://www.imeko.org/publications/tc3-2017/IMEKO-TC3-2017-037.pdf (last access: 17 June 2022), 2017. a
Schlegel, C., Kahmann, H., and Kumme, R.: MN m torque calibration for nacelle test benches using transfer standards, ACTA IMEKO, 5, 12–18, https://doi.org/10.21014/acta_imeko.v5i4.414, 2016. a