the Creative Commons Attribution 4.0 License.
the Creative Commons Attribution 4.0 License.
 | 01 Aug 2022
Towards efficient application-dependent dimensional measurements with computed tomography: optimized reduction of measurement duration using continuous scan mode: experimental investigations
Christian Orgeldinger
Florian Wohlgemuth
Andreas Michael Müller
Due to the complex physical and technical relationships in dimensional X-ray computed tomography measurement technology, the precise influences on the measurement result are still not fully understood. A deeper understanding of these influences is essential in order to improve the measurement accuracy and economy of computed tomographic measurement systems. In addition, this enables better numerical determination of measurement uncertainties, which is also a topic of current research. Two factors that have a significant influence on the lead times are the scan mode and the number of projections per measurement. In this article, these factors are investigated experimentally using a calibrated workpiece, and the influence of the workpiece position on the measurement result is also examined. It can be shown that the workpiece position has a considerable influence on the quality of the measurement, especially in the case of a continuous scan. The results show a vast potential for application-dependent reduction of lead times.
- Article
(1542 KB) - Full-text XML
- BibTeX
- EndNote


Industrial X-ray computed tomography (CT) has become increasingly important in recent years due to its many advantages. Examples include the nondestructive testing of internal geometries and the option of combining dimensional measurements with material quality control (Kruth et al., 2011; Carmignato et al., 2018; Withers, 2021). As a result, the number of industrial applications and new systems is also increasing sharply. An overview of the state of the art is summarized in De Chiffre et al. (2014), Kruth et al. (2011), Carmignato et al. (2018) and Withers et al. (2021). Despite the enormous progress, the description of the complex physical influencing factors as well as the time-consuming determination of the measurement uncertainty and the long throughput times remain difficulties in CT measurement technology. Since the measurement uncertainty determination according to VDI/VDE 2630 Part 2.1 (VDI/VDE, 2015) is very time-consuming, approaches in which the measurement uncertainties are determined numerically have been researched. These are based, for example, on the bootstrap method (Hiller et al., 2014) or a Monte Carlo simulation with a digital twin (Wohlgemuth et al., 2018). For this, it is necessary to be able to distinguish the decisive factors influencing the measurement results from one another as well as possible. In previous work, the authors examined the influence of detector unsharpness and focal spot size in CT systems (Orgeldinger et al., 2019). Within the scope of this work, the influence of the scan mode used, the number of projections and the eccentricity of the workpiece is investigated, as these factors have a direct influence on the measurement time and thus the efficiency of CT measurement systems. So far, the influence of a continuous scan has been studied almost exclusively in medical imaging (Meier et al., 2020; Siman and Kappadath, 2017; Picone et al., 2021). An investigation by Fischer et al. (2017) only investigated the continuous scan mode as an influencing factor among many, and did not systematically study the influence of the positioning or projection number for the continuous scan mode (Fischer et al., 2017). Furthermore, the influence of angle-of-rotation deviations on the reconstruction has been examined, and methods for determining the angular increment have been derived from this (Fu et al., 2010). However, to the best of the authors' knowledge, the quantitative influence of the number of projections and workpiece position on the measurement result in continuous scan mode for dimensional industrial X-ray CT still represents a research gap. Therefore, the first part of this work deals with the experimental investigation of these relationships. In part two, the relationships are investigated using a numerical simulation of the CT system in order to develop a general method to determine economic measurement settings.
Currently, most systems in dimensional CT measurement technology work according to the start-stop principle. Each image position is approached individually and the turntable is only moved between successive image acquisitions. In contrast to this, the measuring time can be reduced considerably in the continuous measuring mode by rotating the turntable at a constant angular velocity. Many manufacturers of industrial CT devices have added such a scan mode in recent years. In this continuous scan mode, the rotation during the individual image acquisitions creates a motion blur. However, it can be assumed that this only has a negative impact on the measurement result if the blurring resulting from the movement is at least of a similar order of magnitude to the amount of unsharpness caused by the detector (the X-ray spot is sufficiently small to neglect spot blurring for our experiments). The geometric uncertainty contribution of a projected object point with a maximum distance Rmax to the axis of rotation on the detector can be derived simply from the geometric arrangement of the system. An overview of the resulting distances is given in Fig. 1.
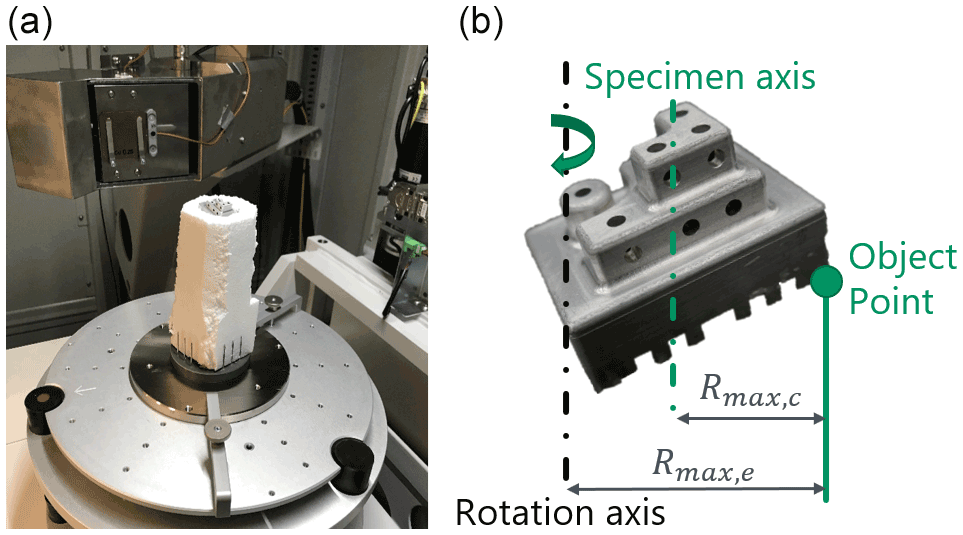
Figure 1Clamping of the specimen on the rotary table of the CT system (a) and representation of the dependence of the resulting distance on the clamping (b) in the eccentric case. For centric clamping, the axis of rotation and specimen axis coincide.
Here, the worst case is considered, in which the velocity vector of the object point is parallel to the detector and the point movement perpendicular to the X-ray beam path is assumed to be the length of the arc segment. Due to the small changes in angular position during a single shot, this represents a sufficiently precise approximation. The velocity parallel to the detector has a maximum value given by the tangential velocity of the object:
Here, τ is the acquisition time of one projection, M the magnification and Rmax the (maximum) distance between the object point and the location of the axis of rotation. n is the number of projections. As seen on the detector, an object point travels during one projection. The resulting blurring σR during one shot is calculated as follows:
This depends on the selected number of projections n, as the angular rotation during one image acquisition is inversely proportional to n. If the resulting blurring is required to be smaller than the detector blurring σD described in Orgeldinger et al. (2019), a minimum number of projections nmin can be specified:
With higher projection numbers, no major deterioration in the measurement quality compared to a start-stop measurement would be expected from a geometric point of view. Thus, depending on the component dimensions, a limit projection number for the continuous scan mode, up to which a reliable measurement is guaranteed, could be determined without experimental effort.
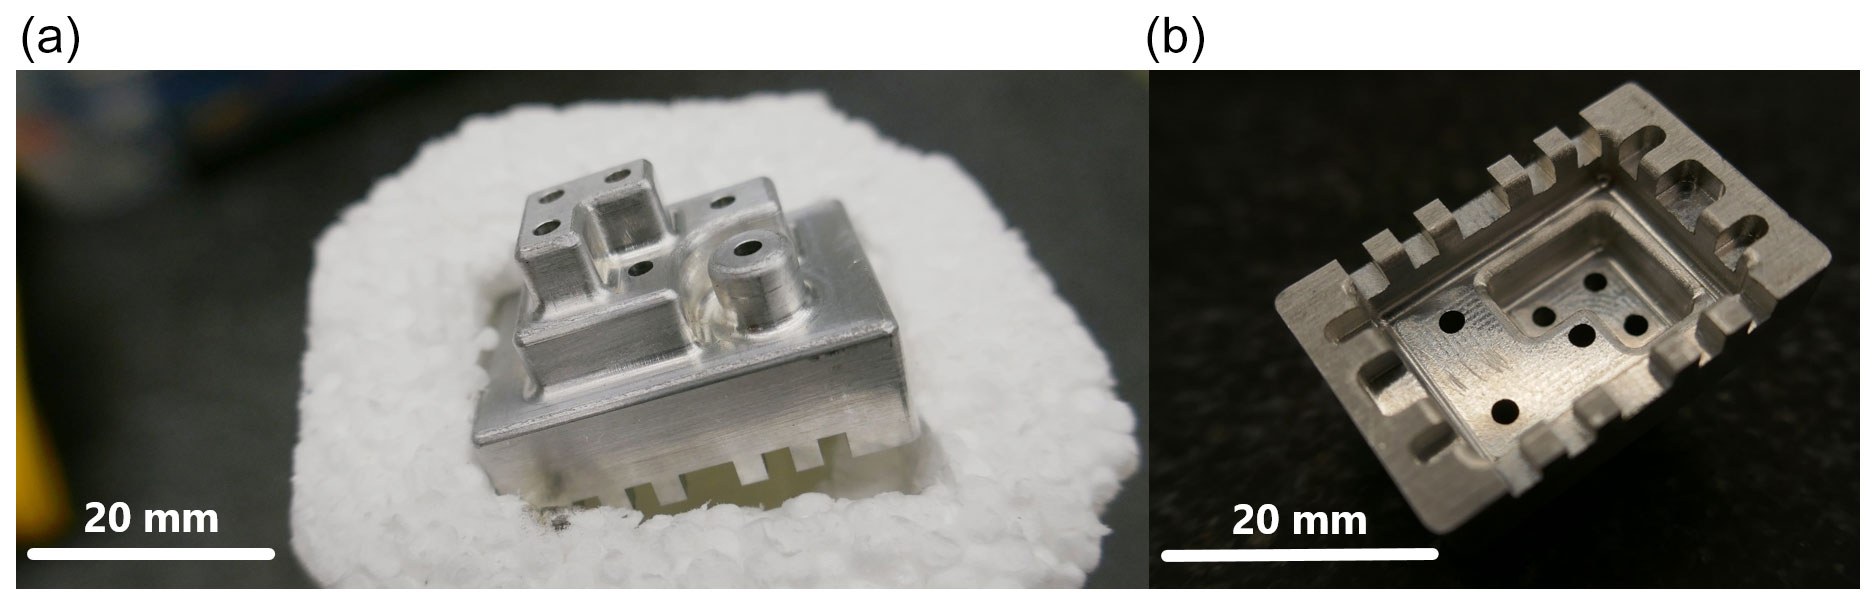
Figure 2Used aluminium test specimen (Zierer, 2013) clamped in the Styrofoam holder in the measuring system: top view (a) and bottom view (b).
In order to examine the influence of the measurement strategy, the number of projections and the eccentricity of the workpiece, measurements in continuous scan mode as well as in start-stop scan mode with centric and eccentric clamping of the test specimen are carried out by using different numbers of projections. The eccentricity is set to approximately 20 mm in this case. The experimental setup for this case can be seen in Fig 1. To determine the maximum object distance Rmax from the axis of rotation, the finite dimensions of the test body must also be considered in both cases. All measurements are made at a geometric magnification of M=4.11 (45 µm voxel size). The CT system used is a Zeiss Metrotom 1500, where the detector unsharpness was evaluated as σD≈0.6 mm. The number of projections is significantly below the operating-software-suggested value of 1400, and thus it should be mentioned that the CT system is operated outside of its specification. To enable a quantitative comparison, a test specimen (dimensions 20 mm × 20 mm × 30 mm) made of aluminum is used, as shown in Fig. 2. A detailed description of the test specimen can be found in Zierer (2013). The test specimen was calibrated on a Zeiss UPMC 1200 Carat S-ACC with an existing accreditation for dimensional measurements according to DIN EN ISO/IEC 17025:2018.
The tube is operated at a tube power of 32.4 W with 180 kV and 180 µA. The detector uses an exposure time of 1000 ms and 16× gain. Twenty measurement repetitions are carried out for each configuration to ensure sufficient statistics. To determine the measurement uncertainty using the experimental method as described in VDI 2630 Part 2.1 (VDI/VDE, 2015), standard deviations and measurement deviations for 48 lengths, 29 radii and 29 roundnesses are evaluated using VGSTUDIO MAX and MATLAB. To do this, the systematic and random measurement errors are determined for each of the measured variables from the 20 measurements. The errors of all measured variables are then averaged in order to obtain statistically meaningful relationships. It needs to be stated that the measured variables used are all of a similar order of magnitude.
Figure 3 shows the average systematic measurement error (bias) of the distance measurements, while Fig. 4 shows the average random measurement error (standard deviation). At this point, it should be mentioned that the representations used in the graphs are only shown for clarity: it can be assumed that the curves behave nonlinearly between the measured points. Both errors display similar behavior. The random error is a factor of about three larger than the systematic error. Above 600 projections, the continuous and start-stop modes are indistinguishable for centric clamping. Eccentric clamping only leads to clearly higher random errors for the continuous scan mode. The systematic measurement error also slightly increases for the start-stop mode in the case of eccentric clamping and a low projection number; the effect for the continuous scan mode is, however, more pronounced. The results are similar for the measured radii (Figs. 5 and 6) and roundness (Fig. 7). For the roundness, the measured value is, however, below the measurement uncertainty of the calibration measurement. The evaluation of the systematic measurement deviations for very small roundness deviations is therefore not expedient. The random measurement error shows the expected behavior.
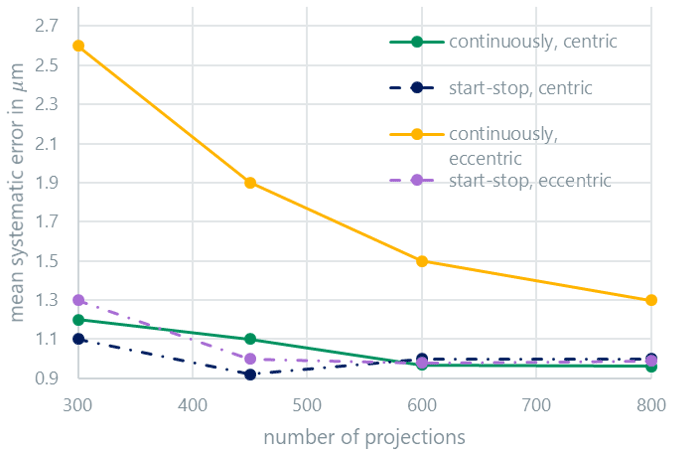
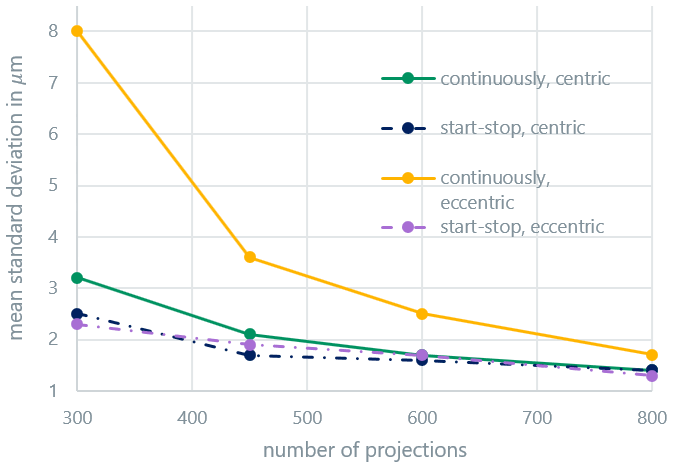
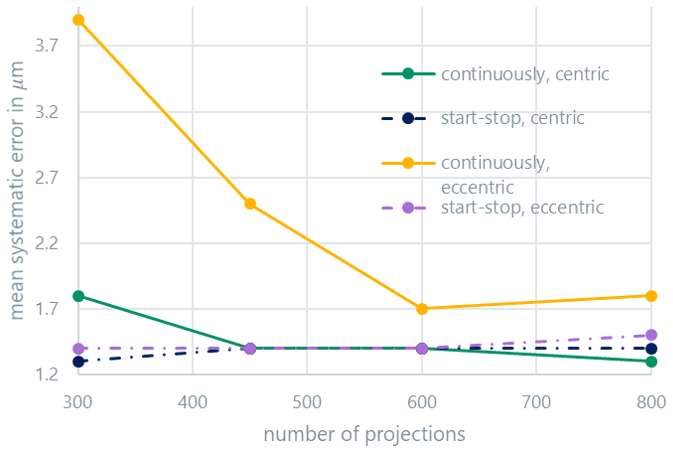
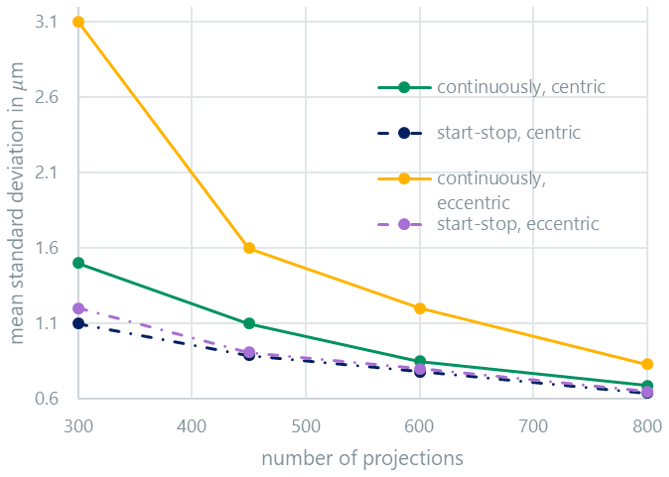

If the number of projections is very low, the measurement accuracy additionally deteriorates due to the lack of data for the reconstruction process. With projection numbers over 800, no additional improvement in the systematic and random errors is achieved in further experiments for centric clamping. While the measurement in the start-stop mode is nearly independent of the clamping position of the workpiece and only depends on the number of projections, the eccentricity significantly influences the measurement quality in the continuous scan mode. The differences between the scan modes become significantly smaller with an increasing number of projections, especially for centric clamping. It can be assumed that from the point at which the continuous measurement leads to results similar to the start-stop measurement, the mode used no longer has any influence on the measurement results, and any further improvement with more projections is only a result of improved reconstruction quality with higher sampling. The minimum projection number from Eq. (3) for the centric case is . Due to the workpiece dimensions, the maximum distance from the axis of rotation, mm (compare to Fig. 1), is assumed. For the eccentric case, the minimum projection number is estimated with a distance mm as . The approximate limit value for the number of projections fits comparatively well with the experimental results for the centric case. For the eccentric case, all measurements are below the limit projection number and show a clear difference between the continuous and discontinuous scan modes.
Both the workpiece–rotation axis distance and the number of projections have a decisive influence on the difference between the start-stop and continuous scan modes. This is important because both the number of projections and the scan mode have a considerable influence on the measurement duration and thus have the potential to be optimized in industrial applications. For small and centrally clamped workpieces, for example, the throughput time could be reduced significantly without any major loss of information. In order to be able to determine the minimum number of projections required in continuous mode, a rule of thumb that allows an initial setting to be made was presented within the scope of this work. The limit values defined from purely geometric considerations showed good agreement with the experimental data. In order to further validate the methodology presented, additional measurements should be made with different test bodies and variable eccentricities. Furthermore, there is great potential to determine the most economical settings by simulating the measurement process in order to reduce the considerable experimental effort. A concept for this is currently being worked on. The data determined could also be used to improve the simulation of measurement uncertainties within a Monte Carlo simulation. The results show that even outside of specification, the continuous scan mode of the Zeiss Metrotom 1500 can still perform as well as the discontinuous scan mode, depending on the measurement part, eccentricity and measurand.
Due to the size of CT data, the data cannot be put into a public repository. Please contact the authors for data requests.
CO and FW were responsible for conceptualization (1), data curation (2), formal analysis (3), methodology (6) as well as validation (11) and review (14). Further, CO conducted the investigation (5), software (9), visualization (12) and writing (13). AMM contributed to the software (9), supervision (10), and the review and editing process (14). TH contributed to funding acquisition (4), resources (8), supervision (10), and the review and editing process (14). All authors have reviewed, edited and read the manuscript as well as approved the final version (CASRAI, 2021).
The contact author has declared that none of the authors has any competing interests.
Publisher's note: Copernicus Publications remains neutral with regard to jurisdictional claims in published maps and institutional affiliations.
This article is part of the special issue “Sensors and Measurement Science International SMSI 2021”. It is a result of the Sensor and Measurement Science International, 3–6 May 2021.
The authors would like to thank the German Research Foundation (DFG) for the financial support of the acquisition of the CT system Zeiss Metrotom 1500 through grant no. 324672600.
This paper was edited by Stefan J. Rupitsch and reviewed by two anonymous referees.
Carmignato, S., Dewulf, W., and Leach, R. (Eds.): Industrial X-Ray Computed Tomography, Springer International Publishing, https://doi.org/10.1007/978-3-319-59573-3, 2018.
CASRAI CRediT: Taxonomy of Contributor Roles, https://casrai.org/credit/, last access: 12 May 2021.
De Chiffre, L., Carmignato, S., Kruth, J. P., Schmitt, R., and Weckenmann, A.: Industrial applications of computed tomography, CIRP Ann., 63, 655–677, https://doi.org/10.1016/j.cirp.2014.05.011, 2014.
Fischer, T., Salzinger, M., Heinz, D., and Hiller, J.: Quantitative Untersuchung zur Reduzierung der Messzeit in der dimensionellen Computertomographie, Bavar. J. Appl. Sci. 3, 282–296, https://doi.org/10.25929/JY3V-PM72, 2017.
Fu, J., Jiang, B., Li, B., Li, P., and Wang, Q.: Methods Determining the Angular Increment of A Continuous Scan Cone-Beam CT System, IEEE T. Nucl. Sci., 57, 1071–1076, https://doi.org/10.1109/TNS.2010.2044662, 2010.
Hiller, J., Genta, G., Barbato, G., De Chiffre, L., and Levi, R.: Measurement uncertainty evaluation in dimensional X-ray computed tomography using the bootstrap method, Int. J. Precis. Eng. Manuf., 15, 617–622, https://doi.org/10.1007/s12541-014-0379-9, 2014.
Kruth, J. P., Bartscher, M., Carmignato, S., Schmitt, R., De Chiffre, L., and Weckenmann, A.: Computed tomography for dimensional metrology, CIRP Ann.-Manufact. Technol., 60, 821-842, https://doi.org/10.1016/j.cirp.2011.05.006, 2011.
Meier, J. G., Erasmus, J. J., Gladish, G. W., Peterson, C. B., Diab, R. H., and Mawlawi, O. R.: Characterization of continuous bed motion effects on patient breathing and respiratory motion correction in PET/CT imaging, J. Appl. Clin. Med. Phys., 21, 158–165, https://doi.org/10.1002/acm2.12785, 2020.
Orgeldinger, C., Wohlgemuth, F., Müller, A. M., and Hausotte, T.: Spot size and detector unsharpness determination for numerical measurement uncertainty determination, in: 9th Conference on Industrial Computed Tomography (iCT), 13–15 February 2019, Padova, Italy, https://www.ndt.net/article/ctc2019/papers/iCT2019_Full_paper_12.pdf (last access: 23 July 2022), 2019.
Picone, V., Makris, N., Boutevin, F., Roy, S., Playe, M., and Soussan, M.: Clinical validation of time reduction strategy in continuous step-and-shoot mode during SPECT acquisition, EJNMMI Phys., 8, 10, https://doi.org/10.1186/s40658-021-00354-x, 2021.
Siman, W. and Kappadath, S. C.: Comparison of Step-and-Shoot and Continuous-Bed-Motion PET Modes of Acquisition for Limited-View Organ Scans, J. Nucl. Med. Technol., 45, 290–296, https://doi.org/10.2967/jnmt.117.195438, 2017.
VDI/VDE: 2630 Part 2.1: Computed tomography in dimensional measurement, Determination of the uncertainty of measurement and the test process suitability of coordinate measurement systems with CT sensors, Beuth, 2015.
Withers, P. J., Bouman, C., Carmignato, S., Cnudde, V., Grimaldi, D., Hagen, C. K., Maire, E., Manley, M., Du Plessis, A., and Stock, S. R.: X-ray computed tomography, Nat. Rev. Meth. Prim., 1, 18, https://doi.org/10.1038/s43586-021-00015-4, 2021.
Wohlgemuth, F., Müller, A. M., and Hausotte, T.: Development of a virtual metrological CT for numerical measurement uncertainty determination using aRTist 2, Tech. Messen, 85, 728–737, https://doi.org/10.1515/teme-2018-0044, 2018.
Zierer, P.: Entwicklung eines Multi-Material-Prüfkörpers für die industrielle Computertomographie, Student thesis at the Institute of Manufacturing Metrology, University of Erlangen-Nürnberg, Erlangen-Nürnberg, 2013.