the Creative Commons Attribution 4.0 License.
the Creative Commons Attribution 4.0 License.
 | 23 Feb 2022
Particularities of pyroelectric detectors in absolute measurements of chopped radiation shown for the example of a spectral responsivity calibration in the near- and mid-infrared spectral range at two primary radiometric standards
Tobias Pohl
Peter Meindl
Jörg Hollandt
Uwe Johannsen
Lutz Werner
The Physikalisch-Technische Bundesanstalt (PTB) expanded its capabilities for the calibration of the spectral responsivity s(λ) in the spectral range between 1.5 µm and 14 µm, traceable to the International System of Units (SI), with pyroelectric detectors as transfer standards. The pyroelectric transfer standards were calibrated absolutely against two independent primary radiometric standards, regarding their spectral responsivity s(λ). The first approach uses infrared laser sources at one of the PTB's cryogenic substitution radiometer facilities, which is a primary detector standard for the measurement of radiant power. The second approach uses a blackbody radiator with a temperature of about 1200 K, whose radiation can be calculated by Planck's law and is, in addition, spectrally selected by accurately characterized optical bandpass filters.
Due to their measurement principle, pyroelectric detectors can only measure temporal changes in the input radiant power and are, therefore, operated with a chopper wheel to chop the incident radiation. The detector signal, which is typically measured with a lock-in amplifier, depends not only on the amplitude but also on the temporal shape of the chopped radiant power. It is shown that the calculation of the radiant power used for the determination of the spectral responsivity must be based on an accurate approximation of the temporal shape of the chopped radiant flux at the detector. This shape is different for both applied primary methods. It is further shown that the particularities of the lock-in-technique have to be considered in the calculation of the spectral responsivity, including the correct calculation of the detector signal.
The results of the calibration with both approaches are consistent, and the realized measurement uncertainty is in the range between 1 % and 14 %. The pyroelectric detectors were thereby established as transfer detectors for the SI traceable measurement of radiant power in the near-infrared (NIR) and mid-infrared (MIR).
- Article
(442 KB) - Full-text XML
- BibTeX
- EndNote


The Physikalisch-Technische Bundesanstalt (PTB) runs different primary standards to conduct absolute measurements of the spectral responsivity s(λ) of radiation detectors traceable to the International System of Units (SI). The spectral responsivity s(λ) is defined by the ratio between the output signal of the detector and the received radiant power Φ. The various types of primary standards offer individual advantages. The following two of these standards will be covered in this paper:
-
Cryogenic electrical substitution radiometers have been well-established primary detector standards for absolute detector calibrations at the PTB for several years. They measure radiant power traceable to the SI with low uncertainty. The detector calibration for their spectral responsivity is done by relating the output of the detector under test to the measured radiant power (Pohl et al., 2019).
-
Lately, a second approach for SI traceable detector calibrations was established at the PTB by using a primary source standard (Pohl et al., 2021). The radiation of a blackbody can be calculated by Planck's law and is, additionally, spectrally selected by optical bandpass filters and then related to the corresponding detector output signal.
Suitable detectors which have been calibrated against the primary standards can also be utilized as transfer standards for the dissemination of the spectral responsivity from the primary standards to other detectors. Thus, SI traceable calibrations of customer devices against these transfer standards require a much lower effort than a direct calibration against the primary standard.
The PTB uses different types of such transfer detectors for different wavelength ranges. Partially, thermal detectors are applied at wavelengths above 1.5 µm. The measurement principle of these detectors is based on the heating effect of an absorber. Hence, the detector responsivity is wavelength independent, as long as the absorption of the incident radiant power is independent of the wavelength and no other spectrally selective element (e.g. a window) is applied (Taubert et al., 2017).
The PTB already uses thermopile detectors as near-infrared (NIR) and mid-infrared (MIR) transfer detectors (Pohl et al., 2019). This paper describes the calibration of two pyroelectric detectors, regarding their absolute spectral responsivity s(λ) in the spectral range from 1.5 µm to 14 µm against both above-mentioned primary standards. Pyroelectric detectors offer a higher detectivity than thermopile detectors, and they are suitable for calibrations at lower radiant power levels.
The PTB runs two different measurement approaches for the calibration of radiation detectors in the near- and mid-infrared spectral range. Both approaches are completely independent primary measurement methods for the realization of the spectral responsivity traceable to the International System of Units. The pyroelectric detectors have been calibrated for their spectral responsivity, using both methods.
2.1 Detector calibration with a cryogenic electrical substitution radiometer
The first approach for the absolute calibration of detectors regarding their spectral responsivity uses a cryogenic electrical substitution radiometer which is a primary detector standard. Electrical substitution radiometers measure the radiant power Φinput traceable to the SI by substituting the radiant power with an electrical heating power, which has the same heating effect on an absorber element as the radiant power. This electrical heating power can be measured with low uncertainty traceable to the realizations of the electrical units for voltage and resistance (Martin et al., 1985). Cryogenic electrical substitution radiometers are usually run slightly above the temperature of liquid helium (about 4.2 K) in a vacuum to increase the sensitivity of the radiometer and to reduce the measurement uncertainty. The spectral responsivity s(λ) of the detector under test can be calculated by relating the detector output signal to the measured input radiant power at a specific wavelength.
The utilized measurement facility consists of a cryogenic electrical substitution radiometer with a nominal aperture diameter of 5.8 mm and is equipped with lasers as radiation sources in the infrared spectral range, i.e. a quantum cascade laser (QCL) at 3.96 and 9.45 µm and a CO2 laser at 10.6 µm. The radiant power Φinput incident on the detector can be varied with an adjustable attenuator between about 1 µW and more than 1 mW. The laser power is monitored with a second detector of the same type at the same distance by deflecting about half of the radiation via a beam splitter (Pohl et al., 2019). The monitoring of the laser power is used to correct for fluctuations of the laser power during the calibration procedure.
2.2 Detector calibration with calculable blackbody radiation and optical bandpass filters
The second approach for the calibration of detectors for their spectral responsivity is realized by using the radiation from a blackbody radiator, which is a primary source standard. The blackbody radiation can be calculated by Planck's law. Hence, a calibration of the spectral responsivity of the detector with respect to irradiance can be achieved by measuring the corresponding detector output signal. If the aperture size of the detector is known, its spectral responsivity can also be calculated with respect to radiant power (Pohl et al., 2021).
The radiator which was used is called a large-area blackbody (LABB) and is an almost ideal blackbody with known emissivity of 0.999 and nominal aperture size of 20 mm in diameter. Its temperature TBB is measured with standard platinum resistance thermometers (SPRTs) which are calibrated with the PTB's fixed point cells and the water triple point cell in the temperature range between 0.01 and 961.78 ∘C. Typically, this blackbody radiator is operated at about TBB=1200 K for these detector calibrations. Its temperature inhomogeneities are very small (Taubert, 2003), and its temperature stability during one measurement cycle is better than 50 mK.
The blackbody radiation is spectrally selected by using different sets of accurately characterized optical bandpass filters to obtain information about the wavelength dependency of the detector responsivity. Sets of two filters have been applied to improve the attenuation of the out-of-bandpass radiation. The applied bandpass filters in the spectral range between 1.5 µm up to 14 µm were characterized at a Fourier transform spectrometer and a spectral comparator facility at PTB (Pohl et al., 2021).
The set-up for the detector calibration at the blackbody is depicted in Fig. 1. The shutter and precision aperture are temperature stabilized; the chopper wheel for the calibration of pyroelectric detectors was positioned close to the detector aperture. The impact of the chopper position on the calibration result will be discussed in detail in Sect. 3.2.3. The distance d between the aperture of the blackbody and the pyroelectric detector was set at about 400 mm, which was measured with a calibrated inside micrometre gauge. This results in a radiant power Φinput on the detector between 1 µW and 20 µW, depending on the applied filter combination. This calculated input radiant power was corrected for stray radiation and the transmittance of the air.
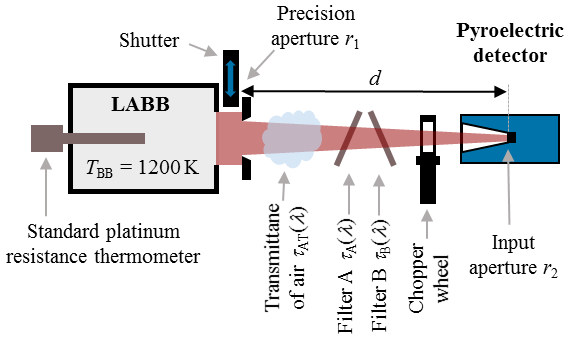
Figure 1Measurement set-up for the calibration of the spectral responsivity of a pyroelectric detector at the large-area blackbody (LABB) with a precision aperture, two optical filters and a chopper wheel.
In general, the spectral responsivity s(λ) is defined as the ratio between the output signal of a detector and the received radiant power Φinput. Due to their functioning principle, pyroelectric detectors can only measure temporal changes in the input radiant power and are, therefore, operated with a chopper wheel to chop the incident radiation. For this reason, the output signal of the pyroelectric detector is a periodic AC signal which is typically measured by using a lock-in amplifier.
However, the output voltage of the lock-in amplifier only reflects the fundamental oscillation component of the Fourier series of the lock-in amplifier input signal. The frequency of this fundamental component is defined by the chopper frequency. Consequently, for the definition of the spectral responsivity s(λ) of the pyroelectric detector, this output signal of the lock-in amplifier also has to be related to the fundamental component of the chopped input radiant flux because only this frequency component of the input radiant flux contributes to the lock-in amplifier measurement of the detector signal.
Furthermore, at most lock-in amplifiers, the DC lock-in amplifier output voltage is not the fundamental component itself but the root mean square (rms) voltage of this fundamental component. Hence, the spectral responsivity s(λ) of a pyroelectric detector is usually defined as being the ratio of the rms value of the fundamental component of the electrical output signal of the detector – which is – to the rms value of the fundamental component of the input radiant power as follows (Whatmore, 1986; Budzier and Gerlach, 2010; Rogalski et al., 2018):
It should be noted that the rms value of the fundamental component of the input radiant power is calculated in the same way as the DC lock-in amplifier output voltage . In general, a root mean square calculation done in this way has no physical meaning for a power quantity. This formal conversion of the radiant power is only done to compensate for the rms value of the detector output voltage, which is the typical output of a lock-in amplifier or any other AC voltmeter. Especially, this defined rms value of the radiant power is not equal to the mean or effective value of the oscillating radiant power.
In fact, a more reasonable notation would be to multiply the rms value of the fundamental component of the electrical output signal of the detector with the square root of 2 to transform the effective (rms) voltage given by the lock-in amplifier back into the amplitude of this sinusoidal fundamental component of the AC voltage and to relate this amplitude to the amplitude of the sinusoidal fundamental component of the chopped radiant power. This is mathematically identical and leads to the same value of the spectral responsivity. In this case, it becomes clear that the definition of the spectral responsivity of a pyroelectric detector is performed analogous to the definition of the responsivity of any other radiation detector, for example, photodiodes or thermopile detectors that measure continuous wave radiation as follows:
The measurement of the detector signal from the read-out of the output signal of the lock-in amplifier is described in Sect. 3.1, including the proper way to correct for background signals. On the other hand, the calculation of the rms value of the fundamental component of the input radiant power is described in Sect. 3.2.
3.1 Read-out of pyroelectric detector signals using lock-in amplifiers
A lock-in amplifier is used for the read-out of the pyroelectric detector signal with phase-sensitive detection (PSD). This means that input signal contributions with a frequency other than the reference frequency, which is given by the applied chopper frequency, are attenuated close to zero in the DC output signal. This is realized by multiplying the periodic input signal with the sinusoidal reference signal of the lock-in amplifier.
Assuming a sine-shaped input signal, the output UPSD of the PSD is proportional to the product of these two sinusoidal signals which are characterized each by their voltage amplitude (respectively, ), angular frequency ω and phase θ as follows (Stanford Research Systems, 2016):
Using commonly known trigonometric identities, this leads to the following:
As shown in Eq. (4), the output of the PSD of the lock-in amplifier consists of two signal parts, with one at the difference frequency (ωsig−ωref) and the other at the sum frequency (ωsig+ωref). This output then passes a low-pass filter which removes the AC parts of the signal. Therefore, the PSD of the lock-in amplifier gives a relevant DC signal only for ωsig=ωref as follows:
In order to obtain the value of the signal amplitude by measuring the PSD output UPSD, the phase difference θsig−θref between the signal and the reference oscillation has to be adjusted to zero by adding a variable phase shift. This is usually done with older types of lock-in amplifiers by maximizing the output signal. To overcome this laborious procedure, modern lock-in amplifiers contain a second PSD that measures the signal with a phase shift of 90∘ added to the reference oscillation. This results in a second PSD output as follows:
These PSD output signals are usually named X=UPSD (in-phase component) and Y=UPSD2 (quadrature component). The advantage of this method is that the absolute value of the signal amplitude can easily be obtained independently of the phase difference with the following:
However, it should not be disregarded that this absolute value of a signal is always connected with a certain phase difference θsig−θref (shortly denoted as the phase of the signal in the following). Furthermore, it has to be noted that the lock-in amplifier output is usually adjusted in a way that it displays the effective (rms) DC value of the AC input voltage at the reference frequency, as mentioned above. In this way, the lock-in amplifier measures the Fourier component of the signal at the reference frequency which is, in our case, defined by the chopper frequency.
3.1.1 Correction of the detector signal for background radiation
We are now going to use such a lock-in amplifier to measure the signal of a pyroelectric detector. To obtain the spectral responsivity of the detector, the signal of the irradiated detector has to be corrected regularly for the background signal that is produced by the detector when the measured irradiation is blocked by a closed shutter.
In this case, the calculation of the correct detector signal has to be performed vectorially to regard the phases of the signals as follows:
The index ir denotes the cases of irradiated detector (shutter open), and bg are the cases in which the detector detects only the background radiation (shutter closed). It has to be mentioned that subtracting the absolute value of the background signal directly, without considering the phase of this signal, is not allowed. The following simplification would only be valid if the phases of the signals and are equal, which is usually not the case.
Performing a background correction without considering the phases may, therefore, lead to systematic errors, especially at low radiant power levels (reported, for example, by Gentile et al., 1997).
The reasons for differences in the phases, especially at the blackbody calibration facility, are, for example, different positions of the parts of the radiation at the chopper wheel when passing the chopper wheel (see details about the chopper wheel in Sect. 4). Even the temperature of the chopper wheel may have an effect on the phases. If the temperature of the chopper wheel is higher than the temperature of the background behind the chopper – e.g. the closed shutter – then the phase may switch by 180∘ when measuring the background signal. This is of special interest for the set-up at the blackbody calibration facility, where the chopper wheel is close to the pyroelectric detector. So, the temperature of the chopper wheel itself affects the signal. Furthermore, the opaque segments of the chopper wheel may reflect additional background radiation onto the pyroelectric detector. All these contributions of thermal radiation add to a certain background signal with an associated phase angle.
Phase differences between the irradiated and the background measurement between 20∘ and 175∘ have been found. Hence, the background signal contains a systematic modulation that is associated with certain phase angles, depending on the measurement conditions. Consequently, the detector signal has to be calculated vectorially to regard the phases of the signals as given in Eq. (8). The phase differences were observed to be mostly constant during one measurement cycle which in our case consists of 20 measurements with irradiated detector and 21 background measurements within about 5 min. This confirms the stable measurement conditions.
It has been found that the effect of the phase difference between and at the cryogenic electrical substitution radiometer facility differs from the blackbody set-up. Because the chopper wheel is at a greater distance to the detector at this facility, the background signals Xbg and Ybg are not given by any detector signal itself but only by the statistical noise of the detector and its measurement electronics. It has to be pointed out that, in this case, the average values for Xbg and Ybg, which have to be used in Eq. (8), are zero, as shown in Fig. 2. In contrast to this, the average of the absolute value is greater than zero in this case, with phases that are uniformly distributed over all possible angles. So, this average value must not be subtracted from like in Eq. (9).
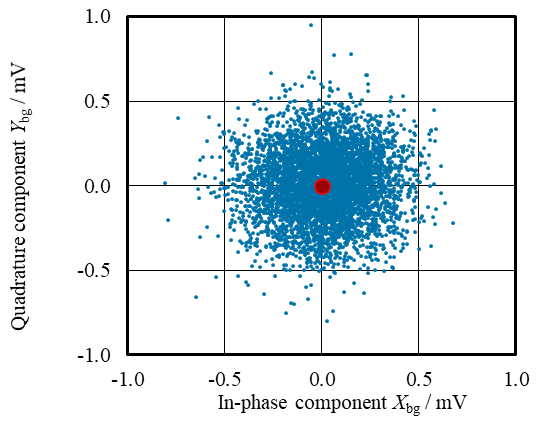
Figure 2Background signal at the cryogenic electrical substitution radiometer facility measured over several hours. The average values of Xbg and Ybg are zero (red dot).
3.1.2 Calibration of the pyroelectric detector and lock-in amplifier as a joint unit
As mentioned, the lock-in amplifier transforms the amplitude of the periodic input signal from the detector into a DC voltage at the output. This voltage depends on amplification stages, filter specifications and on the amplitude of the internal reference voltage. Consequently, the lock-in amplifier cannot automatically be assumed to be traceable to the SI from the metrological view of a national metrology institute.
Hence, the PTB handles the lock-in amplifier, including its chopper, as an inherent part of the pyroelectric detector. This modality is sufficient for the internal use of the detectors as transfer standards for the dissemination of the spectral responsivity to customer detectors at PTB. Of course, the stability of the joint unit of pyroelectric detector and lock-in amplifier has to be monitored. Also, the individual stability of the pyroelectric detector (respectively, the lock-in amplifier) will be monitored. Currently, no instabilities larger than the overall measurement uncertainty of either the pyroelectric detector or the lock-in amplifier are known. However, it is intended to set up an electric calibration method to gain access to SI traceable values of the detector output voltage amplitudes by calibrating the lock-in amplifier as an independent measurement device. Until then, the spectral responsivity of the pyroelectric detector given in volts per watt (V W−1) has to be treated as a result which is not traceable to SI, even if the lock-in amplifier output voltage is measured with a calibrated voltmeter.
3.2 Determination of the radiant power
The spectral responsivity of the pyroelectric detector has been defined in Eq. (1) as the ratio of the detector signal to the rms value of the fundamental component of the input radiant power . The correct way to measure the detector signal has been described in Sect. 3.1. This section will describe the correct way to calculate the radiant power . The pyroelectric detector calibrations have taken place at a cryogenic radiometer facility that uses laser radiation and at a blackbody-based facility. The rms values of the fundamental component of the input radiant power are typically not measured directly at these facilities but have to be calculated from the non-chopped radiant powers Φinput which are determined to be traceable to the SI in both facilities by measurement and calculation. In both instances, the radiant power Φinput is chopped by the chopper wheel to obtain a measurable signal at the pyroelectric detector. This chopper generates quite different temporal shapes of the chopped radiant power at the two facilities, and these shapes have differing amplitudes of the fundamental component of the chopped input radiant power. The calculation of from Φinput will be described in the following. The quantities are also illustrated in Fig. 3.
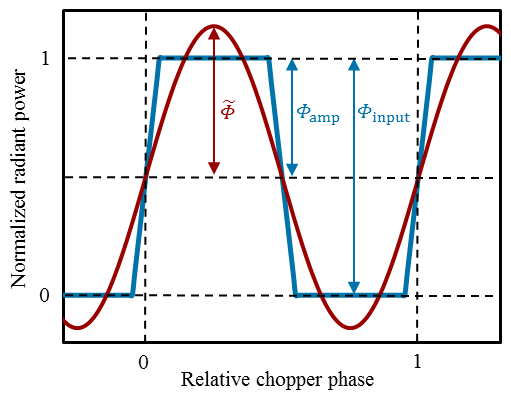
Figure 3Definition of the physical quantities concerning the time-dependent course of the radiant power. The input value Φinput and amplitude Φamp of the chopped radiant power (blue) and the related amplitude of the fundamental component (red) are shown.
The value Φinput is the amount of radiant power which is sent onto the chopper wheel. In the first calibration approach, it is measured with the cryogenic electrical substitution radiometer. In the second calibration approach, it is calculated by Planck's law, taking into account the temperature of the blackbody radiator, the diameters of the two apertures and the distance between them and, furthermore, the transmittance of the atmospheric air and the optical filters.
The amplitude Φamp of the oscillating chopped radiant power is half of this input value Φinput because Φamp represents the peak amplitude, whereas the peak-to-peak amplitude of the oscillating radiant power behind the chopper is equal to Φinput (see also Fig. 3) as follows:
The amplitude of the fundamental component of the chopped radiant power is equal to the absolute value of the Fourier coefficient of the Fourier series at the chopper frequency of the periodic time course of the radiant power. This component is calculated by conducting a fast Fourier transformation (FFT) of the temporal shape of the modulated radiant power and deducing the amplitude at the chopper frequency. If we normalize this coefficient to Φamp, we obtain a shape factor k that depends on the temporal shape of the modulated radiant power as follows:
In some simple cases (e.g. rectangular or trapezoidal shapes), this shape factor can be calculated analytically. For example, a rectangular shape has a shape factor of . However, these simple cases are not always sufficient to describe the temporal shapes of the radiant power that have been occurred in the calibration measurements. A more precise way to determine the shape factor k will be given in Sects. 3.2.1 and 3.2.2.
Finally, the rms value of the radiant power is calculated by dividing the amplitude of the fundamental component of the chopped radiant power by the square root of 2 as follows:
In our case, the spectral responsivity of the detector is determined from the DC lock-in amplifier output voltage and the independently measured (at the cryogenic electrical substitution radiometer) or calculated (at the blackbody radiator facility) input value Φinput of the radiant power with the following:
To summarize, the amplitude Φamp at the detector (and also the mean value of the modulated radiant power, which is typically half of Φinput when using a chopper wheel with 50 % duty cycle) is independent of the temporal shape of the chopped radiant power. However, this is not the case for the fundamental component of the chopped input radiant power because different periodic temporal radiant power shapes have different Fourier compositions. Therefore, the same mean radiant power of chopped radiation can lead to different detector signals due to different Fourier compositions of different periodic temporal shapes (e.g. rectangular, trapezoidal or any other shape). This will be theoretically examined in detail in the following sections and has also been proven experimentally.
Consequently, the spectral responsivity must be defined with respect to a selected temporal shape. Typically, the fundamental sine-shaped component is used for this definition because only this component participates to the signal when measured with a lock-in amplifier. However, some authors do not state the spectral responsivity with respect to the fundamental component but with respect to a rectangular temporal flux shape because this is a shape that can easily be obtained when placing the chopper in the focal plane of a laser beam (Gentile et al., 1997). Consequently, the applied definition of the spectral responsivity should always be given when stating the results of a pyroelectric detector calibration.
In this publication, given spectral responsivities are related to a sine wave radiant power modulation and calculated as described by Budzier and Gerlach (2010). The impact of the temporal radiant power shape on the resulting spectral responsivity will be discussed in detail in the following sections. Initial calculations have been performed by approximating these temporal shapes with trapezoidal functions on geometrical considerations. However, it has been found that this is not precise enough to calculate the spectral responsivity with lowest possible uncertainties, especially at the blackbody facility.
Therefore, the temporal shapes of the modulated radiant fluxes behind the chopper wheel at these facilities have been sampled by turning the chopper wheel in steps of 0.5∘ manually and measuring the detector signal with a thermopile detector TS-76 for each chopper phase in a step-wise manner. Model functions based on geometrical considerations have then been derived and applied to describe the shapes of the temporally modulated radiant powers. These model functions have been verified by comparison to the measured shapes. The determination of the amplitude of the fundamental oscillation component of the radiant power modulation has then been done by applying a FFT to these model functions considering the geometric input parameters for the pyroelectric detector instead of the thermopile detector.
3.2.1 Trapezoidal fit of the temporal shape of the radiant flux modulation at the detector behind the chopper at the cryogenic electrical substitution radiometer facility
The result of the temporal shape of the radiant flux modulation measured with the thermopile detector TS-76 at the cryogenic electrical substitution radiometer facility can be fitted well with a trapezoid function. The trapezoid shape is basically defined by the beam radius in the plane of the chopper wheel, which is about 1 mm. Measurement results and trapezoidal fit are depicted in Fig. 4. The temporal shape of the flux modulation at the pyroelectric detector can be estimated by using the geometric data of the pyroelectric detector as input parameters for the trapezoidal fit. The shape factor k for this shape is 1.2703±0.0025. This is only about 0.23 % less than the shape factor of a pure rectangular shape which is .
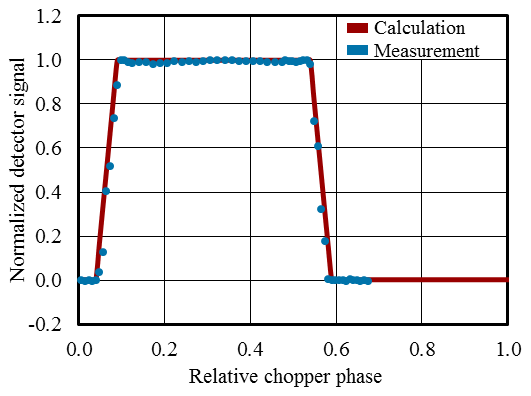
Figure 4Normalized detector signal of the thermopile detector measured when turning the chopper wheel step by step at the cryogenic electrical substitution radiometer facility (blue), which is in line with the trapezoid-shaped fit (red).
3.2.2 Model function for the approximation of the temporal shape of the radiant flux modulation at the detector behind the chopper at the blackbody facility
In contrast to the cryogenic electrical substitution radiometer facility, a fit of the chopped radiant flux, using a simple trapezoid-shaped function, is not sufficient at the blackbody facility because the circular shapes of the detector and the blackbody apertures have a strong impact due to the large blackbody and detector aperture compared to the width of the chopper blades (see Fig. 5). Therefore, a model function for an estimation of the temporal shape of the modulated radiant flux at the detector behind the chopper at the blackbody facility will be derived in the following.
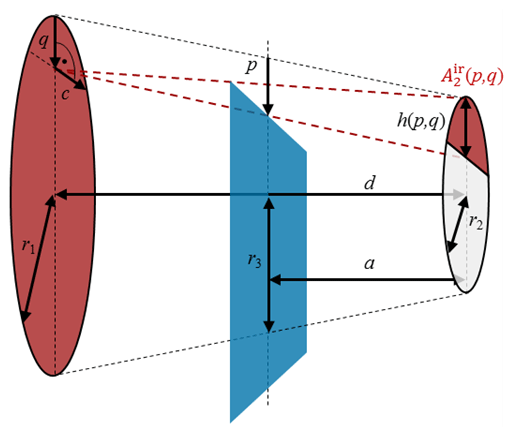
Figure 5Geometry at the blackbody calibration set-up. On the left is the aperture of the blackbody and on the right the detector aperture. The chopper (blue) is located between the blackbody and detector. Its vertical position p defines the size of the part of the detector area A2 that is irradiated by the spot at the vertical position q on the blackbody aperture.
In general, the radiant flux d2Φinput(TBB), which is emitted by the area dA1 of the aperture of the blackbody radiator and received by the area dA2 of the detector, is given by the basic photometric law in Eq. (14) (Budzier and Gerlach, 2010). The spectral radiance Lλ(λ,TBB) of the blackbody radiator with a wavelength-independent emissivity is calculable by Planck's law. The geometry is described by the distance d between the apertures of the blackbody radiator and the detector and by β1 and β2, which represent the angles between the distance vector and the normal vectors of the areas dA1 and dA2.
The apertures of the blackbody and the detector are parallel and coaxial (), and their diameters are small in relation to the distance d and independent from each other. Hence, the photometric law can be simplified to calculate the radiant flux at the detector aperture area A2 that has been emitted by the blackbody aperture area A1 at the blackbody calibration facility as follows:
If there is no chopper wheel, the integration over dA1 and dA2 can be easily applied, resulting in the following:
However, for the calibration of the pyroelectric detectors, a chopper wheel between the detector and the blackbody radiator is necessary as it periodically shades the detector aperture. For this reason, the integration in Eq. (15) needs to be carried out, taking into account the shadow of the chopper on the detector area. The set-up depicted in Fig. 5 is described by the radius r1 of the emitting area of the blackbody radiator, the radius r2 of the receiving area of the detector, the distance d between them and the distance a between chopper and receiving area of the detector. The chopper phase is described by the time-dependent coordinate p of the chopper position. The relation between p and t is given by Eq. (17), with a full cycle duration Ttotal=0.1 s when chopping with 10 Hz and a geometrical length of Ptotal=42.5 mm for a full open/closed cycle of the chopper wheel. To simplify the following calculation, the rotational chopper movement is assumed to be a linear motion.
The radius r3 in the plane of the chopper wheel of the truncated cone defined by the two circular apertures is given by the geometry of the set-up as follows:
In the following, the radiant flux Φinput(TBB,p) at the detector behind the chopper wheel at position p will be derived by implementing geometrical considerations into the photometric law. The integral in Eq. (15) has to be calculated by taking the shadow of the chopper into account. It will be started with the integration .
Radiation from an infinitesimal spot at the vertical position q of the blackbody aperture irradiates a segment of the detector aperture plane with the area . The size of the irradiated area depends on the chopper position p and the vertical position q at the blackbody aperture. is the result of the integral in Eq. (15) for a radiating spot dA1 at the blackbody aperture at position q, taking into account the shadow on the detector caused by the chopper at position p.
Depending on the chopper position p with , the infinitesimal spot at the vertical position q with can irradiate the detector aperture completely, partially or not at all. Different cases, as given in Eq. (19), need to be distinguished as follows:
-
For a chopper position , spots on the blackbody aperture exist that irradiate the complete detector aperture . For these spots, it is , and this corresponds to case 1 in Eq. (19). However, for , there is no position q irradiating the complete detector aperture, which is taken into account by the distinction for m1 in Eq. (21).
-
For a chopper position , spots on the blackbody aperture exist that do not irradiate the detector aperture at all. For these spots, it is , and this corresponds to case 3 in Eq. (19). However, for , all positions q irradiate at least some part of the detector aperture, which is taken into account by the distinction for m2 in Eq. (22).
-
All other positions q of the blackbody aperture irradiate a segment of the detector aperture plane, depending on the chopper position p. This corresponds to case 2 in Eq. (19).
Consequently, the irradiated area can be calculated as the result of the integration in Eq. (15) as follows:
with the height h(p,q) of the irradiated area and m1 and m2 for the definition of the cases in Eq. (19) as follows:
The next step is to carry out the integration over dA1 in Eq. (15), which is performed by integration over the cartesian coordinates c and q as follows:
The integration over q can be calculated with given in Eq. (19). The integration limits for the integration over c are given by the length of the chord of the circular aperture of the blackbody at the height q, as follows:
Finally, the radiant flux Φinput(TBB,p) at the detector aperture behind the chopper wheel at position p, as given by Eq. (24), can be normalized to the radiant flux Φinput(TBB) with no chopper wheel, as given by Eq. (16), as follows:
The temporal shape of the chopped radiant flux can then be calculated by using the relation between position p and time t in Eq. (17).
The measurement of the signal of the thermopile detector TS-76, when turning the chopper wheel manually in steps of 0.5∘ in front of the blackbody radiator, is depicted in Fig. 6. The calculation result from the model function in Eq. (25), which was solved by numerical integration, is consistent with the measurement. Small deviations could be caused by inaccuracies in the manual rotating of the chopper wheel and inhomogeneities of the responsivity over the detector sensitive area that are not considered in the mathematical model. The measurement proves that the model is feasible for the mathematical calculation of the temporal flux modulation at the detector by using the geometry data.
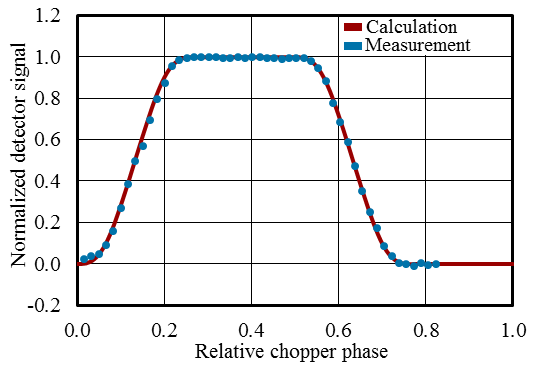
Figure 6Normalized detector signal of the thermopile detector measured when rotating the chopper wheel in front of the blackbody step by step (blue) and the result of the model function according to Eq. (25) (red).
3.2.3 Impact of the temporal shape of the chopped radiant flux on the amplitude of the fundamental oscillation component
The calculation of the shape factors k at the blackbody facility has been performed using measured shapes of the chopped radiant flux which have been fitted with the model function in Eq. (25). The shape factor k in our dedicated set-up was found to be 1.2527±0.0063, which is about 1.6 % less than the shape factor of a purely rectangular shape. In contrast to this rather precise calculation, we have initially performed calculations of the shape factor using a simple trapezoidal approximation of the shape based on the geometrical beam dimension at the location of the chopper. This simple approximation gives a shape factor of 1.2224 instead of 1.2527 for the geometry used at the blackbody facility. This corresponds to an error of 2.4 % in the spectral responsivity measured at this facility.
The use of the model function Eq. (25) furthermore enables us to optimize the positioning of the chopper wheel. Fig. 7 shows the dependence of the shape factor k on the distance a between the chopper and the detector for different radii r2 of the detector aperture. If the detector aperture is very small and the chopper is close to the detector, the flux modulation is nearly of a rectangular shape, and the shape factor is close to the theoretical value for the rectangular shape of . If the chopper is positioned away from the detector or the detector has a large aperture size, the modulation deviates more or less from the rectangular shape, and this leads to a decrease in the shape factor. To minimize the uncertainty of the shape factor, it is preferable to mount the chopper at a distance from the detector so that the dependence of the shape factor on the distance is small. This optimal distance is close to the detector for small detector apertures and becomes larger for bigger ones. If the detector aperture size equals the size of the blackbody aperture, then the optimum distance is right in the central position between the detector and blackbody.
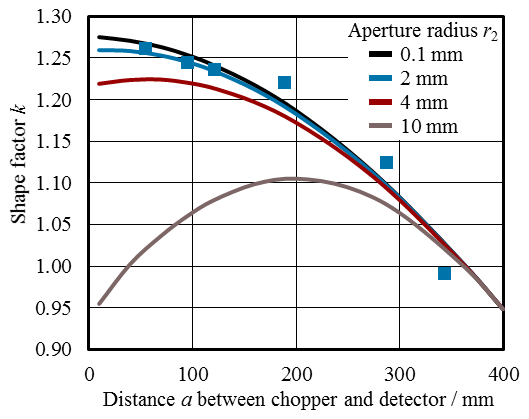
Figure 7Theoretical calculation of the shape factors k for the calculation of the amplitude of the fundamental oscillation component of the modulated radiant flux on the detector at the blackbody facility depending on the distance a between the chopper and the detector aperture for four different radii r2 of the detector aperture. During the calibration process, a nominal distance of a=70 mm and a detector aperture radius of r2=2 mm was used, whereas the distance from the detector aperture to the blackbody aperture was d=400 mm. The radius of the blackbody aperture was r1=10 mm for all cases. The blue dots represent the relative signal of the lock-in measurement of the pyroelectric detector depending on the distance a to verify the given calculation.
The theoretical calculation of the shape factor k for different distances a between the chopper and the detector has also been verified with a lock-in measurement of the signal of the pyroelectric detector. All dispensable optical elements (i.e. the filters and stray light apertures) had been removed for this experiment to be able to freely change the chopper position. The result of this relative measurement of the shape factor k is represented by the dots in Fig. 7 and corresponds to a detector aperture radius of 2 mm. It has to be mentioned that the aperture segment of the used chopper was not large enough to completely cover the blackbody radiation if positioned too close in direction of the comparatively large blackbody aperture with radius 10 mm. Although this demonstration experiment is slightly disturbed, it clearly shows the large variation in the factor k caused by the different temporal radiant power shapes.
In general, the calculations show the importance of considering the exact geometrical beam set-up and the accurate temporal shape of the modulated radiant flux especially if the experimental set-up forces one to deviate from an ideal rectangular modulation shape. It should not be forgotten that an appropriate shape factor always has to be applied if one intends on using the calibrated pyroelectric detector for absolute radiometric measurements. Neglecting these considerations leads to a significant measurement error that is easily larger than the overall measurement uncertainty, which will be discussed in Sect. 4.2. In contrast to that, misaligning or a small tilt of the detector can be neglected with respect to the overall uncertainty.
The pyroelectric detectors which have been calibrated regarding their spectral responsivity at both primary standard facilities are of the type LIE-651, as manufactured by InfraTec. These detectors have, additionally, been equipped with apertures of a nominal diameter of 4 mm. The diameter of each aperture has been measured traceable to the SI to be able to calculate the radiant flux at the blackbody facility. The detectors do not have any window to avoid the spectral dependencies of the responsivity as effectively as possible. They are, furthermore, implemented in a temperature-stabilized housing, which reduces the influence of variations in the surrounding temperature and leads to a reduced detector noise. The detector housings can be temperature controlled to avoid deviations caused by the temperature sensitivity of the pyroelectric detector, which is typically +0.15 % K−1 (InfraTec, 2004).
The pyroelectric material of this detector type is lithium tantalite LiTaO3 coated with a black metal layer. LiTaO3 is a standard material for pyroelectric detectors, with the advantage that the pyroelectric coefficient has a small dependence on the temperature (Porter, 1980; Budzier and Gerlach, 2010). The specific thermal time constant of the detectors is about 600 ms (InfraTec, 2015). The typical chopping frequency for this type of detector is 10 Hz, which was realized with a chopper wheel and controller of the model type SR540 by Stanford Research Systems. The chopper wheel is a 50 % duty cycle wheel with six equally distributed 30∘ open segments; hence, the rotational frequency of the wheel is one-sixth of the chopping frequency. The signal read-out is realized with a lock-in amplifier of the type SR860 by Stanford Research Systems.
4.1 Calibration results
A total of two pyroelectric detectors have been calibrated for their spectral responsivity at both the cryogenic electrical substitution radiometer facility and the blackbody radiator facility. The calculation of the spectral responsivity and correction for the temporal signal shape behind the chopper wheel has been applied, as described in Sect. 3. The calibration results for one of the pyroelectric detectors are depicted in Fig. 8. The results for the second pyroelectric detector are similar, and no significant sample variation was observed.
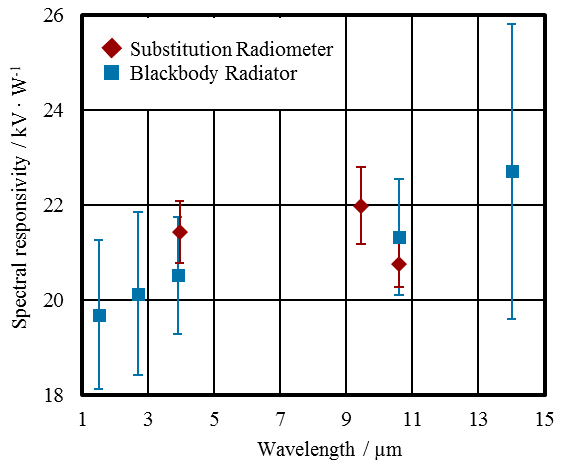
Figure 8The spectral responsivity of a pyroelectric detector measured at the cryogenic electrical substitution radiometer facility (red) and the blackbody radiator facility with optical bandpass filters (blue). The error bars indicate the standard measurement uncertainty.
It has to be noted that the sensitive area of the pyroelectric detector is completely irradiated within the area of the aperture at the blackbody radiator facility but only at its centre by the laser radiation at the cryogenic electrical substitution radiometer facility. Hence, the inhomogeneity of the spectral responsivity over the sensitive area leads to a difference in the calibration results between the two different approaches. The observed slight increase of about 1 % of the spectral responsivity at the edges of the sensitive area of the pyroelectric detector compared to that in the centre leads to a systematically higher result for the spectral responsivity of about 0.3 % for calibration at the blackbody radiator facility. This effect is not corrected in the data depicted in Fig. 8.
4.2 Measurement uncertainty
The measurement uncertainties at the two measurement facilities have been discussed in detail, relative to the calibration of thermopile detectors of type TS-76 (Pohl et al., 2019, 2021). In general, these uncertainty budgets also apply to the calibration of the pyroelectric detectors.
The main uncertainty contribution for the calibration at the cryogenic electrical substitution radiometer is caused by stray radiation. The incident beam in the detector plane has a radius of about 1 mm with a certain amount of stray radiation around that spot. This stray radiation has a different impact on the resulting signal of the pyroelectric detector (respectively, the cryogenic radiometer) due to their different aperture sizes. This leads to the main contribution in the measurement uncertainty budget of the detector calibration. Other influences such as detector noise and wavelength uncertainty are also considered but are comparatively small. The overall measurement uncertainty for the detector calibration is in the range between 1 % and 5 % (Pohl et al., 2019).
The measurement uncertainties for the calibration at the blackbody radiator range between 5 % and 14 %. The main contributions are as follows (Pohl et al., 2021):
-
Blocking of out-of-bandpass radiation. The blackbody radiation, which is in the wide out-of-bandpass wavelength range, needs to be blocked by the transmission filters. Although the compilation of two filters improves the ratio between the wanted radiation in the narrow bandpass wavelength range and the unwanted radiation in the out-of-bandpass range, the uncertainty of the measurement of the transmittance in the out-of-bandpass wavelength range is still the dominating uncertainty contribution.
-
Spectral distribution of the blackbody radiation. The blackbody radiation at a temperature of 1200 K has its spectral maximum at a wavelength of about 2.5 µm and decreases significantly for longer wavelengths. Hence, the ratio between transmitted and blocked radiation becomes worse for calibrations at longer wavelengths, which results in an increase in the measurement uncertainty at these wavelengths.
-
Stray radiation. The detector aperture in front of the sensitive area is exposed to the blackbody radiation. This results in stray radiation generated by scattering from the detector aperture onto optical components in front of the detector such as the chopper wheel. This effect was reduced to a minimum by additional apertures to block stray radiation. The aperture sizes are as small as possible to block as much of this stray radiation as possible, but it is still large enough not to limit the actual beam path through the filters between the blackbody and detector aperture. However, a correction of this effect is still necessary, and the uncertainty of this correction is conservatively estimated as being the correction itself.
Other sources of uncertainties such as detector noise, temperature instabilities or geometry are also considered in the overall measurement uncertainty budget but are not decisive contributions. An additional uncertainty contribution which is especially related to pyroelectric detectors is caused by the dependence of the spectral responsivity on the chopper frequency. The sensitivity of this effect was measured to be about 8 % per hertz at a frequency of 10 Hz. Therefore, the accuracy of the chopper frequency is of great importance. The chopper frequency is controlled by the lock-in amplifier SR860, which uses an internal frequency counter with an accuracy of 25 ppm (parts per million; Stanford Research Systems, 2016). Measurements were conducted with this frequency counter to examine the frequency stability and accuracy of the chopper wheel, which show that the frequency deviation is very small and only of statistical origin. Hence, the resulting uncertainty contribution to the determination of the spectral responsivity is insignificant (≪0.1 %).
The PTB established two pyroelectric detectors as transfer standards for the SI traceable measurement of radiant power in the wavelength range between 1.5 µm and 14 µm. The calibrations took place at two independent primary standards, namely a cryogenic electrical substitution radiometer, which is a primary detector standard for the absolute measurement of radiant power traceable to the SI, and a blackbody radiator with accurately characterized optical bandpass filters and a precision aperture, which is a primary source standard for spectral irradiance using Planck's law to calculate the blackbody radiation.
In contrast to other types of detectors, pyroelectric detectors measure temporal changes in the input radiant power and are, therefore, operated with chopped radiation. This leads to peculiarities which have to be considered, especially if pyroelectric detectors are used for absolute measurements. The spectral responsivity of this type of detector has to be carefully defined, and clearly stating the definition which is used is recommended. This is especially important since differing definitions are in use.
The beam geometry at the measurement facility determines the temporal radiant flux shape of the chopped radiation at the detector, and this temporal shape has a strong effect on the signal output of the detector and, therefore, has to be considered for the correct calculation of the spectral responsivity. For the same reason, the comprehensive consideration of the temporal shape of the chopped radiant flux is also of great importance if using the calibrated detector for accurate absolute radiometric measurements is intended. In the case of the blackbody radiator facility, it has been found that the factor which considers the temporal shape of the radiant flux ranges between 0.95 and 1.27, depending on the position of the chopper in the set-up. This underlines the importance of an accurate consideration of the temporal shape of the radiant flux to perform correct absolute measurements with pyroelectric detectors and to obtain the lowest possible uncertainties. If the detector signal is measured with a lock-in amplifier, the proper way to correct for background signals, furthermore, has to be noted.
The results of the two calibration approaches are consistent with each other, and the measurement uncertainties of the calibrations are in the range between 1 % and 14 %. The calibrated pyroelectric detectors can be used for the dissemination of the spectral responsivity s(λ) to other types of detectors. By these means, the PTB will offer routine services for detector calibrations in the wavelength range up to 14 µm within a radiant power range between 1 µW and 1 mW.
All relevant measurement results are shown in the publication in Sects. 3 and 4. However, the underlying measurement data are not publicly available and can be requested from the authors, if required.
TP, PM, JH, UJ and LW worked together on the development and realization of the different measurement approaches, data evaluation and interpretation. JH initiated the work of infrared detector calibration with blackbody radiation. TP, PM and UJ performed the calibration measurements at the cryogenic radiometer and the blackbody radiator facility. TP, PM and LW evaluated the measurement results and wrote the article with contributions from all authors.
The contact author has declared that neither they nor their co-authors have any competing interests.
The component producers/suppliers are mentioned for identification purposes only. Such an identification does not imply any recommendation or endorsement by the PTB, nor does it imply that the producers/suppliers identified are necessarily the best available for the purpose.
Publisher's note: Copernicus Publications remains neutral with regard to jurisdictional claims in published maps and institutional affiliations.
Significant technical support by Marco Schulz, Ingmar Müller and Klaus Anhalt, for the operation of the blackbody radiator, is gratefully acknowledged.
This open-access publication was funded by the Physikalisch-Technische Bundesanstalt.
This paper was edited by Alexander Bergmann and reviewed by two anonymous referees.
Budzier, H. and Gerlach, G.: Thermische Infrarotsensoren – Grundlagen für Anwender, WILEY-VCH, Weinheim, Germany, ISBN 10 3-527-40960-2, 2010.
Gentile, T. R., Houston, J. M., Eppeldauer, G., Migdall, A. L., and Cromer, C. L.: Calibration of a pyroelectric detector at 10.6 µm with the National Institute of Standards and Technology high-accuracy cryogenic radiometer, Appl. Optics, 36, 3614–3618, 1997.
InfraTec: Pyroelectric detectors: Behaviour of detector characteristics at static and dynamic temperature condition, Application Library, 2004.
InfraTec: Pyroelectric detector LIE-651, datasheet, 2015.
Martin, J. E., Fox, N. P., and Key, P. J.: A Cryogenic Radiometer for Absolute Radiometric Measurements, Metrologia, 21, 147–155, 1985.
Pohl, T., Meindl, P., Johannsen, U., Taubert, D., and Werner, L.: Measurement of the absolute spectral responsivity in the mid-infrared based on the cryogenic electrical substitution radiometer and an optimized thermopile detector, J. Sens. Sens. Syst., 8, 195–205, https://doi.org/10.5194/jsss-8-195-2019, 2019.
Pohl, T., Meindl, P., Werner, L., Johannsen, U., Taubert, D., Monte, C., and Hollandt, J.: Absolute calibration of the spectral responsivity of thermal detectors in the near-infrared (NIR) and mid-infrared (MIR) regions by using blackbody radiation, J. Sens. Sens. Syst., 10, 109–119, https://doi.org/10.5194/jsss-10-109-2021, 2021.
Porter, S. G.: A brief guide to pyroelectric detectors, Ferroelectrics, 33, 193–206, 1980.
Rogalski, A., Kopytko, M., and Martyniuk, P.: Antimonide-based Infrared Detectors: A New Perspective, SPIE Press Book, 280, https://doi.org/10.1117/3.2278814, 2018.
Stanford Research Systems: SR860 – 500 kHz DSP Lock-in Amplifier, Operation Manual, 2016.
Taubert, D. R.: Radiometrische Messung thermodynamischer Temperaturen und Vergleich mit der Internationalen Temperaturskala (ITS-90) im Bereich von 419 ∘C bis 660 ∘C, Dissertation, Berlin, https://doi.org/10.14279/depositonce-672, 2003.
Taubert, R. D., Meindl, P., Monte, C., Werner, L., Pohl, T., and Hollandt, J.: Absolute Mid-infrared Spectral Responsivity Scale Based on Thermal Detectors and the Cryogenic Radiometer, AMA-Konferenz SENSOR/IRS2, Nürnberg, Germany, 30 May–1 June 2017, https://doi.org/10.5162/irs2017/i1.2, 2017.
Whatmore, R. W.: Pyroelectric devices and materials, Rep. Prog. Phys., 49, 1335–1386, 1986.
- Abstract
- Introduction
- Primary standards for the absolute calibration of the spectral responsivity
- Spectral responsivity of pyroelectric detectors
- Calibration of pyroelectric detectors at both primary standards
- Summary
- Data availability
- Author contributions
- Competing interests
- Disclaimer
- Acknowledgements
- Financial support
- Review statement
- References