the Creative Commons Attribution 4.0 License.
the Creative Commons Attribution 4.0 License.
 | 05 Apr 2023
Evaluation of precision, accuracy and threshold for the design of vibrotactile feedback in eye tracking applications
Anke Fischer
Thomas M. Wendt
Lukas Stiglmeier
Philipp Gawron
Kristof Van Laerhoven
Novel approaches for the design of assistive technology controls propose the usage of eye tracking devices such as for smart wheelchairs and robotic arms. The advantages of artificial feedback, especially vibrotactile feedback, as opposed to their use in prostheses, have not been sufficiently explored. Vibrotactile feedback reduces the cognitive load on the visual and auditory channel. It provides tactile sensation, resulting in better use of assistive technologies. In this study the impact of vibration on the precision and accuracy of a head-worn eye tracking device is investigated. The presented system is suitable for further research in the field of artificial feedback. Vibration was perceivable for all participants, yet it does not produce any significant deviations in precision and accuracy.
- Article
(1685 KB) - Full-text XML
- BibTeX
- EndNote


In the past few years, research in the field of eye-tracking-based controllers for robot interaction has increased, as shown by different authors and their work (Leaman and La, 2017; Cio et al., 2019; Sunny et al., 2021; Sharma et al., 2020; Dragomir et al., 2021; Clark and Ahmad, 2021). Eye tracking yields advantages against other non-verbal or touch-based systems such as an easy setup and a good accuracy. Challenges of near-infrared eye trackers are the limited range of motion, especially when using stationary eye tracking devices (Clark and Ahmad, 2021). Wearable, wireless eye tracking systems represent a solution.
In this context, the research of user experience or improvement measures such as artificial feedback is scarce. Vibrotactile feedback is a commonly applied method to simplify the usage of electric protheses or smart devices (Antfolk et al., 2013; Moore, 2021). For this, the feedback stimulus has to be well adjusted and perceivable and must be easy to assign to the corresponding event (Choi and Kuchenbecker, 2013). Current studies have shown that placement is crucial for a well-matched feedback (Sigrist et al., 2013; Borg et al., 2001; Myles and Kalb, 2010; Rantala et al., 2014). Applications for stimulus locations such as the head and chest were tested in guidance vests, belts, helmets and glasses (Borg et al., 2001; Myles and Kalb, 2010; Myles and Binseel, 2007; Rantala et al., 2014). The results showed that tactile feedback is improving the completion time of gaze gestures depending on the duration of the stimulus (Kangas et al., 2017). Further, the cognitive load of the auditive and visual channel was reduced (Myles and Kalb, 2010).
Implementing the feedback method in eye tracking glasses could reduce setup time for caregivers and users by replacing a separately mounted feedback system. In this work, possible influences on the sensor technology of the eye tracking glasses caused by vibration are investigated. In the first study, perceivable vibrotactile thresholds in the temple area were determined to find lower boundaries for the feedback. The second study investigated variations in the precision and accuracy between deactivated and activated vibrotactile feedback of a head-worn eye tracker. A first insight of the user experience of this setup is given.
Two studies with 10 persons were performed. The results were utilised to determine an upper and lower vibration perception threshold. The first study was designed as an empirical threshold measurement in which a piezo element was used as vibration stimulus in the temporal region. In the second study a vibration coin motor created the stimulus on a pair of eye tracking glasses. Precision and accuracy were evaluated based on the recorded data.
The participants (six males and four females) were on average 34 years old (SD 10 years) and agreed to participate in both studies. None of the participants stated medical conditions concerning eye muscles or tactile perception. No medical conditions such as headaches, nausea or dizziness were stated by the participant in the duration of the study. The study was reviewed and approved by the Ethics Council of the University of Siegen. All participants read, agreed to and signed the informed consent forms before conducting the studies.
2.1 Vibration perception threshold of the temporal region
In the first study, a piezo element (PK2FVP2, ThorLabs) was characterised with a laser vibrometer (OptoMET Dual Sense I) and used as stimulus. Two frequencies were tested with this setup. A frequency of 54 Hz was applied for the exploration of user experiences with vibrational feedback at the head by Myles and Kalb (2010). The second applied frequency of 140 Hz corresponded to the created vibration of the coin motor used in the second study. The linear amplitude change for the threshold measurement was between 2.4 and 5.2 µm (SD ±0.05 µm). Errors due to bias were minimised by not interrupting participants when they exceeded the stated threshold range.
The piezo element was placed so that the expansion force acted vertically on the skin. A customised 3D-printed housing was designed to adjust the position on the head. An adjustment screw allowed the position of the piezo element to be regulated to ensure contact with the skin. The participants were told to state if the stimulus was perceivable with “yes” or “no” answers. The amplitude was adjusted by setting the voltage in 0.1 V steps corresponding to a difference in amplitude of 60 nm. A total of 50 measurements were conducted for each participant and frequency. The time that the stimulus was on was 1 s to reduce the risk of adaptation. The transformed “up/down” method introduced by Wetherill and Levitt with “3 up/1 down” was used to determine the threshold (Kingdom and Prins, 2010, p. 124–125). The results were evaluated with a psychometric function which was fitted to the data using a generalised linear regression model with MATLAB, as presented by Wichmann and Hill (2001). Standard deviation was used to evaluate the results regarding the reliability of the participants' statements.
2.2 Measurement of accuracy and precision in an eye tracking task with vibrotactile stimulation
The apparatus consisted of an eye tracking device (Tobii Pro Glasses 2, Tobii Pro) and a 3D-printed casing enclosing the vibration coin motor (Type 310-122, PMD). To ensure an error-free operation of eye tracking systems, the environment must meet certain criteria. Eye tracking devices are sensitive to changing illuminance of the scene, calibration errors and, in the case of wearable systems, fit to the head. These affect the accuracy and precision of eye movement detection (Thibeault et al., 2019; Tobii Technology, 2011). Therefore, illuminance was set to 480 lx through adjustable lights to minimise illumination errors. In total, 13 visual markers and one reference marker were presented centrally in front of the participant's eye level, as shown in Fig. 1 (the reference marker is shown as a black circle on the lower left side). The spacial distribution was adopted as stated by Thibeault et al. (2019). The markers were arranged in circles with angles of 7, 15 and 23∘ to the centre marker. Each marker had a diameter of 20 mm (adapted from Thibeault et al., 2019). The reference marker had a diameter of 30 mm. The participant was sat in front of the marks at a distance of 1 m. Shorter distances resulted in uncomfortable head postures, masking of the markers by the glasses and reduced detectability of the outer markers by exceeding the scene camera image. If necessary, the glasses were adjusted with different nose pads and calibrated as stated in the manual (Tobii AB, 2020). Participants were allowed to move their head between measurements. The head position and distance were adjusted with a chin rest to minimise a variation of the head position and the resulting errors. This variation is shown in Fig. 1 by two exemplary selected eyeglass planes that are shifted in relation to each other, each representing one measurement. In this case, the tilt to the left would lead to a non-recognition of the outer right point (blue-coloured camera view). Since the gaze angle is measured in pixels in relation to the scene camera view, a slip or tilt of the glasses can result in varying gaze angles for the same marker.
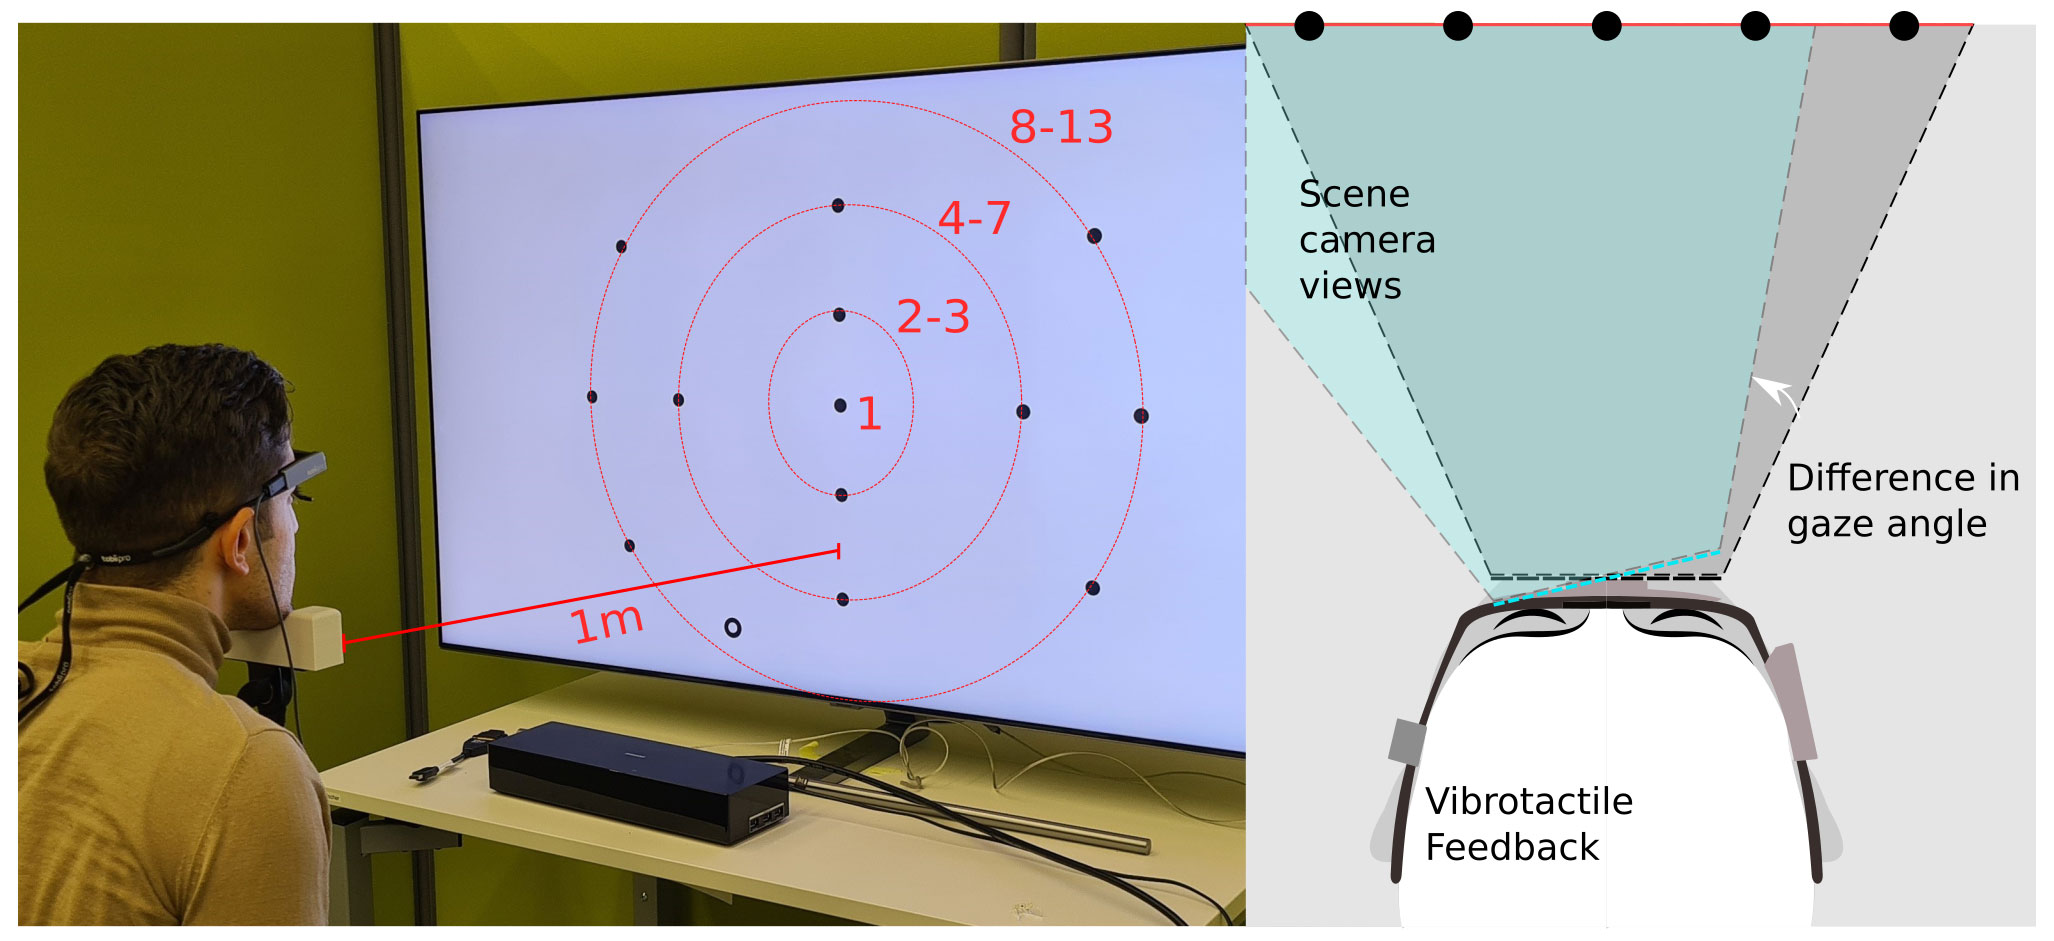
Figure 1Left: study setup with participant. All red markups were not visible for the participant. The distribution of the markers was adapted from Thibeault et al. (2019). Right: the scene camera view, shown as the highlighted area between the participant and markers, represents the room of all available gaze angles. Diagonal lines in black and blue show examples of a tilted level of the glasses.
The vibrotactile stimulus was set to a frequency of 140 Hz with a resulting amplitude of 75 µm. All participants stated that vibration was perceivable in the temporal region. Eight measurements were conducted, alternating between deactivated (Condition A) and activated (Condition B) vibrational stimulus to reduce the impact of habituation effects. A preliminary study showed that more than eight measurements led to an increased fatigue stated by the participants. In all measurements, each marker was focused for 3 s to generate data sets of at least 300 data points. After the measurements, a short survey was conducted regarding the sensation of the glasses and the casing as well as the vibrotactile feedback. Vibration was audible within these settings. Therefore, the perception of the auditory feedback was asked in order to distinguish between the sensation of the vibrational and auditory feedback. Since learning behaviour or evaluation of the cognitive load was not the focus of this study, no further measures were taken to prevent a perception of the auditive feedback. The participants had to indicate the sensation on a scale from 1 (very pleasant) to 5 (very unpleasant). If the sensation was rated by a level greater than 3, further questions on the occurrence of this decision were asked.
The raw data were exported with Tobii Pro Lab for further analysis with MATLAB. The program flow is shown in Fig. 2. The arithmetic mean was calculated for each marker and each participant. The precision was calculated as stated by Thibeault et al. (2019) as root mean square (rms) of the standard deviation in the x and y direction. Accuracy was calculated by determining the length of the vector from the position of the arithmetic mean marker to the corresponding marker in a steady map. Marker M1 of the steady map was estimated to represent the centre of the eye tracking glasses' scene camera view. The precision and accuracy were investigated regarding significant differences between the AB conditions. The data of the AB study design were not normally distributed. Therefore, a Wilcoxon rank sum test was executed with the grouped data of all participants into the corresponding condition. Friedman's test with a subsequent Dunn–Bonferroni test was applied to determine differences between measurements. The vibration used in this test can cause the glasses to slip, which is expected to affect accuracy and precision. Therefore, a sliding window and a scaling factor were calculated as a correction factor and applied on the data for the accuracy to estimate systematic errors. Due to possible movement of the participants between the measurements, the significance tests were repeated after using the sliding window and scaling factor.
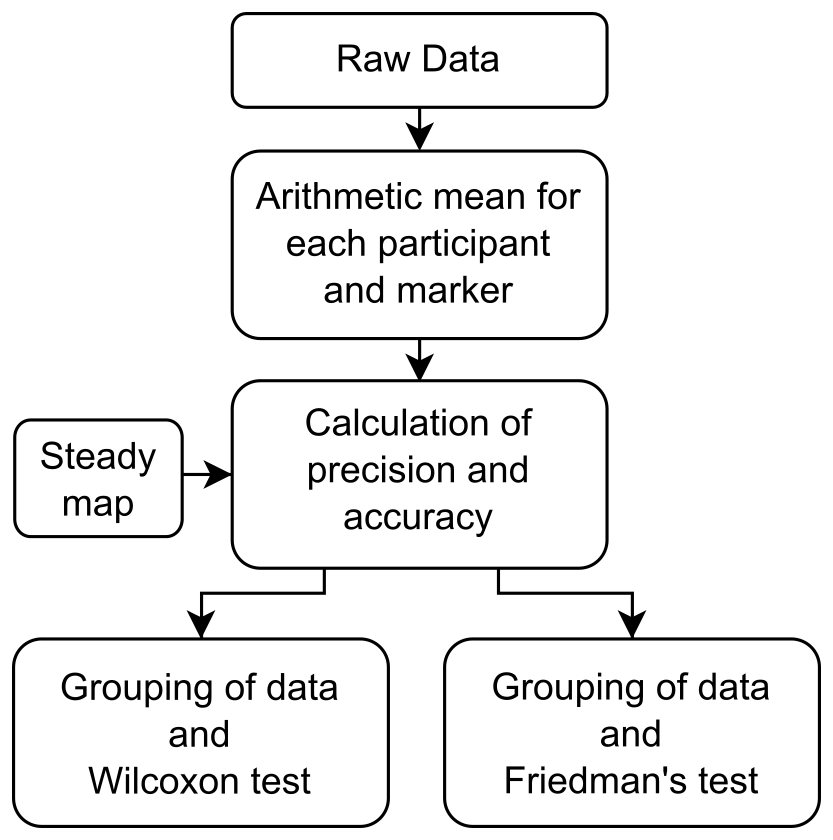
Figure 2Program flow of the data analysis. Precision and accuracy were determined and compared with a steady map. Significance between conditions and measurements was calculated with the Wilcoxon rank sum test and Friedman's test.
With regard to comparable literature on threshold measurements at the temple, the results showed that vibration perception was dependent on the age of the participants and the applied frequency. Stuart et al. (2003) stated amplitudes of 28 to 107 µm depending on the participants age, whereas Myles and Kalb (2010) stated thresholds around 2 µm at varying frequencies. The vibration perception threshold measurement in the first study was carried out with all participants. In five cases, the threshold could not be determined, due to a non-sufficient maximum amplitude of the system. The participants who perceived vibration with an amplitude lower than the maximum of 5.7 µm were on average 29 years old. Participants who could not perceive the stimulus were on average 43 years old. The standard deviation shows high deviations between 0.13 and 0.39 µm in comparison to the measured amplitude. This can be attributed to a small step size and thus inconsistent answers from the participants.
In the second study, the data sets for each marker containing between 61 and 590 values were evaluated. As stated above, each point was fixated for 3 s to generate at least 300 data points depending on the sampling rate and fixation duration. Fewer than 300 data points were recorded since no data are captured if the gaze direction exceeds the scene camera view. The corresponding markers were located exclusively in the periphery. These markers were excluded from the evaluation as soon as fewer than 50 values were recorded, leading to 26 excluded data sets of a total of 1040.
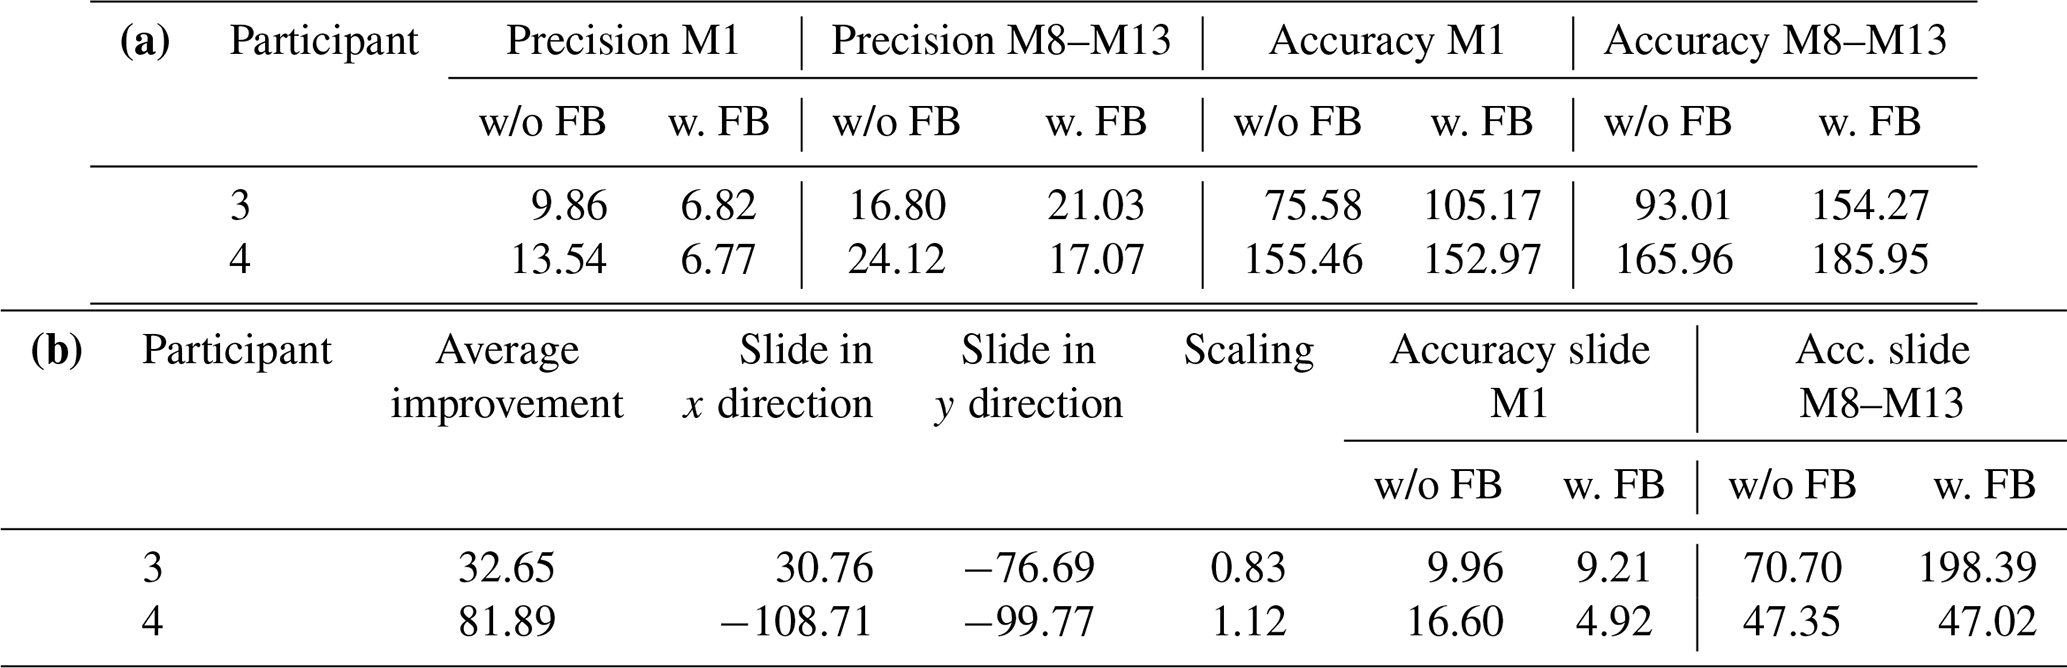
Table 1 shows the resulting precision and accuracy for different groups of markers with the example of participants 3 and 4. These participants were selected because their data showed a minimum and maximum rate of improvement by the applied correction factor. M1 describes values taken when fixating the centred marker. The values given for M8–M13 describe the arithmetic average of the parameters for the outermost markers with a radius of 23∘. The scaling and sliding factors are given, with the resulting accuracy values in the lower part of the table. A minimum of 4.52 mm in accuracy is reached. Between conditions no significant difference was found. The errors in accuracy between the inner (M1) and the outer markers (M8–M13) increase the closer the marker is located to the periphery of the camera view. To optimise the position of the markers, they have to be shifted by 189.59 mm and scaled by a factor between 0.71 and 1.12 with the sliding window method. This correction reduces the calculated error by up to 81.89 %.
Table 1M1 describes the centred marker and M8–M13 the outer markers (see Fig. 1). All data are given in millimetres except the scaling factor, which has no units and for which average improvement is shown as a percentage. (a) Accuracy and precision calculated with the steady map and without correction factors. The means of precision and accuracy are stated for the conditions with (w. FB) and without vibrotactile feedback (w/o FB). (b) Effects of the sliding window and scaling are shown by an average improvement rate for each participant, improving the error between 32 % and 81 %.
In Fig. 3 the weighted average of the accuracy for each participant and each condition is shown after applying the sliding window and scaling factor. For some participants, lower accuracy for the condition with feedback can be seen, such as in the data of participants 3 and 9. Although this implies that vibration has an impact on accuracy, the data from participant 10 indicate the opposite. The statistical analysis showed similar results for all participants. No significant differences between the grouped precision and accuracy data were found using the Wilcoxon test. There are differences between measurements (Friedman test p<0.05). A conducted post hoc test (Dunn–Bonferroni test) showed no significance since the alpha value was reduced.
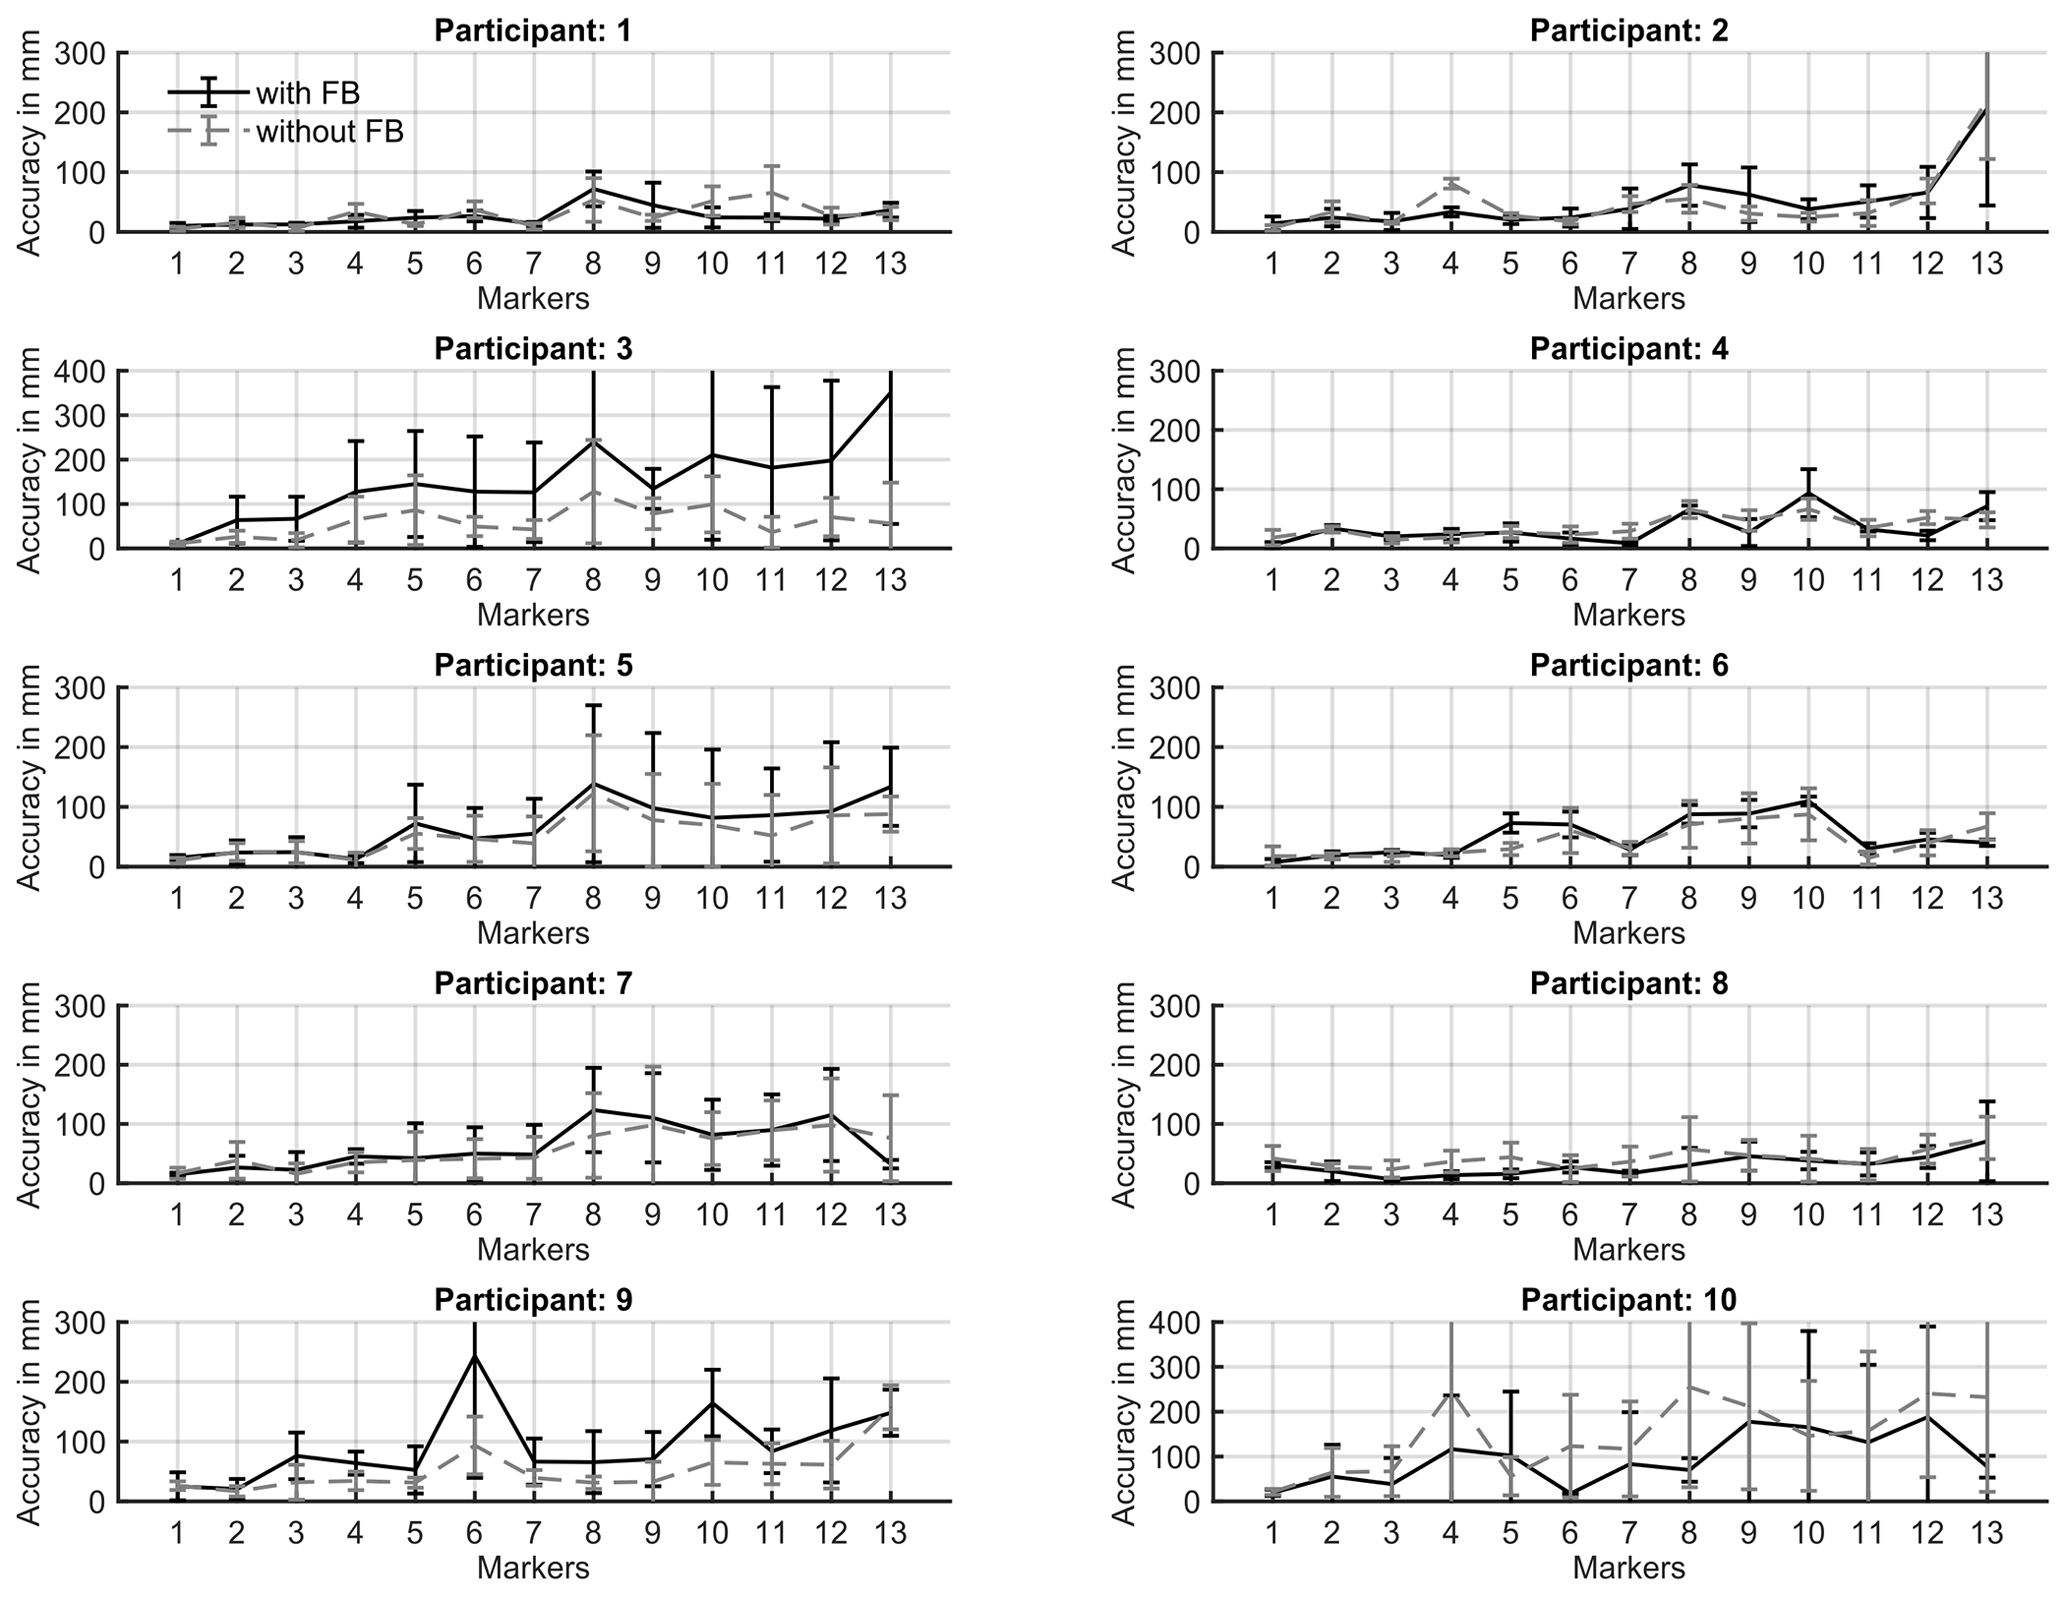
Figure 3Weighted average for both conditions (activated vibrotactile feedback, black; deactivated vibrotactile feedback, grey – dashed line). The distribution of the markers is shown in Fig. 1.
The participants were asked to evaluate the comfort of wearing the glasses and the mounted casing of the vibration motor, the applied vibration and the auditive cue resulting from the stimulus. The perception of the eye tracking device was rated as pleasant in all measurements (mean 2.07, SD 0.53). The perception of the vibrotactile feedback was rated as neutral to unpleasant, with a mean of 3.34 (SD 0.94). The auditory perception was rated 2.96 (SD 1.07). The participants tended to stay with the same statement and adjust it with a maximum of one point between all measurements, leading to the assumption that the duration of the test was adequate. Reasons for statements with a rating worse than 3 included the vibrotactile feedback being too strong and the vibration being noticeable over the whole frame. The main reasons for an unpleasant auditive feedback experience were the volume and pitch of the motor.
The threshold values determined in the first study can be compared with the results of Myles and Kalb (2010) for the temporal region, as threshold values around 2 µm were found. Since thresholds vary regarding to age, type of stimulation, and skin and medical conditions, the study setup and design are shown to be applicable for further measurements. Higher thresholds for the frequency of 140 Hz were shown for all participants. Age is one reason that the threshold tends to rise, as Stuart et al. (2003) found. With regard to the group exceeding the upper limit of the amplitude values, these results can be agreed upon. On average, an age difference of 14 years lies between both groups. Regarding the setup and procedure, the step size of the threshold measurement should be increased to lower the standard deviation. The vibration of the piezo element was audible when activated. Due to the bone conduction of the sound waves, it was not possible to suppress the perception of the noise. Since similar results were acquired as in current literature, the results are still taken as reliable. Concerning vibrotactile feedback design in head-worn eye tracking applications, a lower range could not be determined. As an indication, the amplitude has to exceed the 5.7 µm frequency used by a factor of at least 3 in further studies. This is estimated by the conversion of the presented data by Stuart et al. (2003).
In the second study, the statistical analysis showed that no significant differences could be found between the AB conditions. The occurring acceleration of the glasses caused by vibration was measurable by the built-in accelerometer. An effect on the precision and accuracy could not be found. Since the markers had a diameter of 20 mm, the errors in precision only surpass an error greater 20 mm in the periphery. This can be shown for all participants for M8–M13 and in one case at the centred marker. In Table 1, examples are shown of the data of participants 3 and 4. These deviations can be caused by outliers, since the data were not filtered to receive more reliable data. Higher errors can be reasoned by an insufficient detection of the pupil in the periphery, as shown by Thibeault et al. (2019).
Accuracy errors found in this study rise up to a maximum of 290 mm in comparison to a steady map. Such errors can occur with different effects. The distance to the board may vary slightly, as well as the position of the glasses for each measurement, since the participants were allowed to move their head between measurements. It is assumed that such deviations occur due to systematic errors. For example, they are caused by calibration errors. These repeat for all measurements. Sliding window and scaling can minimise such errors. Other sources of error can influence the result. If the resulting tilt angle of the head and distance to the board is calculated from the maximum sliding window and scaling factor, a tilt of 10∘ around the z axis and a variation of distance with +12 and −29 cm are derived. Since the head position may differ slightly from the estimated position of the static map, it is conceivable that the sliding window factor is composed of the head position and calibration error. The expected distance variation caused by a wrong head position is estimated to be less than 1 cm. It is assumed that another reason is the tilt between the level of the glasses and the level of the markers. Because of that, some markers appear closer and bigger in the scene camera. In the statistical analysis of the accuracy, significant differences between the conditions were found, when comparing all measurements with each other using Friedman's test. The Dunn–Bonferroni test used as a post hoc test showed no significance for each measurement. As a reason for these outcomes, it was analysed that a very low statistical power exists (β<0.2), due to a small difference between both conditions and the sample size of 10 participants. As the survey on the satisfaction and comfort of the feedback revealed a slight dissatisfaction with the frequency and amplitude mentioned, no measurements were carried out with further participants in order to improve the statistical power. One measure for increased comfort is to reduce the strength of the vibration. This will also reduce the impact on the glasses.
Eye-tracking-based controls can be used with the presented setup if the object is near the centre of the field of view. Under this condition, the error in precision and accuracy is minimised. The results show that the measured values scatter in accuracy within a range of 2 cm at a target distance (between participant and screen) of 1 m and that in most cases accuracy improved with the sliding window and scaling factor. Regarding the errors in accuracy, error handling is needed for the continuous use of eye tracking controls. Different approaches suggest the use of gaze gestures or longer dwell times to improve reliability (Kangas et al., 2017). These methods are limited when we consider challenges such as slipping of the glasses. Both eye tracking methods can be combined and supported with the use of artificial feedback. Assistive technology users could benefit from artificial feedback.
Considering the design of the feedback, the amplitude should be lower than 75 µm, since the feedback was rated as too strong in the questionnaire. Similar occurrences were also found in the results of Myles and Kalb (2010). Further, Myles and Binseel (2007) stated that frequencies above 150 Hz are not recommended, due to causing headaches, nausea and other medical conditions. It could not be precisely determined whether these complaints were triggered by the vibrotactile feedback, auditory feedback or both. For this reason, the frequency should be adjustable by the participant and lower than 60 Hz to reduce auditory stimulus and increase user satisfaction. This measure was also confirmed by Stuart et al. (2003). Finally, regarding the design of the feedback, the placement of the stimulus should be reconsidered. For example, the system should be placed behind the ear to reduce the vibration of the glasses frame.
The application of vibrotactile feedback was evaluated for a head-worn eye tracking device. Threshold measurements and empirical surveys in two studies indicated feasible intervals for amplitudes of vibrotactile feedback at the temple. No significant difference on the precision and accuracy of measurement data with deactivated and activated vibrotactile feedback could be found. As shown in the sliding window and scaling factor, the error can be reduced to a few millimetres. Regarding people with reduced motor control, methods such as gaze gestures should be considered or calibration techniques for a continuous minimisation of the error while using the glasses. The applied vibration was characterised with an amplitude of 75 µm and a frequency of 140 Hz. The survey showed that the high amplitude was rather uncomfortable for the participants. Based on these results, it is assumed that vibration has no effect on gaze detection. However, weaker vibration should be used for user experience and learning behaviour studies. It will be part of future works to evaluate whether artificial feedback supports the control of smart wheelchairs and robotic arms for handicapped people.
The data that support the findings of this study are publicly available on GitHub in the repository “EyeTrackingDataSet” at https://doi.org/10.5281/zenodo.7065014 (Fischer, 2022).
AF designed the studies and carried them out. AF developed the MATLAB code. AF, TW, PG and LS developed and tested the setup used. AF and KvL developed the methodology of statistical analysis for the studies. AF prepared the manuscript, with contributions from all co-authors. All co-authors reviewed and edited the publication.
The contact author has declared that none of the authors has any competing interests.
Publisher's note: Copernicus Publications remains neutral with regard to jurisdictional claims in published maps and institutional affiliations.
This article is part of the special issue “Sensors and Measurement Systems 2022”. It is a result of the “Sensoren und Messsysteme 2022, 21. ITG/GMA-Fachtagung”, Nuremberg, Germany, 10–11 May 2022.
We would like to thank all participants who took the time to participate in this study. The studies were permitted by the University of Siegen under the file number LS_ER_68.
This research has been supported by the Deutsche Forschungsgemeinschaft (DFG, German Research Foundation) (grant no. 426605889).
This paper was edited by Jürgen Wöllenstein and reviewed by three anonymous referees.
Antfolk, C., D'Alonzo, M., Rosén, B., Lundborg, G., Sebelius, F., and Cipriani, C.: Sensory feedback in upper limb prosthetics, Expert Rev. Med. Devic., 10, 45–54, https://doi.org/10.1586/erd.12.68, 2013. a
Borg, E., Rönnberg, J., and Neovius, L.: Vibratory-coded directional analysis: evaluation of a three-microphone/four-vibrator DSP system, J. Rehabil. Res. Dev., 38, 257–263, 2001. a, b
Choi, S., and Kuchenbecker, K. J.: Vibrotactile Display: Perception, Technology, and Applications, P. IEEE, 101, 2093–2104, https://doi.org/10.1109/JPROC.2012.2221071, 2013. a
Cio, Y. L., Raison, M., Leblond Menard, C., and Achiche, S.: Proof of Concept of an Assistive Robotic Arm Control Using Artificial Stereovision and Eye-Tracking, IEEE T. Neur. Sys. Reh., 27, 2344–2352, https://doi.org/10.1109/TNSRE.2019.2950619, 2019. a
Clark, A. and Ahmad, I.: Interfacing with Robots without the use of Touch or Speech, in: PETRA '21: The 14th PErvasive Technologies Related to Assistive Environments Conference, Corfu, Greece, 29 June–2 July 2021, Association for Computing Machinery, NY, USA, 347–353, https://doi.org/10.1145/3453892.3461330, 2021. a, b
Dragomir, A., Pana, C. F., Cojocaru, D., and Manga, L. F.: Human-Machine Interface for Controlling a Light Robotic Arm by Persons with Special Needs, in: 2021 22nd International Carpathian Control Conference (ICCC), Velké Karlovice, Czech Republic, 31 May–1 June 2021, IEEE, 1–6, https://doi.org/10.1109/ICCC51557.2021.9454664, 2021. a
Fischer, A.: AnkeLinus/EyeTrackingDataSet: Zenodo Release, Version v1.0.1, Zenodo [data set], https://doi.org/10.5281/zenodo.7065014, 2022. a
Kangas, J., Rantala, J., Akkil, D., Isokoski, P., Majaranta, P., and Raisamo, R.: Vibrotactile stimulation of the head enables faster gaze gestures, Int. J. Hum.-Comput. St., 98, 62–71, https://doi.org/10.1016/j.ijhcs.2016.10.004, 2017. a, b
Kingdom, F. A. A. and Prins, N.: Psychophysics: A Practical Introduction. A practical introduction, 1st edn., Elsevier, ISBN: 978-0-12-373656-7, 2010. a
Leaman, J. and La, H. M.: A Comprehensive Review of Smart Wheelchairs: Past, Present and Future, IEEE T. Hum.-Mach. Syst., 47, 486-499, https://doi.org/10.1109/THMS.2017.2706727, 2017. a
Moore, C. H., Corbin, S. F., Mayr, R., Shockley, K., Silva, P. L., and Lorenz, T.: Grasping Embodiment: Haptic Feedback for Artificial Limbs, Front. Neurorobotics, 15, 662397, https://doi.org/10.3389/fnbot.2021.662397, 2021. a
Myles, K. and Binseel, M. S.: The Tactile Modality: A review of tactile Sensitivity and human tactile Interface, Defense Technical Information Center, report no. ARL-TR-4115, https://apps.dtic.mil/sti/citations/ADA468389 (last access: 9 September 2022), 2007. a, b
Myles, K. and Kalb, J. T.: Guidelines for Head Tactile Communication, Defense Technical Information Center, report no. ARL-TR-5116, https://apps.dtic.mil/sti/pdfs/ADA519112.pdf (last access: 9 September 2022), 2010. a, b, c, d, e, f, g
Rantala, J., Kangas, J., Akkil, D., Isokoski, P. and Raisamo, R.: Glasses with haptic feedback of gaze gestures, in: CHI EA '14: CHI '14 Extended Abstracts on Human Factors in Computing Systems, Toronto, Ontario, Canada, April 2014, Association for Computing Machinery, NY, USA, 1597–1602, https://doi.org/10.1145/2559206.2581163, 2014. a, b
Sharma, V. K., Saluja, K., Mollyn, V., and Biswas, P.: Eye Gaze Controlled Robotic Arm for Persons with Severe Speech and Motor Impairment, in: ETRA '20 Full Papers: ACM Symposium on Eye Tracking Research and Applications, Stuttgart, Germany, June 2020, Association for Computing Machinery, NY, USA, 12, 1–9, https://doi.org/10.1145/3379155.3391324, 2020. a
Sigrist, R., Rauter, G., Riener, R., and Wolf, P.: Augmented visual, auditory, haptic, and multimodal feedback in motor learning: a review, Psychon. B. Rev., 20, 21–53, https://doi.org/10.3758/s13423-012-0333-8, 2013. a
Stuart, M., Turman, A. B., Shaw, J., Walsh, N., and Nguyen, V.: Effects of aging on vibration detection thresholds at various body regions, BMC Geriatr., 3, 1, https://doi.org/10.1186/1471-2318-3-1, 2003. a, b, c, d
Sunny, M. S. H., Zarif, M. I. I., Rulik, I., Sanjuan, J., Rahman, M. H., and Ahamed, S. I.: Eye-Gaze Control of a Wheelchair Mounted 6DOF Assistive Robot for Activities of Daily Living, J. NeuroEng. Rehabil., 18, 173, https://doi.org/10.1186/s12984-021-00969-2, 2021. a
Thibeault, M., Jesteen, M., and Beitman, A.: Improved Accuracy Test Method for Mobile Eye Tracking in Usability Scenarios, Proceedings of the Human Factors and Ergonomics Society Annual Meeting, 63, 2226–2230, https://doi.org/10.1177/1071181319631083, 2019. a, b, c, d, e, f
Tobii AB: Tobii Pro Glasses 2 User's Manual, Version 1.1.3, https://connect.tobii.com/s/g2-downloads?language=en_US (last access: 9 September 2022), 2020. a
Tobii Technology: Accuracy and precision test method for remote eye trackers, https://stemedhub.org/resources/3311/download/Tobii_Test_Specifications_Accuracy_and_PrecisionTestMethod_version_2_1_1_.pdf (last access: 9 September 2022), 2011. a
Wichmann, F. A. and Hill, N. J.: The psychometric function: I. Fitting, sampling, and goodness of fit, Percept. Psychophys., 63, 1293–1313, https://doi.org/10.3758/BF03194544, 2001. a