the Creative Commons Attribution 4.0 License.
the Creative Commons Attribution 4.0 License.
 | 11 Apr 2023
Digital twin concepts for linking live sensor data with real-time models
Reiner Jedermann
Kunal Singh
Walter Lang
Pramod Mahajan
For taking most advantage of live or real-time sensor measurements, data have to be processed by a single or even by a chain of models on the fly, in contrast to earlier offline simulation solutions. This requirement can be best met by concepts developed under the general term “digital twin” (DT). The step from the Internet of Things (IoT) to a full exploitation of DT solutions entails new challenges but also provides new features, which we discuss based on our example DT solution for remote monitoring of fruit during ocean transportation. A crucial challenge is the transformation of models into an updateable format, necessary to keep the physical object and its modelled representation in sync. A basic new feature of DTs is new software solutions for easy and flexible linking of different models through a streaming platform by implementing an event-driven architecture. We demonstrate a solution for controlling model execution during multiple life cycle phases of the fruit as physical object. An evaluation of response times showed that server performance is sufficient to handle more than 100 DT instances per second.
- Article
(2769 KB) - Full-text XML
- BibTeX
- EndNote


Digital twins (DTs) have gained much attention in recent years, both in industry and in the research community. According to Defraeye et al. (2021), a DT is a replica of a physical object, representing its properties as close as possible, but now in the digital world and preferably in real time. The digital replica enables users to predict the future behaviour of the real object or to test possible intervention before applying them in the real world. Most DT applications are currently found in logistics, manufacturing, and operational research. Sensors play only a limited role in such applications. The connection from the real to the digital world is mostly implemented by RFID readers. Information consists of discrete values, e.g., the object ID number, or it can be reduced to a two-stage output, giving information on whether the object has arrived at the expected location or not. However, in general, sensors are giving continuous output signals, such as temperature, humidity, or concentration of a chemical substance. In this article, we ask and review how such continuous sensor output can be integrated into DTs.
Continuous sensors require mathematical processing, mostly far beyond simple threshold checking, including prediction of future values, filling gaps due to a reduced set of sensors, and estimation of product life cycle or quality data. For example, when the core temperature of an object is not possible to measure directly, this gap can be filled by deducing it from the surface temperature, where the sensor is easier to install. Deviations from the recommended operation and storage conditions cause a certain amount of stress to the object, such as wearing of a mechanical object or quality loss of a food product, leading to another class of models. These models must be updated after each new measurement. This real-time feature of DTs is often stressed in literature, but practical recommendations on how models can be made updateable for processing real-time or live sensor data are almost missing (Cronrath et al., 2020). In this article, we consider this question in detail.
The paper is organized around an example from our own research. For more than 10 years, we have worked on the remote monitoring of refrigerated ocean containers with food products. A total of five field tests were carried out with our “Intelligent Container” (IC) project for the transport of bananas from Central America to Europe. During these tests, we already evaluated required Internet of Things (IoT) technologies for DTs such as wireless sensors, communication gateways, and data transfer via Wi-Fi, satellite, and cellular networks. The last three field tests also included artificial ripening of bananas inside the container (Jedermann and Lang, 2021).
Various models to predict biological and thermal processes inside the container were developed during the project. The “Green-Life” model predicts the expected time span until an unwanted ripening process commences, meaning the bananas can no longer be used commercially. The second so-called “cool-ident” model estimates a factor to describe the thermal coupling between circulating cooling air and a banana box. The third “Ripening” model estimates the current heat production by biological processes as an indicator for the progress of ripening.
In summary, sensors and IoT technologies are available, as well as prediction and analysis models, and now, the transformation into a DT seems to be the next logical step, leading us to the following question: what are the essential new features, challenges, and concepts of DTs that can help us to include live sensor data in process models?
The question was discussed at the 21st ITG/GMA-Fachtagung “Sensoren und Messsysteme” conference (Jedermann et al., 2022b). We now present an extended version of our contribution.
Modelling the relation between temperature deviations and resulting quality changes in agricultural products has a long tradition in biological research. A common scale to describe the fruit quality is the shelf life, giving the remaining number of days until the quality falls below an acceptance threshold, meaning the product must be disposed of. A list with model parameters for 60 different fruit and vegetables can be found in the literature (Tijskens, 2004). Online tools to calculate the shelf life for six products were provided by the FRISBEE project (Gwanpua, 2015). Some temperature data loggers provided an integrated shelf-life model. The Verigo Bluetooth logger warns by an LED about predicted quality problems (Jedermann et al., 2017). These solutions are limited to manual data transfer to the mathematical simulation or to the online platform. In other data-logger-based solutions, data exchange is only possible at certain checkpoints via Bluetooth or RFID readers.
IoT solutions, such as the remote container monitoring system by Maersk (Zarkani and Rasmussen, 2016), focus more on the state of the cooling unit and container location and less on the product temperature in the cargo hold; therefore, they lack a detailed analysis of product temperature data. Recent research combines computational fluid dynamics (CFD) modelling for the influence of packing and airflow with biological models (Defraeye et al., 2019), but this is also limited to simulation. However, the importance to link models with individual-sensor data was emphasized by the same group of authors (Defraeye et al., 2021): “Each shipment is subject to a unique and unpredictable set of temperature and gas atmosphere conditions”.
The prevalence of simulation models led Wright and Davidson (2020) to the following question: “Is it a DT or just a model?” Instead of excluding some applications from being a DT, Uhlenkamp et al. (2019) suggested a taxonomy to evaluate and compare different DT applications, saying that: “Each DT is legitimate in its corresponding context, which makes an overarching definition of DT more abstract and thus difficult to comprehend and to imagine”. Their taxonomy includes seven dimensions or scales. We highlight only three dimensions, which have the most relevance for the question of sensor integration. The first one is the data integration level: basic digital twins offer only offline simulation with manually feeding recorded data into models. More advanced solutions offer automated data transfer from the real object to the twin. The most advanced stage is achieved by two-way communication to send back information or control commands to the real object.
The second taxonomy scale evaluates how detailed the product's life cycle is covered. The digital twin can focus on a single phase or provide specific models for different phases.
The type of goal of the DT application is the third scale with high relevance for sensor integration. Uhlenkamp et al. (2019) discern four levels. (1) Information acquisition only acquires and displays sensor information about the object by using IoT technologies in basic twins. (2) Information analysis evaluates internal properties of the object and predicts its future behaviour. (3) Decision support provides virtual experiments, during which the outcome of corrective actions can be evaluated by simulation of the DT platform before applying the intervention on the real object. A what-if scenario, for example, can test the effect of different temperature set-point values on the temperature and product quality at the expected end of the transport. (4) Action implementation can be realized by an automated system for testing different possible interventions and selecting the most beneficial one. The feedback loop is closed by sending a control command back to the real object to trigger the corrective action.
The above-mentioned biological applications have mostly a low data integration level. This is not only due to lacking communication technology but also due to lacking knowledge on how a complex simulation model can be converted into an updateable format for integration of live sensor data. In the next section, we will focus on this question.
DTs can do more than merely visualize remote sensor data. In general, a physical object, such as a box of fruit inside the container, has more quantities of interest than the number of actual measurable properties. The former ones are the system states x(t), and the latter ones are the system outputs y(t). Additional known control inputs, such as the set-point temperature, are denoted as u(t).
In our reefer container example, we were only able to measure the box core and the air supply temperature close to the outlet in the container floor directly. These system outputs are disturbed by sensor noise, which must be considered during detailed modelling.
The remaining green life is a common indicator value to describe the quality of fresh bananas, giving the number of remaining days until transport must be completed and the commercial ripening process must be started. Otherwise, there is a high risk of an unintended, self-induced ripening, leading to a loss of the product.
The green life is considered the first “hidden” state, which cannot be directly measured but deduced from the measurements by adequate modelling. If the model has only to trace accumulated changes in a quality attribute, the estimation of a hidden state can be straightforward, as in the above case for green life change or, for example, for the wear of a mechanical component in relation to measured mechanical stress. The object starts with an initial budget of quality. According to the length and magnitude of deviations from the optimal transport and handling conditions, a certain amount is subtracted from the budget for each time interval. In mathematical terms, the state must stand in a direct integral relation to a measurable property.
Bananas can produce tremendous amounts of heat by converting starch to sugar. The current biological activity or heat production can be considered a second hidden state. Unfortunately, this and many other hidden states require a more elaborated approach for estimation, as introduced in the next section. Other system states might be non-observable, e.g. the concentration of an enzyme contributing to quality loss but without causing temperature changes.
The first question when planning sensor integration into a DT should be to ask which states are directly measurable, hidden, or non-observable (Jedermann et al., 2022a). According to the definition of state-space representation of dynamic systems (Kalman 1963), the number of states is equivalent to the number of first-order differential equations, necessary to describe the system with sufficient accuracy. Depending on the available sensors, some of the states can be directly measured. The remaining states are hidden; that is, they can only be estimated by mathematical algorithms (so-called state observers). The estimation of hidden states is not a compulsory feature of DTs. However, such additional signal processing gives valuable information to the user. State observers are the method of choice if the DT should estimate system properties that cannot be directly measured but are related to measurable values through differential equations. For example, if it is only possible to mount sensors on the box surface, the core temperature must also be estimated by modelling.
The principles behind estimating hidden states can be best understood in the light of systems theory. The mathematical description of the system behaviour is given in the so-called state-space form (Fig. 1). In this, the changes in the states x(t) over time are described by ordinary differential equations with x0 as the unknown initial state and with the control variables u(t) as inputs. In the linear case, the differential equations can be written in matrix form. Unknown stochastic influences are added as system noise wI(t) to the changes in the states. The measurable outputs are a linear combination of the states with added measurement noise wM(t).
The Kalman filter (Brown and Hwang, 2012) is a common approach to estimate the internal system states based on the known or measured system inputs and outputs. In principle, such a state observer can estimate multiple states based only on a single measured variable, but a poor relation between the number of input and target variables makes the filter more noise sensitive.
For the non-linear case, more elaborate methods can be applied such as hidden Markov processes (Cronrath et al., 2020).

The prediction of object properties, which cannot be directly measured, is the first key challenge for sensor-based DTs. Besides the above-introduced state observers, machine learning techniques can be applied. It must be kept in mind that problems of non-observability remain, independent of the estimator approach.
The ability to provide estimations for such hidden properties is one of the key features in which DTs go beyond previous IoT solutions and offline modelling.
An extensive and concise description of a physical object has to contain several models. For various reasons, it is recommendable to handle the models separately on the DT platform. Models can originate from different research groups. They might be available in different mathematical description formats and programming languages. They might even only run on a dedicated server, e.g., CFD airflow simulations.
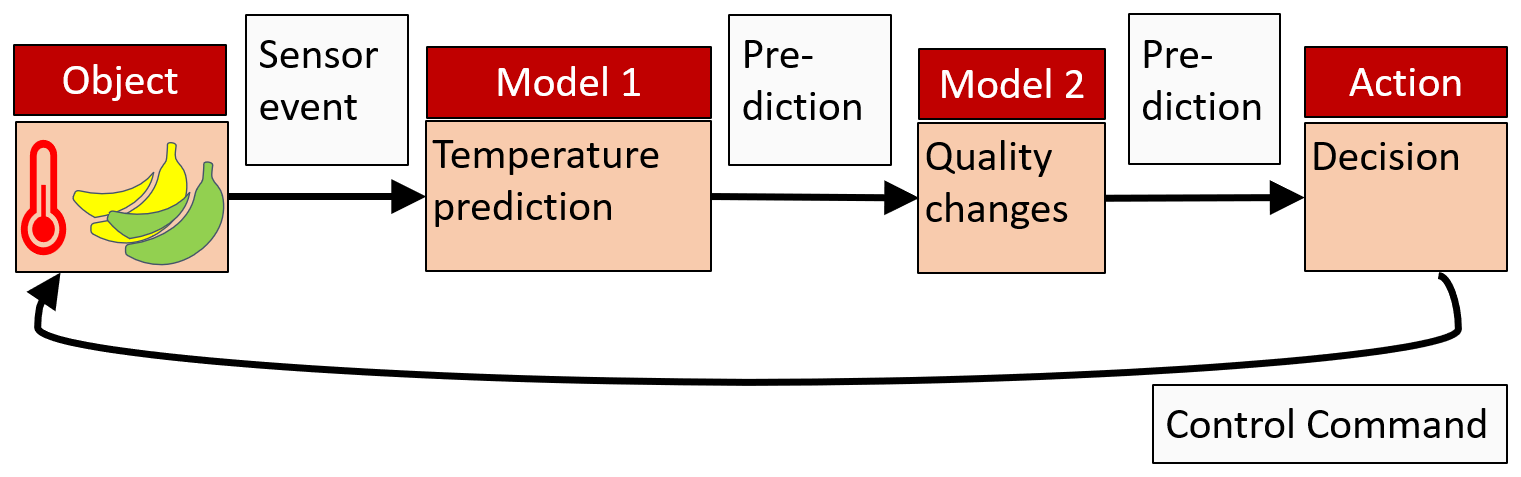
The models can often be arranged in a processing chain or pipeline. A sensor provides the temperature data. A first model calculates the expected future development of temperature for the remaining transport duration. Based on this prediction, a second model predicts the quality state for the expected time of arrival. A third process makes decisions about possible interventions and sends back control commands to the physical object (Fig. 2).
In our recent research, we hard-coded the models in a single software program without using a general standard format for data exchange. However, for an increasing number of model types, such proprietary solutions are less adequate, especially if different product life cycles require different model combinations. This leads us to the second key feature, which drives DTs beyond IoT and isolated modelling approaches. DTs provide software platforms for linking models of various sources through a programming-language-independent message format.
One common approach to implement such platforms is the software pattern of “event-driven architecture”. Sensors and models communicate through topics. A sensor publishes its measurement to a certain topic, which holds, for example, the temperature data for one container. All models are considered to be event-driven processes.
After subscription to a certain topic, the model is notified when new data are available. Such events can contain a new sensor measurement or an updated model prediction, e.g. for product quality. Each sensor measurement is processed as soon as it becomes available. Model results are published to another topic, to which in turn other subsequent models subscribe. Another type of event is sent if the product enters a new life cycle, e.g. after arrival (Sect. 9).
All publishers and subscribers are linked through a common streaming platform. After comparing different platforms (Singh and Jedermann, 2022), we decided to follow the architecture suggested by Kamath et al. (2020), combining three different databases. This approach includes some redundancy but provides the most flexible data access. (1) The Message Queuing Telemetry Transport (MQTT) protocol has become one of the standards for sensor data transmission in IoT. However, other solutions provide more flexibility and performance. Therefore, the MQTT broker was only applied as data format translator. The broker received the sensor data and published it to Kafka as the central streaming platform. (2) The open-source Apache Kafka platform is dedicated to event processing (López, 2021). Kafka provides access to data from the last 7 d by default, apart from forwarding live sensor data. Data access in MQTT is limited to live data; past data are discarded. . Kafka was designed for high performance. Topics can be distributed over multiple servers for faster access, although this was not necessary in our project. (3) InfluxDB is an open-source database, which is optimized for serial data, i.e., data organized by consecutive time stamps. InfluxDB was used for long-term storage and to query data in table format.
Finally, the open-source tool Grafana was added for visualization by various dashboards.
All models were connected to Kafka by publish–subscribe interfaces over a network socket. In this way, models, written in different programming languages and running on different computers, could be connected to the streaming platform.
Access methods for publish and subscribe are provided by various libraries, such as “kafka-clients.jar” for Java or “kafka-python” for Python. We integrated these methods for several models for testing. However, the MATLAB library had low performance and other limitations. Instead, we used the Java library as an intermediate layer (Singh and Jedermann, 2022).
The overall system is depicted in Fig. 3. The sensors send their measurements as events through the MQTT bridge to the Kafka streaming platform. Different models are connected to the platform via publish–subscribe interfaces. Measurements and model predictions are copied to InfluxDB for long-term storage. Grafana reads data from InfluxDB for updating various dashboards. The platform comprises several standard and open-source software components. It can be applied with minor modifications (marked red in Fig. 3) to various projects. For most measurement tasks, available IoT and wireless sensors can be used. Depending on the project, specific sensors have to be added. Examples are described in the following section. The second project-specific task concerns the models. Models must be converted to an updateable description, and they must be equipped with publish–subscribe interfaces.

Besides temperature and humidity, the detailed measurement of the conditions for refrigerated fruits requires sensors for airflow, gases, and direct condensation measurement on fruit surfaces. Such sensor technologies have been developed in subsequent projects of the Intelligent Container. A sensor called “air speed logger” was developed to measure the omnidirectional air speed in apple bulk shipments (Geyer et al., 2018). It consists of four interconnected plastic spheres, each with 80 mm diameter, adapted to the size of an apple fruit. In the free space between the spheres, silicon diodes are fixed for the air speed measurement based on the calorimetric hot-wire principle.
Recently, a new wetness sensor was developed for direct condensation measurement on fruit surfaces (Linke et al., 2021). It consists of an electrically conductive, self-adhesive film of 0.1 mm thickness glued on the fruit surface. The wetness sensor has already been used to understand the different phases of water vapour condensation and evaporation on the fruit surface for different postharvest scenarios, such as rewarming after cooling and cyclical temperature fluctuations.
A gas sensor system was also developed for measuring O2 and CO2 in real time with wireless communication (Keshri et al., 2019). It consists of a fluorescence-based optical O2 sensor (0 % to 25 %), a non-dispersive infrared CO2 sensor (0 % to 20 %), and batteries mounted in a hollow transparent resin sphere of apple size. The sensor has already been applied for in situ real-time monitoring of fruit respiration rate in commercial apple storage.
A high-resolution ethylene sensor was developed at laboratory scale (Sklorz et al., 2012). With a sensitivity below 100 ppb (parts per billion), first signs of an uncontrolled ripening process can be detected. However, portable devices with wireless communication are still lacking.
Bananas undergo a complex life cycle from farm to fork. Bananas are transported in a green, unripe state from Central America to Europe. After arrival, ripening is initiated with the help of ethylene gas in special chambers or directly in the container. Models are often only valid during certain life cycle phases and must be activated accordingly. In this work, we only considered the first four phases until commercial ripening (Fig. 4). (1) The bananas are washed and packed after harvest without cooling. (2) The bananas are loaded “warm” to a reefer container and cooling starts. Cooling continues during ocean transportation. (3) Between arrival at the port in Europe and the ripening chamber, cooling is interrupted for a few hours or even days. (4) The ripening process is carried out either in a special chamber or – as in our project – directly inside the Intelligent Container.
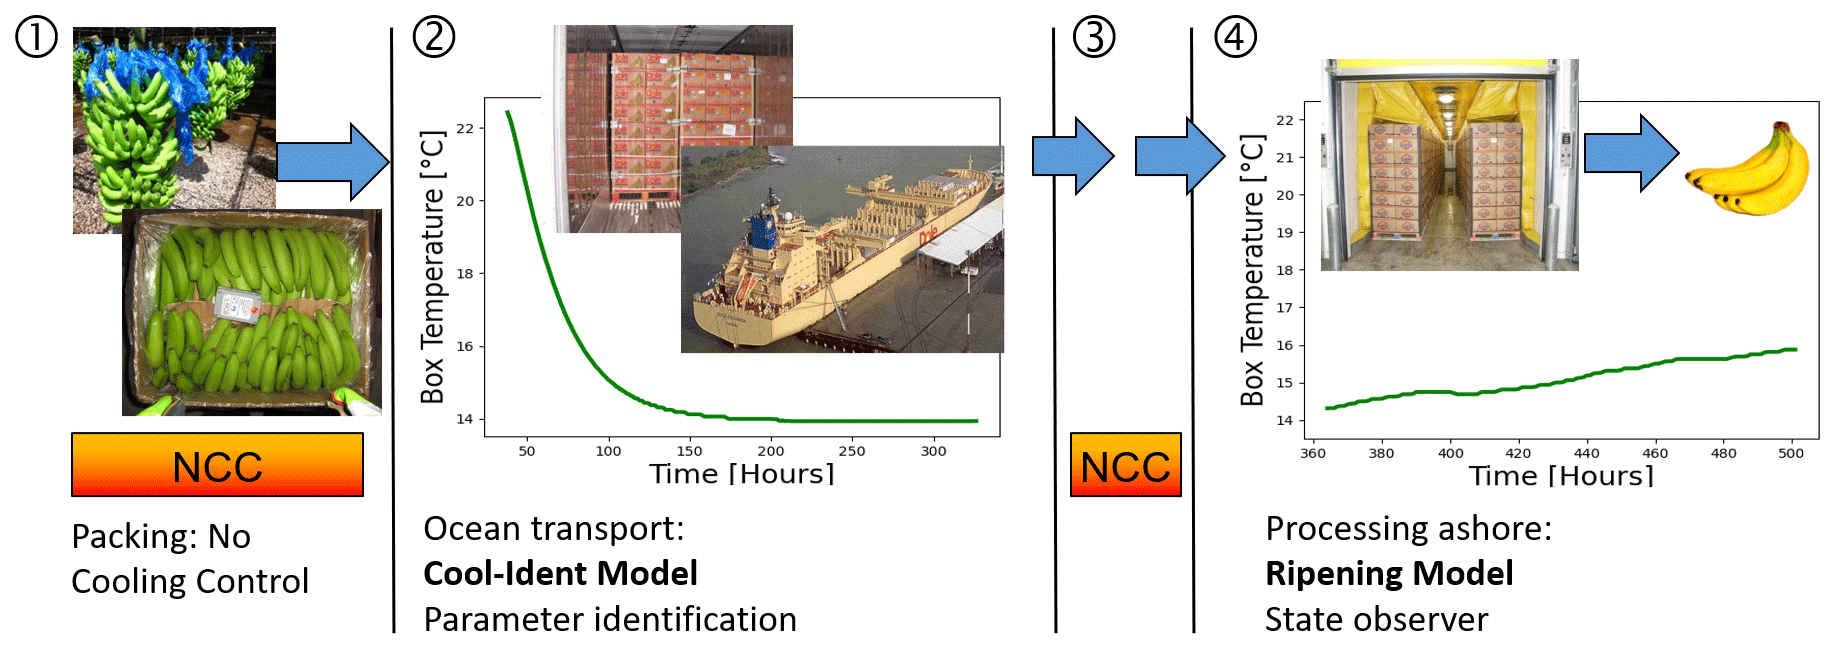
Figure 4The banana cool chain, processing chain, and related models (NCC represents no cooling control). Own illustration. Photo of cooling vessel provided by Dole. Banana icon downloaded from https://www.freepngimg.com/ (last access: 3 November 2022).
The Green-Life model should be applied until phase 3. After initialization of artificial ripening, it is no longer valid. Other models should only be applied during an individual phase, e.g., the temperature prediction model for container cooling in phase 2 and the Ripening model in phase 4. The correct time frame for these models is marked by transport events such as transport start and transport arrival, ripening start, and its completion.
In the following, we summarize three models, which we selected as examples for DT integration. More details about these models can be found in our earlier publications (Jedermann et al., 2013; Jedermann and Lang, 2014).
Freshly harvested green bananas have a green life of maximum 45 d (Jedermann et al., 2017). Even at optimal transport conditions of 13 ∘C, 1 d of green life is lost for each day of transport. The speed of quality loss accelerates with increasing deviations from the optimal conditions. The Green-Life model weighs deviations by an exponential relation to temperature difference and subtracts it from the remaining quality value for each measurement interval.
The bananas are cooled down from typically 25 to 14 ∘C during the first few days in the reefer container in phase 2. The speed of the cooling process varies inside the container, depending on position, the diameter of gaps between pallets, and their packing. The efficiency of cooling or the coupling of the banana boxes to the airstream is described by the first time-constant model parameter kM. Even in the green state, bananas produce a lower quantity of respiration heat, given by the second parameter kP.
By skilled formulation of the equations for this Cool-Ident model (Jedermann et al., 2013), the estimation of the two parameters can be reduced to a linear system identification problem (Fig. 5). Moreover, it is possible to formulate the parameter identification in incremental form, with the estimates becoming more accurate with each additional temperature measurement.
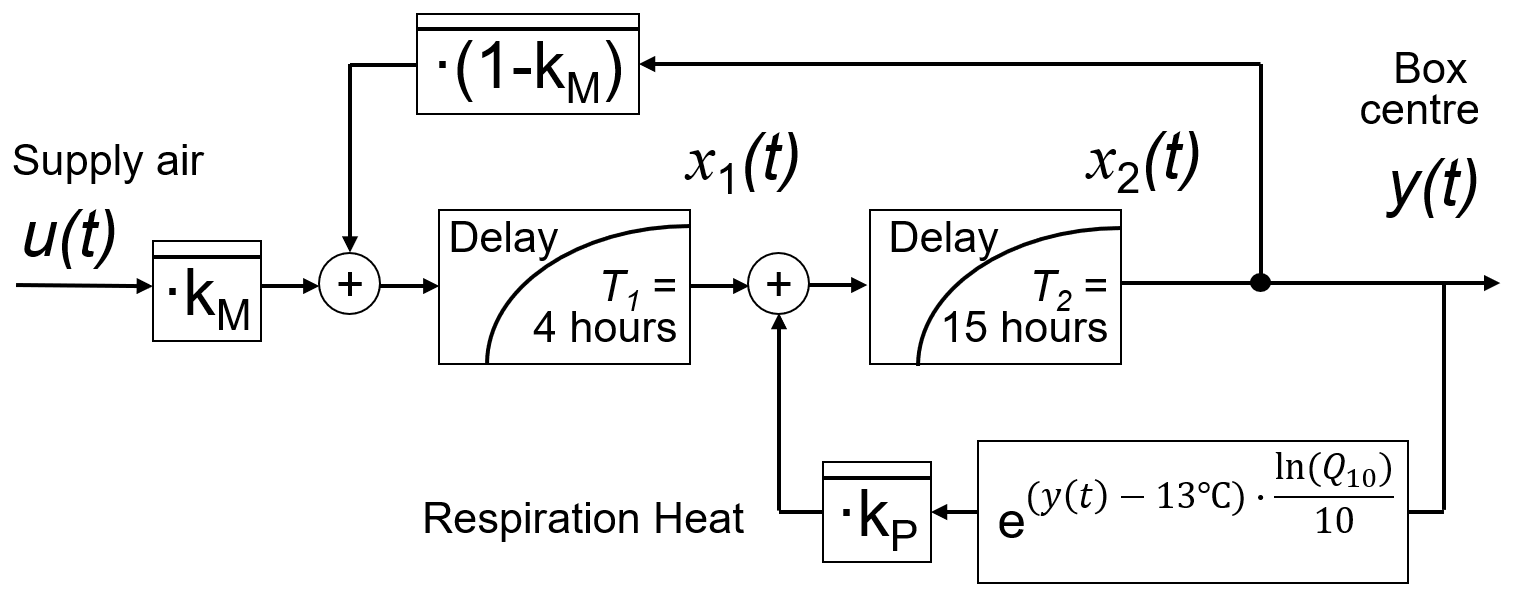
Figure 5Parameter identification in phase 2 by the Cool-Ident model. For details see Jedermann et al. (2013).
During ripening in phase 4, the heat production of bananas largely increases, and the heat production can no longer be described by the constant parameter kP but as an additional unknown time-variable system state. The heat removal from the box by the cooling unit can be calculated based on the finally estimated kM value, thus enabling the estimation of the biological heat production from the model. The model structure is modified according to Fig. 6. The states of this Ripening model can be estimated by the Kalman filter (Brown and Hwang, 2012). By observing changes in heat production, it can be monitored whether the ripening process has fully started or heat production has risen beyond a critical value, meaning ripening must be stopped by forced cooling and ventilation.
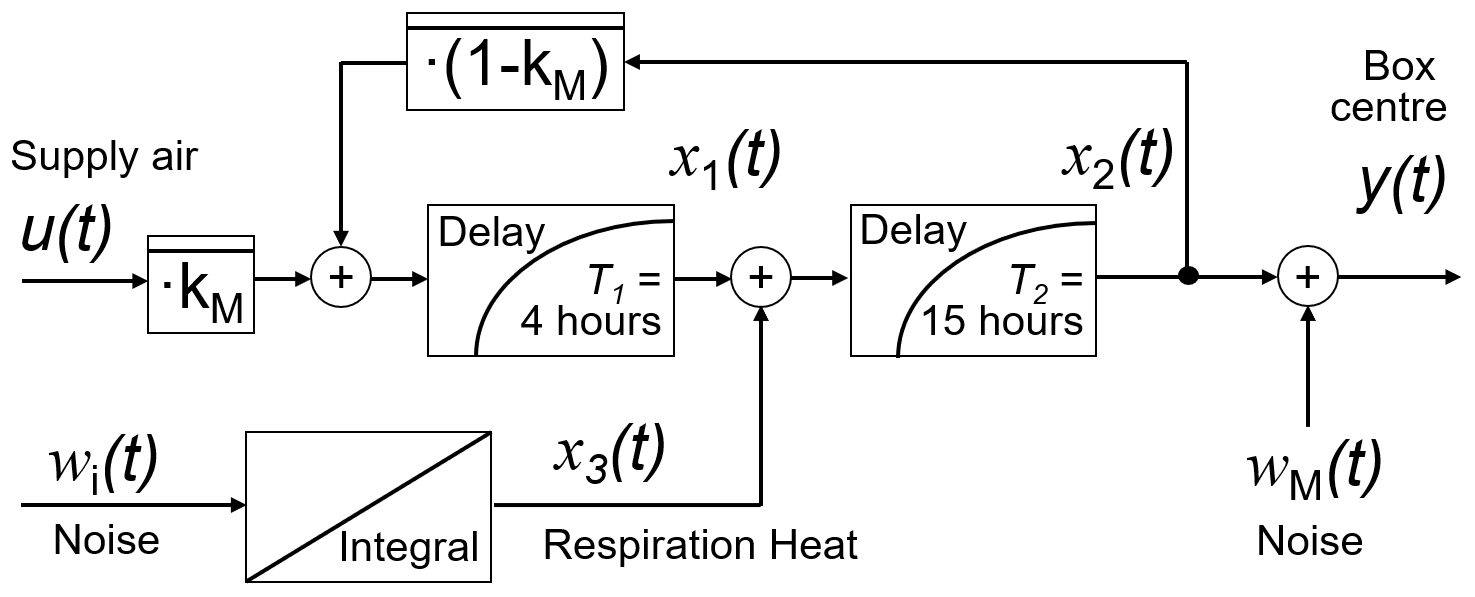
Figure 6Modified Ripening model for estimation of ripening heat during phase 4. For details, see Jedermann and Lang (2014).
The event-driven architecture largely simplifies the assignment of the models to certain life cycles, as well as inputs and outputs. The beginning of a new life cycle phase is marked by transport events such as “transport-start” or “start-ripening”. A configuration file can be defined for each cargo type. It contains a list of models related to that cargo type, which assigns transport events to model actions such as “start” or “stop” and which input and output topics should be used. Some models require information from earlier life cycle phases. They have to implement a “collect” method to record sensor or processed data from those phases.
For example, the Ripening model requires the kM value from the cooling model. It collects the output of the cooling model during the transport phase. Calculation of the Ripening model by event processing starts only later after the “start-ripening” event was received.
The bridge to copy data from MQTT to Kafka serves a second purpose: it scans the data for new sensor numbers, i.e., new transported items. If a new sensor is detected, it publishes an announcement message to a dedicated configuration topic in Kafka, containing all relevant information from the configuration file. All models subscribe to that configuration topic and start a new processing thread for the new item. The models enhance the input stream by the predicted values, e.g., for fruit quality, and publish the combination to their output topic.
The sensors and models send their measurements and predictions as JSON (JavaScript Object Notation) format. Transport events are included in the first sensor topic and forwarded through all subsequent topics.
The models can be programmed independently from each other. Models can run directly on the server, or if they require another operating system they can run on a separate workstation. Models can be exchanged with a newer version without stopping the whole framework. They only require a network connection to the Kafka streaming platform.
In order to generate reproducible results, the DT platform was not tested with live sensor data from a real transport but with a set of recorded data from previous tests (Jedermann et al., 2013). Measurements, recorded with an interval of 1 h, were played back with accelerated speed of 10 measurements per second. The required time to process a full data set was reduced to a few minutes. The DT platform receives either real sensor data or playback data over the same interface.
The Cool-Ident model (Fig. 5) was applied in the first step. It updates the estimation of the kM value after each measurement (Fig. 7). After initial fluctuations, the estimation converges to a stable value when temperature data for a period of 4 d becomes available. The local cooling efficiency on pallet level has a high heterogeneity over the length of the container, changing by more than 60 %. In earlier research, we found that the hotspot with the lowest cooling can be in almost any location (Jedermann et al., 2013), mostly caused by non-predictable variations of the gap widths between each pallet during stacking of the container. The distance to the cooling unit cannot be used as predictor for the temperature development.
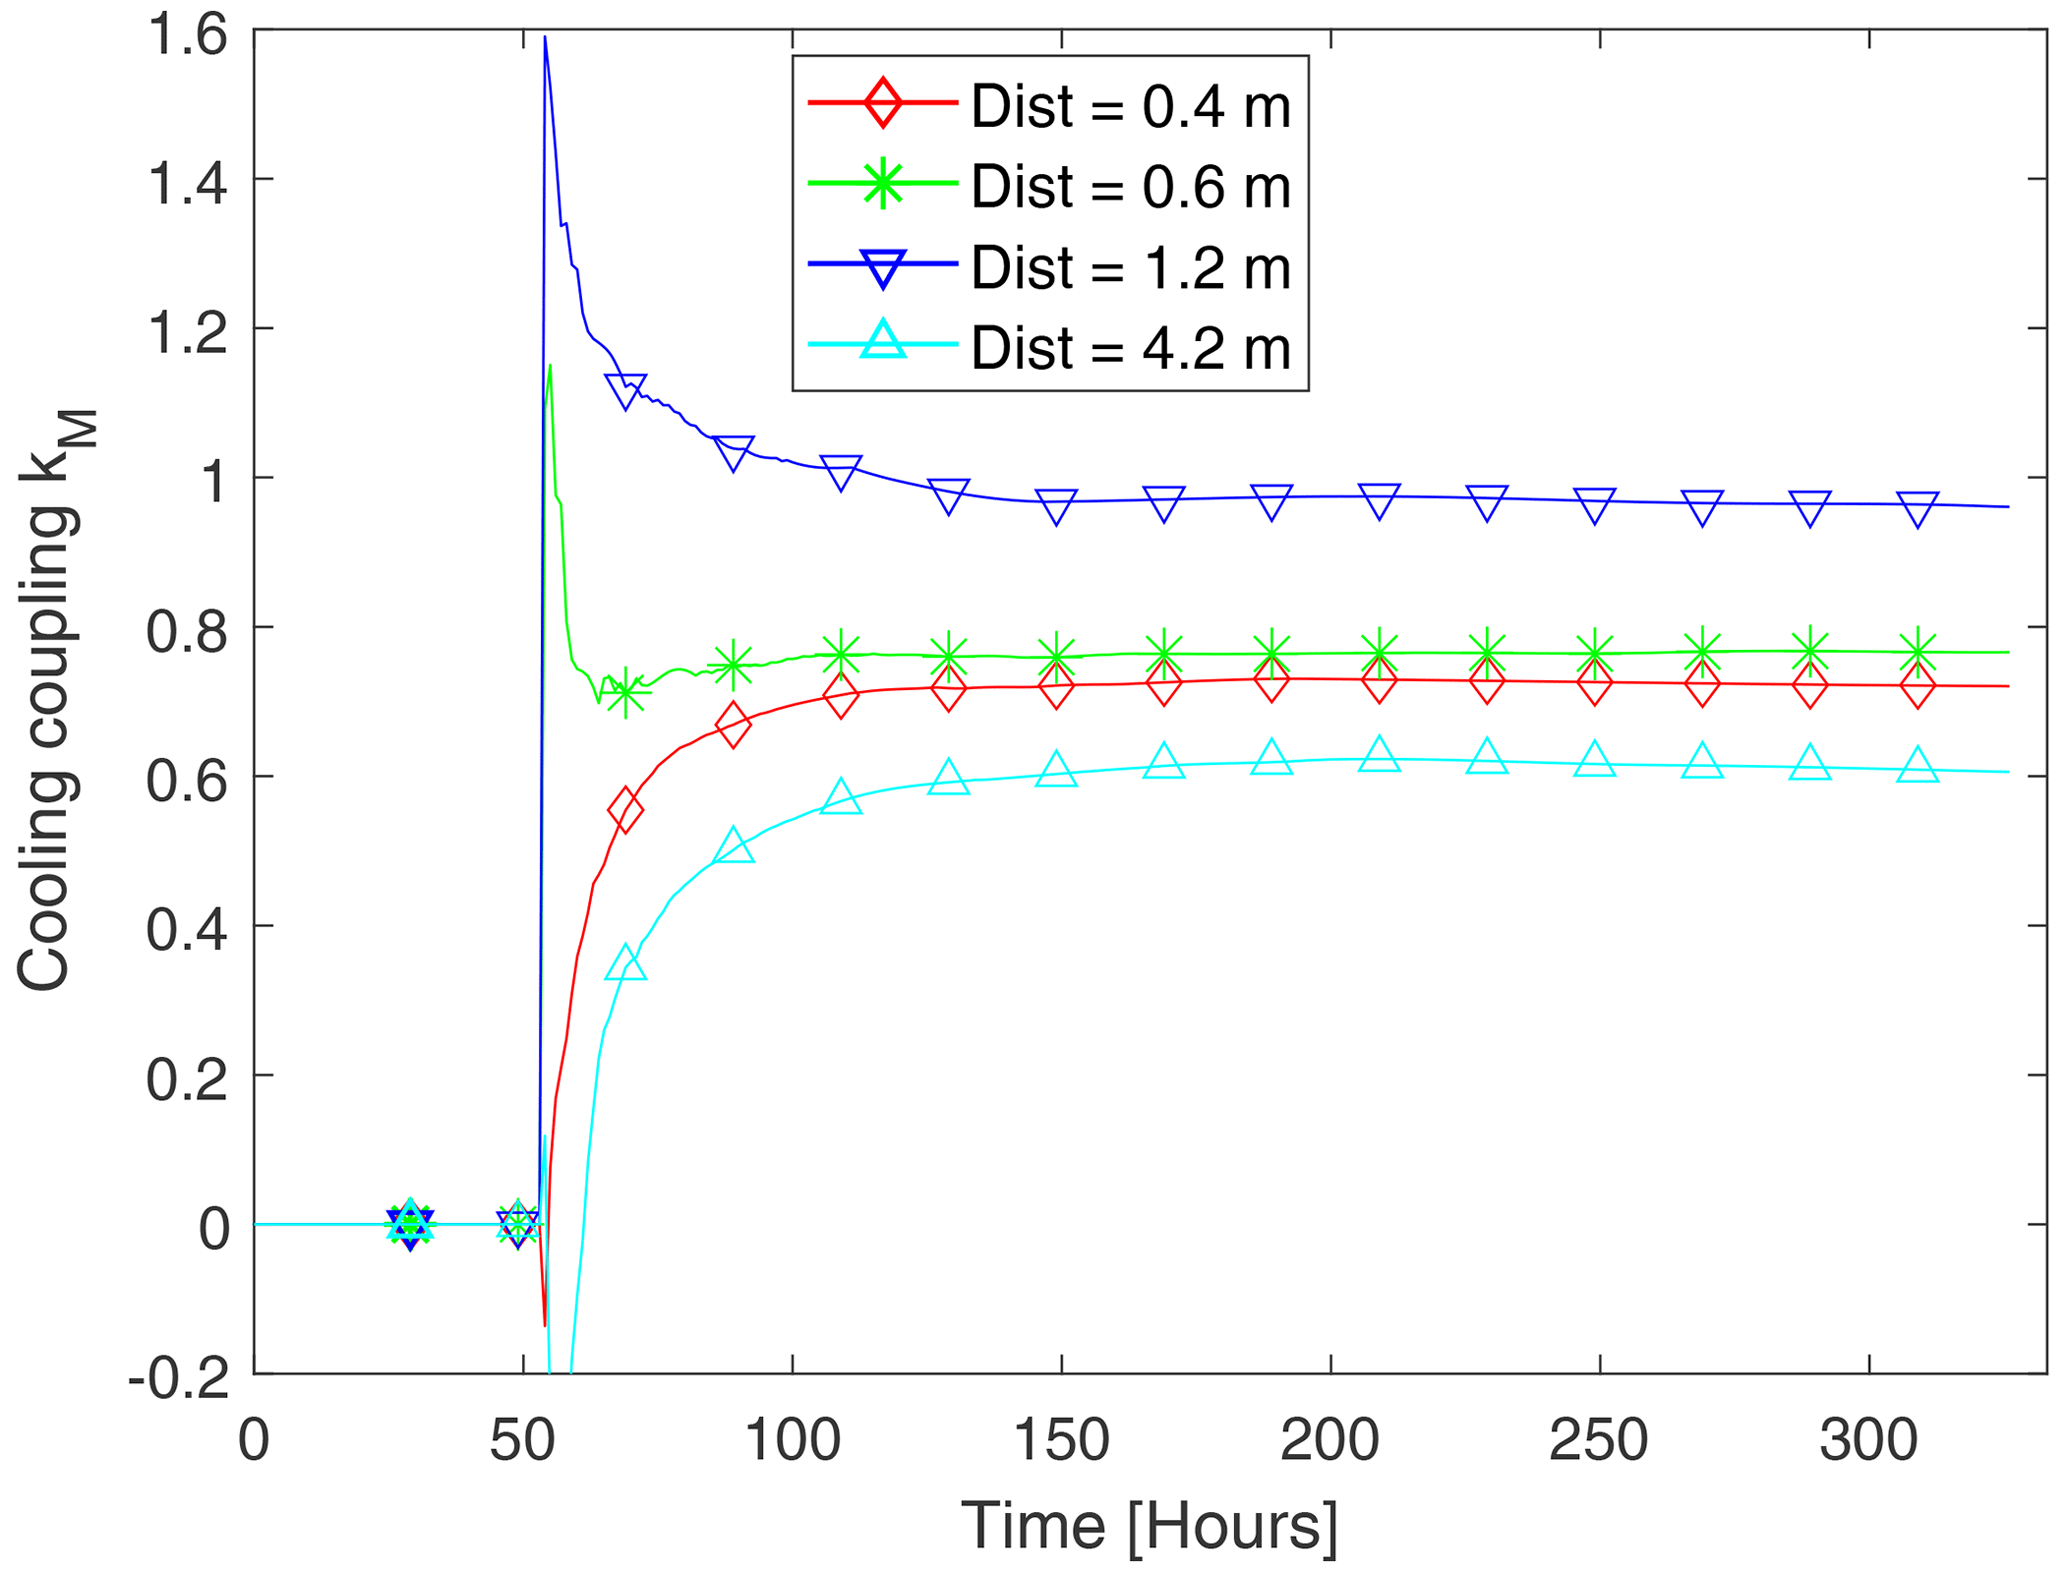
Figure 7Change of estimated kM values over time estimated by the Cool-Ident model. Banana boxes at different pallet positions inside the container. The legend gives the distances from the boxes to the cooling unit.
The last estimated kM values were fed into the Ripening model (Fig. 6). The values were used to calculate an initial estimate for the state x3. After start of ripening inside the container, the heat production could no longer be described with such a constant. The increase in the biological heat production during the ripening process is shown in Fig. 8.
The pallet at distance 1.2 m had the best cooling. Therefore, the ripening process could be better controlled for this pallet. The heat development was confined to a stable value as desired, whereas for the other pallets with less cooling efficiency the heat production continued to rise in an almost linear way. After 5.7 d, the ripening process was completed. The bananas were removed from the container and placed in a chamber with higher ventilation and cooling power to stop the process.

Figure 8Change of heat production during ripening, estimated by the Ripening model; same pallet positions as in Fig. 7.
The test of what-if scenarios is one of the advanced features of DTs. A container can have a poor cooling performance caused by wrong packing or old machinery equipment. The problem might become obvious only after the ship has left the harbour. In this case, the operator can evaluate the effect of set-point changes on the cargo temperature. Figure 9 demonstrates such a what-if scenario. The container had left the packing station with the set point adjusted to 13 ∘C. After 100 h, the what-if scenario was started. In a first step, kM, kP, and the initial state x0 are estimated. Afterwards the same model as in Fig. 7 is applied with the new set-point value as u(t).
Like transport events, a what-if scenario is triggered by a query event with the set point under test and the remaining transport duration as additional parameters, e.g., via a graphical user interface. The query can be repeated at a later point of time to achieve a more accurate estimation of kM and temperature prediction.

Figure 9Set-point scenarios and effect on predicted box temperature. Comparison with the actual measured temperature/set point of 13 ∘C.
Nevertheless, there is only little freedom to adjust the set point in the banana cooling chain. The scenario above was rather programmed for demonstration purposes.
A more practical what-if scenario must include the fruit processing and delivery planning, e.g., containers, which are predicted to have a low green life at arrival, and they can be prioritized for faster handling. The effect on other containers, which must be postponed in turn, should be assessed in advance.
A similar method as in Fig. 9 was applied to evaluate the accuracy of the Cool-Ident model. The model was initialized with the finally estimated kM and kP parameters, as well as the initial box temperature. The change of box temperature was simulated based on the measured supply air temperature over time. The predicted and measured box temperatures were in good alignment with a root-mean-square error between 0.02 and 0.1 ∘C, depending on box location. The model in Fig. 5 is well suited to describe the time-dynamic behaviour of the box temperature by only two variable parameters.
Our DT platform enables flexible linking of models, but it also entails a certain streaming latency for event processing. In a first step, we evaluated the typical streaming latency, i.e., the additional costs due to our platform. The response time (RT) until the sensor/actuator device receives a control command after sending new measurements to the DT platform included the streaming latency, processing of the model algorithms, and further overhead such as wireless communication with the sensor, for example. The RT must be below a boundary, depending on the application.
In a second step, we compared the latency with other contribution factors to the RT for our cool-chain example application.
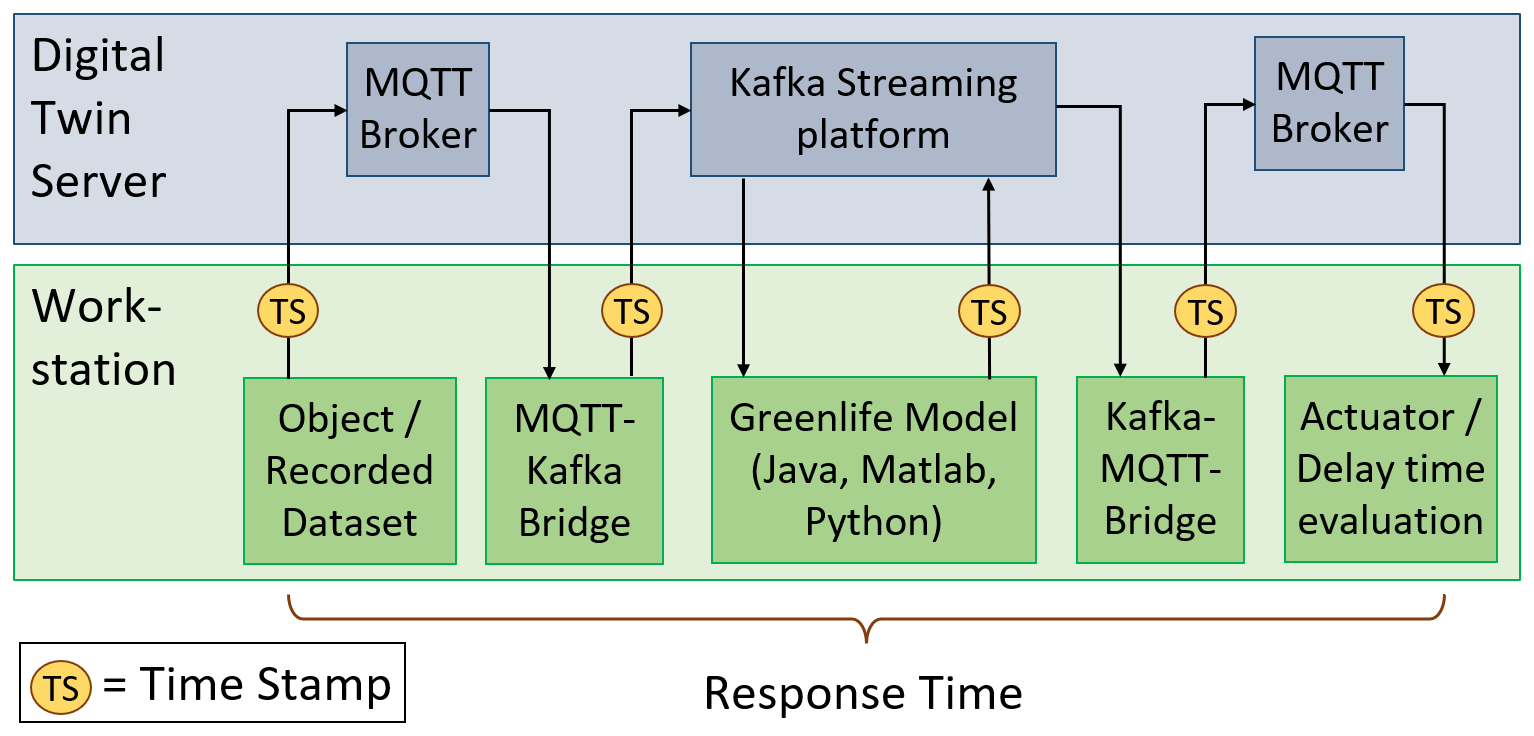
The same method as in Singh and Jedermann (2022) was applied for evaluation of platform performance. Unnecessary computation load by screen outputs was reduced and measurements repeated. Each processor or bridge module added a time stamp before publishing the event (Fig. 10). The RT was calculated by time stamp difference. In order to avoid clock deviations between different workstations, all modules were running on the same workstation, i.e., either a local PC or directly on the DT platform. The Green-Life model was programmed in three programming languages and used as an example. Testing was based on recorded data sets from earlier live experiments during ocean transport. The data were played back with accelerated speed of 10 measurements per second. Our test actuator logged the collected time stamps to a file instead of applying corrective actions on the physical object. The full signal chain consists of publish–subscribe event communication through the platform, including sensor transmission, bridges from MQTT to Kafka (and vice versa), and one example model (Fig. 10). The DT platform was implemented on a virtual server with four cores and 8.0 GB of memory, running on an AMD EPYC Rome machine with 3.0 GHz CPU clock. A standard i7 desktop PC was used as additional workstation.
11.1 Latency of streaming platform
The two bridges and the model, written in Java, were directly executed on the DT server for the first test, without wireless and external network communication. The RT showed occasional outliers up to 100 ms caused by screen output every 20 intervals. Further outliers were caused by the fact that neither Windows nor Linux are real-time operating systems with guaranteed reaction time. For a comparison of streaming-platform performance apart from limitation of the operating system and screen test messages, such outliers were excluded. The average RT was estimated to 3.5 ms total or ∼1 ms for each of the four processing units, including the model algorithm. Running 20 DT instances in parallel on the server costs an additional 60 ms or 3 ms per instance.
The latency of the model algorithms was measured with the System.nanoTime() method in Java to 9, 42, and 66 µs for the Green-Life, Cool-Ident, and Ripening models, respectively. Unfortunately, the System.nanoTime() method is not thread safe. It can only be applied for models running in a single thread but not to measure streaming latency, with sender and receiver running in different threads. The latter one can only be measured with the less accurate System.currentTimeMillis() method. Subtracting the latency of the Green-Life model from the RT makes hardly any difference. The streaming latency of our platform is therefore typically 3.5 ms for a scenario with a single model. If multiple models are linked in the platform, 1 ms must be added per model or processing instance.
The following two factors can largely increase the RT and should be further optimized. First, the creation of new topics on the platform required up to 1 s. This can be solved if the topics are configured in advance, i.e., before transport start in our example. Secondly, the use of MATLAB as programming language for real-time models remains problematic. Methods to call MATLAB functions from other languages are lacking. The execution of multiple models in parallel requires external programming since multi-threading is very restricted in MATLAB. So far, only the minimal Kafka installation was used. Kafka can be scaled to higher data throughput by using multiple brokers on parallel servers. Each broker can be divided into partitions to handle messages from multiple DT instances more efficiently.
11.2 Evaluation of our cool chain use case
The acceptable boundary for the RT and the contribution of network overhead depends very much on the type of application. The communication between sensors, actuators, and DT platform can be restricted to a single shop floor with fast Ethernet connections, or it can entail wireless communication through a worldwide-distributed multi-party network. The influence of an additional fast local network on the RT was marginal. Running all processing units on a separate PC workstation, connected to the streaming platform through the campus Ethernet resulted in almost the same RT.
The case that the physical system is connected via an embedded system to the DT platform was also evaluated: execution of the sensor sender and action processor on a Raspberry Pi embedded computer resulted in an increase in RT by 2 ms. Wireless communication was found to have the highest influence on the RT. As an example, all Ethernet communication between PC workstation and DT platform was replaced by Wi-Fi, leading to a total increase in the RT by 200 ms or 50 ms per communication link.
Considering the case that all data processing is programmed without linking models through events, i.e., in a single software entity, only a few milliseconds can be saved. In general, the performance of our platform is more than sufficient to execute multiple DT instances in parallel, even at an accelerated speed of 10 samples per second, whereas in our practical example for monitoring the cool chain of bananas, data came in intervals of minutes or even hours.
We had already provided a full functioning prototype for remote quality monitoring in 2013. Two major drivers made us rethink the concept and software structure.
- a.
Technology drivers. Our initial concept was based on local data processing. The Intelligent Container was able to decide itself about possible quality risks. Communication was reduced to warning messages on detected risks and occasional status messages. Due to the dramatic decrease in cellular communication costs, there is no longer a reason to withhold the data locally. Instead, cloud computing has become the new paradigm. Modern streaming platforms can process the full model chain for more than 100 digital twin instances per second in parallel. There is no longer a need to combine multiple models in a single software unit due to performance requirements.
- b.
Conceptual drivers. DTs have become a new focus in research on transport and production logistics. This actually gave us the motivation to reconsider the concept of our Intelligent Container. In summary, we identified and applied the following new features, challenges, and concepts of DTs in our project:
- 1.
Real-time data processing. DTs are not merely displaying real-time sensor data, but they also process the data to provide additional information. Although this feature is stressed in most articles about DTs, there are few guidelines about how it can be applied to a concrete model, e.g., to estimate non-measurable properties from the sensor data. The conversion from offline simulation models to an updateable model for real-time data is still one of the big challenges in DTs. The theory of state observers is now more than 50 years old, nevertheless, each individual model requires rewriting its mathematical description.
- 2.
Model linking. DTs provide flexible platforms to link multiple models and other processing instances. There are several solutions available besides our Kafka-based platform, both open-source and commercial (Jedermann et al., 2022a). The platform requires only minor changes to host new model types. Most work is required to write and adapt a wrapper function for the models to communicate with the DT platform. The actual linking can be done by assigning certain input and output topics to the models.
- 1.
Our models had been tested individually with real-time sensor data, but our initial prototype was lacking a solution to forward data among multiple models. With the DT streaming platform, we can take advantage of several model chains. The estimated kM parameter for cooling performance from the first model provides the necessary input for subsequent models, e.g. (a) prediction of future temperature development, followed by a third model to estimate the green life at arrival; (b) estimation of the current heat, produced by the ripening process; or (c) predicting the effect of set-point changes on the future temperature development in what-if scenarios.
Our approach is focused on applications, in which all properties of interest can be described by a dynamic system model. Dynamic models calculate changes in the system states over time as a function of some input variables (e.g. the supply air temperature). They are mostly given as a set of ordinary differential equations (ODEs). The system description can comprise a combination of separate mathematical algorithms. The set of algorithms can include parameter identification techniques to estimate unknown system parameters.
Basic requirement for the application of our approach is that the given set of algorithms can be converted to an updateable format. The simplest example is an integral relation between a measurable input variable (e.g. box temperature) and a quality indicator (e.g. green life). In general, it is possible to convert a more complex linear or non-linear ODE description to a state observer. Most parameter identification techniques can also be converted to an incremental form. Computational fluid dynamics (CFD) models are less suitable, because they have only very limited capabilities to correct predictions by real-time sensor data. The training of artificial intelligence and machine learning models is performed based on offline training data, which is also not covered by our approach.
If these requirements on the models are met, the steps described in Sects. 3 to 7 can be applied to convert a remote monitoring system into a digital twin for information analysis and decision support. In a first step, the properties, which should be predicted, must be defined. They might include some hidden properties or states that must be estimated based on the sensor data (Sect. 3). The most time-consuming step is the conversion of the models to an updateable format, e.g., by state observes (Sect. 4). The updateable model must be equipped with interfaces to event processing (Sect. 5). Streaming platforms are mostly available (Sect. 6). The system might be enhanced by additional project-specific sensors (Sect. 7).
In summary, the concept of DTs turned out to be motivating and useful for the inclusion of live sensor data in process models. With the example of our intelligent container, we showed that it is feasible and beneficial to make full use of DT features to enhance a remote sensor monitoring solution. The described steps can be applied to other applications for extending IoT solutions with advanced DT features.
The code was programmed for demonstration purposes of digital twin features and capabilities. The software system, containing various files in different programming languages, will be further developed, converted to a more generic solution, documented, and published later.
The test data were recorded during commercial transport operations. According to the agreement with the project partner DOLE, publication of the detailed data sets is prohibited.
RJ designed the concept and converted the models. KS programmed the streaming platform and interfaces for different programming languages. WL supervised the work. PM provided biological models and research on project-specific sensors. RJ prepared the manuscript with contributions from all co-authors.
The contact author has declared that none of the authors has any competing interests.
Publisher's note: Copernicus Publications remains neutral with regard to jurisdictional claims in published maps and institutional affiliations.
This article is part of the special issue “Sensors and Measurement Systems 2022”. It is a result of the “Sensoren und Messsysteme 2022, 21. ITG/GMA-Fachtagung”, Nuremberg, Germany, 10–11 May 2022.
We thank Ingersoll Rand Climate Control Technologies for provision of cooling equipment and Dole Fresh Fruit Europe for provision of test facilities. Further information about the project can be found at http://www.intelligentcontainer.com (last access: 4 April 2023).
This research has been supported by the Bundesministerium für Bildung und Forschung (grant no. 01IA10001).
This paper was edited by Ulrich Schmid and Qingquan Sun and reviewed by two anonymous referees.
Brown, R. G. and Hwang, P. Y. C.: Introduction to random signals and applied Kalman filtering: with MATLAB exercises, 4th edn., Wiley, Hoboken, NJ, ISBN 978-0-470-60969-9, 2012.
Cronrath, C., Ekström, L., and Lennartson, B.: Formal Properties of the Digital Twin – Implications for Learning, optimization, and Control, 2020 IEEE 16th International Conference on Automation Science and Engineering (CASE), Hong Kong, China, 20–21 August 2020, IEEE, https://doi.org/10.1109/CASE48305.2020.9216822, 2020.
Defraeye, T., Tagliavini, G., Wu, W., Prawiranto, K., Schudel, S., Assefa Kerisima, M., Verboven, P., and Bühlmann, A.: Digital twins probe into food cooling and biochemical quality changes for reducing losses in refrigerated supply chains, Resour. Conserv. Recy., 149, 778–794, https://doi.org/10.1016/j.resconrec.2019.06.002, 2019.
Defraeye, T., Shrivastava, C., Berry, T., Verboven, P., Onwude, D., Schudel, S., Bühlmann, A., Cronje, P., and Rossi, R. M.: Digital twins are coming: Will we need them in supply chains of fresh horticultural produce?, Trends Food Sci. Tech., 109, 245–258, https://doi.org/10.1016/j.tifs.2021.01.025, 2021.
Geyer, M., Praeger, U., Truppel, I., Scaar, H., Neuwald, D. A., Jedermann, R., and Gottschalk, K.: Measuring Device for Air Speed in Macroporous Media and Its Application Inside Apple Storage Bins, Sensors, 18, 576, https://doi.org/10.3390/s18020576, 2018.
Gwanpua, S. G., Verboven, P., Leducq, D., Brown, T., Verlinden, B. E., Bekele, E., Aregawi, W., Evans, J., Foster, A., Duret, S., Hoang, H. M., van der Sluis, S., Wissink, E., Hendriksen, L. J. A. M., Taoukis, P., Gogou, E., Stahl, V., El Jabri, M., Le Page, J. F., Claussen, I., Indergård, E., Nicolai, B. M., Alvarez, G., and Geeraerd, A. H.: The FRISBEE tool, a software for optimising the trade-off between food quality, energy use, and global warming impact of cold chains, J. Food Eng., 148, 2–12, https://doi.org/10.1016/j.jfoodeng.2014.06.021, 2015.
Jedermann, R. and Lang, W.: Model based estimation of biological heat generation during cold-chain transport and processing, 3rd IIR International Conference on Sustainability and the Cold Chain, St Mary's University, Twickenham, London, UK, ISBN 9782362150036, 2014.
Jedermann, R. and Lang, W.: 15 Years of Intelligent Container Research, in: Dynamics in Logistics: Twenty-Five Years of Interdisciplinary Logistics Research in Bremen, Germany, edited by: Freitag, M., Kotzab, H., and Megow, N., Springer International Publishing, Cham, 227–247, https://doi.org/10.1007/978-3-030-88662-2_11, 2021.
Jedermann, R., Geyer, M., Praeger, U., and Lang, W.: Sea transport of bananas in containers – Parameter identification for a temperature model, J. Food Eng., 115, 330–338, https://doi.org/10.1016/j.jfoodeng.2012.10.039, 2013.
Jedermann, R., Praeger, U., and Lang, W.: Challenges and opportunities in remote monitoring of perishable products, Food Packaging and Shelf Life, 14, 18–25, https://doi.org/10.1016/j.fpsl.2017.08.006, 2017.
Jedermann, R., Lang, W., Geyer, M., and Mahajan, P.: Digital Twin features for the Intelligent Container, The International Conference on Dynamics in Logistics (LDIC), Bremen, Germany, https://doi.org/10.1007/978-3-031-05359-7_18, 2022a.
Jedermann, R., Singh, K., Lang, W., and Mahajan, P. V.: Digital twins for flexible linking of live sensor data with real-time models, in: 21. ITG/GMA-Fachtagung, Nürnberg, Germany, 10–11 May 202, VDE, 316–322, ISBN 978-3-8007-5835-7, 2022b.
Kalman, R. E.: Mathematical Description of Linear Dynamical Systems, J. Soc. Ind. Appl. Math., 1, 152–192, https://doi.org/10.1137/0301010, 1963.
Kamath, V., Morgan, J., and Ali, M. I.: Industrial IoT and Digital Twins for a Smart Factory: An open source toolkit for application design and benchmarking, in: 2020 Global Internet of Things Summit (GIoTS), Dublin, Ireland, 3 June 2020, IEEE, https://doi.org/10.1109/GIOTS49054.2020.9119497, 3 June 2020.
Keshri, N., Truppel, I., Herppich, W. B., Geyer, M., Weltzien, C., and Mahajan, P. V.: Development of sensor system for real-time measurement of respiration rate of fresh produce, Comput. Electron. Agr., 157, 322–328, https://doi.org/10.1016/j.compag.2019.01.006, 2019.
Linke, M., Praeger, U., Mahajan, P. V., and Geyer, M.: Water vapour condensation on the surface of bulky fruit: Some basics and a simple measurement method, J. Food Eng., 307, 110661, https://doi.org/10.1016/j.jfoodeng.2021.110661, 2021.
López, C. E. B.: Real-time event-based platform for the development of digital twin applications, Int. J. Adv. Manuf. Tech., 116, 835–845, https://doi.org/10.1007/s00170-021-07490-9, 2021.
Singh, K. and Jedermann, R.: Performance of a Digital Twin platform for tracing quality changes in fruits, in: 21 ITG/GMA-Fachtagung Sensoren und Messsysteme Nürnberg, ISBN 978-3-8007-5835-7, 2022.
Sklorz, A., Janssen, S., and Lang, W.: Application of a miniaturised packed gas chromatography column and a SnO2 gas detector for analysis of low molecular weight hydrocarbons with focus on ethylene detection, Sensor. Actuat. B-Chem., 180, 43–49, https://doi.org/10.1016/j.snb.2011.12.110, 2012.
Tijskens, L. M. M.: Discovering the Future: Modelling Quality Matters, PhD thesis, Food Quality/Agrotechnology and Food Sciences Group and Horticultural Production Chains Group, University of Wageningen, ISBN 90-8504-017-5, 2004.
Uhlenkamp, J. F., Hribernik, K., Wellsandt, S., and Thoben, K. D.: Digital Twin Applications: A first systemization of their dimensions, in: 2019 IEEE International Conference on Engineering, Technology and Innovation (ICE/ITMC), Valbonne Sophia-Antipolis, France, 17–19 June 2019, IEEE, 1–8, https://doi.org/10.1109/ICE.2019.8792579, 2019.
Wright, L. and Davidson, S.: How to tell the difference between a model and a digital twin, Advanced Modeling and Simulation in Engineering Sciences, 7, 13, https://doi.org/10.1186/s40323-020-00147-4, 2020.
Zarkani, S. and Rasmussen, C. H.: Remote reefer monitoring looking back and looking forward, in: Cool Logistics Global, oral presentation, 8th global conference, Bremen, Germany, 27–28 September 2016.
- Abstract
- Scope and motivation
- Definitions and related projects
- Hidden states and integral models
- Systems theory and state observers
- Event-driven architecture
- Streaming platform
- Example for project-specific sensors
- Models for the banana life cycle
- Model management
- Digital twin prediction results
- Platform performance
- Summary and conclusions
- Code availability
- Data availability
- Author contributions
- Competing interests
- Disclaimer
- Special issue statement
- Acknowledgements
- Financial support
- Review statement
- References