the Creative Commons Attribution 4.0 License.
the Creative Commons Attribution 4.0 License.
 | 30 May 2023
Inverse procedure for measuring piezoelectric material parameters using a single multi-electrode sample
Nadine Feldmann
Veronika Schulze
Lars Meihost
Henrik Kuhlmann
Benjamin Jurgelucks
Andrea Walther
Bernd Henning
An inverse measurement procedure for the determination of a full set of piezoelectric material parameters using a single sample is presented. The basis for the measurement procedure is a measurement of the frequency-dependent impedance of the sample. To yield sufficient sensitivity of this measurement with respect to all material parameters (mechanical, electrical, and coupling parameters), an optimal electrode configuration for the sample is determined before the inverse measurement procedure is realised using a novel topology optimisation approach. After initial estimates for the material parameters are provided by analytical expressions, a sensitivity-based, staged, local optimisation procedure yields material parameters for the sample by fitting the impedance of a finite element simulation model to the measured electrical impedance. Results for different absorption models as well as for different piezoelectric materials (hard, soft, and lead-free piezoceramics) are included.
- Article
(4320 KB) - Full-text XML
- BibTeX
- EndNote


To avoid wasting resources in the construction of prototypes, design processes, for example, for ultrasonic transducers, become increasingly driven by simulations. These numerical studies are especially challenging when the component of concern incorporates the interaction of different physical phenomena. An example where electrical and mechanical fields interact is in the design of ultrasonic transducers driven by piezoceramic components. One prerequisite for realistic simulation results is the availability of a complete and consistent set of material parameters, which include mechanical, electrical, and coupling parameters for piezoelectric components.
Polarised piezoceramic materials show transverse isotropy, where the polarisation axis shows different material behaviour than the plane perpendicular to that axis. The undamped, elastic material behaviour can thus be described by 10 independent parameters, relating mechanical stress and strain (Ti and Si) to electrical field strength and dielectric displacement (Ei and Di). Using Voigt notation, the following constitutive equations arise (Heywang et al., 2008):
and
where , , and eij denote the components of the stiffness, permittivity, and piezoelectric coupling matrices, respectively. The vector of parameters to be determined is thus
If absorption is to be considered, the parameter vector pi is extended by the parameters of the respective absorption model. For a complete description of piezoelectric material, the density ρ of the material is also required; however, because it can be measured directly by gravimetric means it is not considered in the inverse procedure.
A standardised method for the determination of a full set of material parameters is given in the IEEE Standard on Piezoelectricity (IEEE, 1987). However the procedure proposed in this standard requires a number of differently processed and polarised samples and thus leads to inconsistent parameter sets. The sample geometries used in the standard, however, allow the material parameters to be inferred from resonance frequencies using analytical expressions. These analytical relations are a prerequisite for direct measurement approaches for piezoelectric material parameters and typically require resonance modes in different spatial direction to be sufficiently decoupled, for example, by assuming thin plates. Piao and Kim (2017) and Meitzler et al. (1973) derive analytical expressions for the radial modes of piezoelectric discs, for example. However, the analytical description of coupled or hybrid resonance modes, as they occur in piezoceramics used in typical sensor applications, proves challenging (Iula et al., 1998; Lin, 1998), and the resulting expression can not be easily inverted to infer material parameters, for example, from resonance frequencies. Nevertheless, it can be shown that the coupling of modes leads to higher sensitivity of the impedance with respect to the material parameters (Kybartas and Lukosevicius, 2002). A more feasible approach to determine piezoelectric material parameters from impedance measurements, especially if the number of samples is to be reduced, is the application of inverse measurement methods. Here, numerical models, for example, based on the finite element method, can be used to determine the impedance of virtual samples Zsim(pi) and compared to a measured impedance Zmeas. Minimising the deviation defined by applying an objective function J and varying the material parameters pi to solve the optimisation problem
yields estimates for the sample's material parameters for the given model. Rupitsch and Ilg (2015) implement an inverse method using only two samples and staged optimisation for a complete characterisation including absorption. Similarly, Unverzagt develops a characterisation procedure using only a single disc-shaped specimen (Unverzagt, 2018) with a three-electrode structure optimised for increased sensitivity (Kulshreshtha et al., 2015), which is contacted using a network of passive electrical components. This method is improved upon by Jurgelucks (2019) with a revised electrode structure. Dropping the passive electrical network, Feldmann et al. (2020) implement an inverse procedure based on three separate impedance measurements on a three-electrode specimen and staged, local optimisation. Using this as a starting point, this contribution includes the optimisation of a multi-electrode topology with the aim to enable a full piezoelectric parameter identification using only a single impedance measurement on a single specimen and no additional electrical components.
The electrode topology is optimised in a two-step procedure: the initial topology is determined using an iterative approach based on the sequential element admission and rejection (SERA) method (Querin, 2017). The resulting topology is parameterised and further optimised using gradient-based optimisation, similar to the method developed by Jurgelucks (2019).
To reduce the complexity of the overall problem, several restrictions are imposed. The geometry of the sample as well as of the electrodes is assumed to be axisymmetric to allow for efficient simulations as the problem can be reduced to two spatial dimensions. For the impedance measurement the sample has to have only two terminals: a ground and a load terminal. For the targeted topology this means that the resulting electrodes must be either connected to the load or the ground terminal. To facilitate the impedance measurement and interfacing process of the sample, it is presupposed that load electrodes only occur on the upper face of the sample, and ground electrodes occur on the lower face.
The simulation model required optimisation of the electrode structure, and for the material parameter identification process, a finite element model is realised in openCFS (Schoder and Roppert, 2022), an open-source solver specialised for coupled field simulations. Topology optimisation procedures require a spatially dependent quantity called the criterion value as a result of the optimisation. For mechanical problems – the classical application for topology optimisation – the criterion value can, for example, be the magnitude of the stress (Querin, 2017). The impedance for the piezoelectric problem is an abstract property that does not depend on a spatial coordinate. In the simulation, however, this impedance is determined in the frequency domain from the applied voltage Usim and the induced charge Qsim:
where j is the imaginary unit, and ω is the angular frequency. The charge Qsim is determined by the integral of a charge density, in this specific, two-dimensional case the surface integral of the surface charge density σ over the electrode area A:
The surface charge density is thus a spatially dependent quantity that has direct influence on the electrical impedance. One can infer that a high sensitivity of the surface charge density with respect to a certain material parameter implies a high sensitivity of the impedance, so the surface charge density can be used as a criterion value for the topology optimisation process. As an example, Fig. 1 shows the sensitivity of the charge density with respect to c13 of a soft piezoceramic disc with a radius of 5 mm and a thickness of 1 mm. High values are observed around the thickness resonant mode at 2 MHz and close to the axis of the piezoceramic disc at r=0 mm.
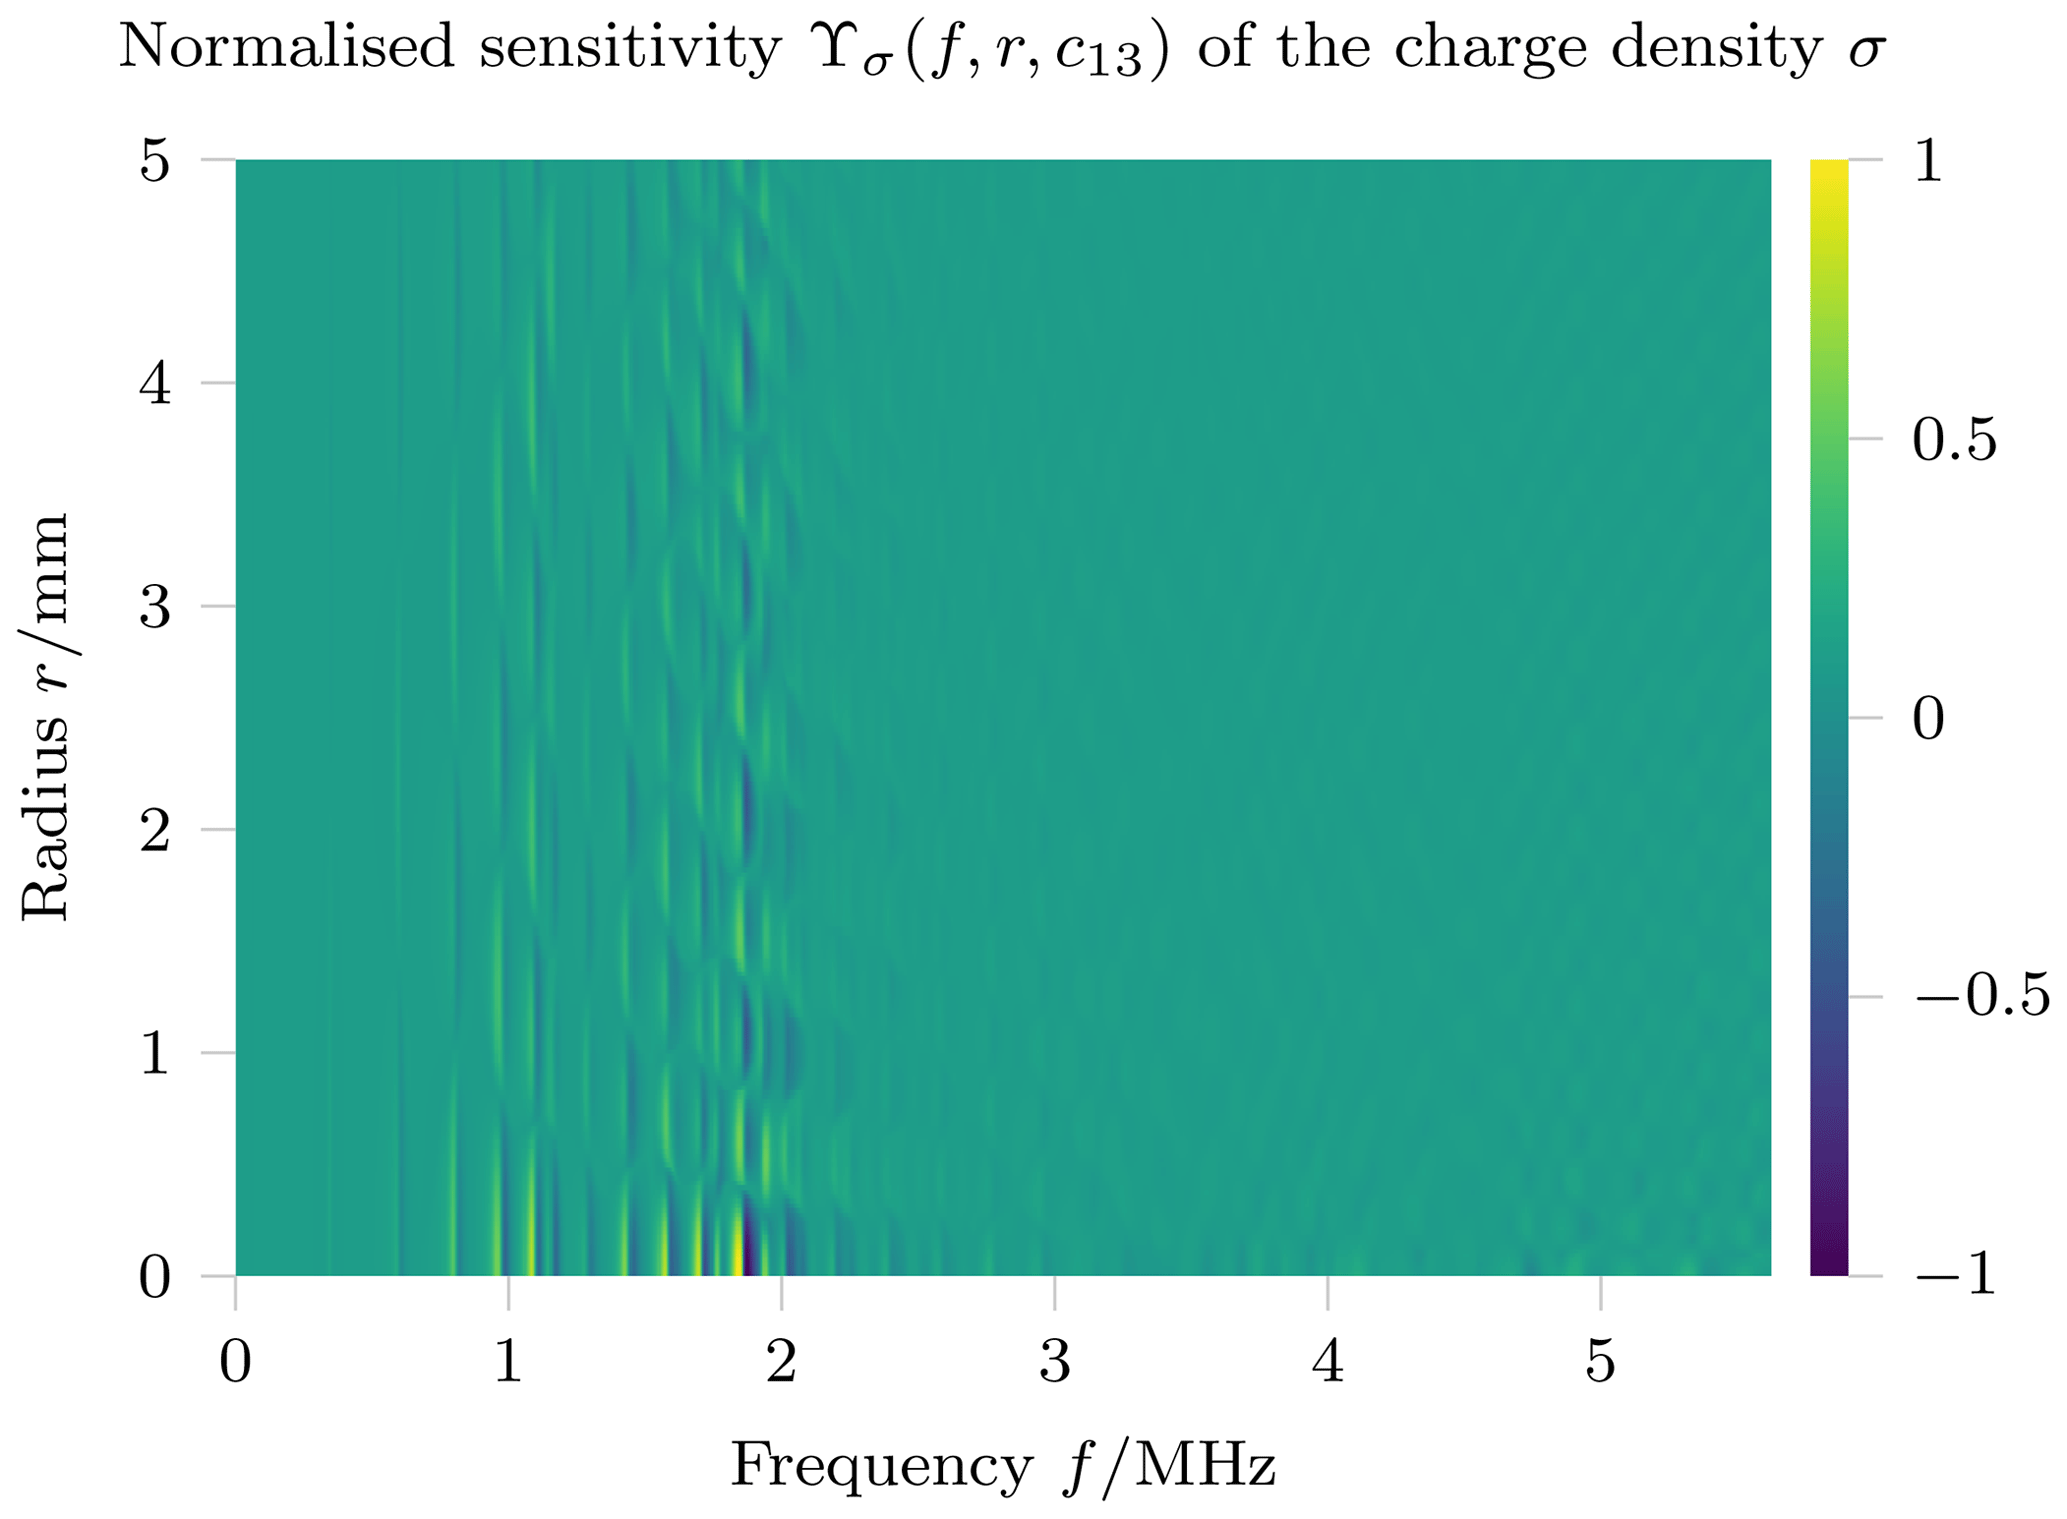
Figure 1Radius- and frequency-dependent sensitivity of the charge density of a piezoceramic disc with respect to the material parameter c13.
This sensitivity of the surface charge density Υσ does not only depend on spatial coordinates (the radius r for the axisymmetric case) for each electrode, but also on the frequency f and is different for each material parameter pi:
The SERA method, however, requires a criterion value that only depends on the spatial quantity r. Therefore an approach has to be found that resolves the dependence on frequency and the material parameters. In previous work (Claes et al., 2021) the authors show that applying the determinant criterion (Fedorov, 1972) with respect to frequency yields promising results. This criterion is given as follows:
where is the inner product with respect to the frequency f, and is the determinant. The determinant constitutes the squared n-dimensional volume of the parallelotope formed by the frequency-dependent sensitivities. Here n is the number of material parameters. Because this volume is maximal when the frequency-dependent sensitivities are orthogonal, optimisation using this criterion promotes linear independence, thus promoting the placement of electrodes where the sensitivity with respect to the different material parameters differs along the frequency axis. Due to the high-dimensional nature of this criterion, the values of C(r) cover multiple magnitudes. For further processing and application in the SERA method, C(r) is thus normalised, and a logarithm is applied with an added unity to avoid negative values:
The resulting raw criterion values for the piezoceramic disc with electrodes covering both faces are shown in Fig. 2, with high values at the centre (r=0 mm) as well as at the outer rim of the disc (r=5 mm). There is some oscillatory behaviour observed in radial direction, which is also visible in the sensitivity of individual parameters (Fig. 1). A probable cause for these oscillations is radial modes which superimpose on the thickness resonance mode. Because arbitrarily small electrodes can not be manufactured, spatial smoothing of the criterion values is required similarly to applications of topology optimisation methods in mechanics. In this case a Gaussian filter with a physical length of 3 mm is applied, yielding the smoothed criterion value (Fig. 2).
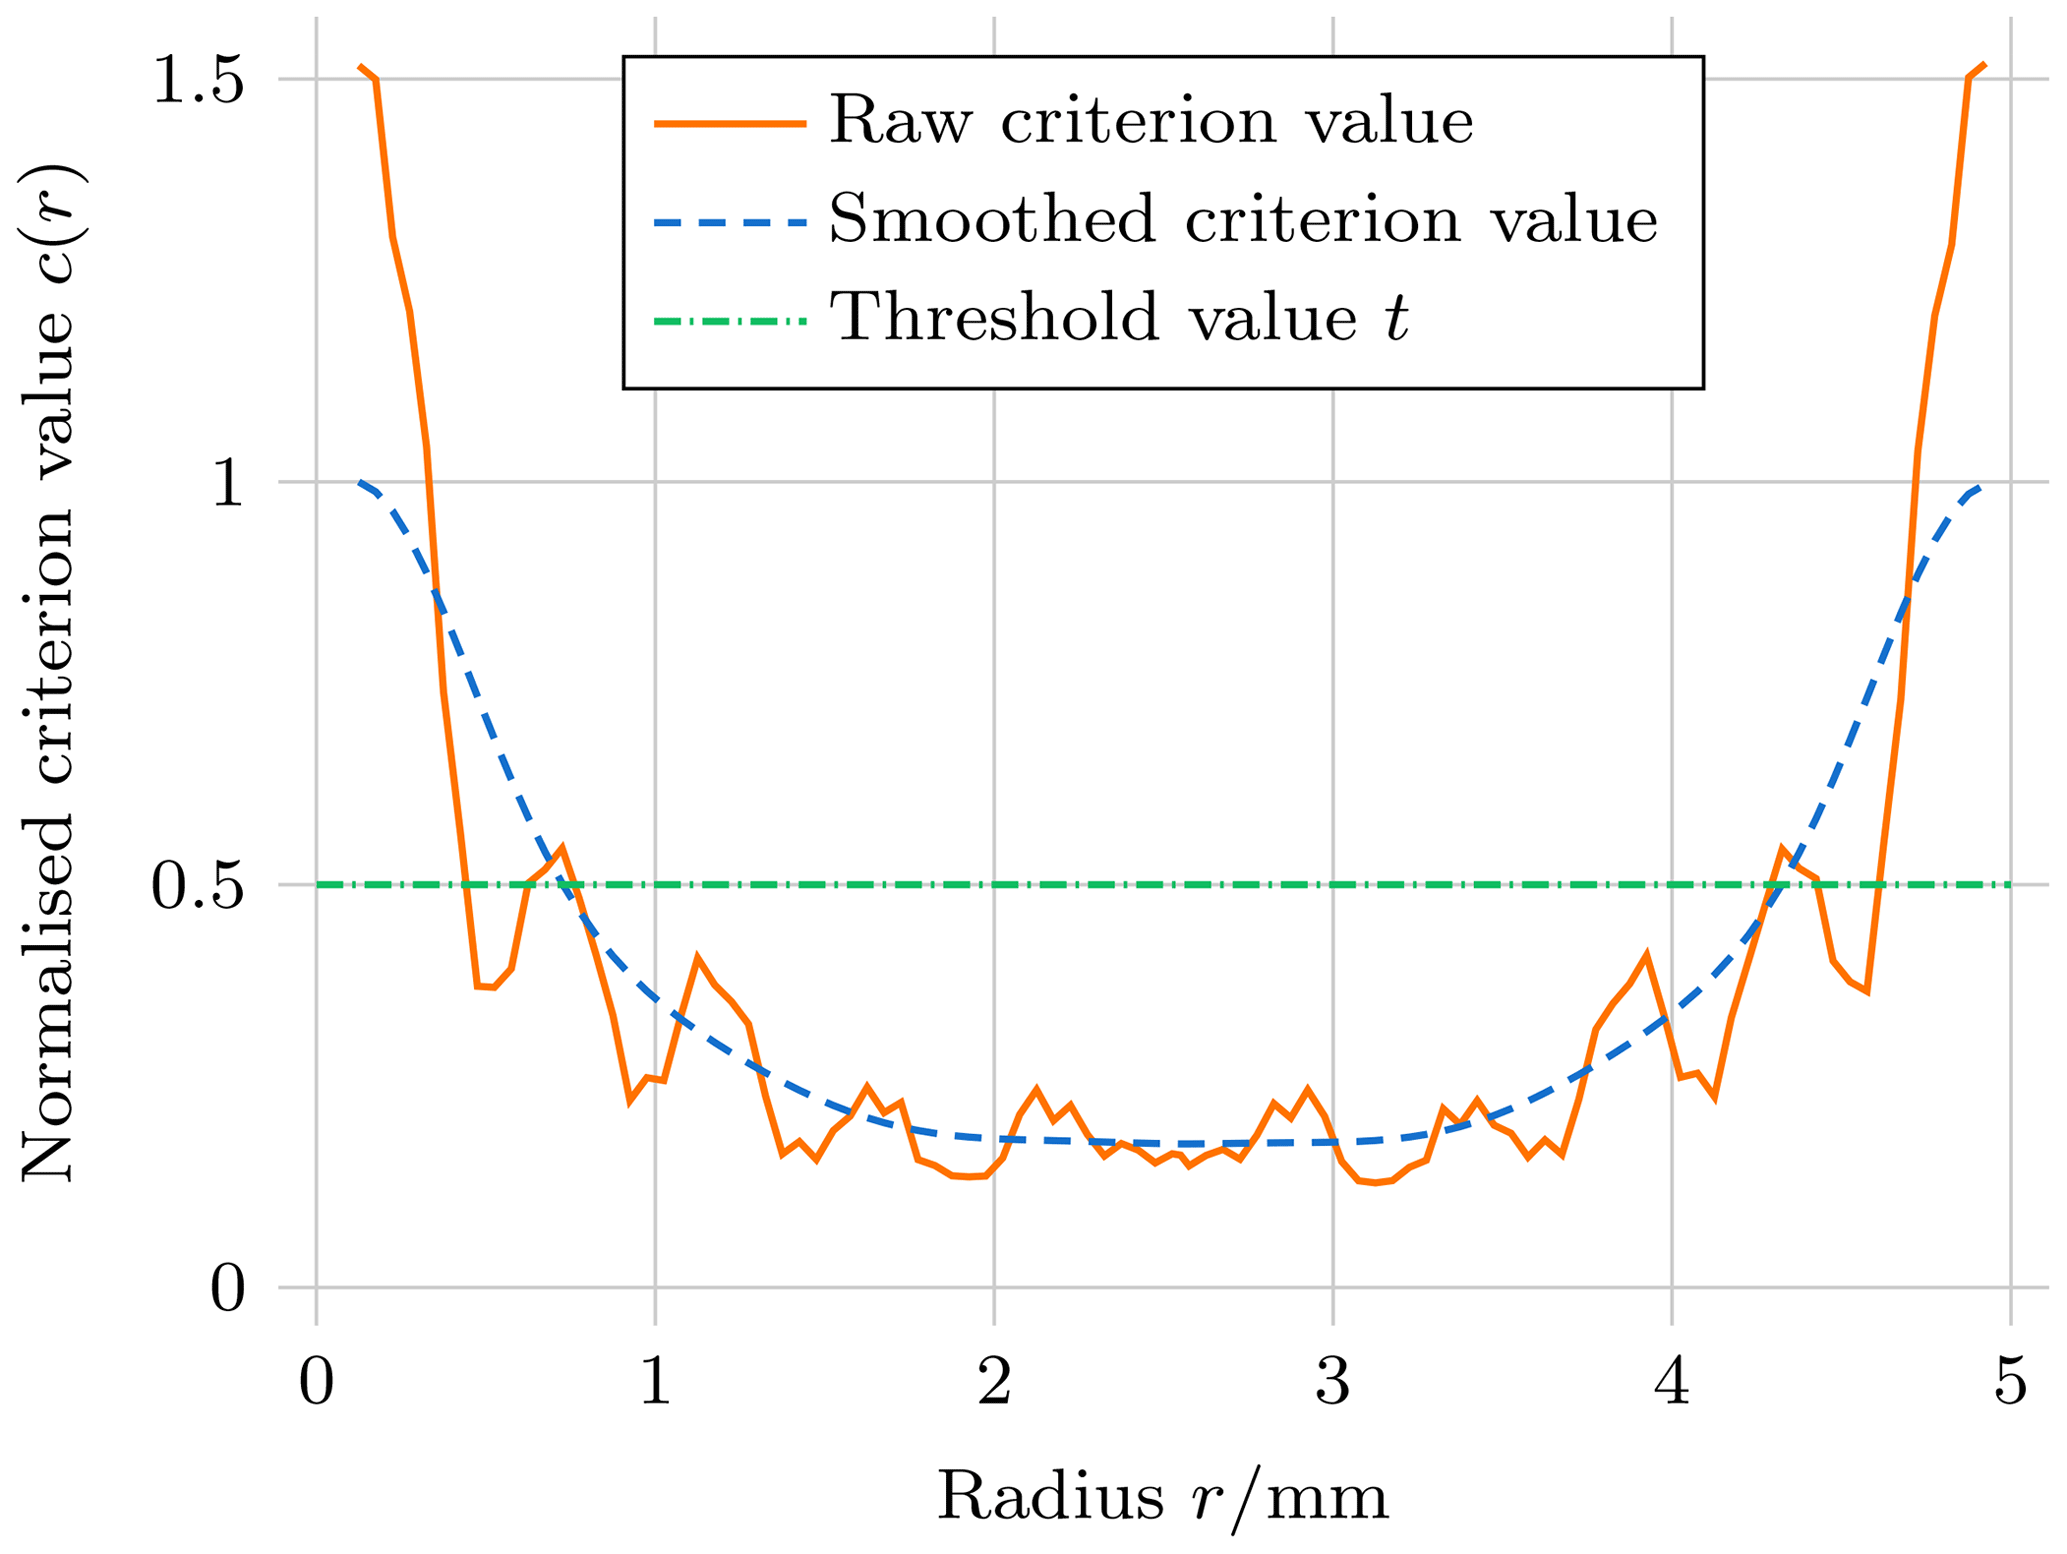
Figure 2Results for the raw and smoothed criterion value for a piezoelectric disc with electrodes covering both faces (initial step of the SERA procedure).
Starting with electrodes covering both faces of the disc-shaped piezoceramic, the sequential element admission and rejection (SERA) method (Querin, 2017) is adapted using the following procedure: after the result for the criterion value of the initial simulation is present, the placement of electrodes for the next step is determined by applying the threshold to the criterion. Wherever the criterion exceeds the threshold, electrodes are placed for the next step. The resulting electrode geometry is then used in the next simulation step, and the threshold is applied again. The procedure is repeated until the electrode topology converges, which in the present example takes around 10 iterations.
The resulting four-electrode geometry is shown in Fig. 3b along with the cumulative absolute sensitivity of the electrical impedance ΥZ for each material parameter. The geometry comprises a circular electrode as well as a ring at the outer edge of each face of the sample, a result that can already be inferred from the result for the initial step (Fig. 2). Compared to the sensitivities of a piezoceramic disc with full electrodes in Fig. 3a, the sensitivities with respect to all material parameters are increased. Further, the spread of the sensitivities is reduced, which is advantageous for the subsequent material parameter identification process.
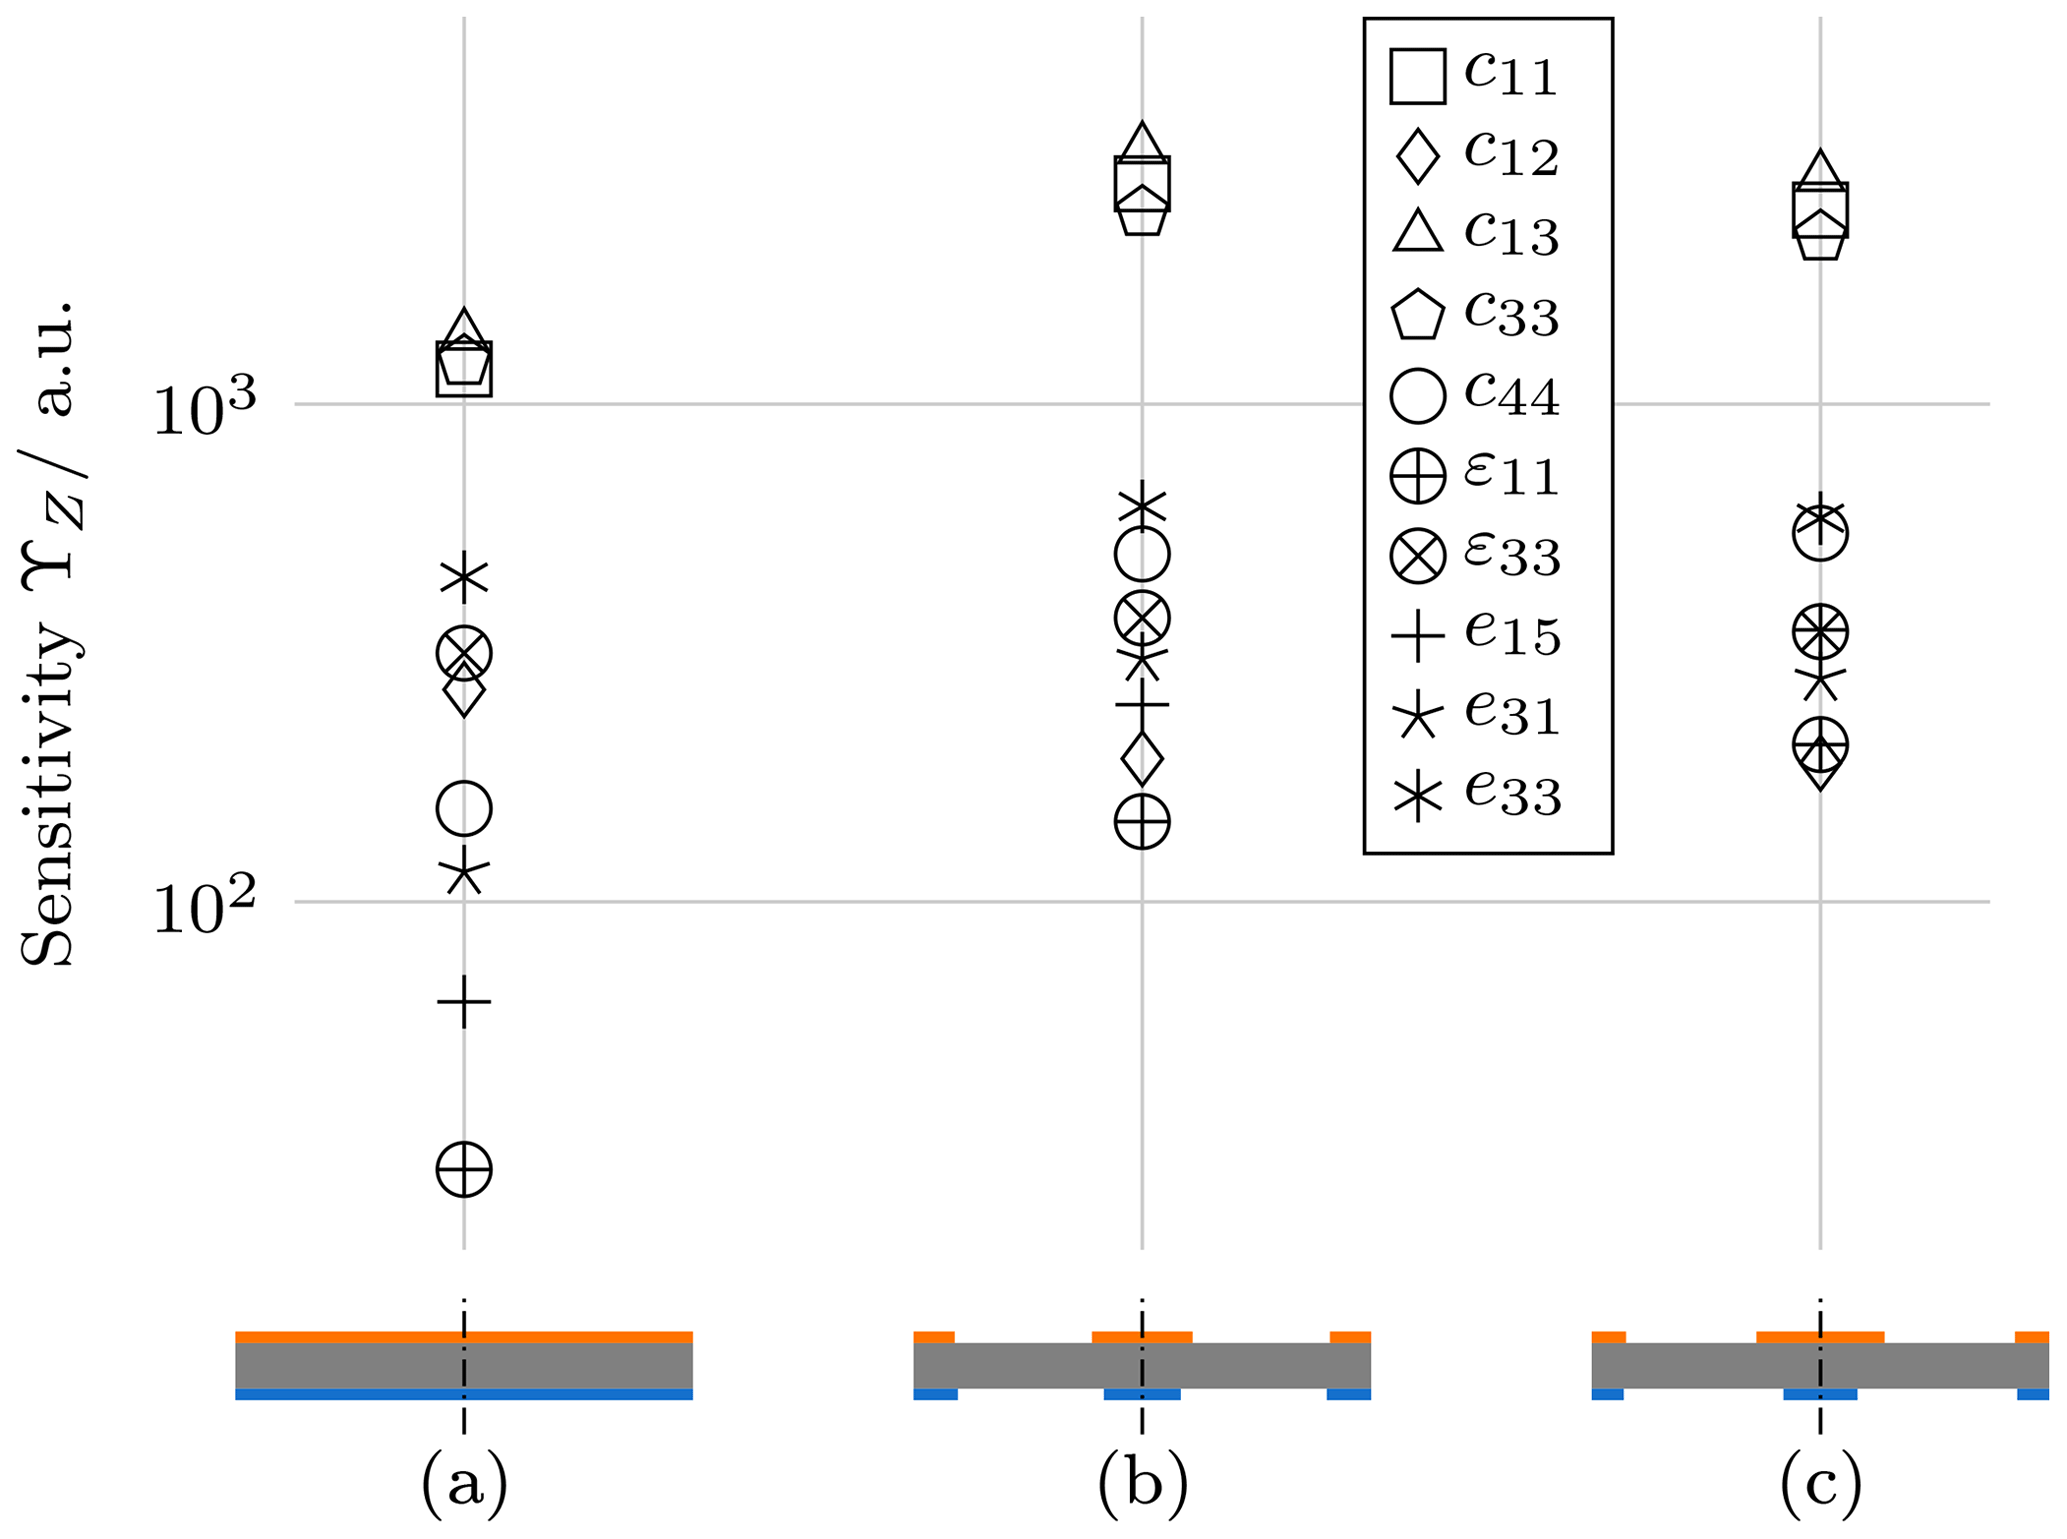
Figure 3Electrode configuration and sensitivities of the electrical impedance with respect to the material parameters for different topologies: electrodes covering the faces of a piezoceramic disc (a, initial configuration), result of the SERA method (b), and result of additional shape optimisation applied to the SERA configuration (c). Blue electrodes are on ground, and orange electrodes are on load potential.
To further increase the properties of the electrode configuration, gradient-based shape optimisation is applied requiring a parameterisation of the geometry. The parameters of the present configuration are the outer radii of the circle-shaped electrodes in the centre of each face as well as the inner radii of the ring-shaped electrodes on the rim of each face. As an objective function for this local, four-parameter optimisation process, the determinant criterion (cf. Eq. 8) is again used, however now based on the sensitivity of the impedance with respect to each material parameter
For gradient-based optimisation, the derivative of the objective function is required. Because the objective function already contains a derivative, approximating both derivatives by finite differences is not advisable because it can lead to discontinuities in the objective function's gradient (Jurgelucks et al., 2018). The sensitivities are thus calculated by algorithmic differentiation using an adapted version of the finite element solver by Jurgelucks (Jurgelucks, 2019). Applying a constrained trust region method (Conn et al., 2000) to this problem using the result of the SERA method as initial values yields the configuration shown in Fig. 3c. The circle-shaped electrodes have radii of 1.4 and 0.8 mm on the upper and lower face, respectively. The inner radii for both ring-shaped electrodes are 4.3 mm. This more asymmetrical configuration shows a similar mean sensitivity; however the spread of the sensitivities is further reduced. It is thus used for the material parameter identification procedure presented in the following section.
The inverse procedure for piezoelectric material parameter identification is based on the approach developed by Feldmann et al. (2020) and Feldmann (2021) for three-electrode specimens. It relies on matching the electrical impedance of a model of the sample (the forward model) to the measured electrical impedance by varying the material parameters of the model using an optimisation algorithm. Because local optimisation is to be used, initial estimates are required which are the starting point for a gradient descent procedure.
3.1 Forward model
The forward model is again realised with an axisymmetric geometry in openCFS (Schoder and Roppert, 2022); however, because the quality of the results depends on how accurate the model can reproduce the physical behaviour of the sample, special care is taken in the setup of the simulation. For the initial steps of the optimisation procedure, an element size of 200 µm and Legendre polynomials of order 3 are used to allow for a fast iteration and sufficiently accurate results. For the last optimisation steps, the polynomial order is increased to 4 to reduce numerical deviations (Feldmann, 2021, p. 72ff.). Electric loads and ground are realised as Dirichlet boundary conditions.
Realistic simulations must include absorption. Earlier studies show that using only mechanical losses suffices to describe the behaviour of piezoelectric ceramics realistically (Feldmann et al., 2021). Simulations are performed in the frequency domain, which allows for the realisation of different absorption models via complex frequency-dependent material parameters. In this study, the parameters of two different absorption models are identified and thus have to be included in the forward model.
The first absorption model is the well-known Rayleigh absorption (Craig and Kurdila, 2006), which has a mass- and a stiffness-proportional parameter (αM and αK). In the frequency domain, these parameters quantify absorption mechanisms that are inversely proportional and proportional to frequency, respectively. The Rayleigh absorption model is motivated primarily by its computational efficiency and is thus implemented in many finite element solvers.
In the second model, absorption is quantified independently of frequency. However, an eigenvalue decomposition of the stiffness matrix (Bause et al., 2016) allows different, frequency-independent absorption constants to be assigned to different deformations. For transverse isotropy, this approach can be reduced to three independent parameters (α1, α2, and α3) (Feldmann et al., 2021), where α1 quantifies absorption in shear deformations, α2 primarily affects radial deformations, and α3 influences coupled thickness and radial deformations.
While there are more elaborate models for absorption in piezoelectric ceramics, such as a Zener model applied to an eigendecomposed stiffness matrix (“non-standard linear solid”), the model with three constants is found to be an acceptable trade-off between the number of parameters and a good representation of the broadband behaviour of the material (Feldmann et al., 2021; Feldmann, 2021).
3.2 Sample preparation and impedance measurement
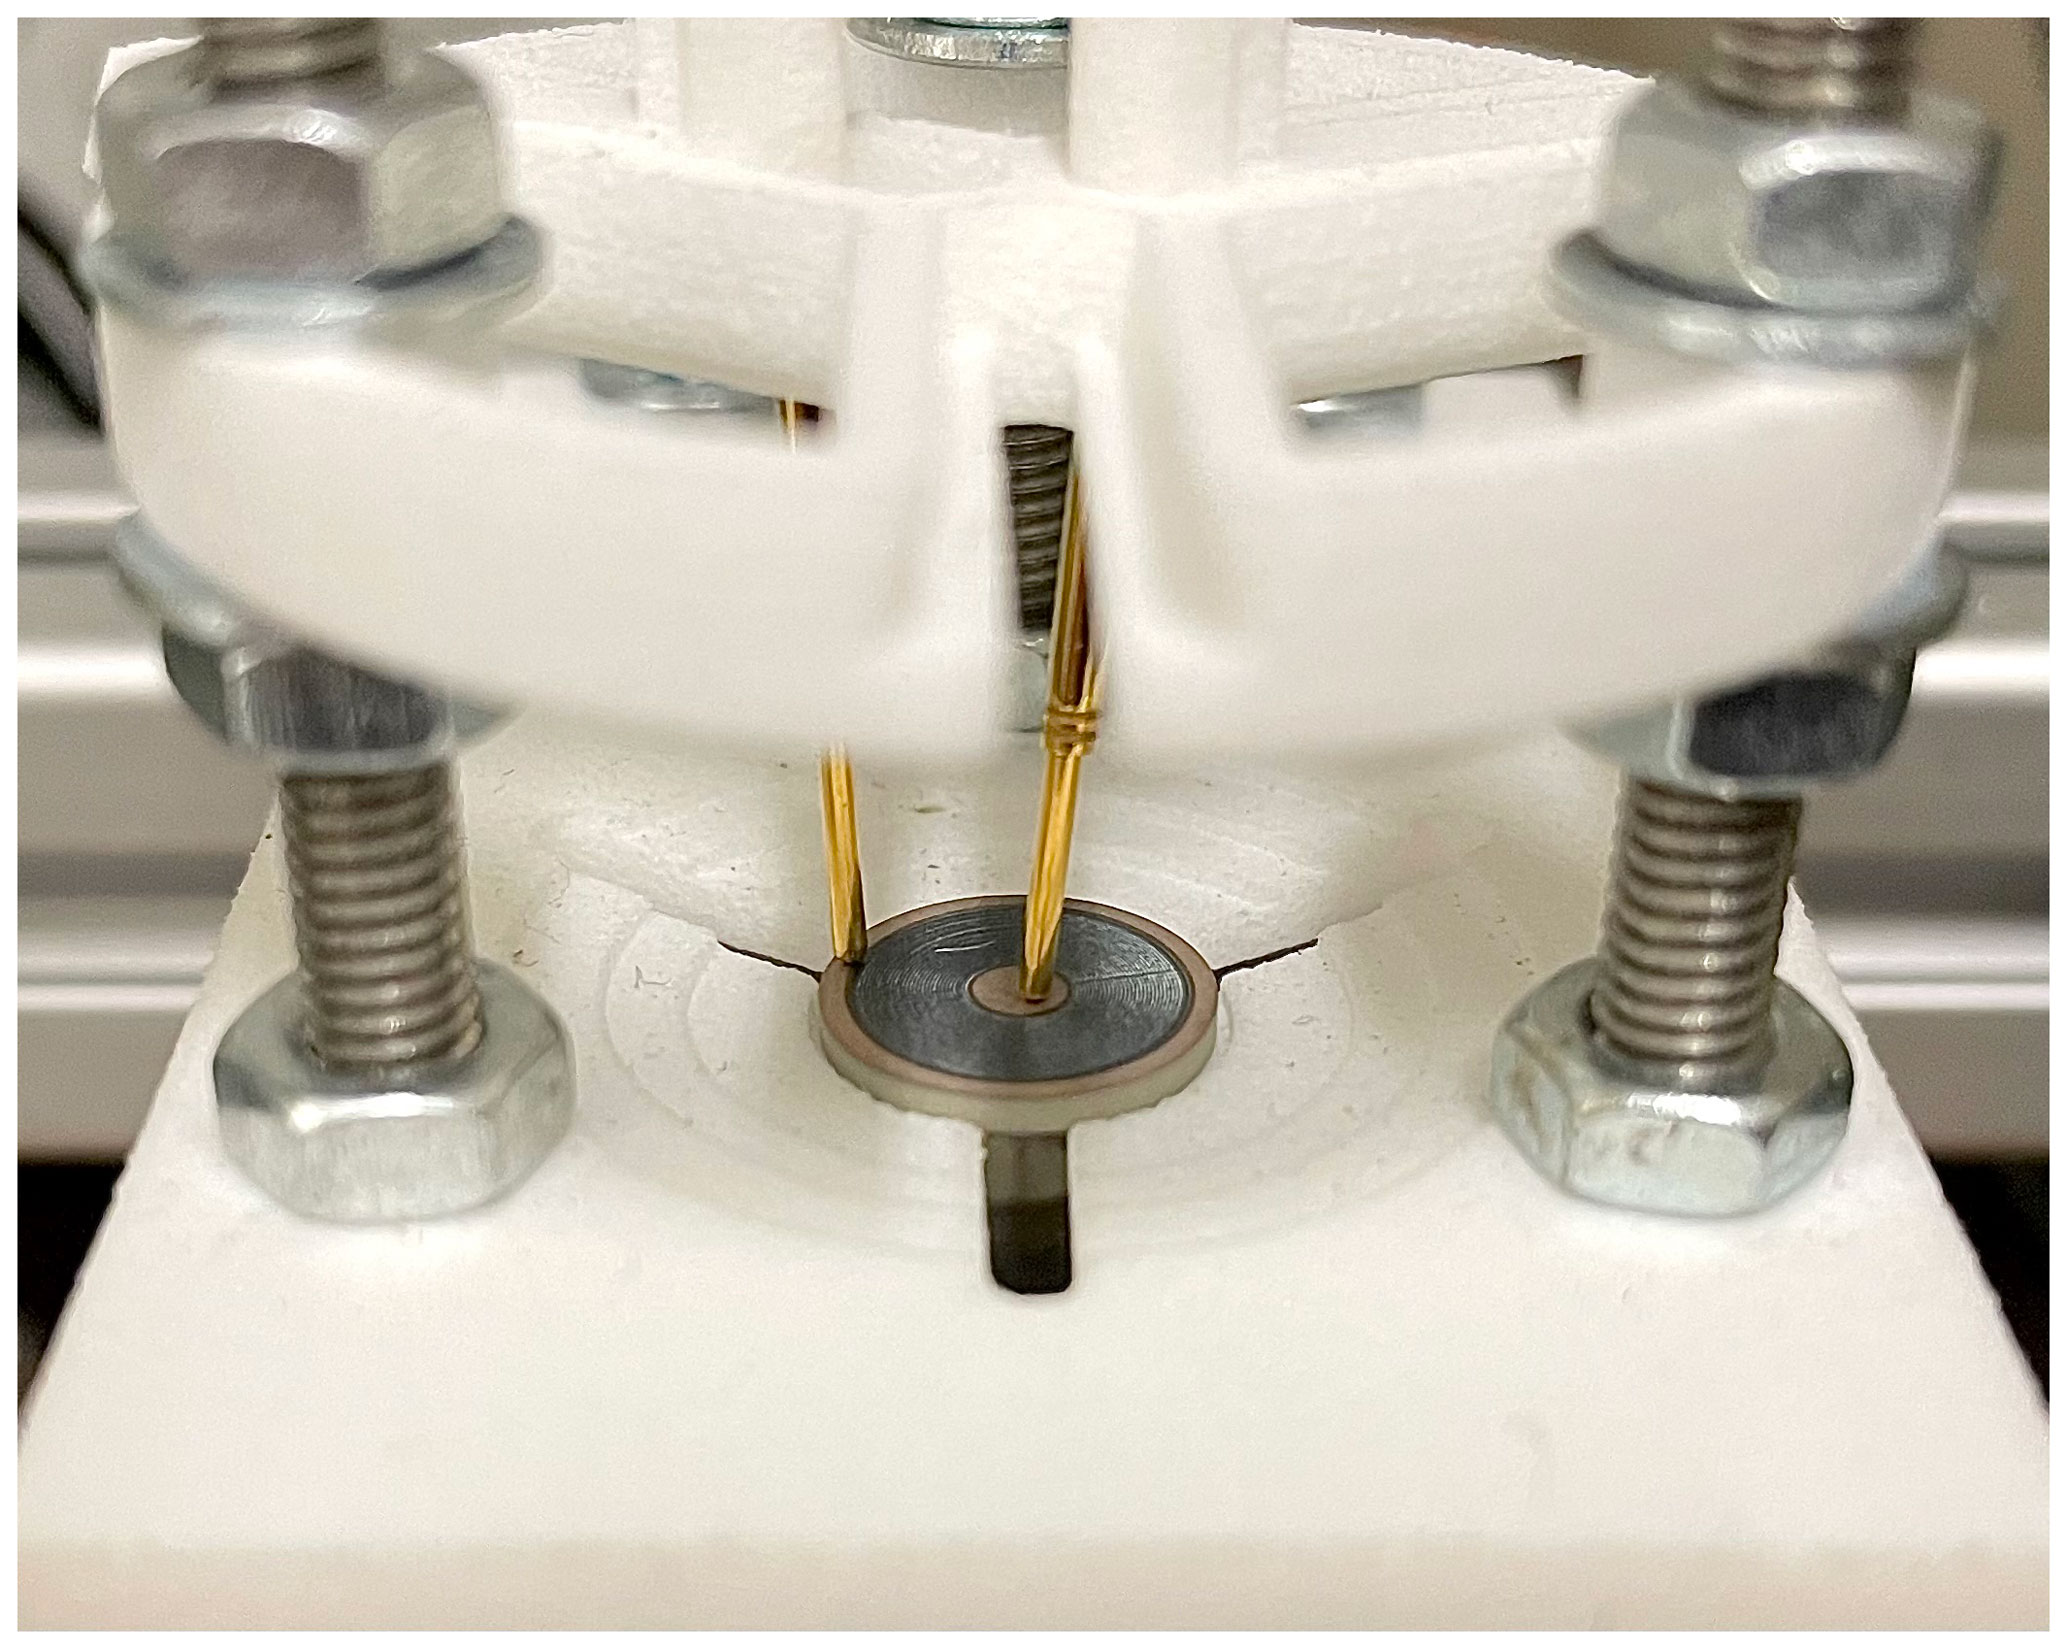
To realise the inverse measurement procedure, two impedance measurements are required: firstly, for the initial value estimation, the impedance of the sample with electrodes covering both faces is used. Secondly, the optimisation procedure requires the sample with the electrode structure determined in Sect. 2. Samples of different materials (PIC255 (soft piezoceramic, lead zirconate titanate), PIC184 (hard piezoceramic, lead zirconate titanate), and PIC700 (soft, lead-free piezoceramic, bismuth sodium titanate); PI Ceramic, Germany) with full electrodes are acquired. After an impedance measurement (Impedance Analyser E4990A; Keysight Technologies, USA) of the full-electrode sample, the optimised electrode structure is realised via laser ablation, so that the same sample can be used for both measurements. For the multi-electrode sample, a special fixture is used to contact the sample using spring-loaded pins (Fig. 4). The respective electrodes are shorted and contacted to the terminals of the impedance analyser. All impedance measurements are conducted in a temperature-controlled environment at 19±1 ∘C to ensure reproducibility and to avoid environmental influence on the results. Further, the density ρ of each sample is determined directly using gravimetric means (Analytical Balance LA 310 S; Sartorius, Germany).
3.3 Initial value estimation
Initial value estimation approaches are typically based on the evaluation of simplified, approximative analytical expressions inferred from the more complex inverse problem (Bause et al., 2016; Feldmann et al., 2020). For the present measurement procedure, the sample with electrodes covering both faces is used because analytical expressions exist which relate the thickness and radial resonance frequencies to a subset of the samples' material parameters (IEEE, 1987). The parameter set can be completed by assuming that the sample is mechanically and electrically isotropic and by applying empirically derived scaling factors (Unverzagt, 2018, p. 106). Simulations using the resulting estimates still show significant deviation from the measurement in the absolute value of the impedance (Fig. 5). To remedy this, an initial optimisation step is applied. However, because the sample with full electrodes is used, the step is still considered part of the initial value estimation process. In this fixed-gradient procedure, only one parameter at a time is optimised by evaluating only a specific resonance frequency in measurements and the simulation. To ensure that later steps do not revert the fit of a previous set, the order the parameters are considered in is carefully chosen based on the sensitivities of each parameter:
-
using an analytic approximation,
-
using the thickness resonance,
-
using the second radial resonance,
-
using the first radial resonance,
-
using an analytic approximation,
-
e33 using the thickness antiresonance,
-
e31 using an analytic approximation,
-
αM using the absolute value of the impedance at the first radial resonance frequency,
-
αK using the absolute value of the impedance at the first thickness resonance frequency.
The analytic approximation for considers the capacitive behaviour outside of the resonance modes and is thus given as
where A and d are the area and the thickness of the sample, respectively. The analytical approximation for is derived by Theocaris and Sokolis (1998), and e31 is recalculated using analytical expressions (IEEE, 1987) after the other parameters are adapted. The parameters not listed are not modified in this step. Note that only the parameters for Rayleigh absorption are estimated here. For the absorption model with constants, the initial values are derived from the values of the Rayleigh model at specific frequencies (Feldmann, 2021, p. 94ff.). Figure 5 shows a good match between the simulation results using the material parameters after the initial optimisation and the measurement result. However, the parameters not considered in the initial optimisation do not significantly influence the impedance of the sample with full electrodes and are thus under special consideration in the following steps.
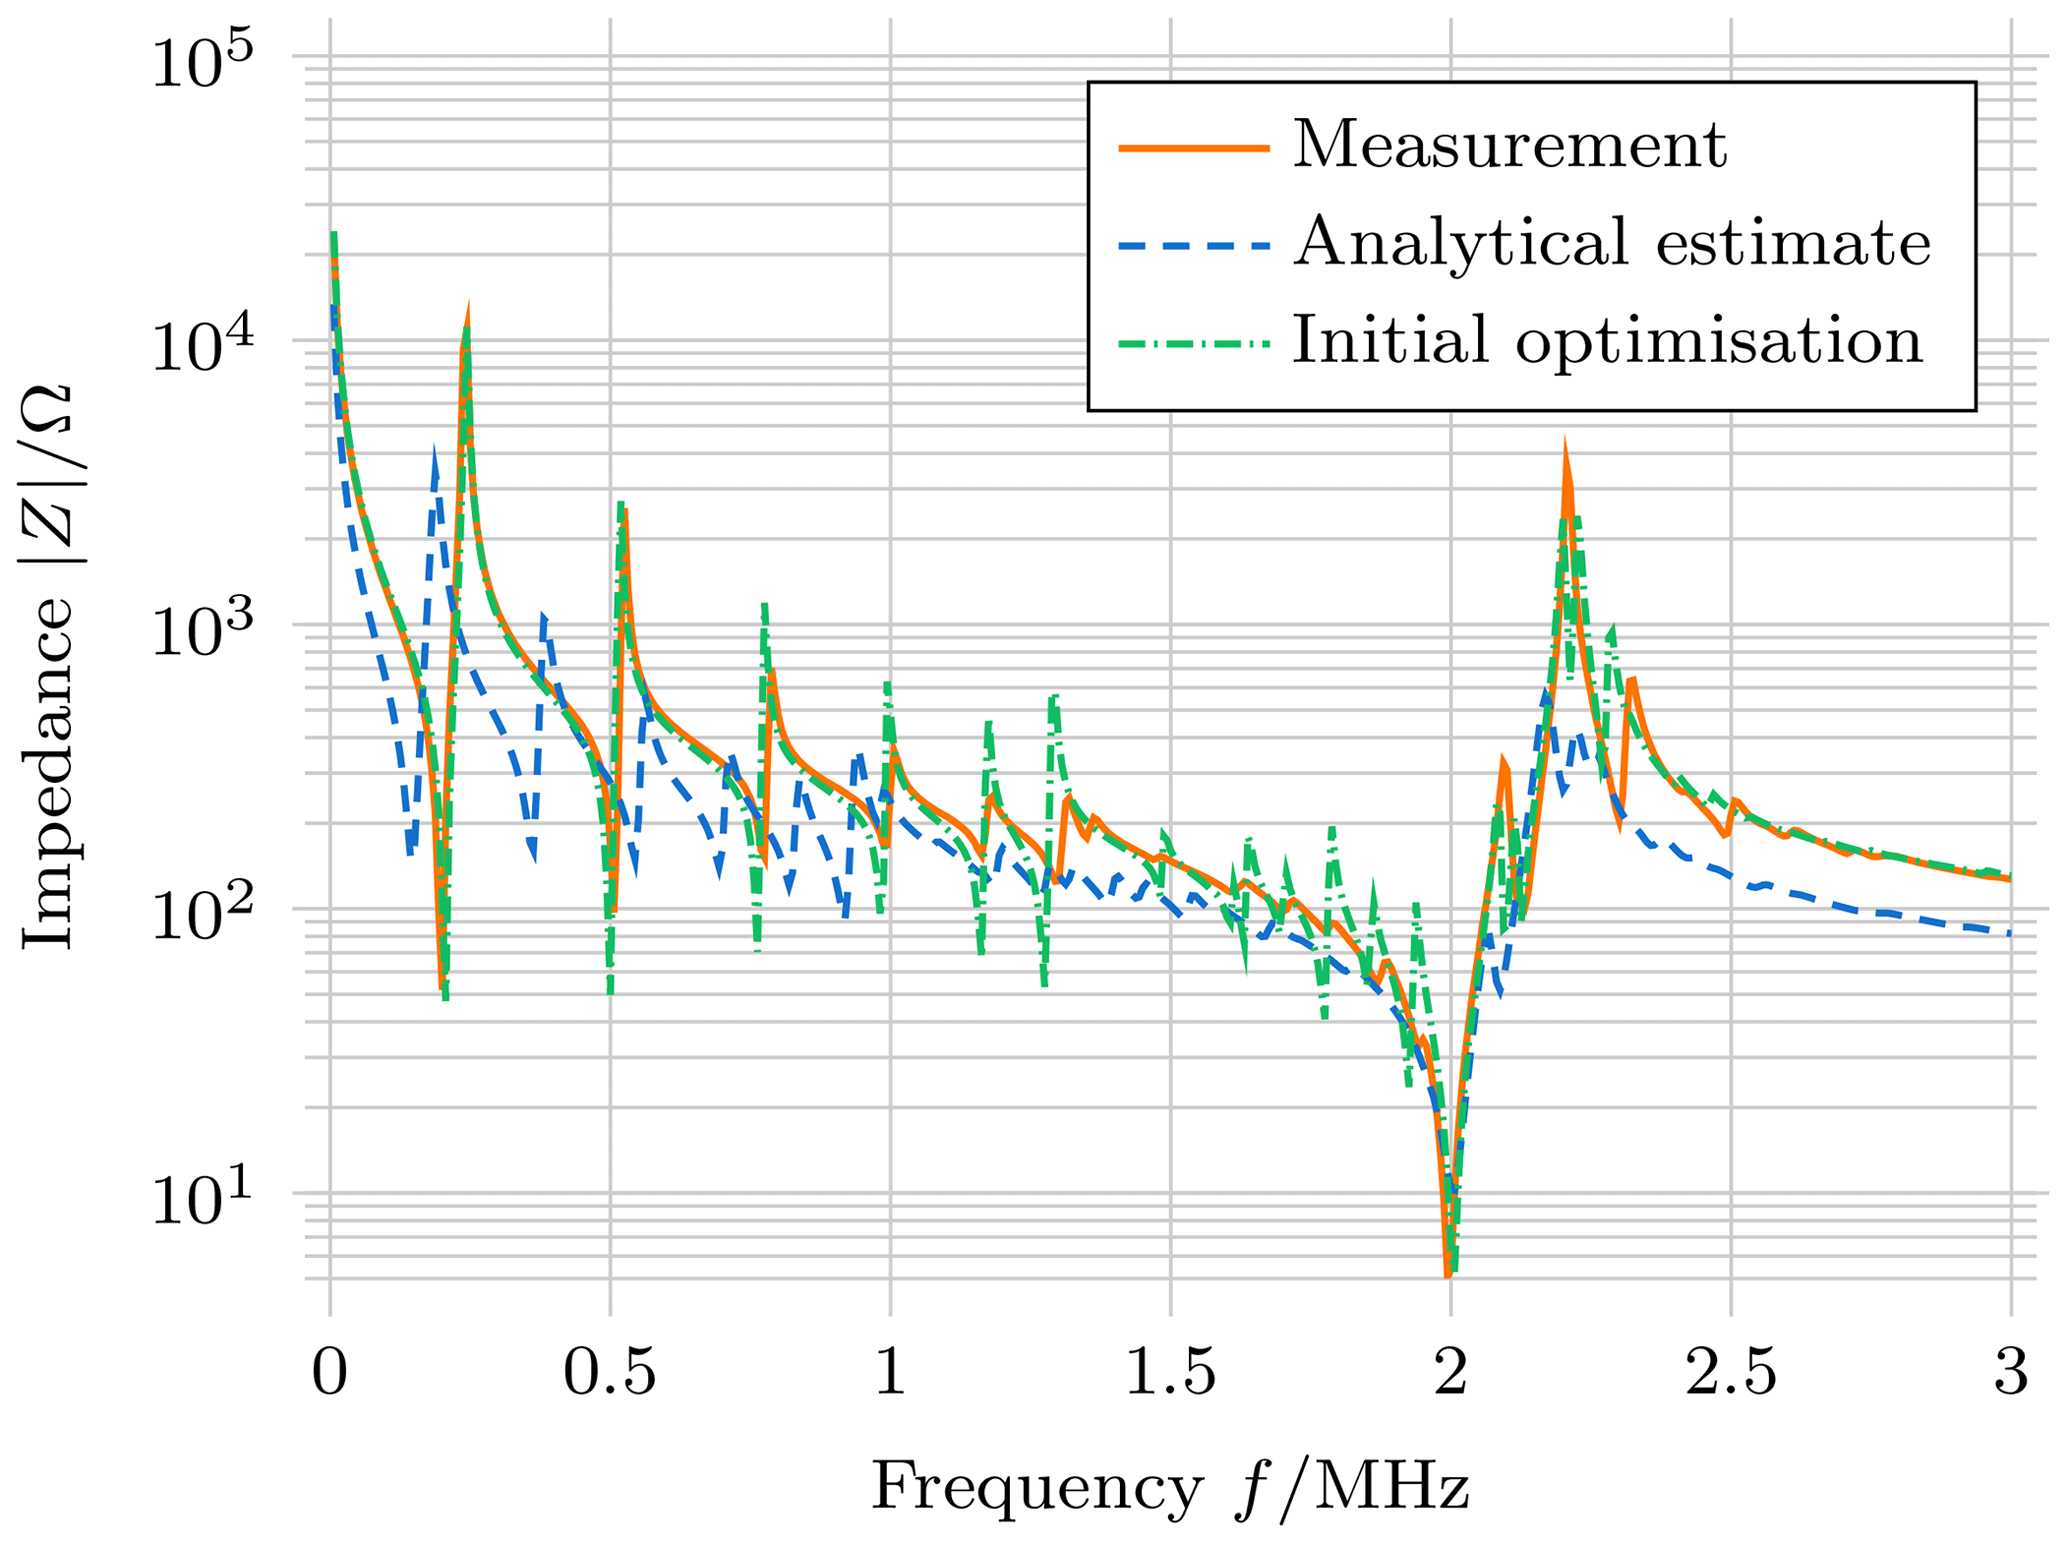
Figure 5Absolute value of the impedance measured on a physical sample (PIC255) with full electrodes and simulation result of each initial value estimation step.
3.4 Optimisation strategy
To compare measurements and simulation results, an adequate objective function is required. Here, the sum of the squared differences in the logarithmic absolute value of the impedances is evaluated:
where fj are the frequencies at which the measurement is performed and the forward model is evaluated. Because the optimisation problem has a high number of parameters (12 for Rayleigh absorption and 13 for the constant absorption model), a sensitivity-based, staged optimisation procedure is developed. This is realised by adapting the sensitivity matrix method developed by Feldmann (Feldmann et al., 2020; Feldmann, 2021, p. 109f) to the present problem, in which a staged optimisation on specific regions of the impedance is proposed where the sensitivity for a subset of the material parameters is high. However, because the sensitivity matrix ubiquitously shows high values for the present sensitivity analysis, the frequency axis remains at its original resolution. Figure 6 shows the result of the sensitivity analysis. The white dashes denote the range of the impedance, which is used for the optimisation. Note that the selected ranges do not always coincide with the highest sensitivity. This is because ranges are preferred that show a high sensitivity or a certain characteristic with respect to a specific material parameter but not to any other parameter. The coupling parameter e33 is not modified in this step. Optimisation is performed using a trust region reflective algorithm (Branch et al., 1999) in the order shown in Fig. 6, starting with the dielectric parameters on the top, which are optimised conjointly. Because the later steps may again revert a good fit from early steps, this staged optimisation is performed twice, however with a reduced count of maximum steps in the second pass (8 vs. 20 steps). Following this step, the element order of the forward model is increased from 3 to 4 for the final three optimisation stages. In the next step, the parameters of the absorption model are optimised. For the Rayleigh absorption model, αM is optimised on the lower frequencies of the impedance, where the radial modes occur, and αK is optimised on the thickness modes. For the constant absorption model α1 is optimised on the higher-order (>3) radial modes, α2 on the lower-order radial modes, and α3 on the thickness mode. In the penultimate step, all parameters except the absorption parameters are optimised, before the full set of material parameters is optimised in a final step. Which parameters are considered in each step is summarised as follows:
-
each material parameter separately according to Fig. 6,
-
each material parameter separately according to Fig. 6 but with a reduced number of maximal steps,
-
the absorption parameters on ranges that fit their representation in the frequency domain,
-
all material parameters except the absorption parameters,
-
all material parameters.
The results of this procedure for different piezoelectric materials are presented in the following section.
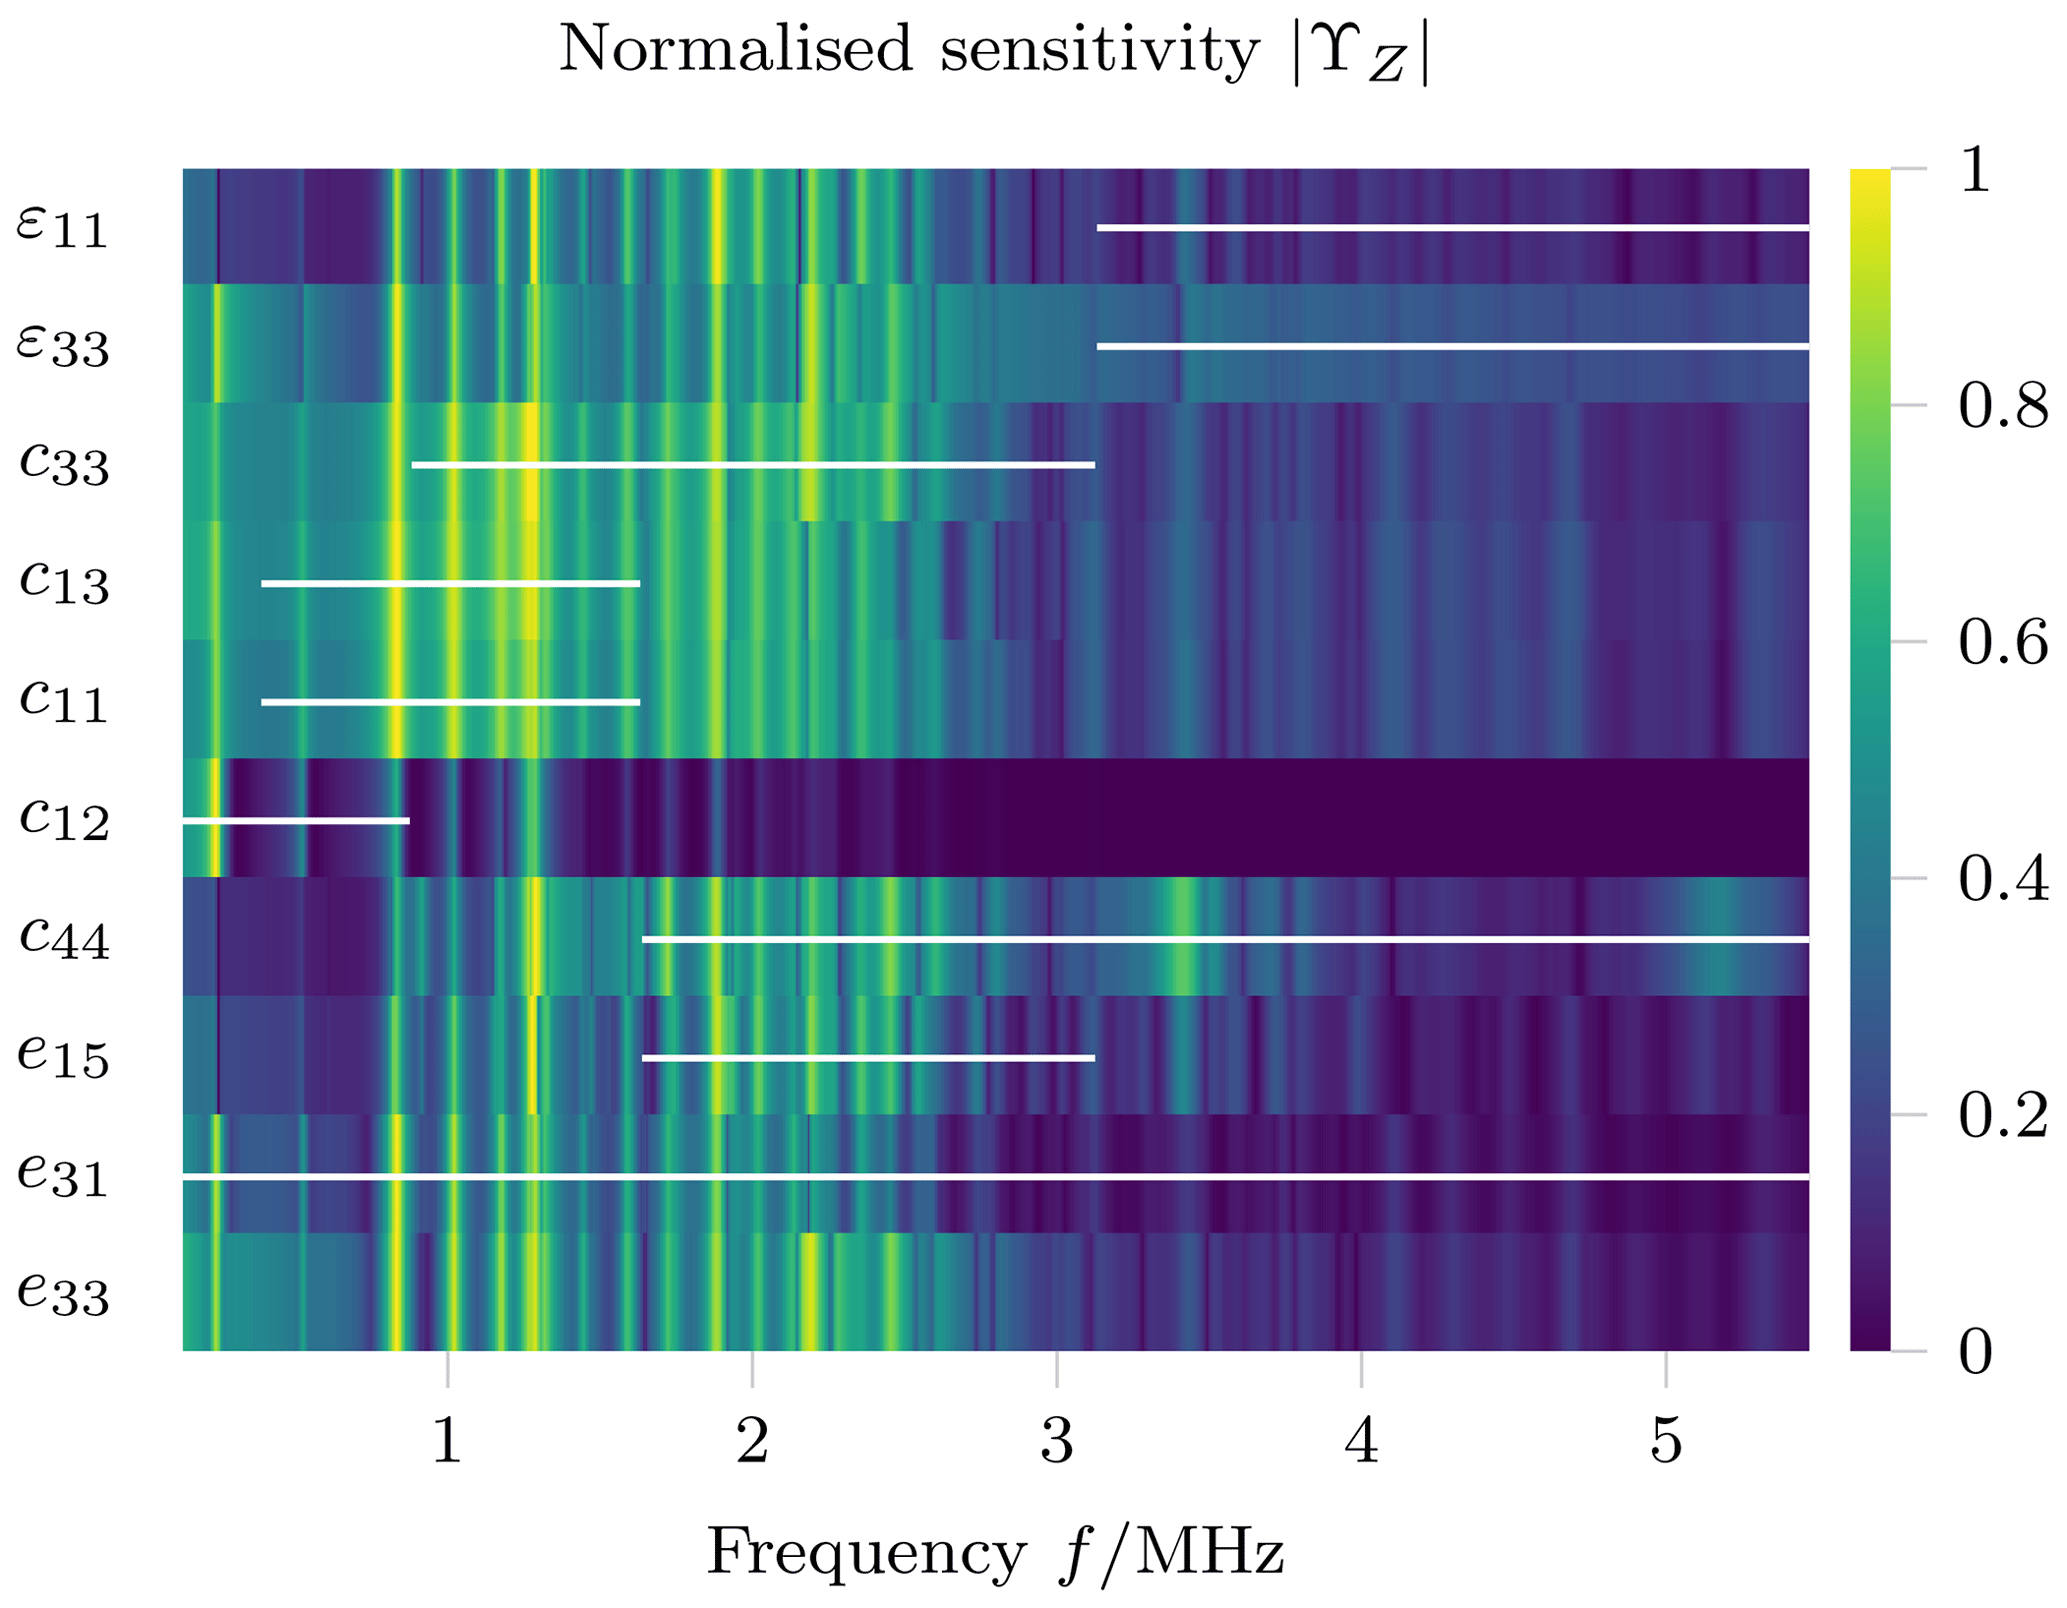
Figure 6Normalised sensitivity of the impedance measurement to each material parameter using the optimised electrode configuration. White dashes mark the range on which each material parameter is optimised in the order shown (top to bottom). For reference, the thickness resonant mode of the unmodified sample occurs at 2 MHz.
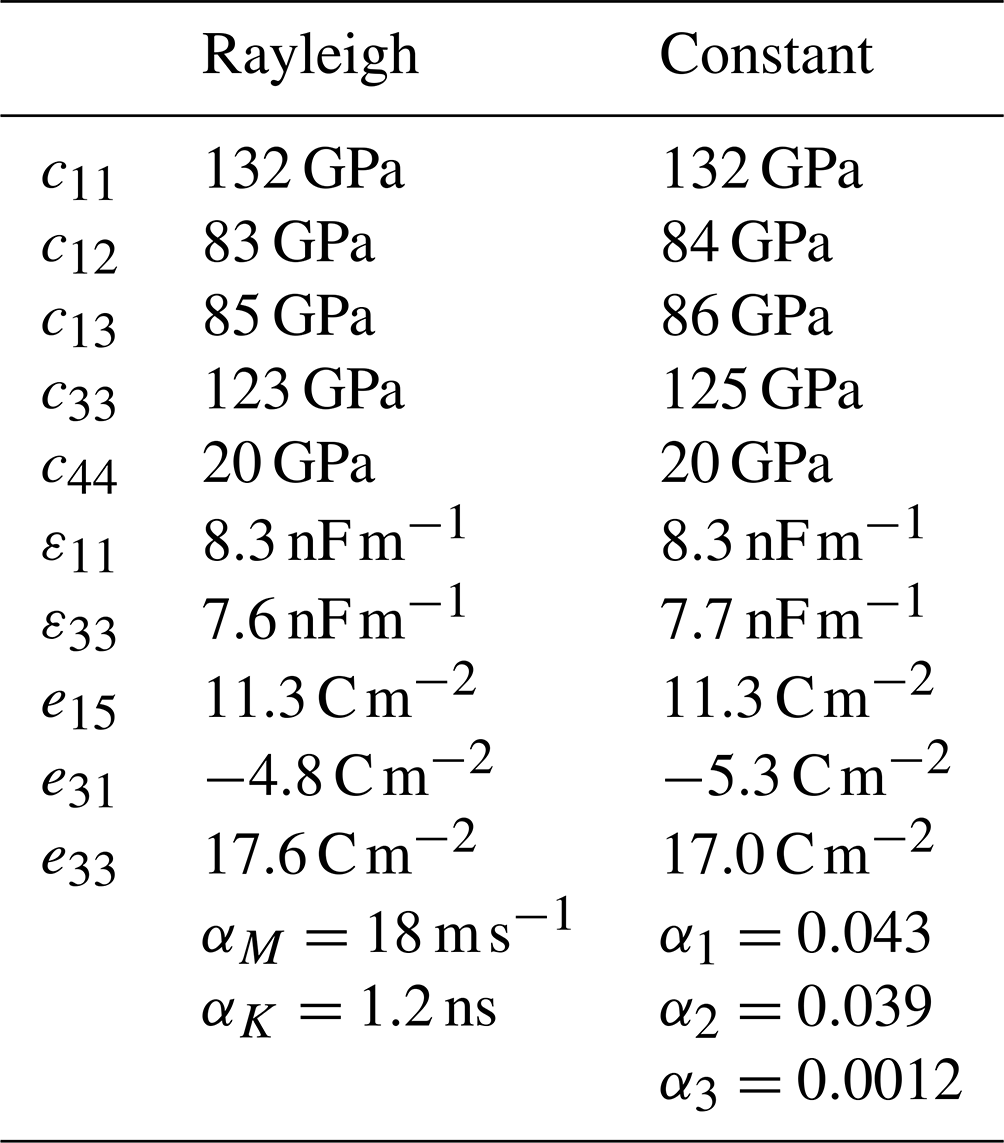
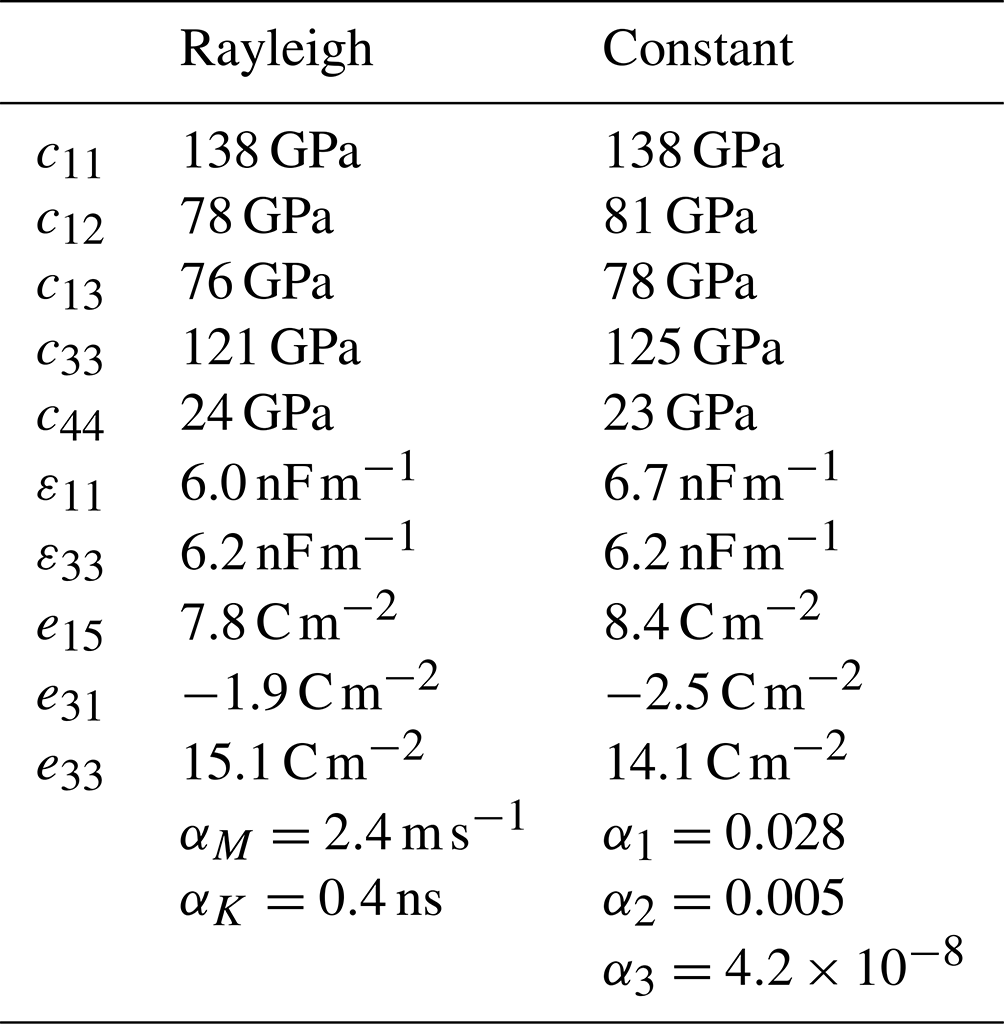
To review the results of the inverse measurement procedure, the impedance of the physical sample is compared to the impedance of the simulation model for the determined material parameters. Figure 7 shows the absolute value of these impedances for a soft piezoceramic sample (PIC255). Compared to an impedance measurement of a sample with full electrodes (Fig. 5), the impedance of the sample with the structured electrodes shows a more erratic behaviour. Especially the thickness resonance mode is no longer clearly distinguishable. However, measurements and the simulation are in good agreement with each other for both absorption models, indicating that the material of the sample is well described in its broadband behaviour by the determined parameters. Resonance frequencies generally occur at matching positions in the frequency domain but are however not as pronounced in the simulations for higher frequencies. Especially for the Rayleigh absorption model, some higher resonance frequencies are attenuated in the simulation. This better fit of the constant absorption model is also observed for three-electrode samples (Feldmann et al., 2021). The resulting material parameters for PIC255 are listed in Table 1. Note that the datasets contain values that are different aside from the absorption parameters. This is due to the fact that the absorption mechanism does not only influence the dissipative behaviour, but also the elastic and electric properties as well, thus necessitating the conjoint optimisation of all material parameters. The determined values are similar to previous results (Feldmann et al., 2021), with notable deviations occurring primarily in the absorption parameters. A possible explanation for this deviation can be that valid values for absorption parameters tend to cover larger ranges while still yielding realistic results (Feldmann, 2021, p. 96).
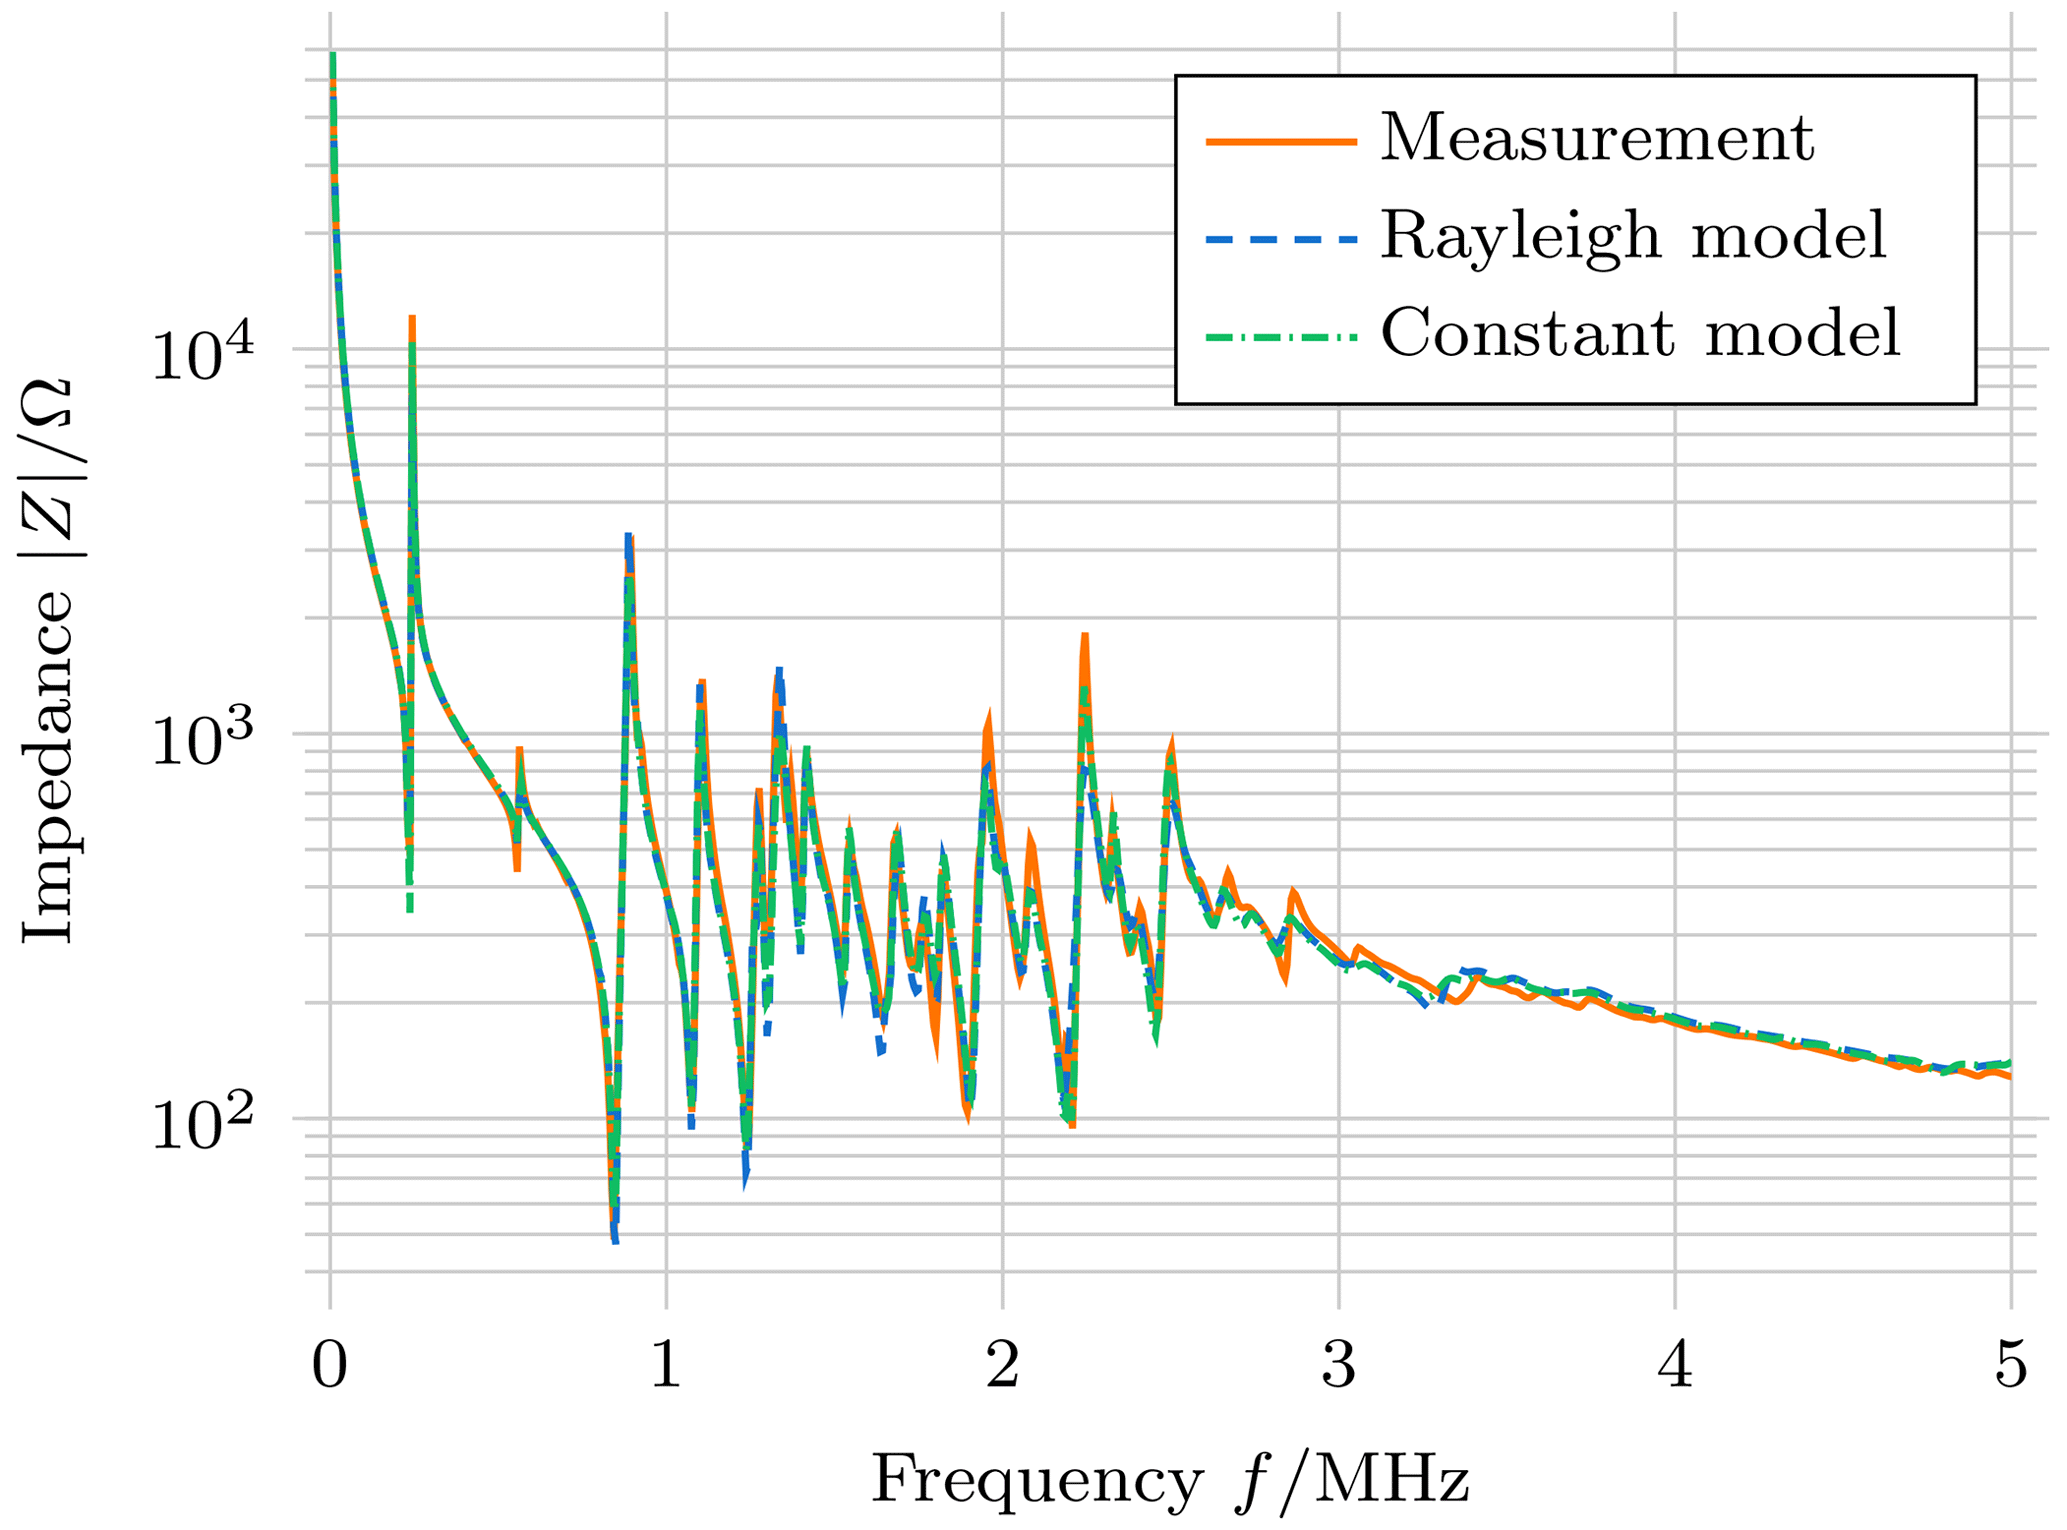
Figure 7Comparison of impedance from measurements and the simulation using the identified material parameters for a soft piezoceramic (PIC255).
Table 1Identified material parameters for PIC255 (density ρ=7800 kg m−3).
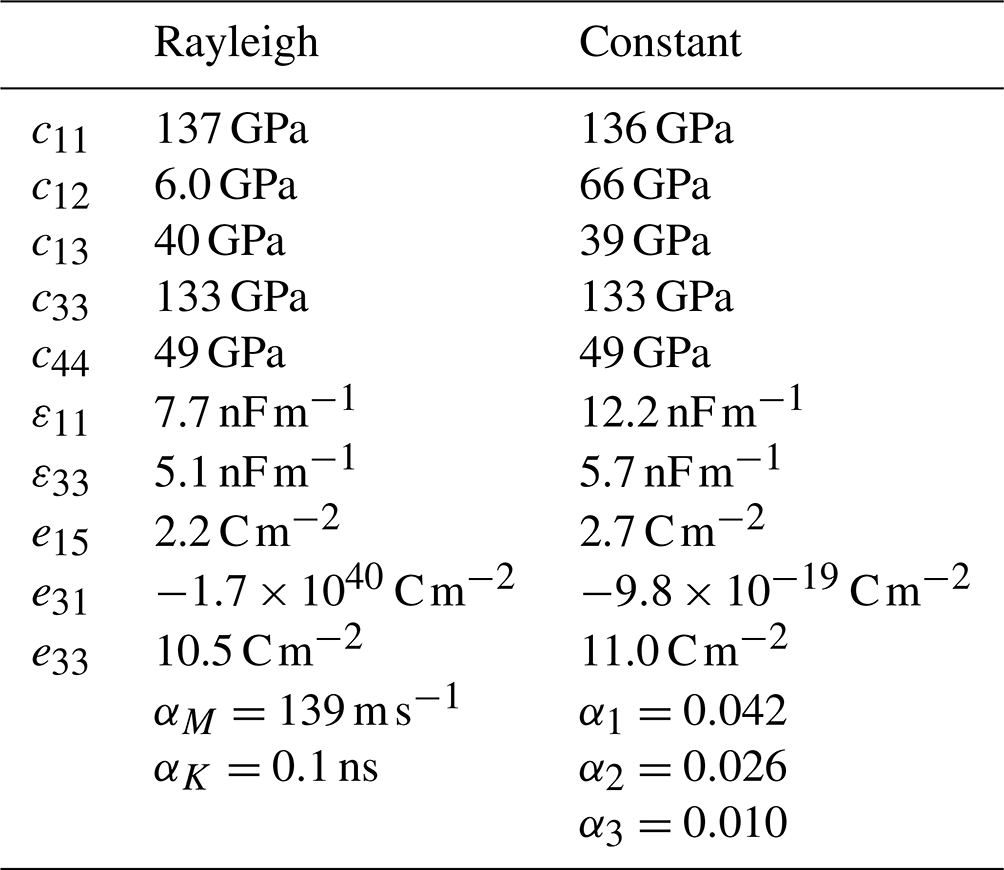
Even though the sample electrode geometry is optimised using material data for soft piezoceramics, the same geometry is realised on a hard piezoceramic sample (PIC184) to check if the inverse measurement procedure is transferable to this class of materials. The impedance measurement as well as the simulation result using the determined material parameters is shown in Fig. 8. The lower absorption of the material or the higher-quality factors of the resonance modes are immediately visible when compared to results of the soft piezoceramic (Fig. 7). However, even with the lower absorption, the thickness resonance mode, which also occurs at 2 MHz for the unmodified sample, is not clearly distinguishable. The match between measurements and the simulation is, however, of similar quality as for the soft piezoceramic sample. Resonance frequencies occur at matching position, and again, the absorption seems to be slightly overestimated, especially for the Rayleigh absorption model. The full parameter set (Table 2) shows similar elastic parameters as the previous results, however with smaller absorption parameters. Especially α3 is small enough to be neglected while still allowing for an adequate approximation of the physical behaviour.
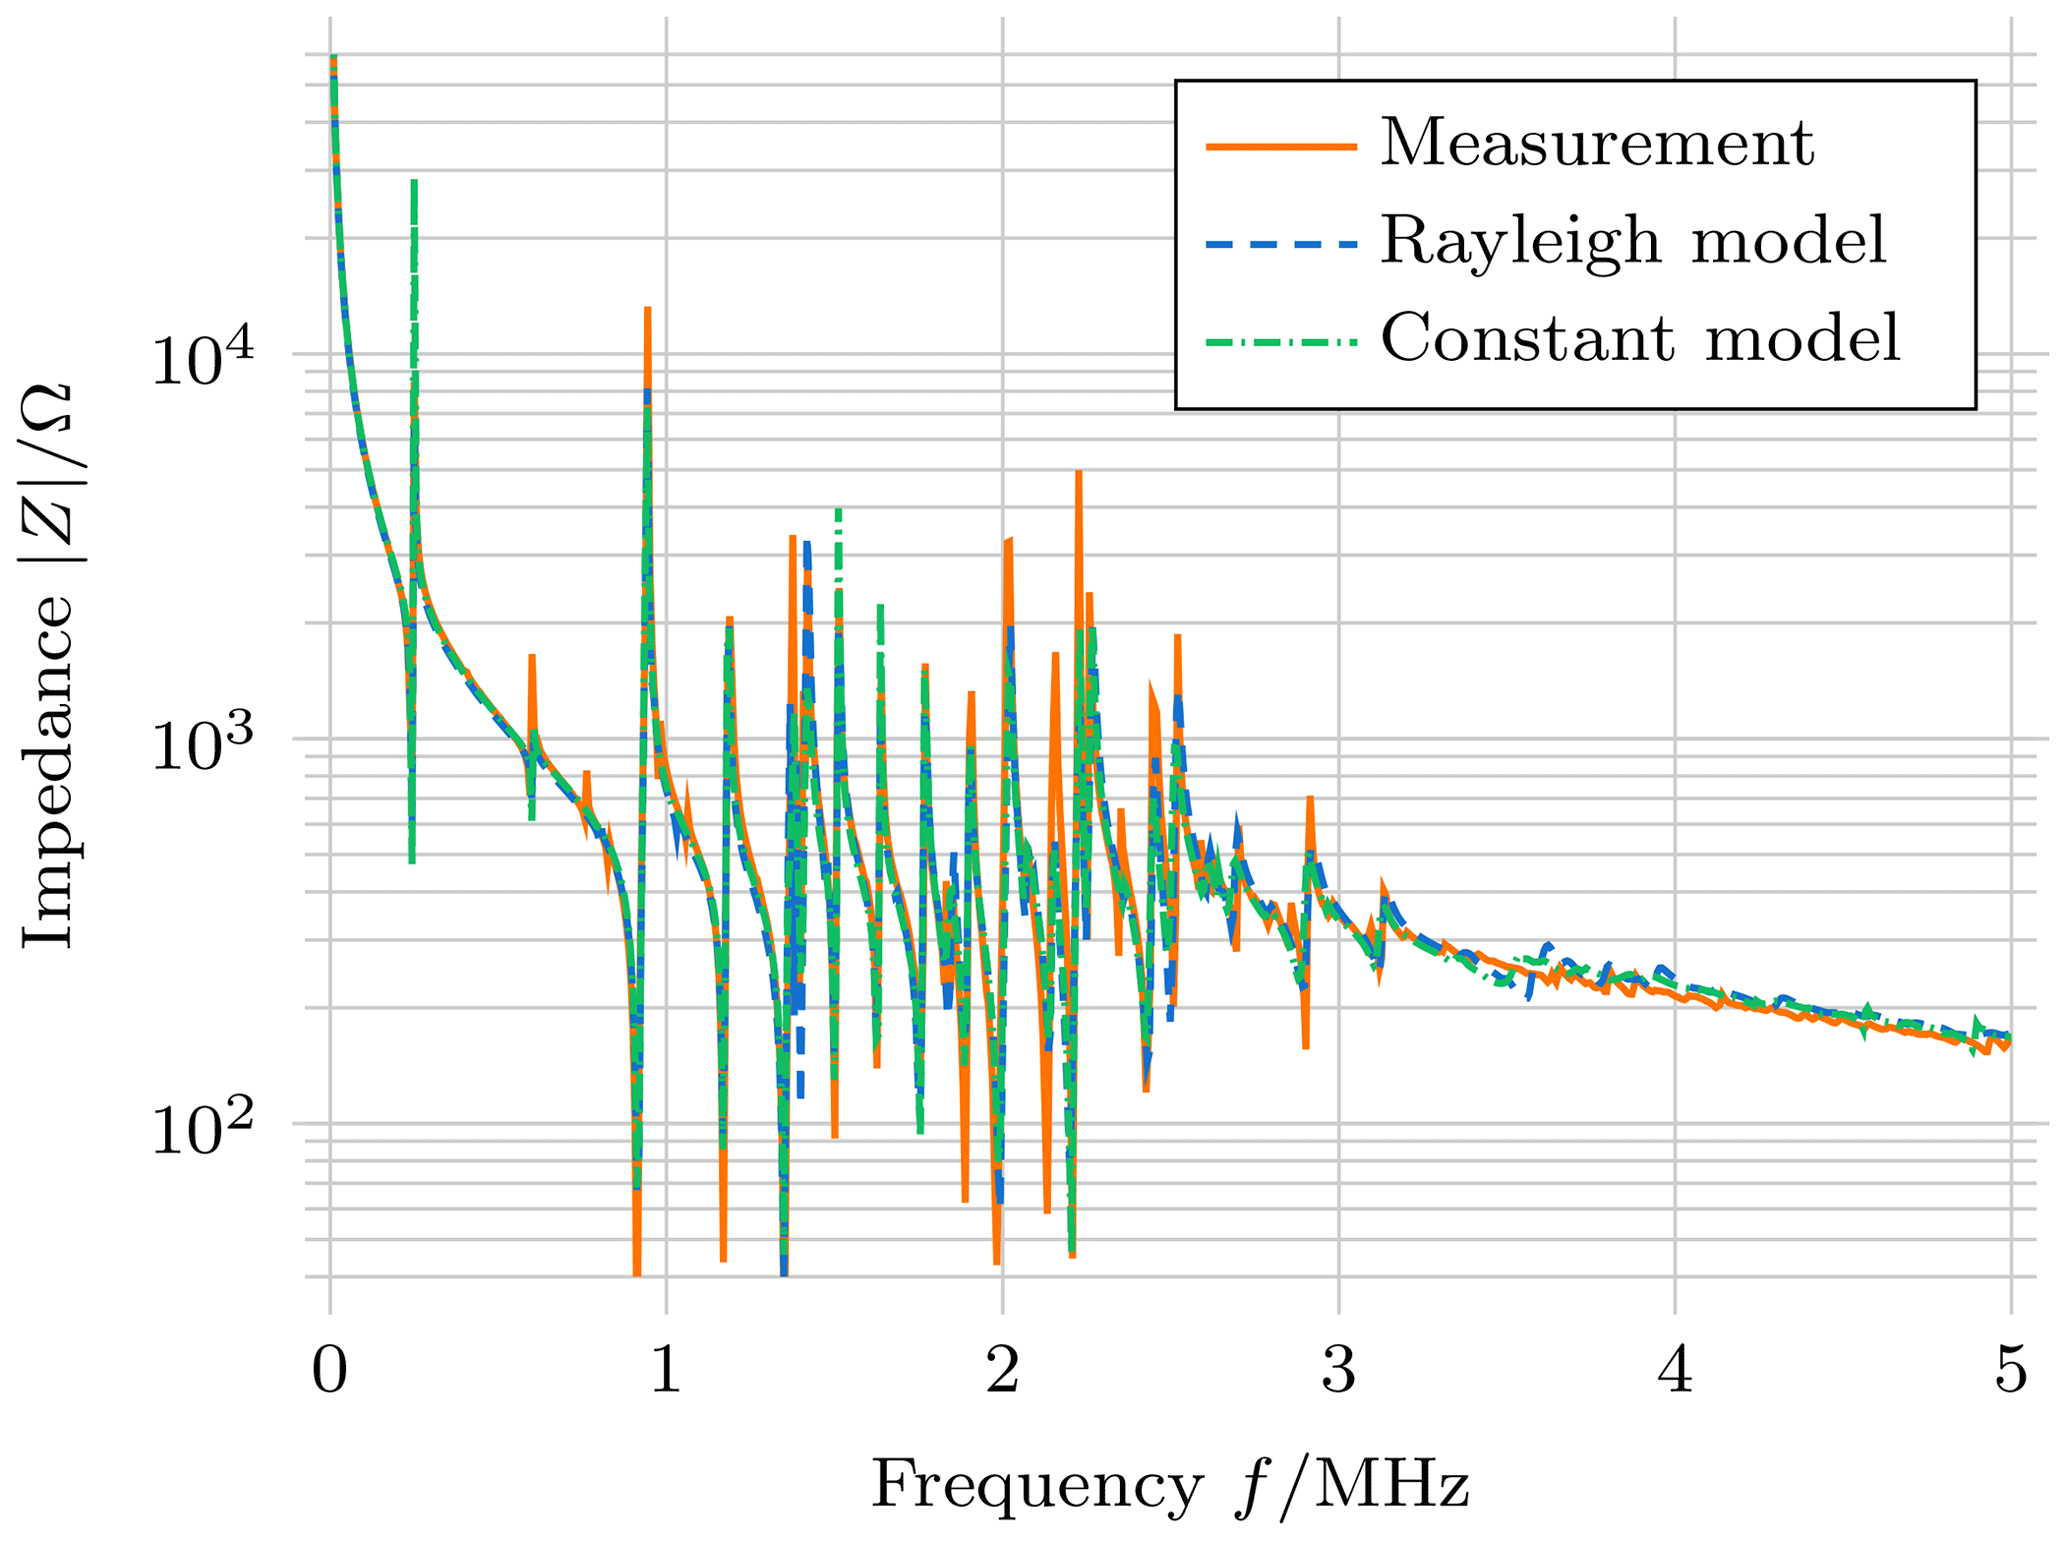
Figure 8Comparison of impedance from measurements and the simulation using the identified material parameters for a hard piezoceramic (PIC184).
Table 2Identified material parameters for PIC184 (density ρ=7730 kg m−3).
To further evaluate the transferability of the presented method for piezoelectric material characterisation, it is applied to a lead-free piezoceramic disc (PIC700) with the same dimension (a thickness of 1 mm and a radius of 5 mm) as the previously examined samples. While the same electrode geometry can be used, yielding adequate agreement between measurements and the simulation, the authors opt to recalculate the electrode geometry using the material parameters determined for PIC700 in the initial value estimation for the full electrode sample. The resulting electrode geometry has the same topology with slightly different radii: the circle-shaped electrode has a radius of 2.2 mm on the upper face and of 0.8 mm on the lower face. The inner radius of the ring-shaped electrode is 4.1 mm on the upper and 4.2 mm on the lower face.
The impedance of a sample of PIC700 with the modified electrode geometry is shown in Fig. 9. As is clearly visible, hardly any pronounced radial resonance frequency occurs. One might infer that this is due to low coupling factors of the lead-free material; however, the unmodified sample shows pronounced thickness resonance modes (Fenu et al., 2021) that are comparable to the ones observed in PIC255 (Fig. 5). The first thickness resonance mode occurs at about 2.5 MHz when the same geometry is used due to the different material parameters. However, radial resonance modes are significantly less pronounced in PIC700, indicating low radial coupling factors (Fenu et al., 2021). The method presented here relies on a strong coupling between radial and thickness modes to increase sensitivity, especially for radial parameters. A fit between measurements and the simulation is generally possible, as shown in Fig. 9 (the deviation observed for the impedance of the constant absorption model can be amended by adapting the dielectric parameters). However, large variations in the determined parameters (Table 3), for example, for c12, are observed. Of special interest is the coupling parameter e31, which is practically zero for both absorption models. That a fit is still possible indicates insufficient sensitivity to those parameters. An adaptation of the procedure for the analysis of lead-free piezoceramics is required to gain reliable results, starting with modifications of the sample geometry to increase the sensitivity with respect to the problematic material parameters c12, ε11, and e31. Further, the optimisation procedure needs to be adapted because the current approach fails to accurately identify ε33 for the constant absorption model.
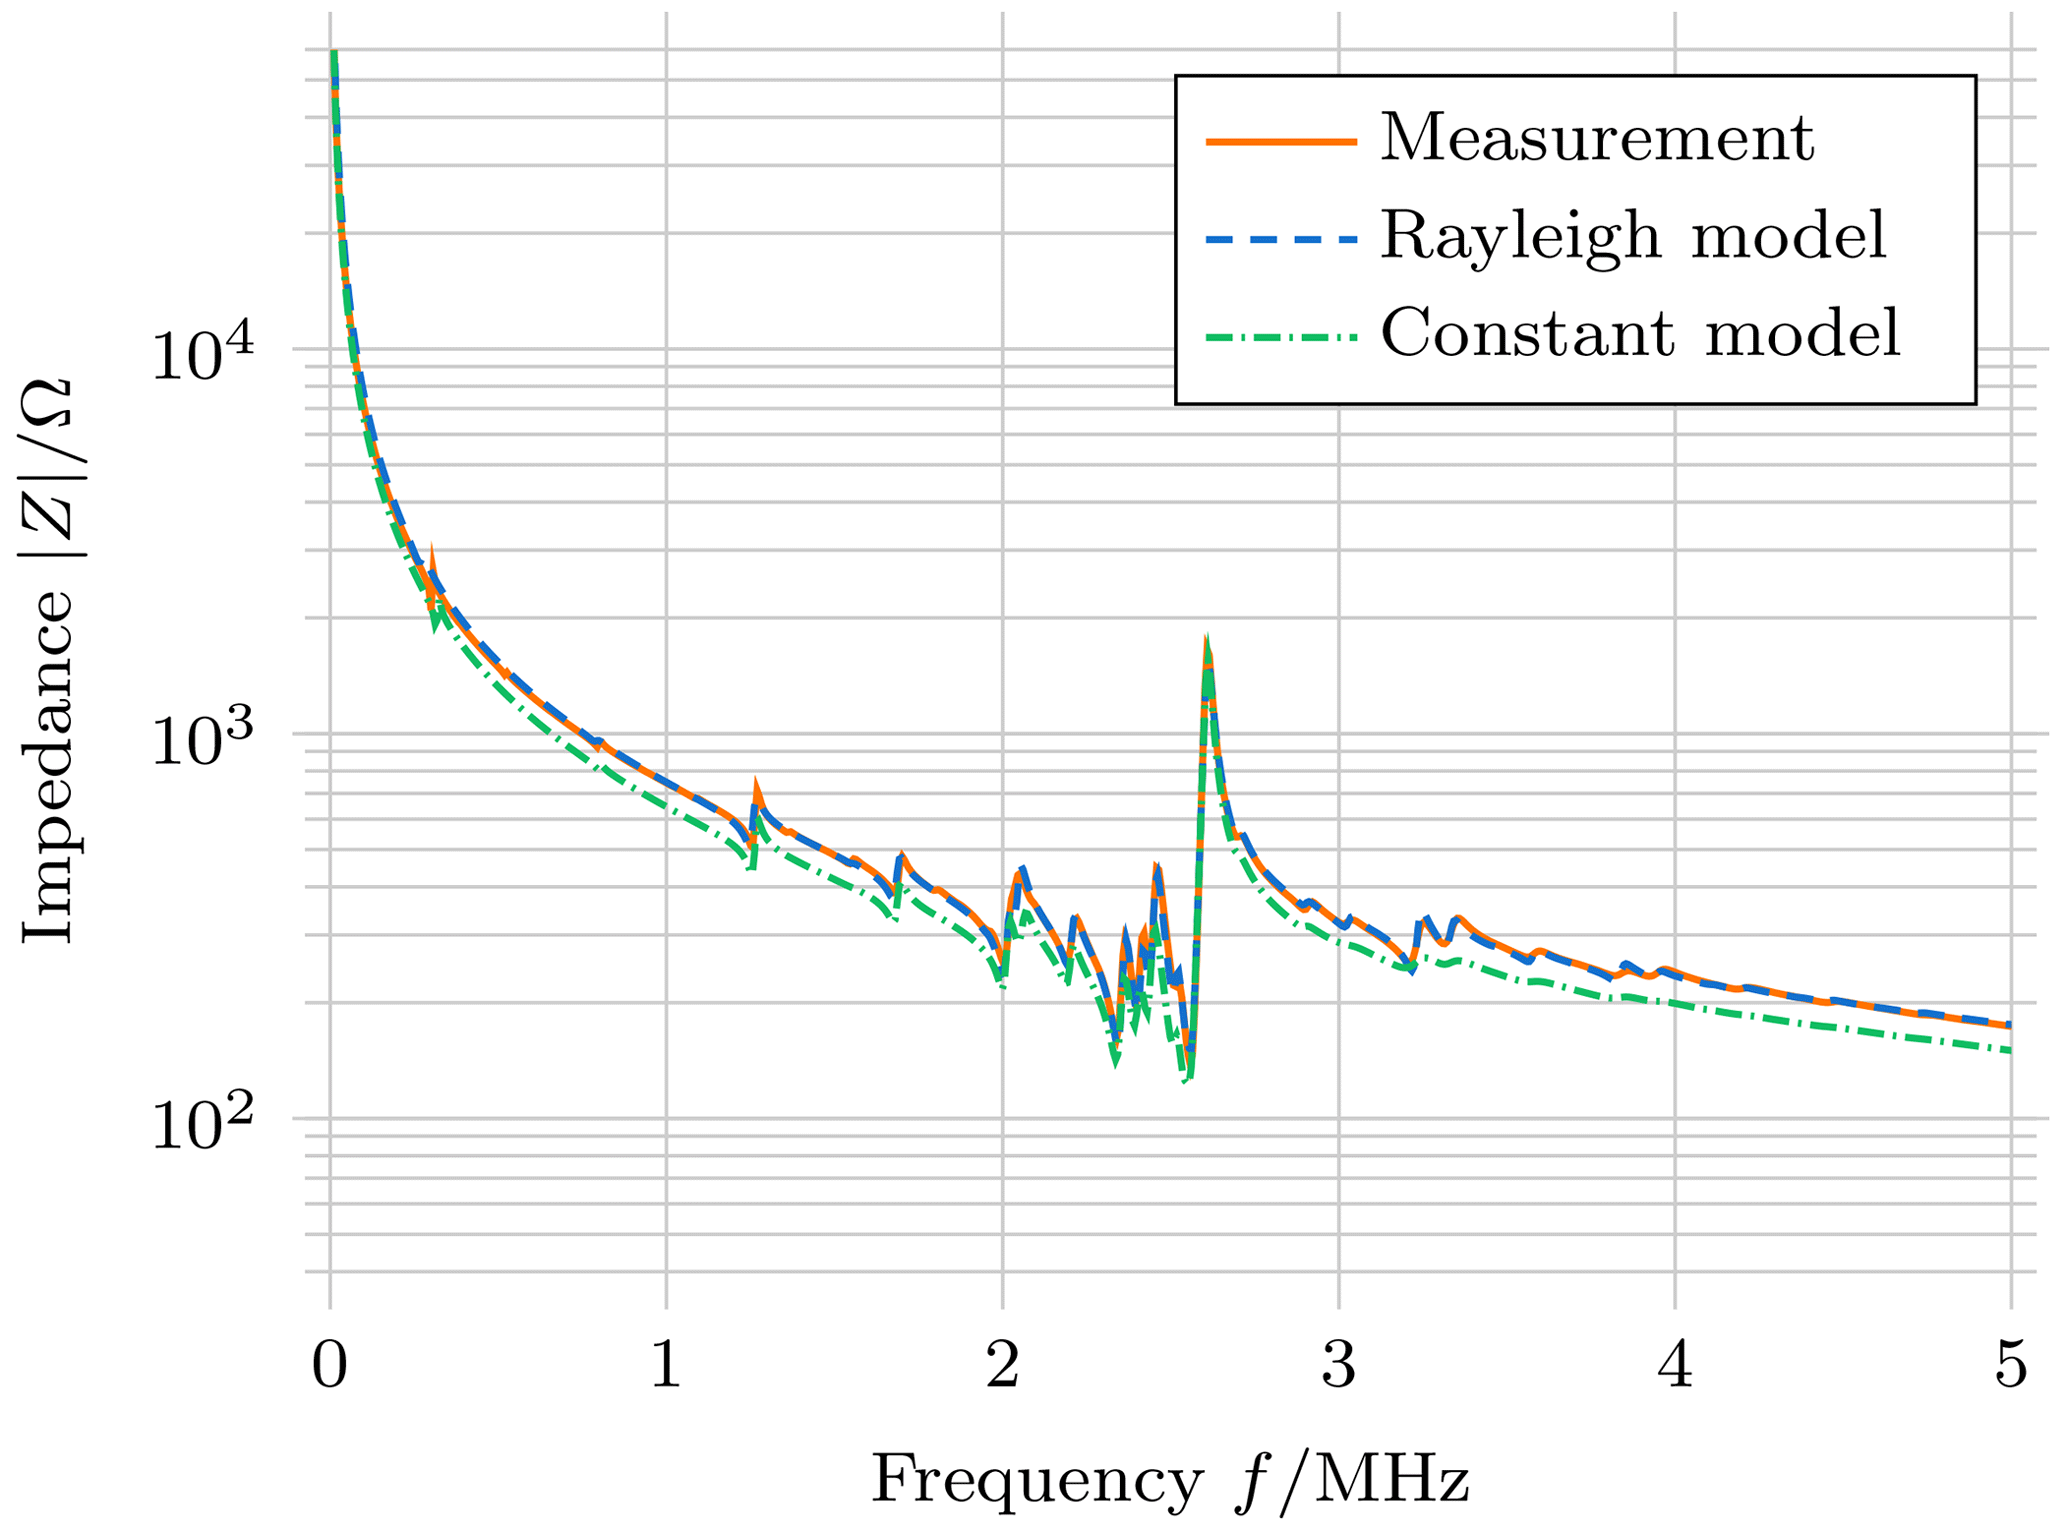
Figure 9Comparison of impedance from measurements and the simulation using the identified material parameters for a soft, lead-free piezoceramic (PIC700).
Table 3Preliminary results for the material parameters of PIC700 (density ρ=5716 kg m−3).
To realise an experimentally simple method for piezoelectric material characterisation, the authors combined methods of topology and gradient-based shape optimisation to create a sample with a special electrode geometry. This four-electrode sample enables the determination of a full set of material parameters based on a single electrical impedance measurement in an inverse measurement procedure. While the sample has one additional electrode compared to the previously used three-electrode arrangement, the experimental and identification procedure is significantly simplified due to the fact that all material parameters can now be determined based on a single electrical impedance measurement. The same sample geometry can be used for hard and soft piezoelectric materials, and it is expected that a scaled version of the derived electrode geometry will yield results for disc-shaped piezoceramics with a similar ratio of thickness to radius. Due to low radial coupling factors, the procedure does not yield satisfactory results for lead-free piezoelectric materials like PIC700, leaving this issue to be addressed in future research. Aiming to further increase sensitivity – especially for lead-free piezoelectric materials – more elaborate topology optimisation methods can be realised to further increase sensitivity via concrete configuration of boundary condition models for the underlying piezoelectric partial differential equation systems. These methods can be embedded in the context of optimal experiment design (Fedorov, 1972). Other future extensions of the presented measurement procedure will include the application to non-disc geometries, such as piezoelectric rings, which are preferred for high-power applications. Simulation of high-power acoustic transducers will also require consideration of non-linear and thermal effects. The long-term goal is a standardisation of an inverse procedure for piezoelectric material characterisation. While the results presented simplify the experimental measurement process, the optimisation is still a multi-step procedure that requires some manual interaction. Future research will include studies to simplify the multi-step optimisation, for example, by taking advantage of more elaborate analytical solutions and global optimisation approaches for initial estimates.
All computations conducted within the scope of the article are performed using open-source software tools. The finite element simulations for the sensitivity studies, the forward model, and the verification are realised using Schoder and Roppert (2022). Other software used, especially the optimisation algorithms, is provided by the NumPy (https://github.com/numpy/numpy, Harris et al., 2020) and SciPy (https://github.com/scipy/scipy, Virtanen et al., 2020) scientific computing libraries.
The datasets referred to are the material datasets provided in Tables 1 to 3.
LC conceptualised the measurement procedure, developed and applied the methodology, provided the visualisations, and wrote the original draft of the manuscript. NF, VS, and BJ conceptualised the measurement procedure, provided formal analysis, developed and applied methodology, acquired the funding for the research project, and reviewed and edited the manuscript. LM and HK developed the experimental hardware and software for measurement data acquisition and reviewed and edited the manuscript. AW and BH acquired the funding for, administer, and supervise the research project and reviewed and edited the manuscript.
The contact author has declared that none of the authors has any competing interests.
Publisher’s note: Copernicus Publications remains neutral with regard to jurisdictional claims in published maps and institutional affiliations.
This research has been supported by the Deutsche Forschungsgemeinschaft (DFG, https://doi.org/10.13039/501100001659; grant no. 321120716).
This paper was edited by Daniel Platz and reviewed by two anonymous referees.
Bause, F., Rautenberg, J., Feldmann, N., Webersen, M., Claes, L., Gravenkamp, H., and Henning, B.: Ultrasonic transmission measurements in the characterization of viscoelasticity utilizing polymeric waveguides, Meas. Sci. Technol., 27, 105601, https://doi.org/10.1088/0957-0233/27/10/105601, 2016. a, b
Branch, M. A., Coleman, T. F., and Li, Y.: A Subspace, Interior, and Conjugate Gradient Method for Large-Scale Bound-Constrained Minimization Problems, SIAM J. Sci. Comput., 21, 1–23, https://doi.org/10.1137/s1064827595289108, 1999. a
Claes, L., Feldmann, N., Jurgelucks, B., Schulze, V., Schmidt, S., Walther, A., and Henning, B.: Optimised Multi-Electrode Topology for Piezoelectric Material Characterisation, in: Sensor and Measurement Science International, AMA Service GmbH, https://doi.org/10.5162/SMSI2021/A10.1, 2021. a
Conn, A. R., Gould, N. I. M., and Toint, P. L.: Trust Region Methods, Society for Industrial and Applied Mathematics, https://doi.org/10.1137/1.9780898719857, 2000. a
Craig, R. R. and Kurdila, A.: Fundamentals of structural dynamics, John Wiley, Hoboken, ISBN 978-0471430445, 2006. a
Fedorov, V.: Theory of Optimal Experiments, Probability and Mathematical Statistics, Academic Press, ISBN 978-0123942456, 1972. a, b
Feldmann, N.: Ein modellbasiertes Messverfahren zur Charakterisierung von Piezokeramiken unter Verwendung eines einzelnen scheibenförmigen Probekörpers, Dissertation, Universität Paderborn, https://doi.org/10.17619/UNIPB/1-1264, 2021. a, b, c, d, e, f
Feldmann, N., Schulze, V., Claes, L., Jurgelucks, B., Walther, A., and Henning, B.: Inverse piezoelectric material parameter characterization using a single disc-shaped specimen, Tech, Mess,, 87, 50–55, https://doi.org/10.1515/teme-2020-0012, 2020. a, b, c, d
Feldmann, N., Schulze, V., Claes, L., Jurgelucks, B., Meihost, L., Walther, A., and Henning, B.: Modelling damping in piezoceramics: A comparative study, Tech. Mess., 88, 294–302, https://doi.org/10.1515/teme-2020-0096, 2021. a, b, c, d, e
Fenu, N. G., Giles-Donovan, N., Sadiq, M. R., and Cochran, S.: Full Set of Material Properties of Lead-Free PIC 700 for Transducer Designers, IEEE T. Ultrason. Ferr., 68, 1797–1807, https://doi.org/10.1109/tuffc.2020.3044790, 2021. a, b
Harris, C. R., Millman, K. J., van der Walt, S. J., Gommers, R., Virtanen, P., Cournapeau, D., Wieser, E., Taylor, J., Berg, S., Smith, N. J., Kern, R., Picus, M., Hoyer, S., van Kerkwijk, M. H., Brett, M., Haldane, A., Fernández del Río, J., Wiebe, M., Peterson, P., Gérard-Marchant, P., Sheppard, K., Reddy, T., Weckesser, W., Abbasi, H., Gohlke, C., and Oliphant, T. E.: Array programming with NumPy, Nature, 585, 357–362, https://doi.org/10.1038/s41586-020-2649-2, 2020 (code available at: https://github.com/numpy/numpy, last access: 12 May 2022). a
Heywang, W., Lubitz, K., and Wersing, W.: Piezoelectricity: Evolution and future of a technology, vol. 114, Springer, Berlin, ISBN 978-3540686804, 2008. a
IEEE: Standard on Piezoelectricity, IEEE, https://doi.org/10.1109/IEEESTD.1988.79638, 1987. a, b, c
Iula, A., Lamberti, N., and Pappalardo, M.: An approximated 3-D model of cylinder-shaped piezoceramic elements for transducer design, IEEE T. Ultrason. Ferr., 45, 1056–1064, https://doi.org/10.1109/58.710588, 1998. a
Jurgelucks, B.: Increased sensitivity in parameter identification problems for piezoelectrics, Dissertation, Universität Paderborn, https://doi.org/10.17619/UNIPB/1-654, 2019. a, b, c
Jurgelucks, B., Claes, L., Walther, A., and Henning, B.: Optimization of triple-ring electrodes on piezoceramic transducers using algorithmic differentiation, Optim. Method. Softw., 33, 868–888, https://doi.org/10.1080/10556788.2018.1435652, 2018. a
Kulshreshtha, K., Jurgelucks, B., Bause, F., Rautenberg, J., and Unverzagt, C.: Increasing the sensitivity of electrical impedance to piezoelectric material parameters with non-uniform electrical excitation, J. Sens. Sens. Syst., 4, 217–227, https://doi.org/10.5194/jsss-4-217-2015, 2015. a
Kybartas, D. and Lukosevicius, A.: Determination of piezoceramics parameters by the use of mode interaction and fitting of impedance characteristics, Ultragarsas, 45, 22–28, 2002. a
Lin, S. Y.: Coupled Vibration Analysis of Piezoelectric Ceramic Disk Resonators, J. Sound Vib., 218, 205–217, https://doi.org/10.1006/jsvi.1998.1750, 1998. a
Meitzler, A., O'Bryan, H., and Tiersten, H.: Definition and Measurement of Radial Mode Coupling Factors in Piezoelectric Ceramic Materials with Large Variations in Poisson's Ratio, IEEE T. Son. Ultrason., 20, 233–239, https://doi.org/10.1109/T-SU.1973.29750, 1973. a
Piao, C. and Kim, J. O.: Vibration characteristics of an ultrasonic transducer of two piezoelectric discs, Ultrasonics, 74, 72–80, https://doi.org/10.1016/j.ultras.2016.09.021, 2017. a
Querin, O.: Topology design methods for structural optimization, Academic Press, London, United Kingdom, ISBN 978-0081009161, 2017. a, b, c
Rupitsch, S. J. and Ilg, J.: Complete Characterization of Piezoceramic Materials by Means of Two Block-Shaped Test Samples, IEEE T. Ultrason. Ferr., 62, 1403–1413, https://doi.org/10.1109/TUFFC.2015.006997, 2015. a
Schoder, S. and Roppert, K.: openCFS: Open Source Finite Element Software for Coupled Field Simulation – Part Acoustics, arXiv [preprint], https://doi.org/10.48550/arXiv.2207.04443, 10 July 2022 (code available at: https://gitlab.com/openCFS/cfs, last access: 12 May 2022). a, b, c
Theocaris, P. and Sokolis, D.: Spectral Decomposition of the Compliance Tensor for Anisotropic Plates, J. Elasticity, 51, 89–103, https://doi.org/10.1023/A:1007549729716, 1998. a
Unverzagt, C.: Sensitivitätssteigerung durch Elektrodenmodifikation für die Materialparameterbestimmung von Piezokeramiken, Dissertation, Universität Paderborn, https://doi.org/10.17619/UNIPB/1-311, 2018. a, b
Virtanen, P., Gommers, R., Oliphant, T. E., Haberland, M., Reddy, T., Cournapeau, D., Burovski, E., Peterson, P., Weckesser, W., Bright, J., van der Walt, S. J., Brett, M., Wilson, J., Millman, K. J., Mayorov, N., Nelson, A. R. J., Jones, E., Kern, R., Larson, E., Carey, C. J., Polat, İ., Feng, Y., Moore, E. W., VanderPlas, J., Laxalde, D., Perktold, J., Cimrman, R., Henriksen, I., Quintero, E. A., Harris, C. R., Archibald, A. M., Ribeiro, A. H., Pedregosa, F., van Mulbregt, P., and SciPy 1.0 Contributors: SciPy 1.0: Fundamental Algorithms for Scientific Computing in Python, Nat. Methods, 17, 261–272, https://doi.org/10.1038/s41592-019-0686-2, 2020 (code available at: https://github.com/scipy/scipy, last access: 12 May 2022). a