the Creative Commons Attribution 4.0 License.
the Creative Commons Attribution 4.0 License.
 | 06 Jun 2023
Investigation of the degree of cross-linking of polyethylene and thermosets using absolute optical spectroscopy and Raman microscopy
Florian Bergmann
Norbert Halmen
Claudia Scalfi-Happ
Dominik Reitzle
Alwin Kienle
Linda Mittelberg
Benjamin Baudrit
Thomas Hochrein
Martin Bastian
In the research work presented here, an integrating sphere demonstrator which is suitable for the non-destructive determination of the degree of cross-linking or curing and has the potential for use as an at-line device for in-process quality assurance was assembled and explored. The measurement system allows the analysis of absorption and scattering coefficients of materials independently by means of absolute optical spectroscopy. The two optical parameters showed a good correlation with the degree of cross-linking of cross-linked polyethylene (PE-X) and the degree of curing of different thermosets and adhesives, each of which was determined using different reference methods (wet chemical analysis, differential scanning calorimetry (DSC), and dielectric analysis (DEA)). The results show that different PE-X materials can be distinguished well by their absorption and scattering in the visual (VIS) and near-infrared (NIR) wavelength range, respectively, and conclusions on their degree of cross-linking are possible. Also, the curing of resins can be monitored based on the absorption. In addition, Raman spectroscopy was used to achieve a better understanding of the material changes during the cross-linking of the materials. It also showed a good suitability for monitoring the curing processes in thermosets. In summary, the new method can be used to determine the crucial parameters of these industrial important material types and fulfils the great demand for fast, non-destructive testing, which can be carried out during the process or on the finished product.
- Article
(3352 KB) - Full-text XML
- BibTeX
- EndNote


Cross-linking can improve the material properties of thermoplastics at low cost, enabling them to perform tasks that would otherwise be reserved for more expensive engineering or high-performance plastics (Saechtling et al., 2013). Examples of applications for cross-linked polyethylene (PE-X) are water distribution pipes, heating systems, and surgical implants, while cross-linked polyamide is used in the automotive sector. The network formation that takes place during cross-linking is comparable to that which occurs during the curing reaction of thermosets, which are used, for example, in thermoset injection moulding, fibre-reinforced plastics, and adhesives. They are becoming increasingly important in the context of the energy revolution and e-mobility (Grover, 2021; Mason, 2021).
The degree of cross-linking, respectively, curing of these materials, has a significant influence on their mechanical, thermal, and chemical properties (Kurtz, 2004). Therefore, quality assurance of this parameter is crucial – especially since cross-linked materials can no longer be melted and thus recycled. Most available test methods for the degree of cross-linking are destructive laboratory methods, each with different disadvantages. For example, the classic wet chemical determination of the degree of cross-linking of PE-X is very time-consuming and not suitable for long-chain polymers such as ultra-high molecular weight PE (UHMWPE; DIN, 2012; Heiduk, 2015). An alternative approach using dynamic mechanical analysis is faster but still destructive and requires special sample preparation (Heiduk, 2015; DIN, 2019). The same applies to established thermal analysis like DSC (differential scanning calorimetry; Ehrenstein et al., 1997; DIN, 2018, 2014). DEA (dielectric analysis) is mainly used in the thermoset sector, requires direct sample contact, and needs to start in the liquid state so that subsequent testing of solids is not possible (NETZSCH Gerätebau, 2018; Mortensen et al., 2018). A fast, non-destructive method would be desirable for monitoring the degree of cross-linking or curing during production and afterwards.
Absolute optical spectroscopy offers a promising approach to solve this problem. Here, the absorption and scattering coefficients of a sample can be determined separately by considering the light propagation within the sample. Thus, properties like crystallinity and the degree of cross-linking in semi-crystalline materials such as PE-X can be investigated independently, or the influence of fillers in thermosets or adhesives can be studied. Similarly, Raman spectroscopy shows great potential in the study of the state of curing of thermosets. In the joint research work presented here, a demonstrator based on an integrating sphere was set up, and various PE-X materials cross-linked by electron beam radiation in addition to different resin materials were investigated. Wet chemical analysis, DSC, and DEA were used as reference.
2.1 Cross-linking and curing
Cross-linking of thermoplastics is characterized by the formation of a three-dimensional network, which affects the material properties in a variety of ways. For example, hardness is increased, and solubility is decreased. Cross-linked materials can no longer be melted and thus may be used for more demanding applications. The cross-linking process from the semi-crystalline PE to PE-X is achieved via radicals, which can be generated in various ways. Either special additives (PE-Xa with peroxides or PE-Xb with silanes) or high-energy electron radiation (PE-Xc) is used for this purpose. Cross-linking only occurs in the amorphous regions of the semi-crystalline PE. The final material properties are directly related to the degree of cross-linking. For this reason, it is well suited to being quality indicator (Saechtling et al., 2013; Heiduk, 2015).
The curing reaction of thermosets (and reactive adhesives) is started by adding the curing agent or the necessary activation energy. Complete curing depends on the correct mixing ratio of the components and ambient conditions (temperature and humidity). During the curing reaction, a dense molecular network is formed. The degree of curing is also decisive for the thermomechanical properties of the thermoset and (in addition to the correct surface treatment) for the strength of bonded joints (Ehrenstein et al., 1997; Habenicht, 2009).
2.2 Absolute optical spectroscopy
Absolute optical spectroscopy offers a promising non-destructive and therefore time-saving and cost-effective method to monitor the degree of cross-linking in addition to the curing of resins by considering the elastic scattering of light. The diversity of absolute optical spectroscopy measurement systems enables in-line and at-line investigations. Spatially resolved or spatial-frequency-resolved set-ups, on the one hand, are suitable for in-line investigations using relative large measurement distances and short time spans. An integrating sphere, on the other hand, can be used only for at-line investigations due to the larger number of measurements (reflectance, transmittance, and calibration), the requirement of the direct contact of a sample, and the relatively large (2 min) measurement time (Bergmann et al., 2020). In absolute optical spectroscopy, the sample is measured and compared to a calibration standard with precisely known optical properties. For an absolute optical measurement, the following two conditions are necessary:
-
The light intensity measurement of illumination and detection has to be absolute or compared to a calibration standard and be independent of a comparison with other measurements.
-
The experimental set-up (illumination, sample alignment, and detection) and theoretical descriptions of the set-up have to match, in order to avoid systematic errors.
With these conditions, a quantification, or rather a separation of optical properties like scattering and absorption is possible. As a consequence, chemical and physical properties can be determined separately, and calibration series like in conventional visual (VIS)/near-infrared (NIR) spectroscopy are not necessary. The optical properties, within the framework of radiative transport theory, are the quantities refractive index n, absorption coefficient μa, effective scattering coefficient , scattering coefficient μs, and phase function (Kienle et al., 1996). In the present study, transparent (no scattering) and highly scattering (negligible small single scattering) media were investigated using different evaluation models. Transparent media can be investigated using the Fresnel equations, and the integrating sphere is used as some kind of (collimated) transmittance detector. In this case, the absorption coefficient can be determined directly. For highly scattering media, the inverse problem of the radiative transport theory has to be solved. In our case of negligible small single scattering, the media can approximately be described by the absorption coefficient, the effective scattering coefficient, and the averaged refractive index of a medium. Separating the absorption coefficient and effective scattering coefficient enables the determination of the concentration of known constituents in addition to the estimation of the scattering particle dimension. Conventional spectroscopy, on the other hand, can only give information about the absorbance, which is influenced by scattering in addition to absorption. Therefore, absolute optical spectroscopy has a major advantage compared to conventional spectroscopy. The knowledge of the absorption of thermoplastics in the VIS and NIR wavelength range, respectively, allows us to draw qualitative conclusions about cross-linking processes and the curing of resins.
2.3 Raman spectroscopy
Raman spectroscopy is another non-invasive optical method, which is based on the inelastic scattering of a material. Upon the irradiation of a sample with monochromatic (laser) light, elastically scattered light and a 103–104 smaller amount of inelastically scattered light appears. Due to the inelastic interaction of photons and matter (chemical molecules), the frequency of the emitted photons is shifted. The so-called Stokes and anti-Stokes lines show this energy shift (Raman shift). The Raman spectrum is characteristic of a sample and is sensitive to crystallinity (Strobl and Hagedorn, 1978; Rull et al., 1993), density (Sato et al., 2002), and stress (Kida et al., 2016). Furthermore, the relative amount of a component or a chemical bond can be determined. Changes in spectra with advancing curing allow us to monitor the curing process of thermoset resins online (Pallikari et al., 2001; Vašková and Křesálek, 2011).
3.1 Materials
Within this work, PE-Xc samples based on high-density PE (HDPE) and UHMWPE were investigated. The PE samples were provided by Röchling Engineering Plastics SE & Co. KG, Haren, Germany, in form of plates and cross-linked with different absorbed doses using electron radiation by BGS Beta-Gamma-Service GmbH & Co. KG, Wiehl, Germany. The crystallinity formed during the production of the plates is not changed by the irradiation.
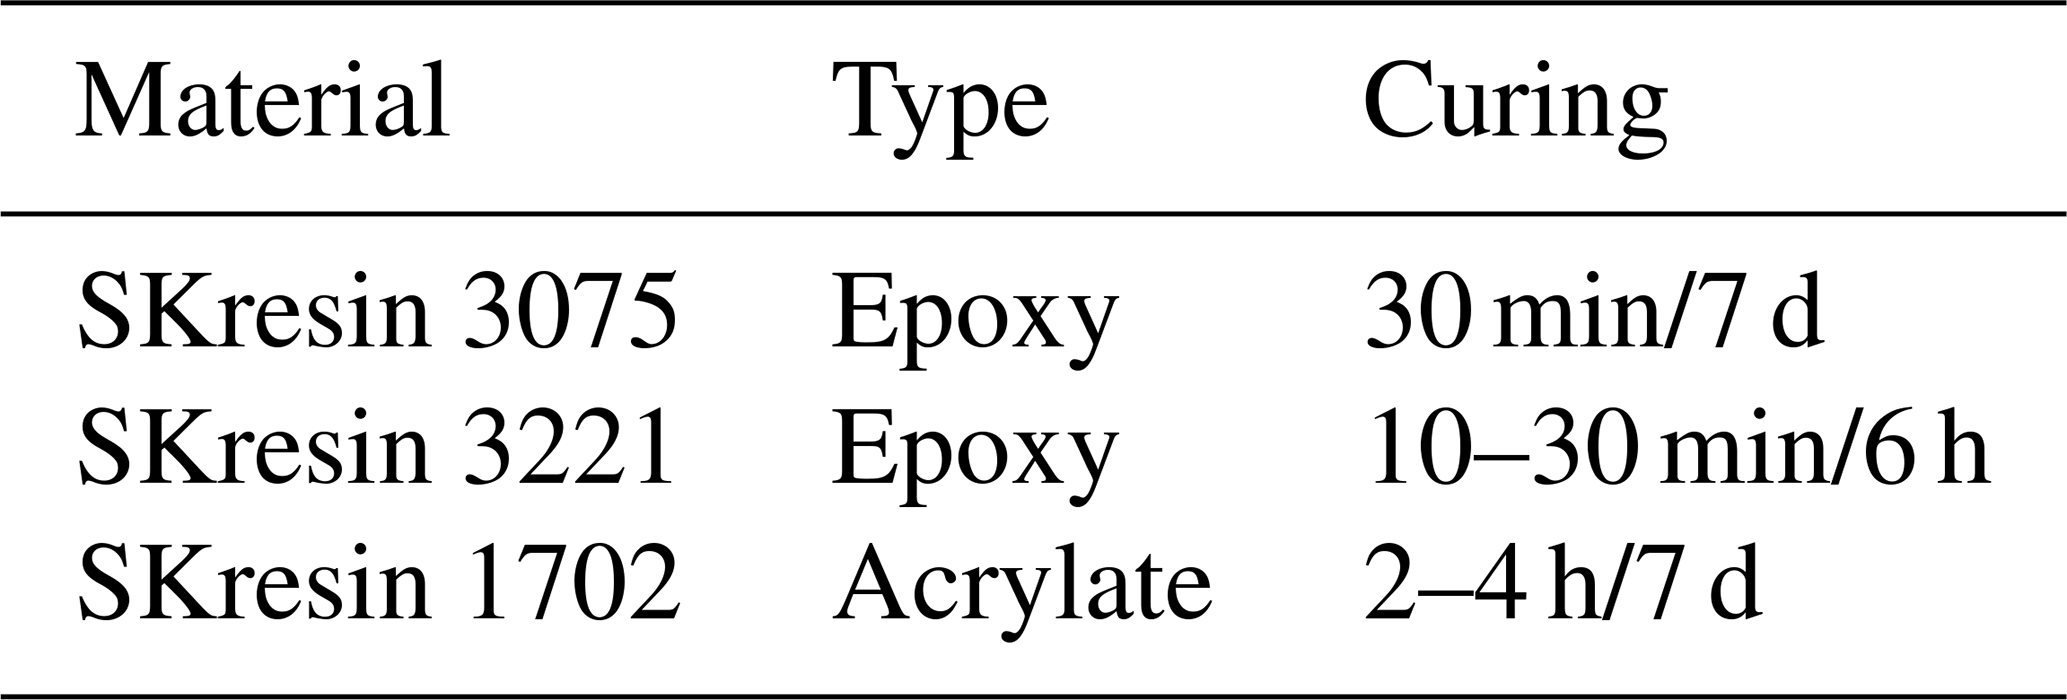
Further on, investigations of the curing behaviour of selected two-component (2C) resins have been done. In detail, two epoxy resins and an acrylate (PMMA) resin from S u. K Hock GmbH, Regen, Germany, were analysed. The components were mixed according to the recommendation given by the manufacturer and observed until they were fully cured. In order to evaluate the influence of fillers, DSC and DEA tests were also conducted by adding 5 wt. % silica powder (SILBOND® 126 EST) in each case. For the experiments with the integrating sphere, 3 wt. % of TiO2 were added to achieve a larger effective scattering coefficient. The curing times specified by the manufacturer are given in Table 1. The first value (pot life) describes the time during which the resin can still be processed. The second value (cure time) gives the time until the resin is fully cured.
Table 1Curing times (pot life/cure time) of 2C resins at room temperature.
3.2 Reference methods
For the quantification of the degree of cross-linking of the PE-Xc samples, the standardized wet chemical analysis, according to DIN EN ISO 10147 (DIN, 2012), was carried out. For this purpose, thin sections (thickness of (0.20 ± 0.02) mm; mass > 0.2 g) of the materials with previously determined weight minitial were cooked in xylene (137–144 ∘C) for 8 h and dried for at least 3 h. From the remaining mass mremaining, considering the mass of the sample cage mcage, the degree of cross-linking Dx was derived from Eq. (1):
The material for the tests was taken from three different positions of the sample plates (centre and near two different corners with 1 cm distance to the edge to avoid effects of plate sawing).
In addition, DSC experiments were conducted with a NETZSCH DSC 204 F1 Phoenix® (NETZSCH-Gerätebau GmbH, Selb, Germany) and standard sample pans. In the DSC, PE-X was observed in two heating cycles followed by cooling (two measurements, each with material of three different positions of the sample plates; sample mass of 10 mg, temperature range of 0–200 ∘C, and heating/cooling rate of 10 K min−1). The first cycle provides information about the prehistory of the material, and the second is used for material characterization under known thermal conditions. During radiation cross-linking, the initial crystallinity of the material was not changed. However, the non-meltable cross-linked amorphous regions hinder the reformation of the crystallinity during the defined cooling process after the first cycle. From the difference in crystallinity between the two cycles, it is possible to draw conclusions about the degree of cross-linking. The degree of curing DC of thermosets can be determined with one DSC heating cycle. It results from the ratio of the reaction enthalpies ΔH of the tested sample ΔHcurrent in comparison with the initially ΔHinitial mixed sample, according to Eq. (2) (DIN, 2018):
The resins (sample mass of 15 mg) were heated from −30 to 290 ∘C, with a heating rate of 20 K min−1.
Moreover, a NETZSCH DEA 288 Ionic (NETZSCH-Gerätebau GmbH), with single-use interdigitating sensors (covered with a few ml of resin), was used to monitor the curing process of the thermoset resins at room temperature. For this purpose, the ion viscosity, which is increasing with the degree of curing, was measured two times per sample at different frequencies (1, 10, and 100 Hz and 1 kHz). The DSC and DEA measurements were evaluated with NETZSCH's Proteus® software, and the graphical representation of all reference measurements was performed with OriginPro (OriginLab Corporation, Northampton, MA, USA).
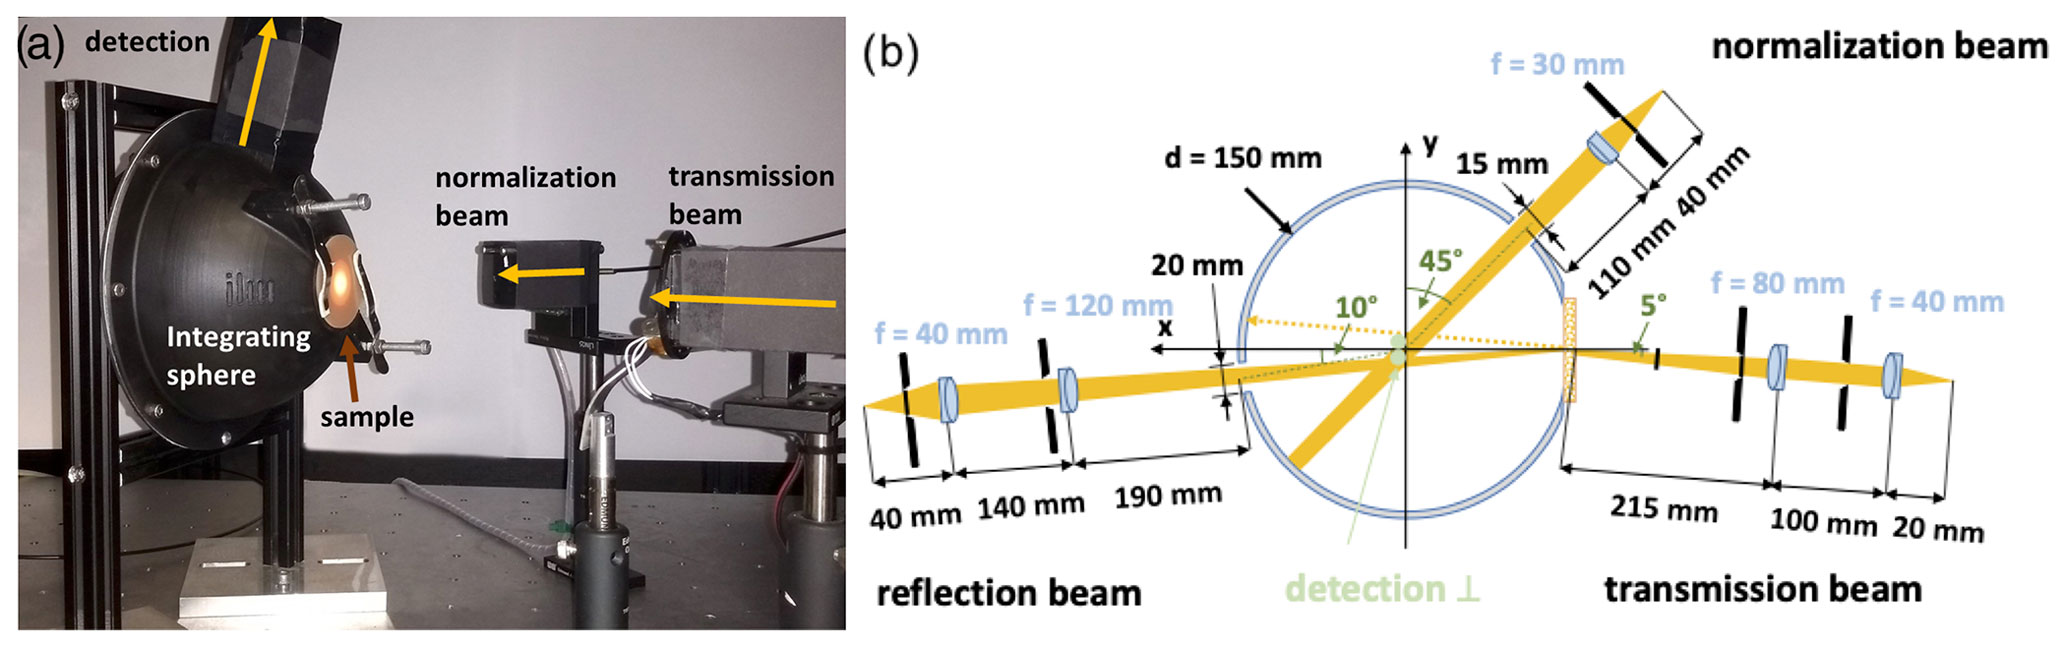
Figure 1The laboratory-integrating sphere set-up consists of an integrating sphere, a detection system, and the light source (not shown here) imaged onto the sample. In panel (a), the side view of the experimental set-up is shown, and in panel (b), the sketch of the set-up is depicted. Similar pictures can be found in the literature (Foschum et al., 2020; Bergmann et al., 2020).
3.3 Integrating sphere
The integrating sphere set-up is an often-used measurement method to determine the optical properties of media with known refractive index. The method has been well known for decades and is often described in the literature (Pickering et al., 1993; Roggan, 1993). The measurement consists of a minimum of two quantities, namely the hemispherical reflectance and the hemispherical transmittance of an illuminated sample. For integrating purposes, a highly reflective coated sphere, usually with a hemispherical reflectance between 90 % and 99 %, adjacent to an illuminated sample is used. The hemispherical reflectance and transmittance is in fact influenced by port openings for detection or illumination. For a precise evaluation, the exact angular distribution of the emitted light from the calibration standard and the sample in addition to the exact sphere geometry, including port openings and the detector field of view, have to be considered (Foschum et al., 2020; Bergmann et al., 2020). Compared to other methods of absolute optical spectroscopy, the integrating sphere is one of the most accurate measurement systems for studying optically turbid phantoms nowadays. The used integrating sphere system consists of a light source that is imaged to a sample on the sample port and a detection system including the integrating sphere itself, optical components like lenses, apertures, and fibres, and a spectrometer. A detailed description of the used set-up was published earlier (Bergmann et al., 2020). Due to the large volume of a few cubic millimetres of samples which are investigated via integrating sphere, the evaluation process is based on the transport theory (Case and Zweifel, 1963; Duderstadt and Martin, 1979). Numerical solutions of the transport equation enable the exact description of the light propagation in media with arbitrary sample geometry and measurement applications, which is necessary for a good match of the experiment and theoretical set-up. To this end, a Monte-Carlo-based software tool was developed which simulates the photons' paths through the investigated scattering media and the relevant parts of the experimental set-up. We note that these Monte Carlo simulations, which give the amount of the detected signal, are exact solutions of the radiative transport equation in the limit of an infinitely large number of simulated photons. For the acceleration of the evaluation process, lookup tables are expedient for inverting solutions of the light-propagation model. The conducted measurements have been performed with the laboratory-integrating sphere set-up made by Institut für Lasertechnologien in der Medizin und Meßtechnik an der Universität Ulm (ILM; see Fig. 1). For this process, one complete measurement was usually performed in a time span of around 2 min. By now, a professional measurement system based on the used laboratory set-up is commercially available from Gigahertz Optik GmbH, Türkenfeld, Germany (SphereSpectro 150H, spectral range from 240 to 2150 nm; Gigahertz-Optik, 2022).
3.4 Raman spectroscopy
Raman spectra were recorded with a WITec alpha300 confocal Raman microscope (WITec Wissenschaftliche Instrumente und Technologie GmbH, Ulm, Germany), equipped with a frequency-doubled Nd:YAG laser (532 nm). The laser power was adjusted to 24 mW, which is a good compromise to obtain spectra of high quality without damaging the sample. A Nikon 20x LWD (long working distance) allowed a lateral resolution of < 1 µm and an axial resolution of about 4 µm. Raman spectra between −131 and 3750 cm−1 were recorded with the WITec UHTS 300 spectrometer, and the spectral resolution was 4 cm−1. Depending on the investigation and the homogeneity of the sample, either single spectra at one position were recorded or a defined area with 150 µm edge length was scanned and one spectrum was collected at every single pixel. Data were analysed with the WITec Project software. Where necessary, a baseline correction was performed. For measurements in scan mode, the average spectrum over the collected 22 500 spectra was calculated. Further analysis was conducted in SigmaPlot (Inpixon GmbH, Berlin, Germany). To allow comparison, spectra were normalized using Raman modes which are not sensitive to changes in structure or reaction time.
4.1 PE-Xc
4.1.1 Wet chemical analysis
Figure 2 shows the degrees of cross-linking (mean value and standard deviation of three different measurement positions) of the (UHMW)PE-Xc sheets determined by wet chemical analysis as a function of the absorbed dose introduced during radiation cross-linking. For the HDPE materials, there is a clear correlation between the two parameters. The homogeneity of the radiation cross-linking of the PE-Xc samples is considered to be good, since the standard deviation of the degree of cross-linking for the measurements are typically less than 3 %. The results of the UHMWPE samples indicate that the wet chemical analysis is no longer suitable for UHMWPE-Xc. Here, a high degree of cross-linking even without or low absorbed doses is suggested, although cross-linking should occur in the same way as for HDPE. The reason is the very large molecular mass of the material. The solvent cannot completely dissolve the long molecular chains, and the undissolved and not cross-linked residue is incorrectly interpreted as being cross-linked during evaluation. In the following, the absorbed doses are used as a reference value.
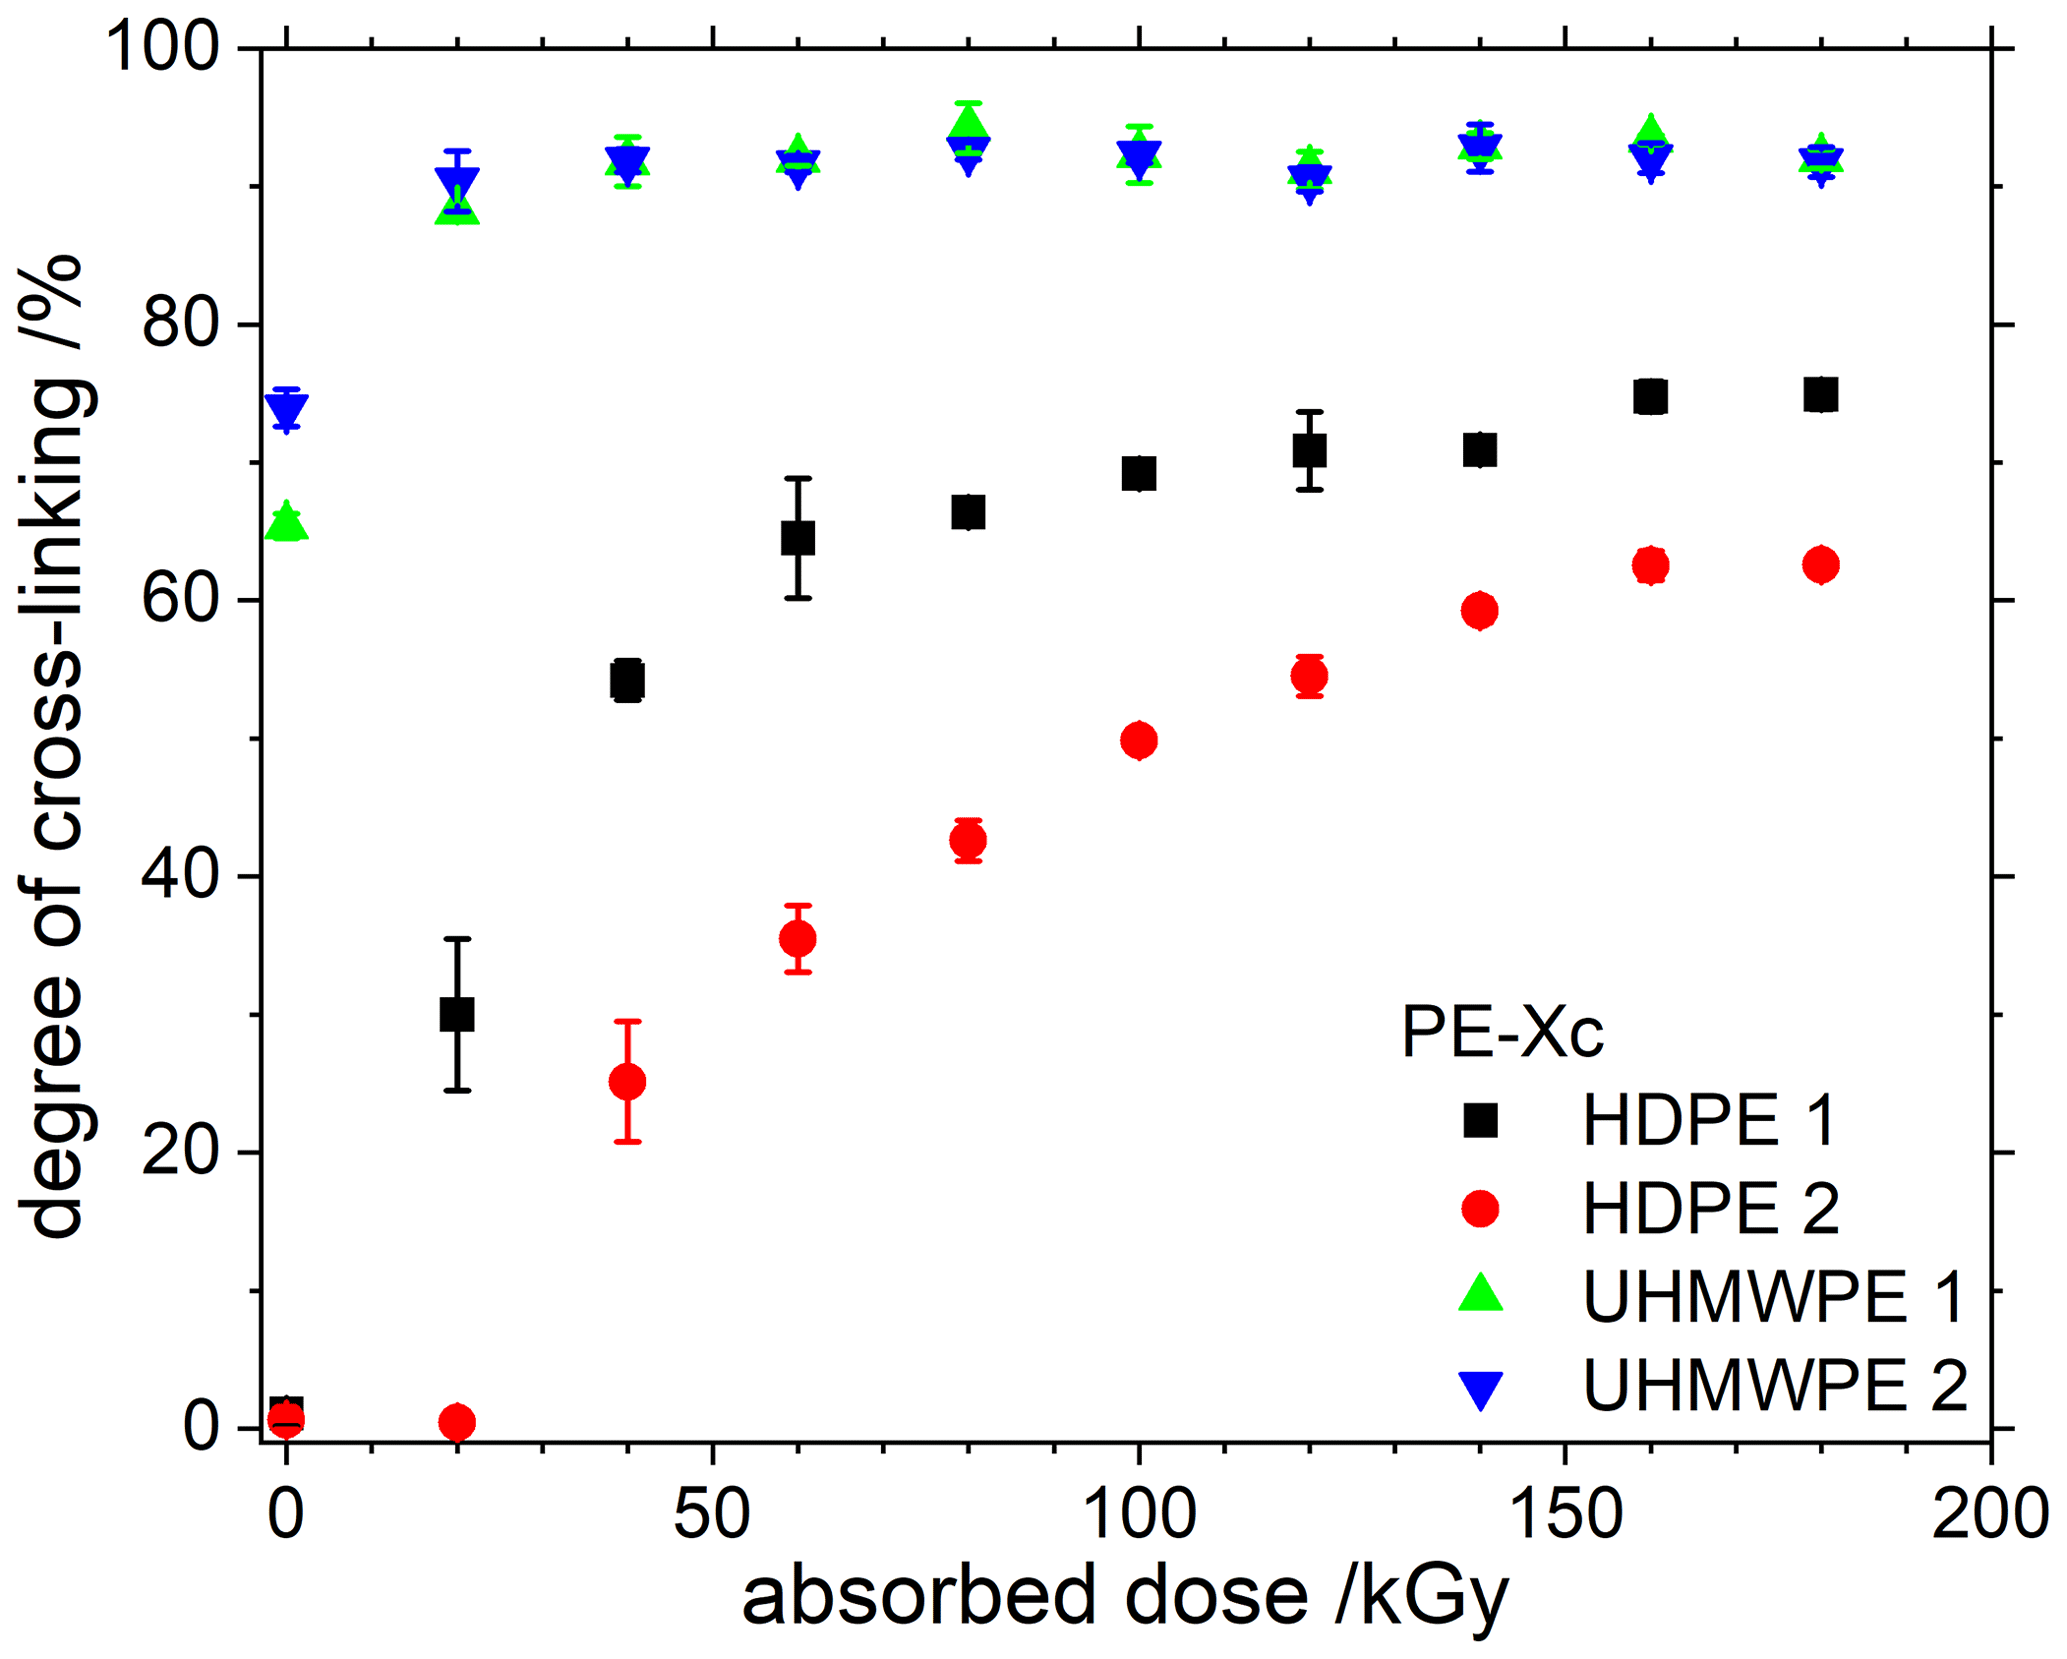
Figure 2Degrees of cross-linking of different (UHMW)PE-Xc samples of two different HDPE and UHMWPE grades (1, 2), as determined by wet chemical analysis. The values of the UHMWPE samples for low absorbed doses are falsely overestimated by the measurement method.
4.1.2 Dynamic scanning calorimetry
During radiation cross-linking, the crystallinity of the (UHMW)PE is not changed. Only when the sample is melted and cooled again is the renewed formation of the crystallinity hindered. For the analysis of the cross-linking of (UHMW)PE-Xc, it is necessary to consider the difference in the crystallinity of both heating cycles. This is shown in Fig. 3 (mean value and standard deviation of three measurements at different positions) for the investigated (UHMW)PE-Xc samples. Due to the large error bars, it is difficult to distinguish between states with different cross-linking. However, when considering the mean values, the expected decrease in crystallinity with increasing absorbed dose (and thus higher degree of cross-linking) is visible from the increasing amount of the difference in the crystallinity. This emphasizes that, in addition to the high effort of sample preparation, DSC also entails a large inaccuracy in the estimation of the degree of cross-linking. The DSC results demonstrate the problem of wet chemical analysis for UHMWPE, since here the expected trend of increasing degree of cross-linking with increasing absorbed dose can be seen.
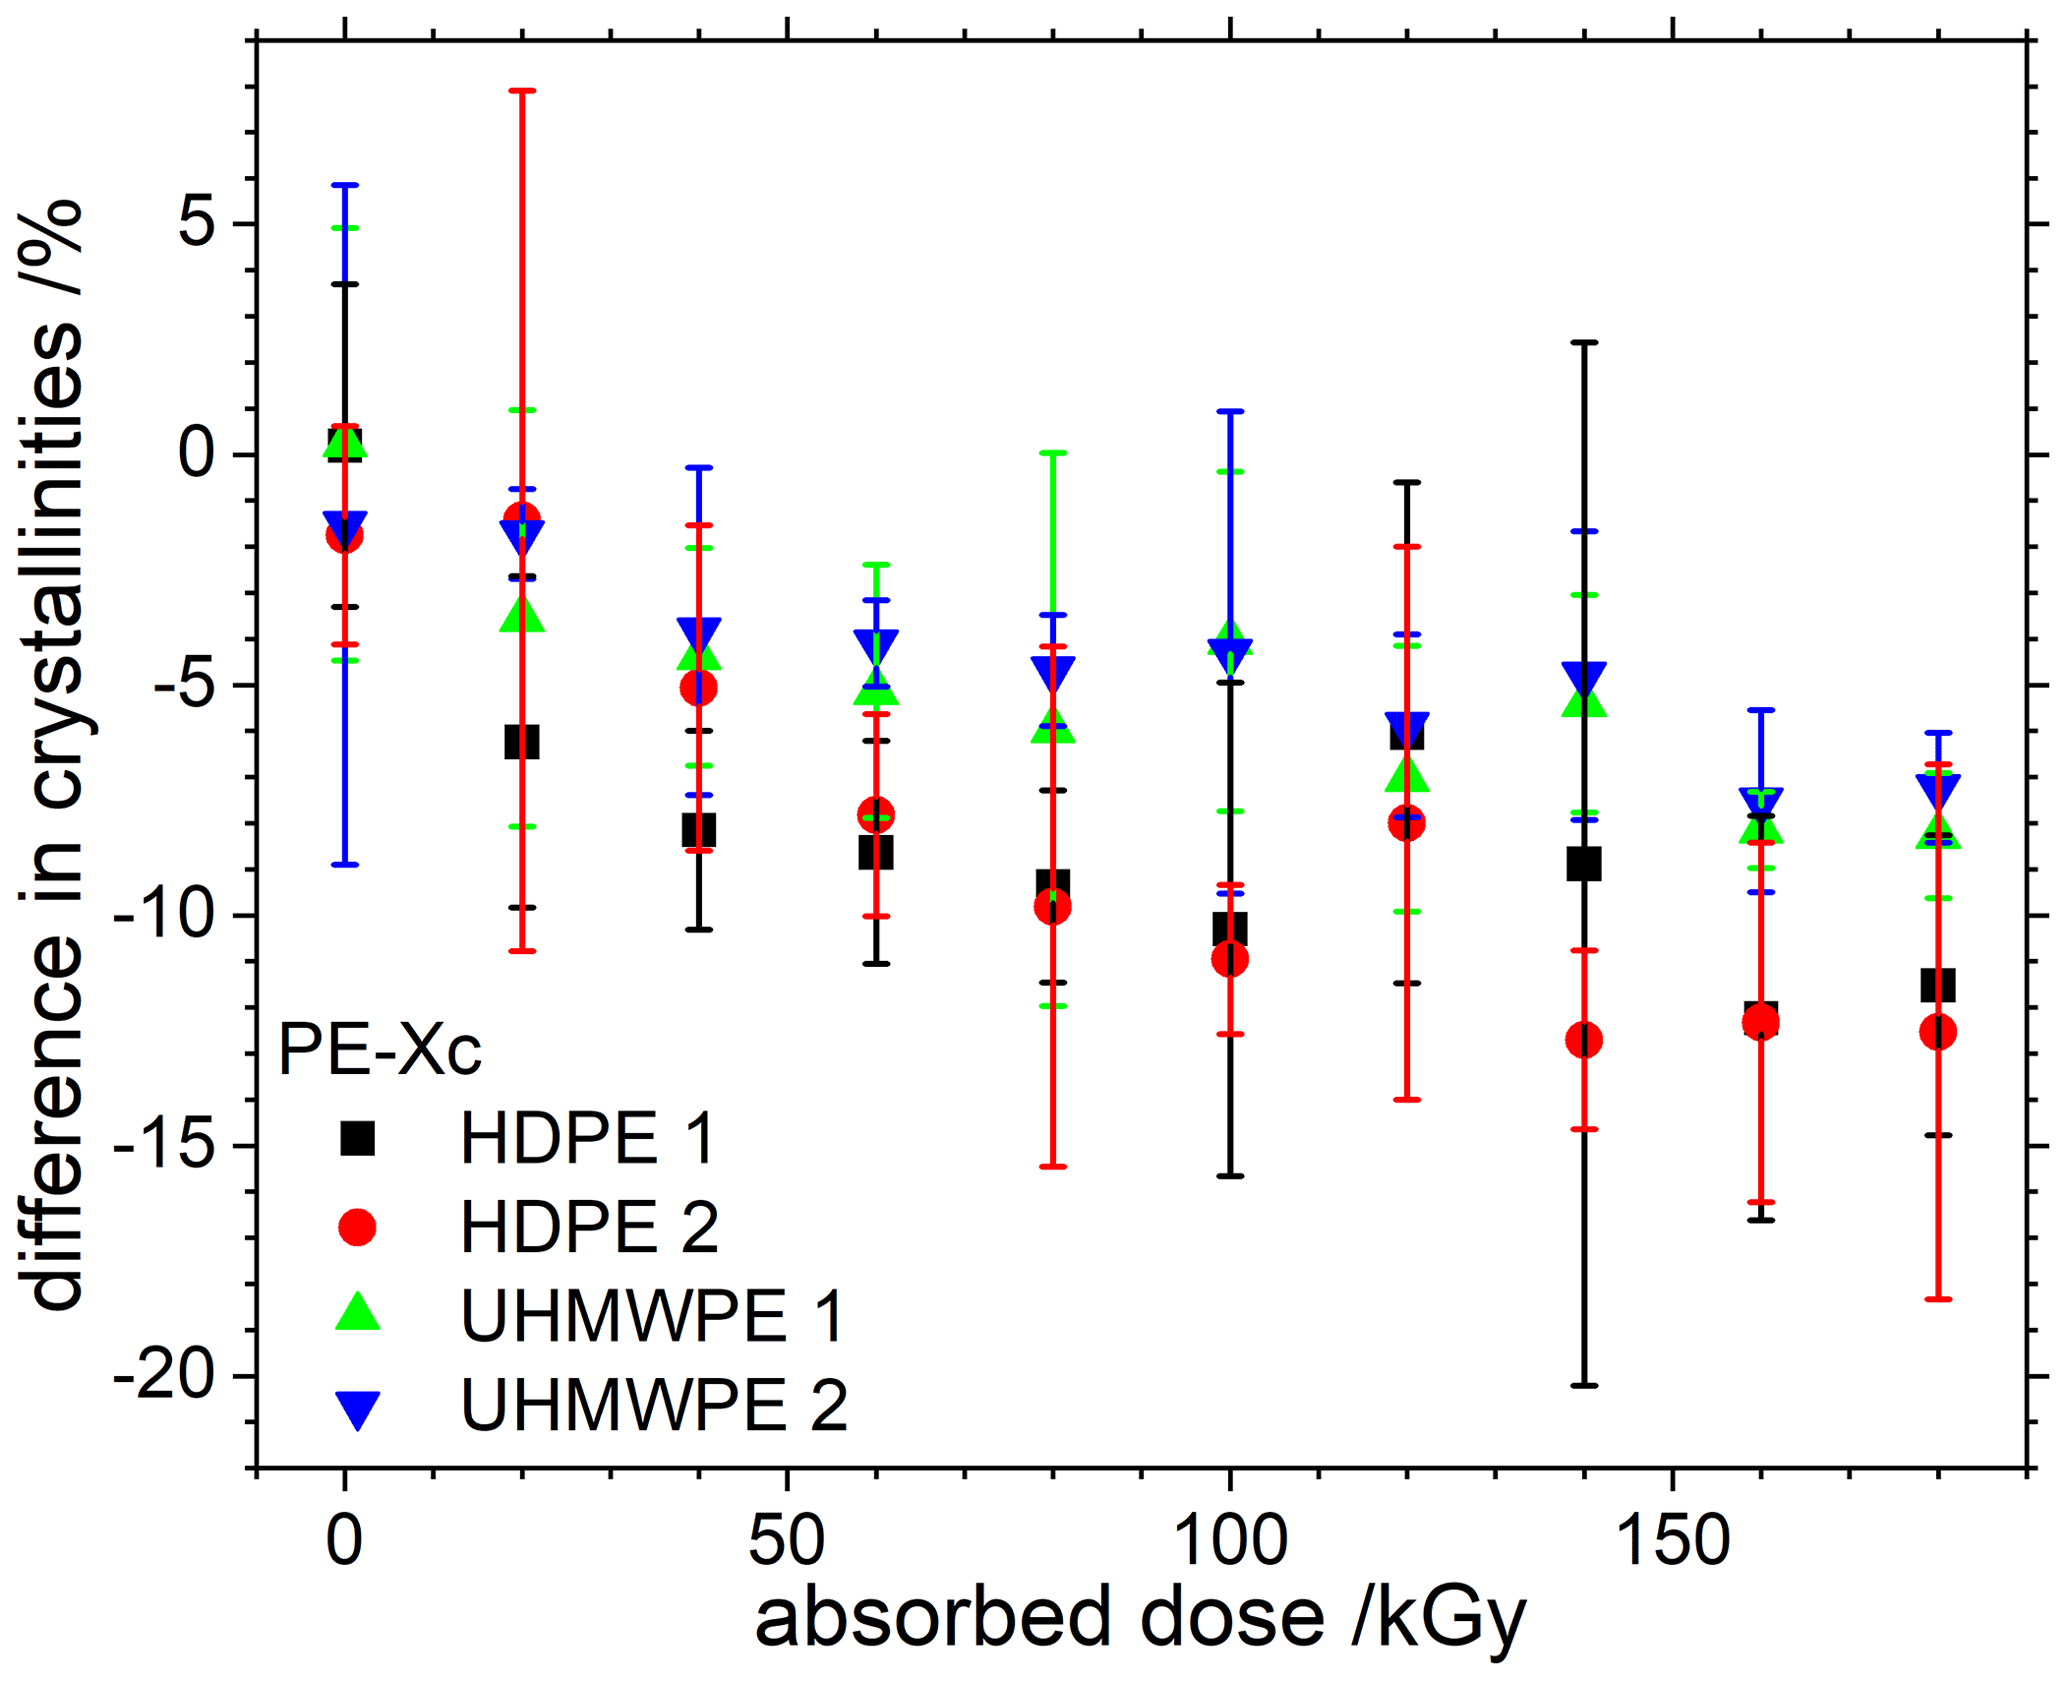
Figure 3Differences in the crystallinity of the PE-Xc samples of two different HDPE and UHMWPE grades each, as determined in two DSC cycles.
4.1.3 Integrating sphere
The investigation of PE-Xc samples (one sample was measured three times at different sample positions) cross-linked by electron beam radiation with the integrating sphere shows a systematic change in the absorption coefficient μa in the VIS spectral range below 900 nm (see Fig. 4). A higher dose of the electron beam radiation results in a larger absorption coefficient in the VIS range. This effect is called yellowing in the literature, due to its increasing yellow colour, which originates from allyl or alkyl radicals which were formed by chain scission reactions with increasing electron beam radiation (Martínez-Morlanes et al., 2012). Kömmling et al. (2017) assumed that this effect occurs in form of free radicals that are trapped in the crystalline regions (crystal defects and annealable colour centres) of the polymer. The absolute change at around (515 ± 5) nm is depicted in Fig. 5. For the HDPE and long-chain polymers, such as UHMWPE samples, a linear dependence on the relative change in the absorption coefficient to the absorbed dose can be found. The fitted coefficients are listed in the caption of Fig. 5. The absorption coefficient in the NIR (above 900 nm) and the effective scattering coefficient (not shown) remain unchanged for a variation in the absorbed dose. The determination of the degree of cross-linking is only possible indirectly for well-characterized materials, for which the dependence of the change in μa over the degree of cross-linking is known (see Fig. 6).
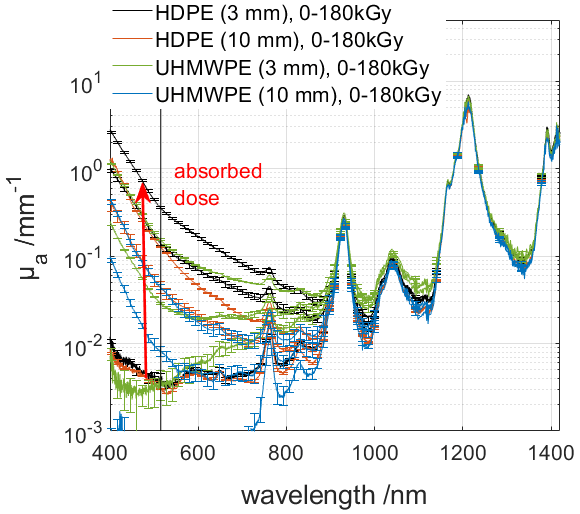
Figure 4The absorption coefficient μa (semilogarithmic scale) of HDPE and UHMWPE samples with different thicknesses and absorbed doses. There is no colour differentiation in the graphic between the shown absorbed doses of 0, 60, and 180 kGy, but it can be seen for the different sample thicknesses of 3 and 10 mm.
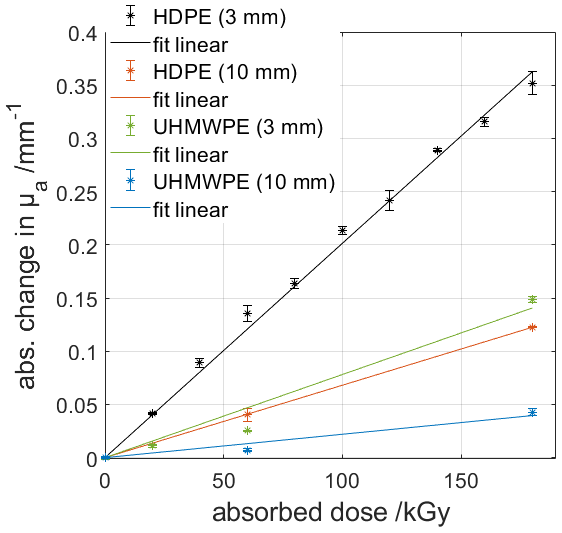
Figure 5Absolute change in the absorption coefficient at around (515 ± 5) nm over the absorbed dose of HDPE and UHMWPE samples with different thicknesses. A linearity for HDPE was found using with y = absolute change in µa and x = absorbed dose. We obtained the following fit parameters for HDPE (3 mm) of m = (2014.0 ± 50.2) 10−6 kGy, HDPE (10 mm) of m = (680.5 ± 3.9) 10−6 kGy, UHMWPE (3 mm) of m = (781.3 ± 119.6) 10−6 kGy, and UHMWPE (10 mm) of m = (219.7 ± 52.8) 10−6 kGy.
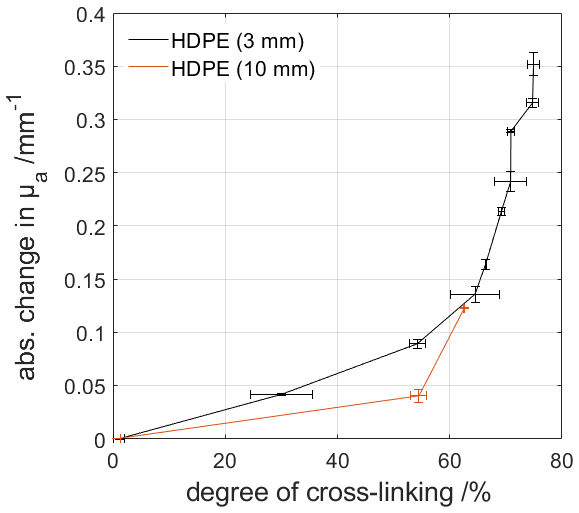
Figure 6Absolute change in the absorption coefficient at around 515 nm over the degree of cross-linking measured by wet chemical analysis. The knowledge of the behaviour of μa over the degree of cross-linking of an examined material enables in principal the direct determination of the degree of cross-linking.
4.1.4 Raman spectroscopy
The investigation of selected HDPE and UHMWPE samples with Raman spectroscopy was done in scan mode, in order to obtain information from all different regions of the sample. Raman spectra were normalized using the integrated intensity of the CH2 twisting mode between 1250 and 1350 (relative wavenumber) as an internal standard (Strobl and Hagedorn, 1978). In order to emphasize differences, ratios of selected Raman bands were calculated. The ratio of the CH2 bending band at 1424 , which is an indicator for orthorhombic-crystalline structure, to 1445 , typical of amorphous trans-conformation (Kida et al., 2016), increases with absorbed dose in both HDPE and UHMWPE samples (see Fig. 7a). In the C−H stretching region, an increase in the ratio of 2850 (CH2) to 2928 (CH3) correlates with the absorbed dose (see Fig. 7b). Since CH3 groups are present in side chains, this change could be interpreted as a clue to cross-linking. While differences in Raman spectra of low-density PE (LDPE), linear low-density PE (LLDPE), and HDPE are described in detail in the literature, the investigation of UHMWPE with Raman spectroscopy is not yet well established. The method seems promising. Nevertheless, all these results still need to be fully interpreted. For validation, a large number of samples should be investigated. For a deeper understanding of the results, and to decide whether other bands should be considered, a theoretical evaluation might be necessary.
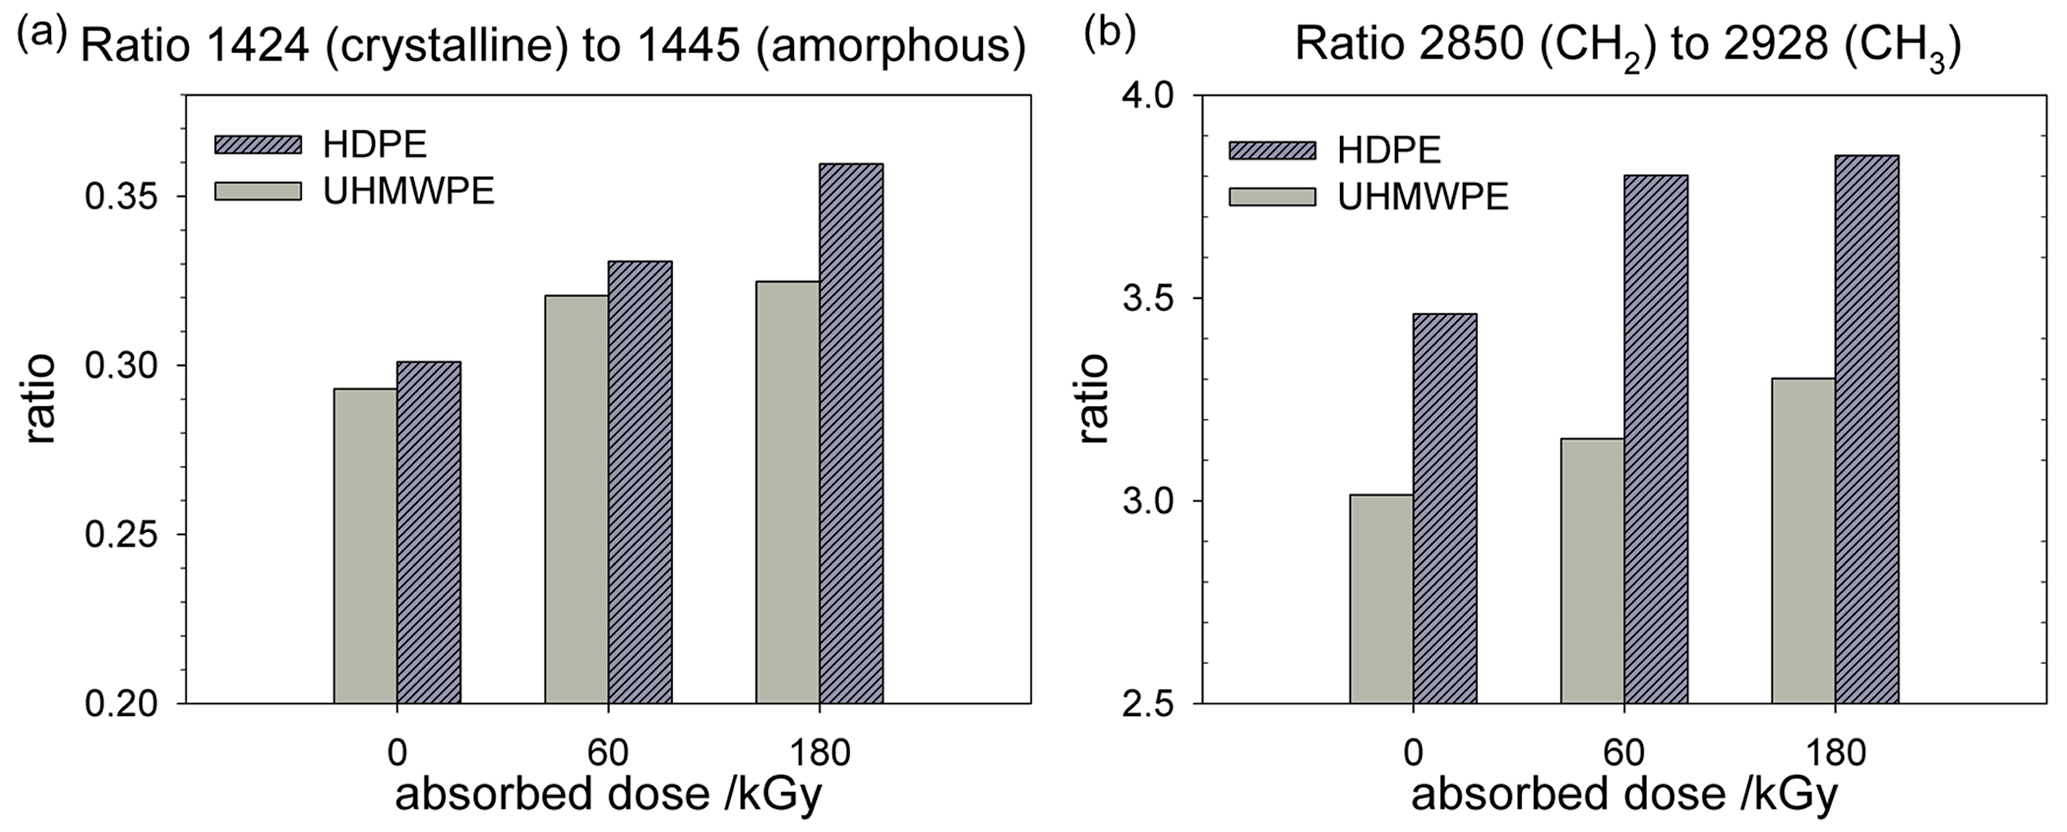
Figure 7Relative intensity of selected Raman modes in PE-Xc samples. (a) Differences in the ratios of the band at 1424 to 1445 and (b) at 2850 to 2928 are observed for both HDPE and UHMWPE.
4.2 Thermoset resins
4.2.1 Dynamic scanning calorimetry
The curing of the thermosets can be determined directly from the DSC signals at different curing times. Figure 8 shows the degree of curing (mean value and standard deviation of three measurements) of the epoxy resins SKresin 3075 and 3221 calculated from the measured areas of the exothermic reaction enthalpy, according to Eq. (2). The use of the filler shows no or only minor differences compared to the unfilled resin sample, i.e. the curing is not hindered by this filler. The different kinetics of the two resins are clearly visible in DSC measurements. However, the DSC signals of the acrylic resin SKresin 1702 could not be evaluated. In the DSC curves (not shown here), sharp (endothermic) peaks were obtained in all measurements in which a broad exothermic peak was expected. The reason for this was probably gas formation during the reaction and the resulting (partial) detachment of the sample from the crucible bottom. This massively affected the measurement. DSC is suited as an accompanying test during material development and for damage analysis in order to detect incompletely cured thermosets. However, the high cost of conducting numerous destructive tests explains why the method is not used in industrial environments to accompany production.
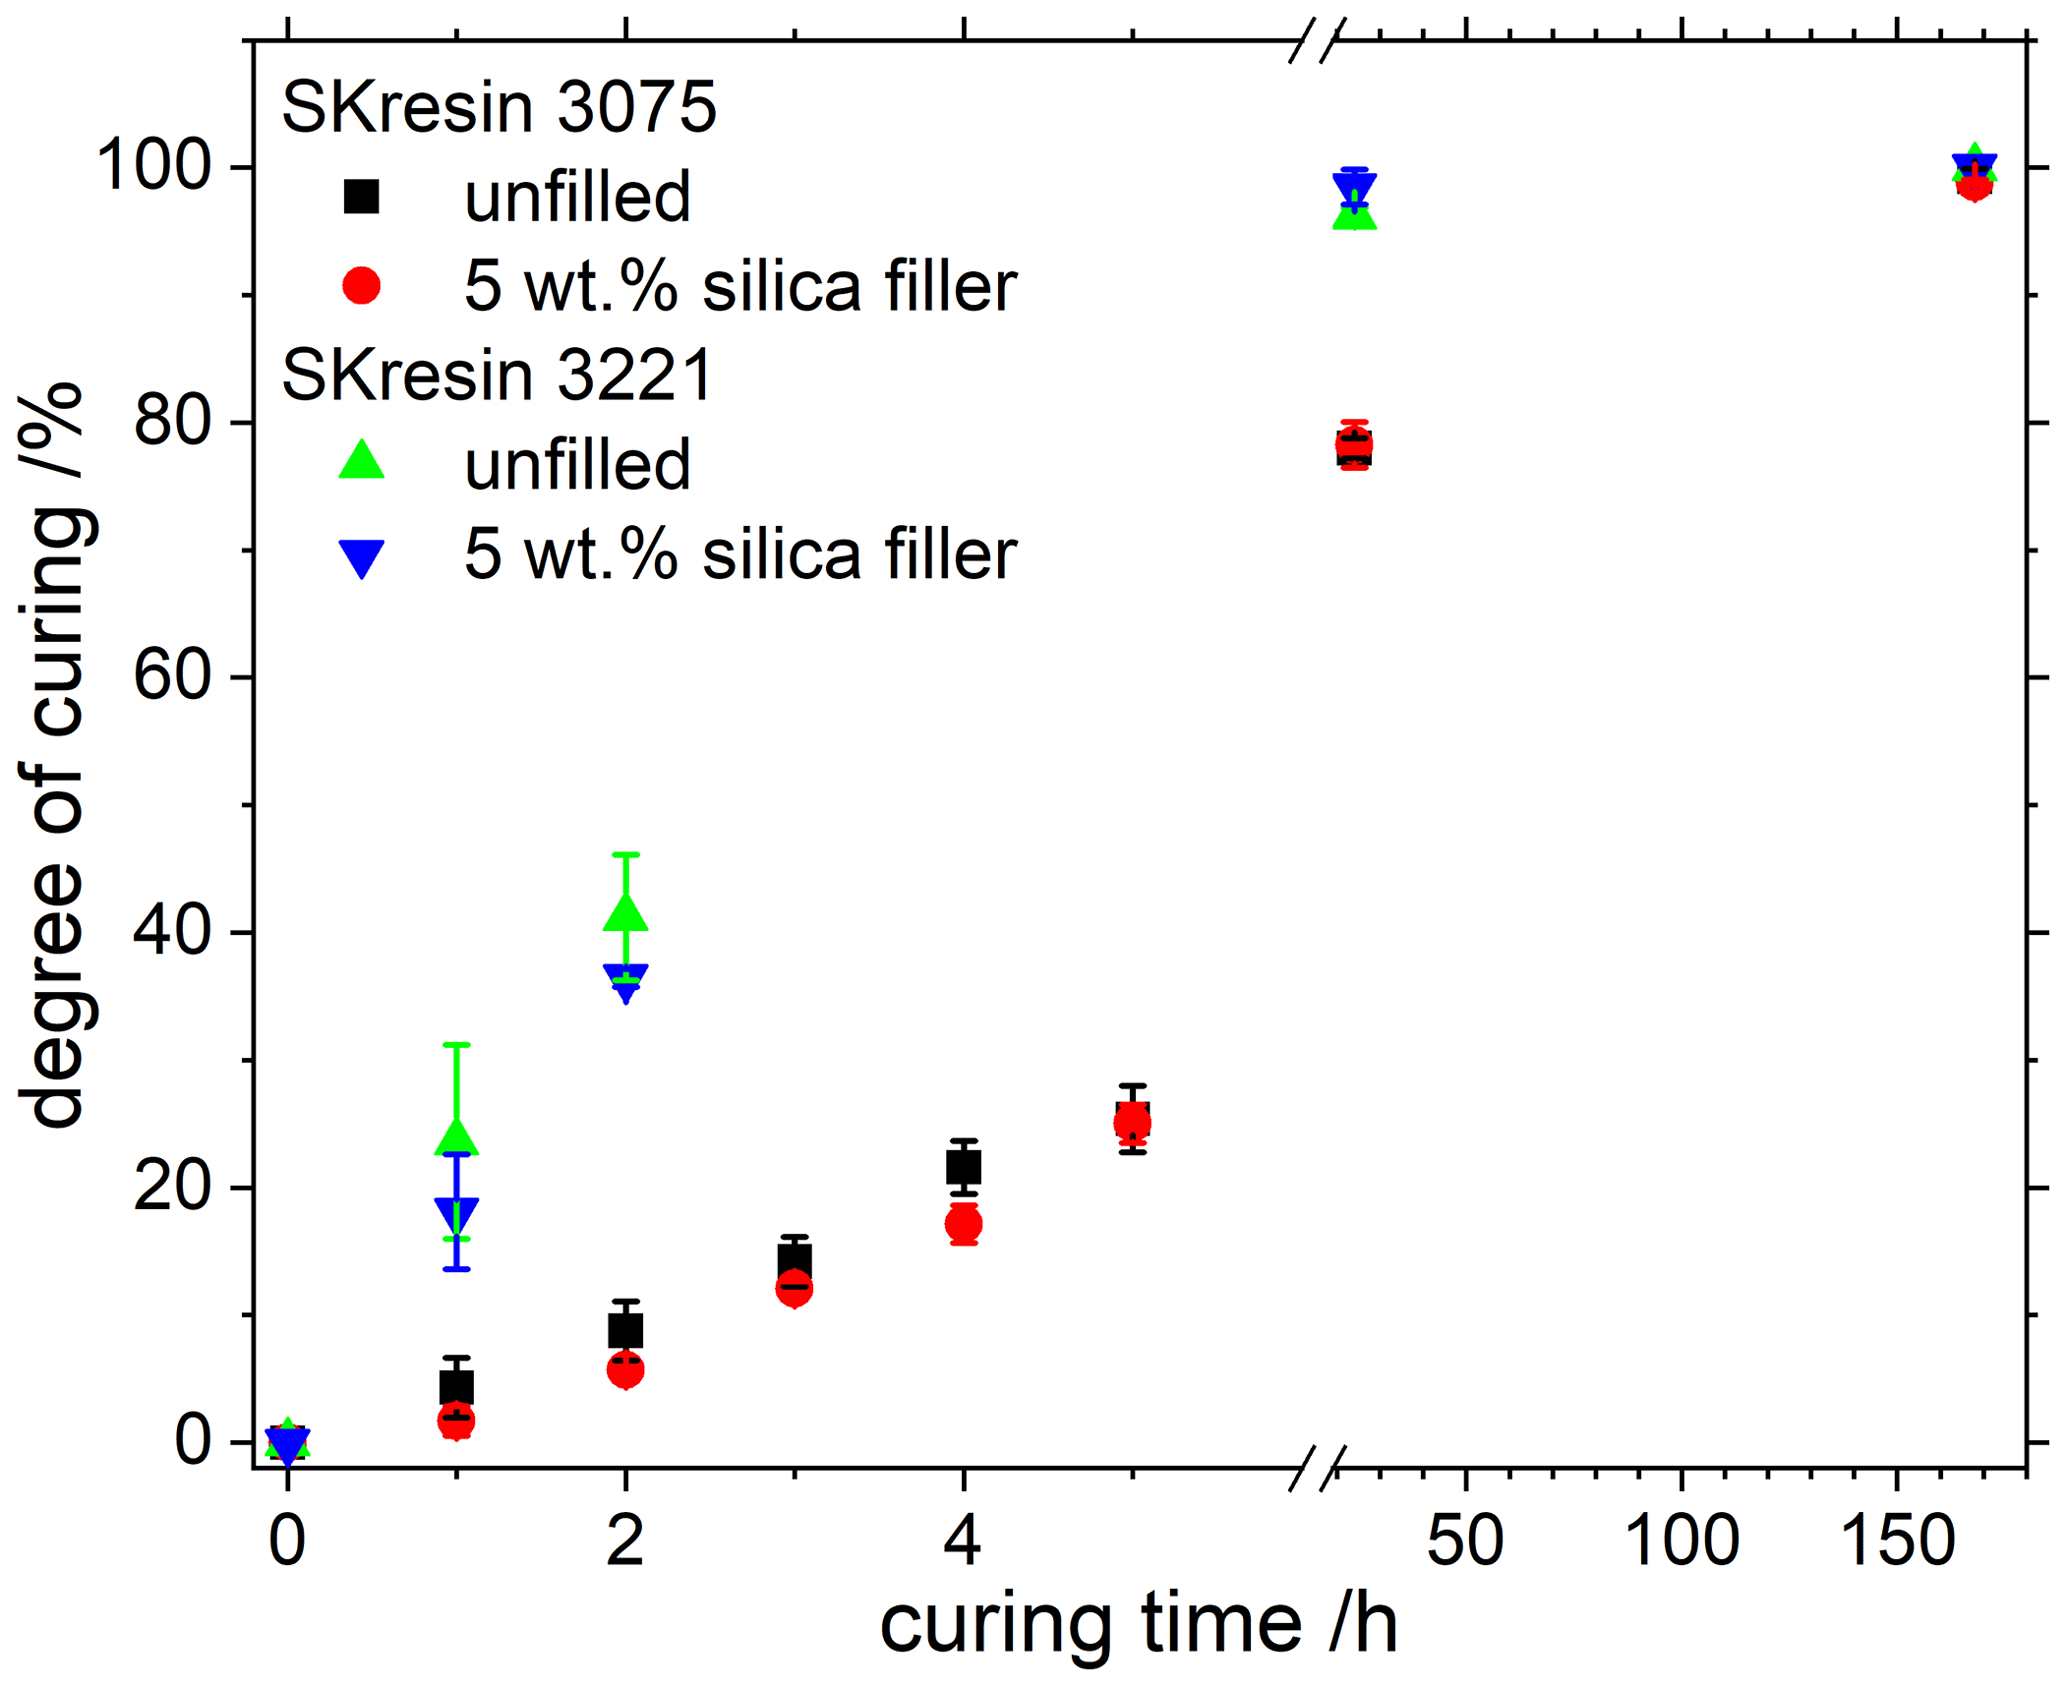
Figure 8Curing calculated from the DSC peak areas of the epoxy resins investigated with and without filler.
4.2.2 Dielectric analysis
The ion viscosities recorded during the curing of the 2C thermosets with DEA, unfilled and filled in each case, are shown in Fig. 9 for each of the two measurements. The different reaction kinetics of the respective resins can be clearly seen. Except for SKresin 3221, the DEA indicate differences in the curing process with adding silica fillers, which can be wrongly interpreted. Since the DEA is based on the conductivity of the material, incorporated, non-conductive materials can have an interfering effect, depending on their dispersion. The formation of bubbles during the curing reaction of the SKresin 1702, which prevented an evaluation of the DSC measurements, was clearly visible here and led in some cases to very strong fluctuations in the measurement. The reason for these measurement deviations was the fact that not the entire surface of the sensor was covered with material over the complete measurement time. Apart from this, the DEA provides results that can be reproduced well. The ion viscosity curves strongly resemble those of the rheological viscosity. However, DEA can still resolve differences in the areas of high curing, which are no longer measurable in rheometers due to mechanical limitations. In the literature (NETZSCH Gerätebau, 2018), DEA has become established in the field of thermosets for process monitoring. Suitable multi-way sensors are available for certain use cases. However, temperature and pressure-intensive applications such as thermoset injection moulding remain a challenge.
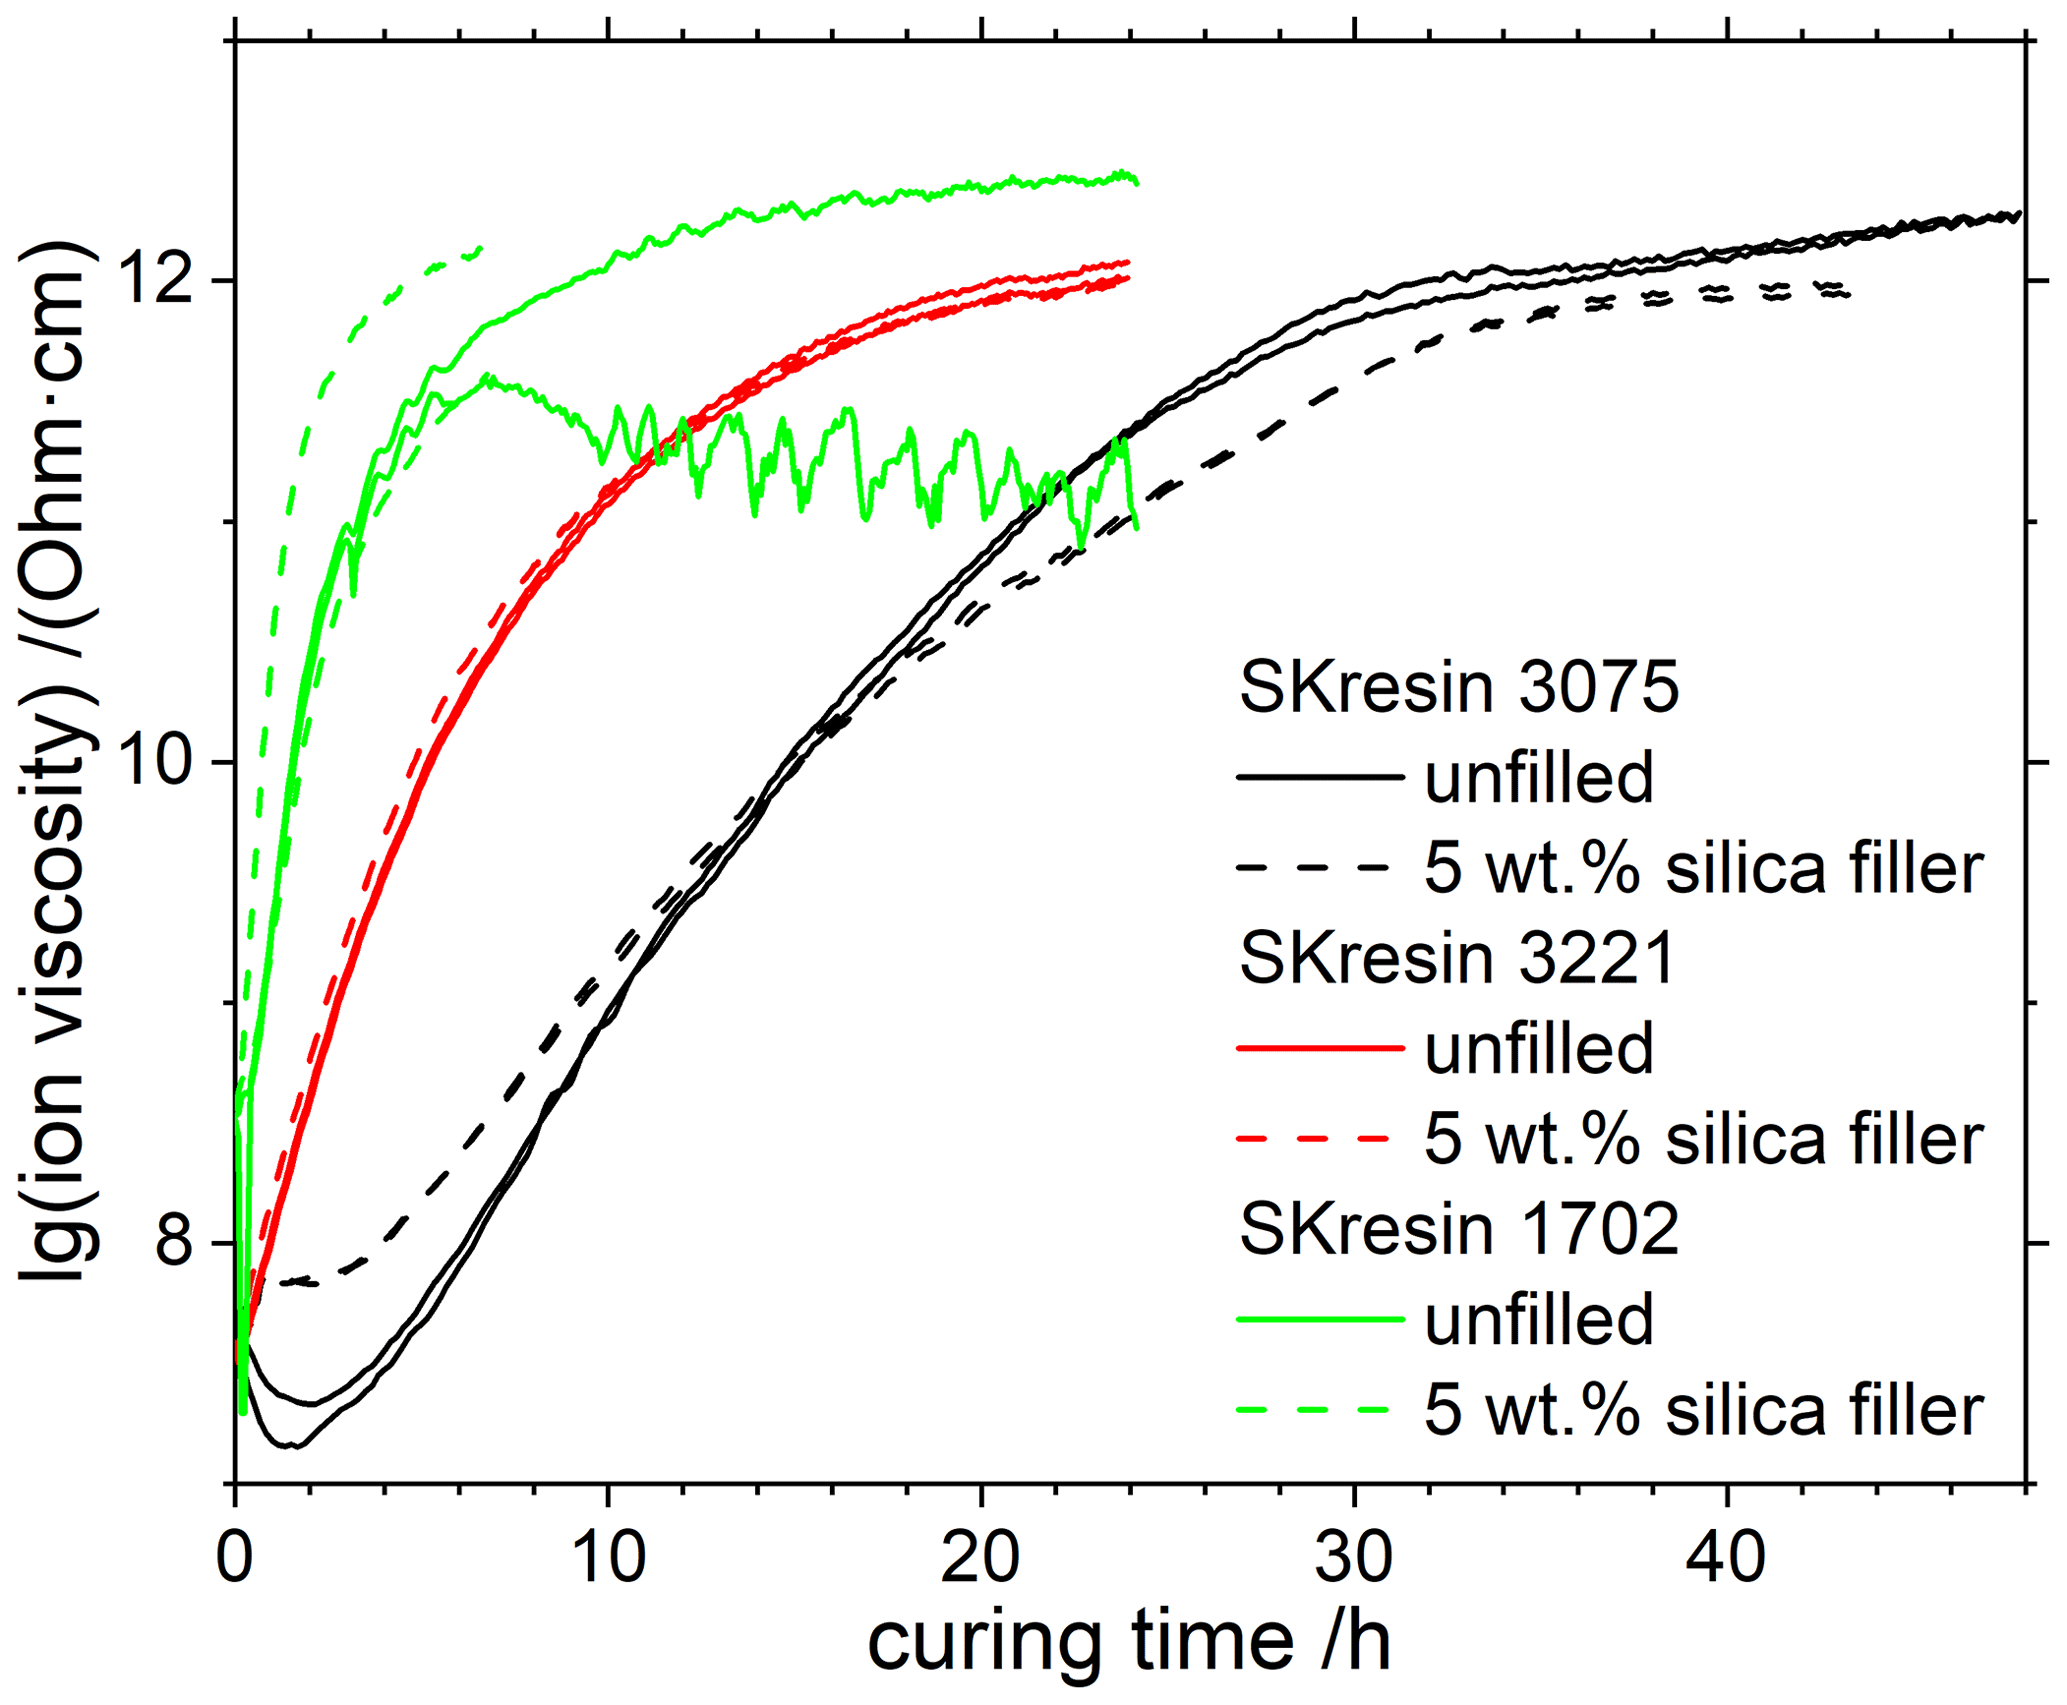
Figure 9Ion viscosities measured with DEA during curing of the unfilled or 5 wt. % silica-filled 2C resins.
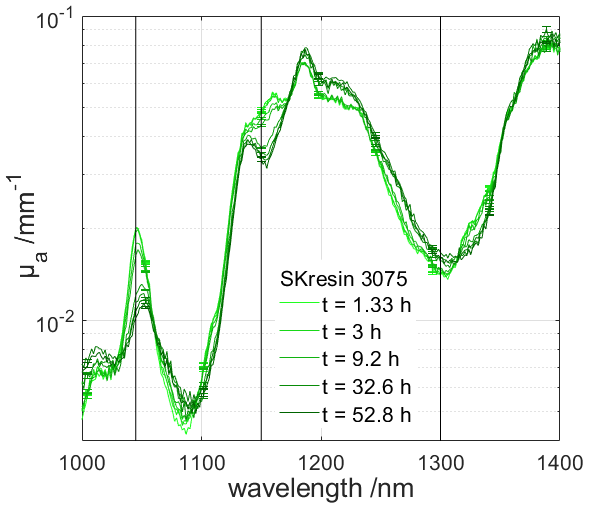
Figure 10The spectrally resolved absorption coefficient μa of the epoxy resin SKresin 3075 samples with additional 3 wt. % of TiO2 for a time span of around 80 h (here shown until 53 h).
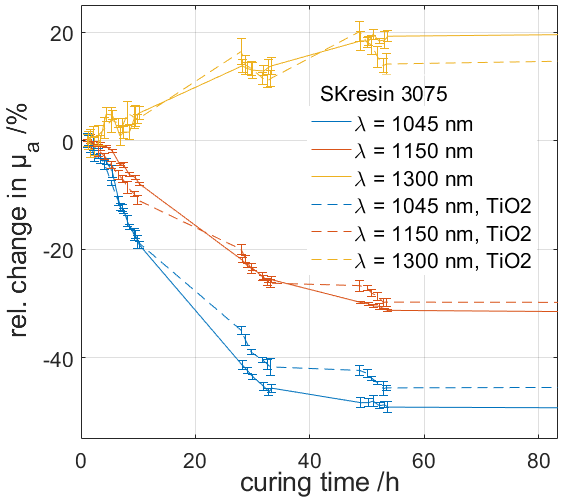
Figure 11Relative change in the absorption coefficient of selected wavelength bands of ± 5 nm over time. The change is more significant within the first 30 h after mixing than for the time after 30 h until the curing was completed. Similar behaviour was found for transparent and for highly scattering resin samples, showing an independency of TiO2 fillers up to 3 wt. %.
4.2.3 Integrating sphere
The resin samples were studied during their curing process (two measurements at each curing time step) using the integrating sphere. The investigation is described hereafter and shown in Fig. 10 for the epoxy resin SKresin 3075 without and with TiO2 fillers. The refractive index for the cured samples was measured using the spectroscopic ellipsometer SENresearch 4.0 from SENTECH Instruments GmbH, Berlin, Germany. At the beginning, the hardener and resin were mixed, resulting in a transparent medium. The transparent sample was filled into a cuvette with known glass slides. Changes in the volume were taken into account during the curing process. For this process, the sample spacer between the glass slides was modified with a funnel-shaped opening on the upper side. For the evaluation of the transparent samples, Fresnel equations were used. The change in μa is clearly noticeable and can be seen in Fig. 10. A spectral band width of ± 5 nm was used in the NIR spectral range for further investigations. Changes up to 40 % were found. Some of the spectral bands increase or decrease due to the change in various chemical bonds (see Fig. 11). The chemical bonds are very difficult to allocate. The variation found in the change in μa almost saturates after the curing, at around 30 h, was completed. The analysis was repeated with highly scattering resin samples, adding 3 wt. % of TiO2 instead of silica powder. For the evaluation of the highly scattering samples, a numerical solution of the radiative transport equation was used to separate the absorption and effective scattering coefficients. Additionally, investigations on the epoxy resin SKresin 3221 and on the acrylic resin SKresin 1702 have been done. In Fig. 12, the change in μa is shown. For this result, no influence of the added filler on the curing process was found. In accordance with the DEA measurements (Fig. 9), the related behaviour of the change in μa over the curing time for the different resins was found. Therefore, the integrating sphere set-up is suitable for monitoring changes from curing in resin.
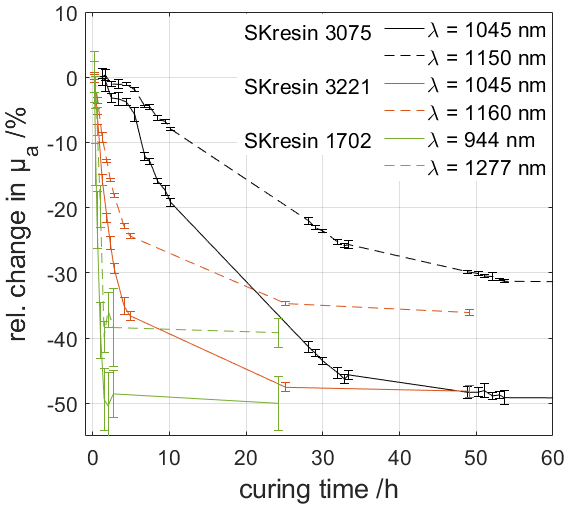
Figure 12Relative change in the absorption coefficient of selected wavelength bands of ± 5 nm over time. Epoxy resins SKresin 3075 and 3221 and an acrylic resin SKresin 1702 were investigated.
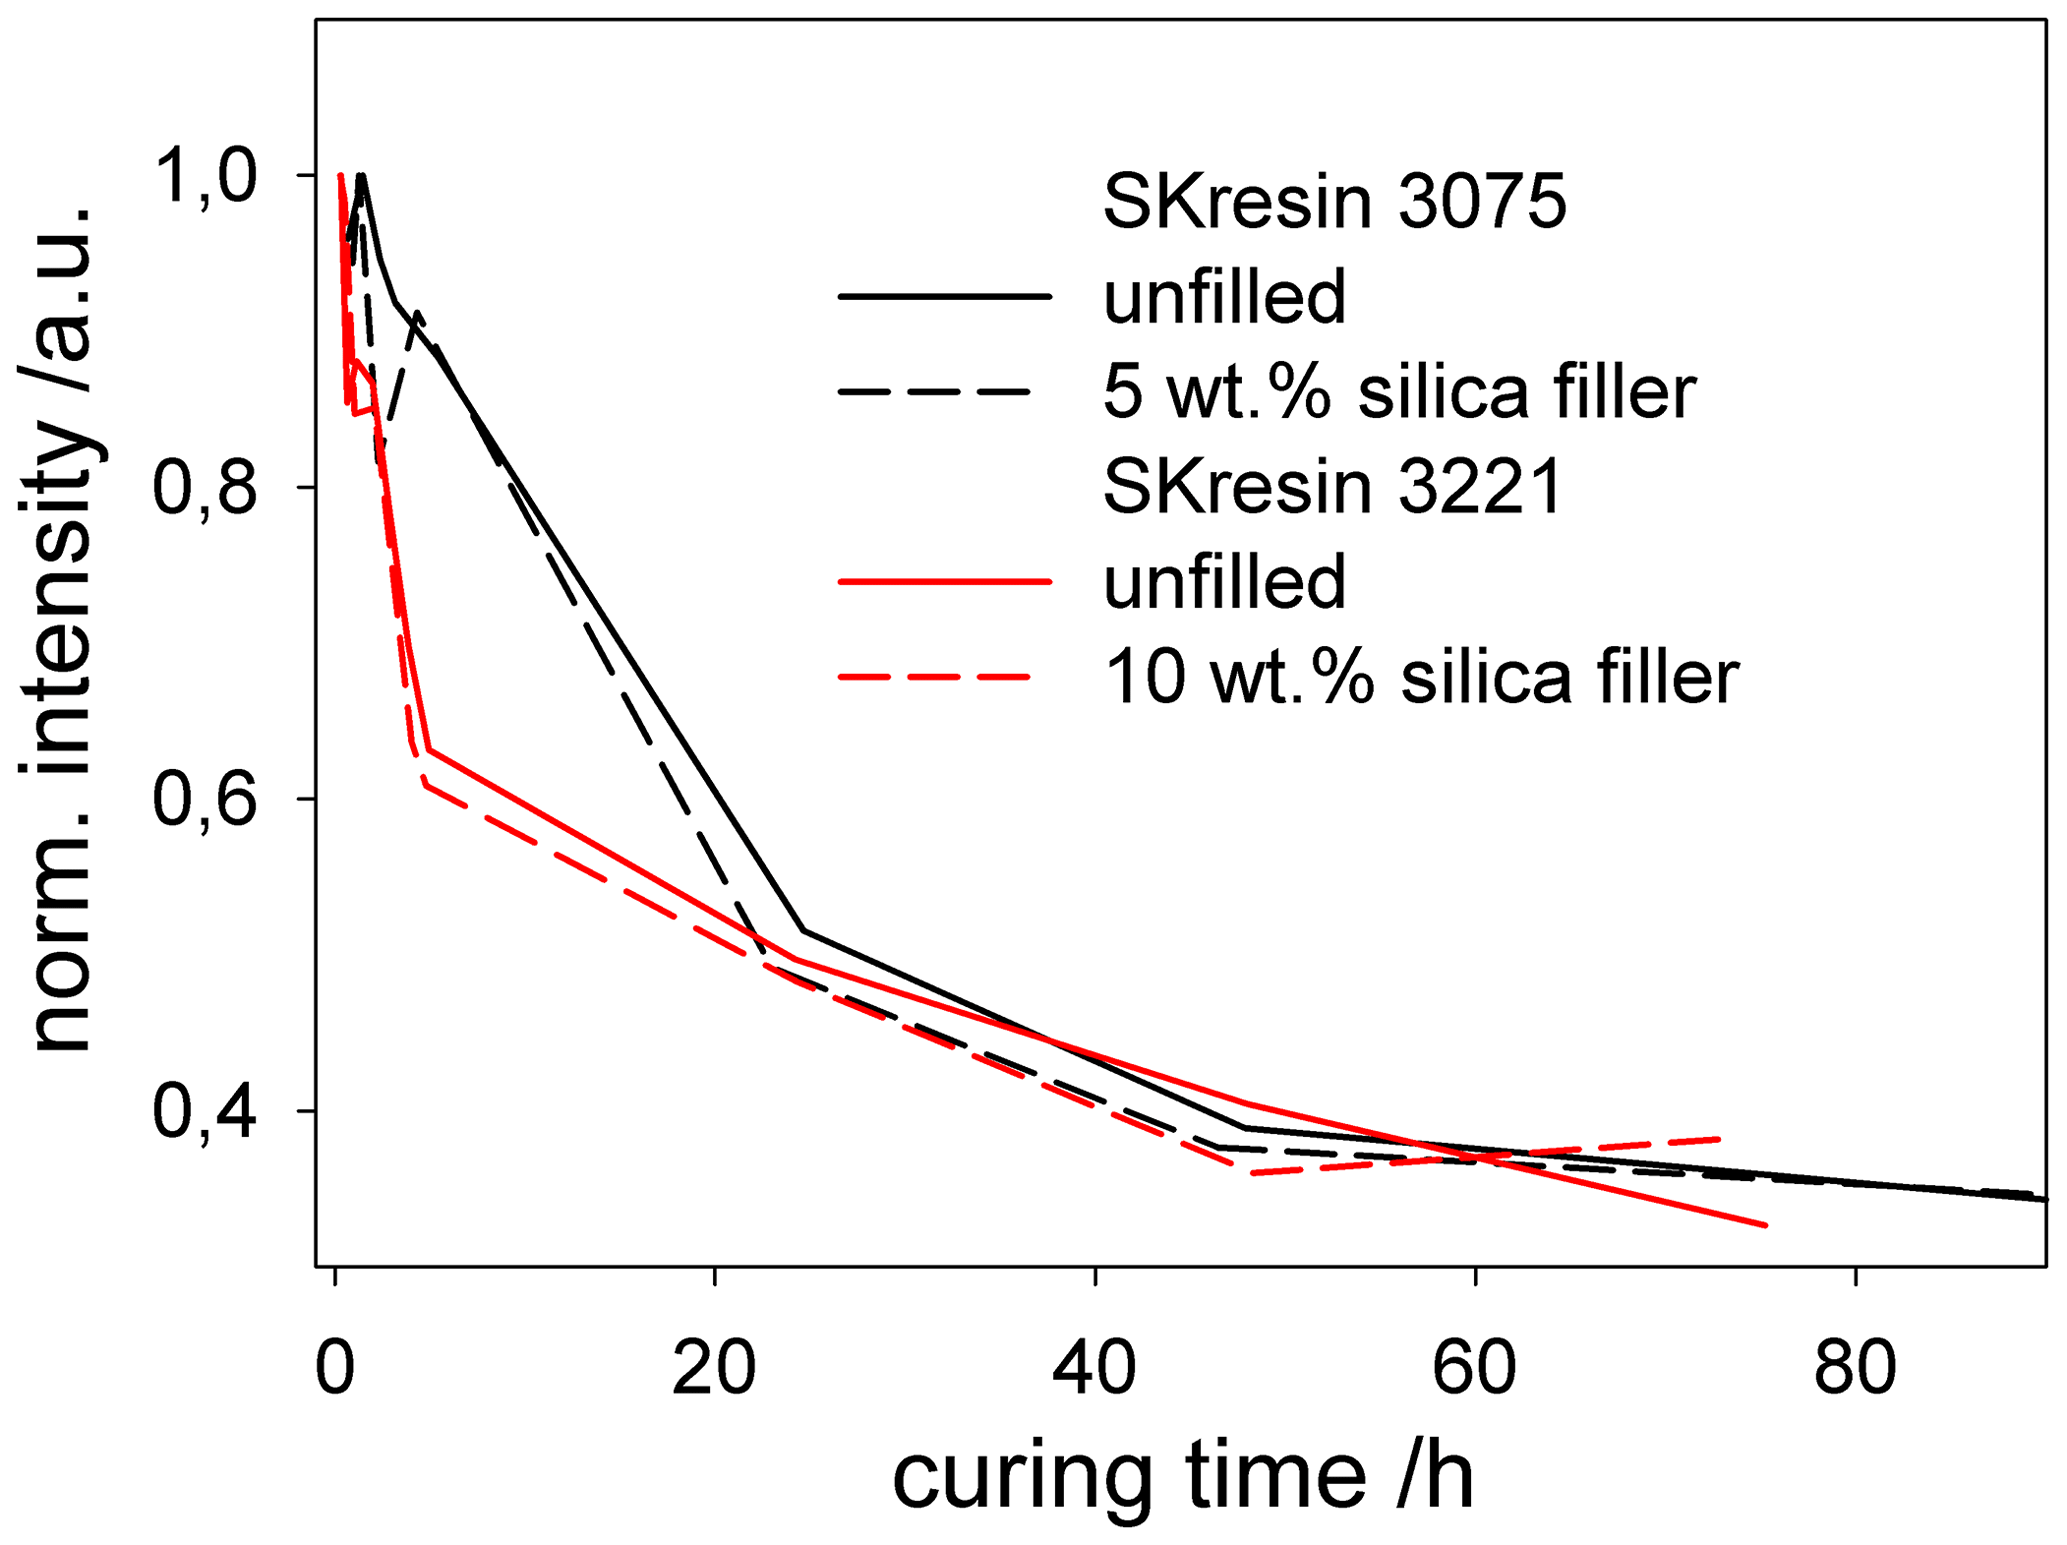
Figure 13Changes in intensity of the epoxy ring 767 band over time. Differences in curing time are observed for the two resins, which coincide with the DEA and integrating sphere observations. The addition of a silica filler does not significantly influence the curing behaviour.
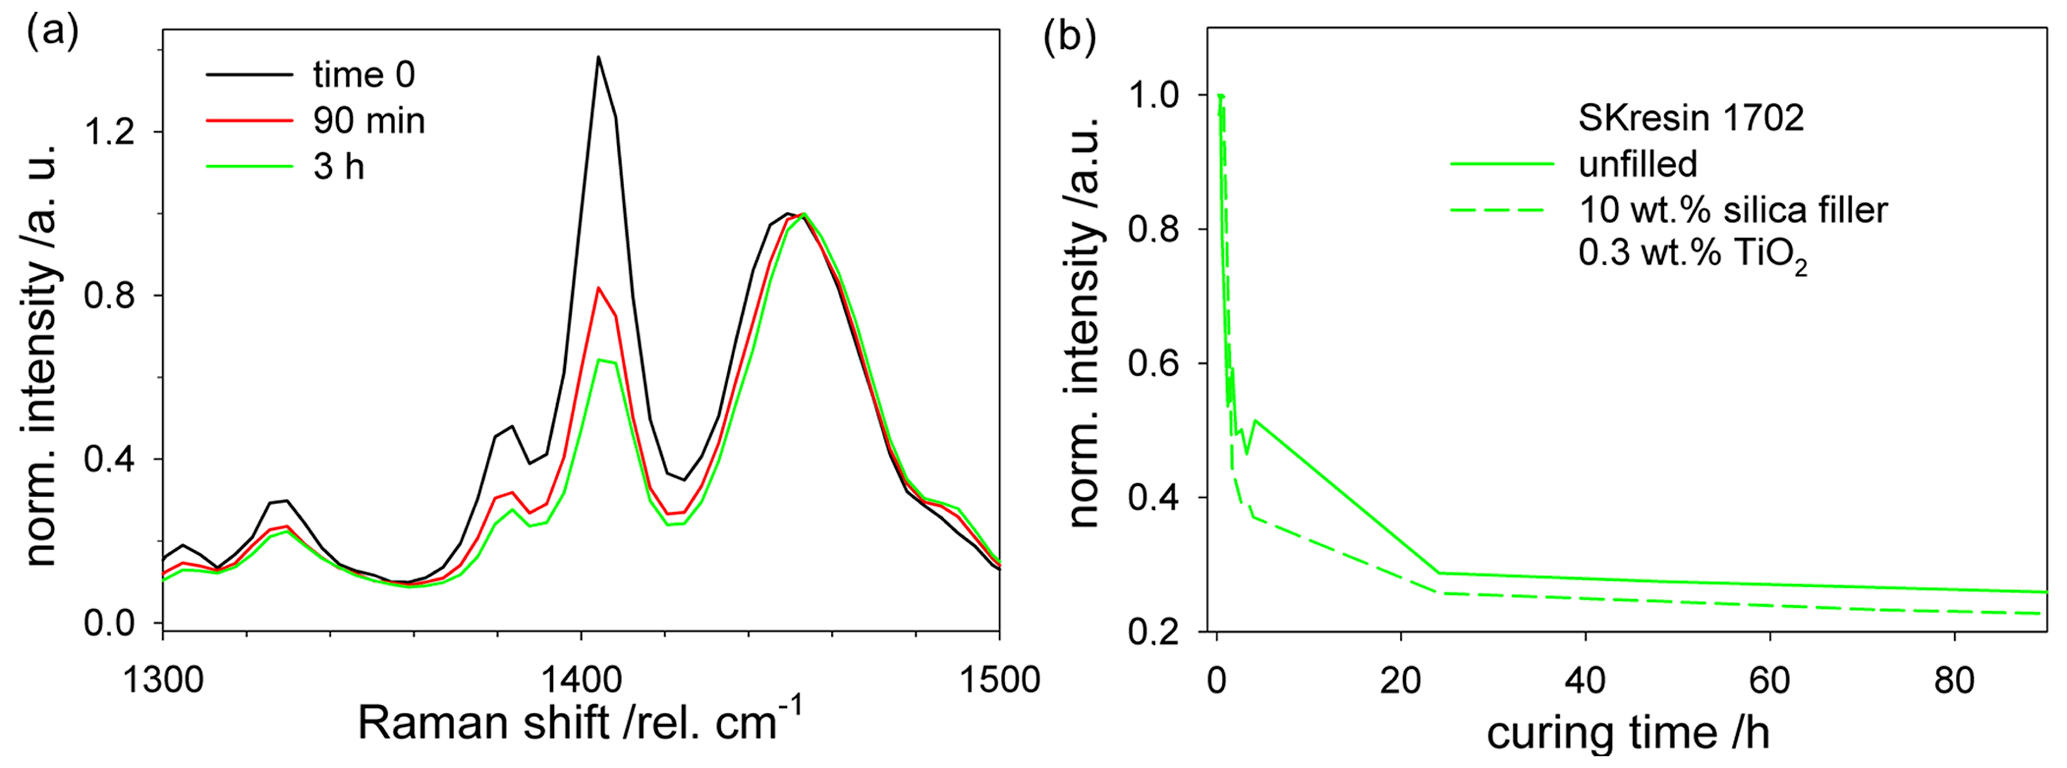
Figure 14(a) Changes in Raman spectra of SKresin 1702 during curing. (b) Intensity of the 1407 band over time. The addition of a silica filler does not influence the curing behaviour.
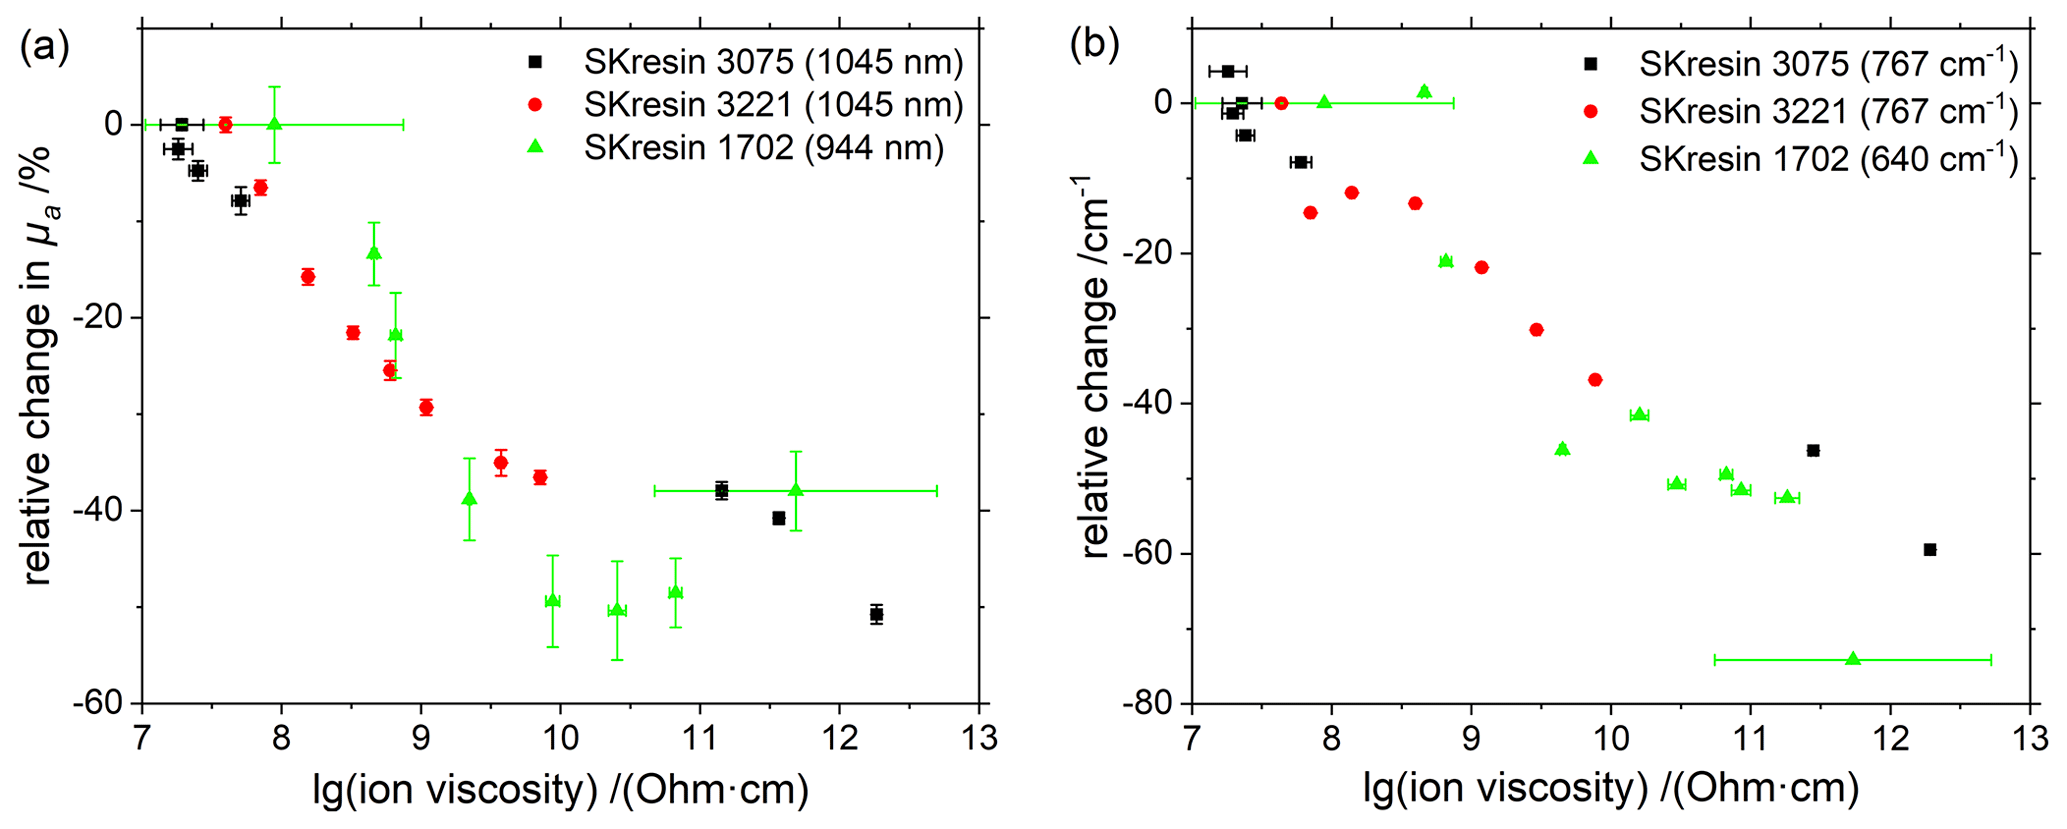
Figure 15Correlation analysis of the measurements with (a) the integrating sphere at one example wavelength, respectively, the (b) Raman system at one example wave number, and DEA for the used resins without filler.
4.2.4 Raman spectroscopy
After the mixing of the two components, the resins were very homogeneous. Raman spectra at a single spot are representative of the material and can be recorded at selected intervals to follow the reaction. The curing of the epoxy resins SKresin 3075 and SKresin 3221 was evaluated by following the changes in the epoxy ring band at 767 ; for normalization, the C=Car band at 1611 was used. Significant differences in the curing behaviour of the two resins were observed (see Fig. 13), while the addition of a silica filler does not significantly influence the process. The higher intensities at 4 h for SKresin 3075 and at 1 h for SKresin 3221 are artefacts, probably due to changes in temperature at the beginning of the process. For acrylic resins, most of the Raman bands show changes during polymerization. For the investigation of curing of the acrylic resin SKresin 1702, the changes in intensity of the 1407 band (CH2=C) with time were chosen, as shown in Fig. 14. Spectra were normalized using the δas mode at 1450 as an internal standard. The addition of 10 wt. % of a silica filler has no relevant influence on the curing behaviour of the resin, at least for the used integral measurement mode. Raman spectroscopy allows the monitoring of the curing process of thermosets online in a non-invasive way. In recent years, easy-to-handle Raman spectrometers with dedicated software were developed and have already been applied, particularly in the pharmaceutical sector. These instruments could be adapted to the analysis of thermoset curing processes.
4.2.5 Investigation of correlations
Furthermore, the correlation of the Raman and integrating sphere results with those from the DEA measurements was investigated for the resins. Therefore, the measured values of the different methods, which were recorded at the same curing times (± 2 min), were plotted against each other. For the DEA values, the mean value with standard deviations of the measurements without filler was used, and for the optical methods, the changes at one wavenumber or wavelength were considered in each case. Figure 15 shows the comparison of integrating sphere and Raman measurements versus DEA. From these, a linear trend is apparent for almost all materials (for SKresin 1702 only in certain subranges of the ion viscosity) and thus a good correlation of the data. Since the ion viscosity values of the individual DEA measurements for SKresin 1702 varied largely at certain reference times (different initial and final ion viscosity levels due to bubble formation and sensor coverage, compare Sect. 4.2.2), very large error bars on the abscissa result for these data points. Nevertheless, the curves for SKresin 1702 show the same course. From the slope of the graphs, it may be possible to draw conclusions about the reaction kinetics of the respective systems. The two epoxy resins show a similar decrease, while in the case of the acrylic resin, a much steeper slope can be seen in the linear section. More in-depth investigations into the correlations and the exact relationships are recommended.
In this work, the determination of the degree of cross-linking was investigated, using absolute optical measurements with an integrating sphere and Raman spectroscopy. PE-Xc on the basis of HDPE and UHMWPE and various thermosets were examined. Laboratory methods, such as wet chemical analysis, DSC, and DEA, were used for comparison. The results of the investigations on PE-Xc, using the integrating sphere, show that the various materials (HDPE and UHMWPE) can be well distinguished on the basis of their absorption and scattering in the VIS and NIR wavelength range. Therefore, the results of the integrating sphere measurements allow conclusions to be drawn on the degree of cross-linking. Raman spectroscopy was used to identify changes in chemical bonds. Changes in CH, CH2, and CH3 regions were found in the investigated PE-Xc samples. The curing of the resins can be monitored based on the absorption coefficient and with Raman spectroscopy. The determined absorption spectra were independent of TiO2 concentration and therefore of scattering. At the same time, the limitations of the laboratory methods used to date, especially for UHMWPE and out-gassing resins, were illustrated. The assembled integrating sphere demonstrator is potentially usable for the non-destructive determination of the degree of cross-linking, respectively, curing, and has the potential for use as an at-line device for in-process quality assurance. A good correlation of the results of the optical methods with those of the DEA could be shown and serves as a basis for further investigations. In future studies, the method of absolute optical measurements will be extended to other spectral ranges (mid-infrared) and measurement techniques (Raman) in order to benefit from the advantages of a separate detection of absorption and scattering.
There was no special software code for the analysis of the raman, wet chemical analysis, differential scanning calorimetry (DSC), and dielectric analysis (DEA) used. The software code of the integrating sphere analysis is not published but an detailed explanation of the measurement principles and the data analysis can be found here: Foschum et al. (2020).
The data presented in this study are openly available and can be found here: https://www.ilm-ulm.de/publikationen-1-1.html (ILM, 2023).
Conceptualization: FB and NH. Validation, investigation, data curation, original draft preparation, and visualization: FB, CSH, and NH. Review and editing: FB, CSH, DR, AK, NH, LM, BB, TH, and MB. Supervision: AK, MB, and HB. Project administration: FB and NH. All authors have read and agreed to the published version of the paper.
The contact author has declared that none of the authors has any competing interests.
Publisher's note: Copernicus Publications remains neutral with regard to jurisdictional claims in published maps and institutional affiliations.
This article is part of the special issue “Sensors and Measurement Systems 2022”. It is a result of the “Sensoren und Messsysteme 2022, 21. ITG/GMA-Fachtagung”, Nuremberg, Germany, 10–11 May 2022.
The IGF project no. 20848 N by the research association Fördergemeinschaft für das SKZ e.V. has been funded through the AiF, within the scope of the programme for the Promotion of Cooperative Industrial Research and Development (IGF) by the BMWK due to a decree by the German Federal Parliament.
This paper was edited by Leonhard Reindl and reviewed by two anonymous referees.
Bergmann, F., Foschum, F., Zuber, R., and Kienle, A.: Precise determination of the optical properties of turbid media using an optimized integrating sphere and advanced Monte Carlo simulations. Part 2: Experiments, Appl. Optics, 59, 3216–3226, 2020. a, b, c, d
Case, K . and Zweifel, P. F.: Existence and uniqueness theorems for the neutron transport equation, J. Math. Phys., 4, 1376–1385, 1963. a
DIN: Pipes and fittings made of crosslinked polyethylene (PE-X) – Estimation of the degree of crosslinking by determination of the gel content (ISO 10147:2011), DIN, 2012. a, b
DIN: Plastics – Differential scanning calorimetry (DSC) – Part 5: Determination of characteristic reaction-curve temperatures and times, enthalpy of reaction and degree of conversion (ISO 11357-5:2014), DIN, July 2014. a
DIN: Plastics – Differential scanning calorimetry (DSC) – Part 3: Determination of temperature and enthalpy of melting and crystallization (ISO 11357-3:2018), DIN, July 2018. a, b
DIN: Pipes and fittings made of unfilled, non-reinforced and crosslinked polyethylene (PE-X) – Determination of the degree of crosslinking through rheological measurement of the storage modulus (ISO 16728:2019), DIN, 2019. a
Duderstadt, J. and Martin, W.: Transport Theory, John Wiley & Sons, Inc., New York, ISBN 9780471044925, ISBN 047104492X, 1979. a
Ehrenstein, G. W., Bittmann, E., Hoffmann, L., Schäfer, H., Schemme, M., and Wolfrum, J.: Duroplaste-Aushärtung, Prüfung, Eigenschaften, Carl Hanser Verlag, ISBN 978-3-446-18917-1, 1997. a, b
Foschum, F., Bergmann, F., and Kienle, A.: Precise determination of the optical properties of turbid media using an optimized integrating sphere and advanced Monte Carlo simulations. Part 1: Theory, Appl. Optics, 59, 3203–3215, 2020. a, b, c
Gigahertz-Optik: Laboratory and Analysis Systems, Gigahertz-Optik GmbH, https://www.gigahertz-optik.com/en-us/products/cat/laboratory-systems-analysis-systems/ (last access: 31 May 2023), 2022. a
Grover, S.: How Adhesives Are Driving Advances in E-Mobility, Plastics Today, https://www.plasticstoday.com/automotive-and-mobility/how-adhesives-are-driving-advances-e-mobility (last access: 31 May 2023), 2021. a
Habenicht, G.: Kleben: Grundlagen, Technologie, Anwendungen, Springer, ISBN 978-3-540-85264-3, 2009. a
Heiduk, I.: Quality Monitoring of PE-X Semi-Finished Products, Kunststoffe International, 105, 49–51, 2015. a, b, c
ILM: Expert Optical Solutions, https://www.ilm-ulm.de/publikationen-1-1.html (last access: 31 May 2023), 2023. a
Kida, T., Hiejima, Y., and Nitta, K.-H.: Raman spectroscopic study of high-density polyethylene during tensile deformation, Int. J. Exp. Spectroscopic Tech., 1, 1–6, https://doi.org/10.35840/2631-505X/8501, 2016. a, b
Kienle, A., Lilge, L., Patterson, M. S., Hibst, R., Steiner, R., and Wilson, B. C.: Spatially resolved absolute diffuse reflectance measurements for noninvasive determination of the optical scattering and absorption coefficients of biological tissue, Appl. Optics, 35, 2304–2314, 1996. a
Kömmling, A., Chatzigiannakis, E., Beckmann, J., Wachtendorf, V., von der Ehe, K., Braun, U., Jaunich, M., Schade, U., and Wolff, D.: Discoloration Effects of High-Dose γ-Irradiation and Long-Term Thermal Aging of (U) HMW-PE, Int. J. Polym. Sci., 2017, 1362491, https://doi.org/10.1155/2017/1362491, 2017. a
Kurtz, S. M.: The UHMWPE handbook: ultra-high molecular weight polyethylene in total joint replacement, Elsevier, ISBN 978-0-12-429851-4, 2004. a
Martínez-Morlanes, M., Terriza, A., Yubero, F., and Puértolas, J.: Characterization of highly crosslinked polyethylenes by colorimetry, Polym. Test., 31, 841–847, 2012. a
Mason, H.: Composites end markets: Renewable energy (2022), Composites World, https://www.compositesworld.com/articles/composites-end-markets-renewable-energy-2022 (last access: 31 May 2023), 2021. a
Mortensen, U. A., Andersen, T. L., Christensen, J., and Maduro, M. A. M.: Experimental investigation of process induced strain during cure of epoxy using optical fibre bragg grating and dielectric analysis, in: ECCM18-18th European Conference on Composite Materials, 24–28 June 2018, Athens, Greece, https://findit.dtu.dk/en/catalog/5b6b13975010df015a79aa34 (last access: 31 May 2023), 2018. a
NETZSCH Gerätebau: DEA 288 Ionic – Dielectric Cure Monitoring. Method, Technique, Applications, NETZSCH Gerätebau GmbH, https://analyzing-testing.netzsch.com/_Resources/Persistent/6/d/8/7/6d87645a9765374e4fc2f6968883597beea9ec59/DEA_288_Ionic_en_web.pdf (last access: 31 May 2023), 2020 a, b
Pallikari, F., Chondrokoukis, G., Rebelakis, M., and Kotsalas, Y.: Raman spectroscopy: A technique for estimating extent of polymerization in PMMA, Mater. Res. Innov., 4, 89–92, 2001. a
Pickering, J. W., Prahl, S. A., Van Wieringen, N., Beek, J. F., Sterenborg, H. J., and Van Gemert, M. J.: Double-integrating-sphere system for measuring the optical properties of tissue, Appl. Optics, 32, 399–410, 1993. a
Roggan, A.: Measurements of optical tissue properties using integrating sphere technique, in: Medical optical tomography: functional imaging and monitoring, vol. 10311, SPIE, 151–167, https://doi.org/10.1117/12.2283755, 1993. a
Rull, F., Prieto, A., Casado, J., Sobron, F., and Edwards, H.: Estimation of crystallinity in polyethylene by Raman spectroscopy, J. Raman Spectrosc., 24, 545–550, 1993. a
Saechtling, H., Baur, E., Brinkmann, S., Osswald, T., Rudolph, N., and Schmachtenberg, E.: Saechtling Kunststoff Taschenbuch, Baur editor, Hanser, München, ISBN 978-3-446-43442-4, 2013. a, b
Sato, H., Shimoyama, M., Kamiya, T., Amari, T., Šašic, S., Ninomiya, T., Siesler, H. W., and Ozaki, Y.: Raman spectra of high-density, low-density, and linear low-density polyethylene pellets and prediction of their physical properties by multivariate data analysis, J. Appl. Polym. Sci., 86, 443–448, 2002. a
Strobl, G. and Hagedorn, W.: Raman spectroscopic method for determining the crystallinity of polyethylene, J. Polym. Sci. A2, 16, 1181–1193, 1978. a, b
Vašková, H. and Křesálek, V.: Quasi real-time monitoring of epoxy resin crosslinking via Raman microscopy, International Journal of Mathematical Models and Methods in Applied Sciences, 5, 1197–1204, 2011. a