the Creative Commons Attribution 4.0 License.
the Creative Commons Attribution 4.0 License.
 | 13 Jul 2023
Methods to investigate the temperature distribution of heated ceramic gas sensors for high-temperature applications
Thomas Wöhrl
Julia Herrmann
Jaroslaw Kita
Ralf Moos
Gunter Hagen
The temperature-dependent properties of sensor films for measuring the concentration of various gas components affect, to a large extent, the sensor characteristics of planar gas sensors. Therefore, it is important to know the temperature distribution of the gas-sensitive films of such sensors precisely. Using screen-printed thermocouples and a thermal-imaging camera, two principles for determining the temperature profile of gas sensors inside of a protection cap are shown and compared in this study. The data agree well, and the results can be used in future to determine the influences of varying flow and temperature conditions on the temperature profile of a sensor and to reduce such effects by adapting the periphery, e.g., by designing appropriate protection caps.
- Article
(5440 KB) - Full-text XML
- BibTeX
- EndNote


Protecting the environment from harmful gas components, such as carbon dioxide (CO2) or nitrogen oxides (NOx), is becoming more important in times of climate change (Bai et al., 2018). As a result, increasingly strict emission regulations were made for high-temperature processes to generate energy from fuels (Johnson, 2009). The continuing high proportion of vehicles with internal combustion engines, whose complexity continues to increase due to ongoing electrification, requires further developments in the field of high-temperature gas sensors (Doronkin and Casapu, 2021). In addition, biomass combustion plants will also be affected in the future by new legal regulations for the direct analysis and reduction of pollutants in the flue gas (Jones et al., 2014).
The emission of limited or harmful gaseous substances to the ambient air, such as carbon monoxide (CO), ammonia (NH3), or unburned hydrocarbons (HCs), which occur, for example, in the exhaust of combustion engines (Lackner et al., 2013), is to be further reduced in the future by the introduction of the Euro 7 standard for vehicles (Müller et al., 2022). Likewise, leakages in pipes in chemical plants (Jerger et al., 2002) should also be detected and prevented by appropriate measures.
For this purpose, gas sensors for the determination of concentrations of such gaseous substances can already be found in measuring stations for monitoring air quality based on metal oxide sensors (Fine et al., 2010) or in automotive exhaust gas measurement technology, including the lambda probe or NOx sensors (Riegel et al., 2002). In combination with the three-way catalytic converter for gasoline vehicles or the SCR (selective catalytic reduction) catalytic converter for diesel engines, the emission of pollutants in this area has been significantly reduced within the past few years (Merker and Teichmann, 2019). In many other processes, such as biomass combustion, continuous control of specific gas components currently takes place only in rare cases (Franco and Giannini, 2005).
The reason for this is the high cost of such measurement systems (Riegel et al., 2002). The sometimes harsh conditions that occur, e.g., within an exhaust gas system due to poisoning constituents or turbulent flow profiles or the often-present dependence of the functional film on the water content in the environment, significantly impact the behavior of the sensor during operation (Vassilev et al., 2010; Hagen et al., 2018).
Gas sensors based on alumina substrates have proven to be particularly robust for applications in the exhaust under harsh ambient conditions as they can be operated at temperatures above 500 ∘C with the help of a heater structure (Moos, 2005). Depending on the application and the gas components to be measured, the sensors differ in their design and mode of operation. Usually, a specially developed functional film is used to detect a specific gas component (Mamishev et al., 2004).
Due to the mostly production-related local separation of the heater structure from the functional film, changes in the gas flow and the mounting position of the sensor cause temperature inhomogeneities in the area of the functional film. During operation of the sensor, such changes in the temperature distribution are not desired. The mostly existing temperature-dependent behavior of the functional film can cause a strong impact on the gas-sensitive properties and hence on the output signal of the gas sensor. This in turn can lead to measurement errors in the determination of the gas component, which can vary depending on the functional material used and the intended operating temperature. Using the example of a thermoelectric hydrocarbon sensor, a temperature change of approx. 50 ∘C can cause a signal change of more than 20 % since the catalytic activity of the functional layer has a strong temperature dependence (Wiegärtner et al., 2015). Depending on the application of the sensor, the error tolerance should be in a range around 10 % of the exact value (United Nations Economic Commission for Europe, 2013). This effect may be corrected with extensive efforts by the use of secondary signals, such as the heating power or load state of the plant (Ritter et al., 2017; Hagen et al., 2023).
In order to avoid such complex correction procedures, there is huge interest during sensor development in determining location-dependent influences on the temperature profile of the sensor and minimizing them by taking appropriate measures. However, this initially requires a system that can be used to determine the temperature distribution on a sensor under real operating conditions, especially if mounted in a metallic protection cap. For this purpose, two measurement principles will be examined in more detail below, with which it is possible to perform a non-contact and spatially resolved temperature determination on the surface of a common sensor element that is placed in a protection cap.
The development of such a measurement principle requires basic knowledge of the structure and operation of a high-temperature gas sensor, which will be described in more detail below.
2.1 Basic structure of a high-temperature gas sensor
The basis for many high-temperature sensors is a planar alumina substrate, which exhibits a temperature-dependent thermal conductivity (Kita et al., 2015a). Studies on the factors influencing the temperature distribution on the surface of sensors will be carried out using a conventional alumina substrate (CeramTec Rubalit 708S, Simon et al., 2002). In several processing steps, e.g., in thin- or thick-film technology, different films are applied on the ceramic substrate. A platinum heater structure, located on one side of the sensor, provides the desired operating temperature. To control the temperature, the resistance R4L of the heater structure is determined using the four-wire measurement technique. Based on the impressed current I and the measured voltage U4L across the heater structure, the following equation (Eq. 1) for the temperature-dependent resistance is obtained:
Here, the resistance of the heater structure behaves similarly to a platinum resistance thermometer. Thus, the measured heater resistance can be used to calculate the temperature of the heater structure (TH) and to control it with appropriate electronics (Herrmann et al., 2020). This calculation represents an average value of the resistance over the area considered by the four-wire measurement, which cannot detect temperature inhomogeneities within the structure. As a result of heat transfer between the heater structure and the alumina substrate and further heat conduction through the substrate, additional temperature differences occur between the top side and the reverse side of the sensor.
Locally separated from the heater structure on the reverse side of the sensor, the tip on the front side contains a gas-sensitive functional film, which is connected via electrical leads, with which its gas-dependent properties can be determined. An example of a sensor with a sensitive functional film on the top side and a heater structure on the reverse is shown in Fig. 1a.
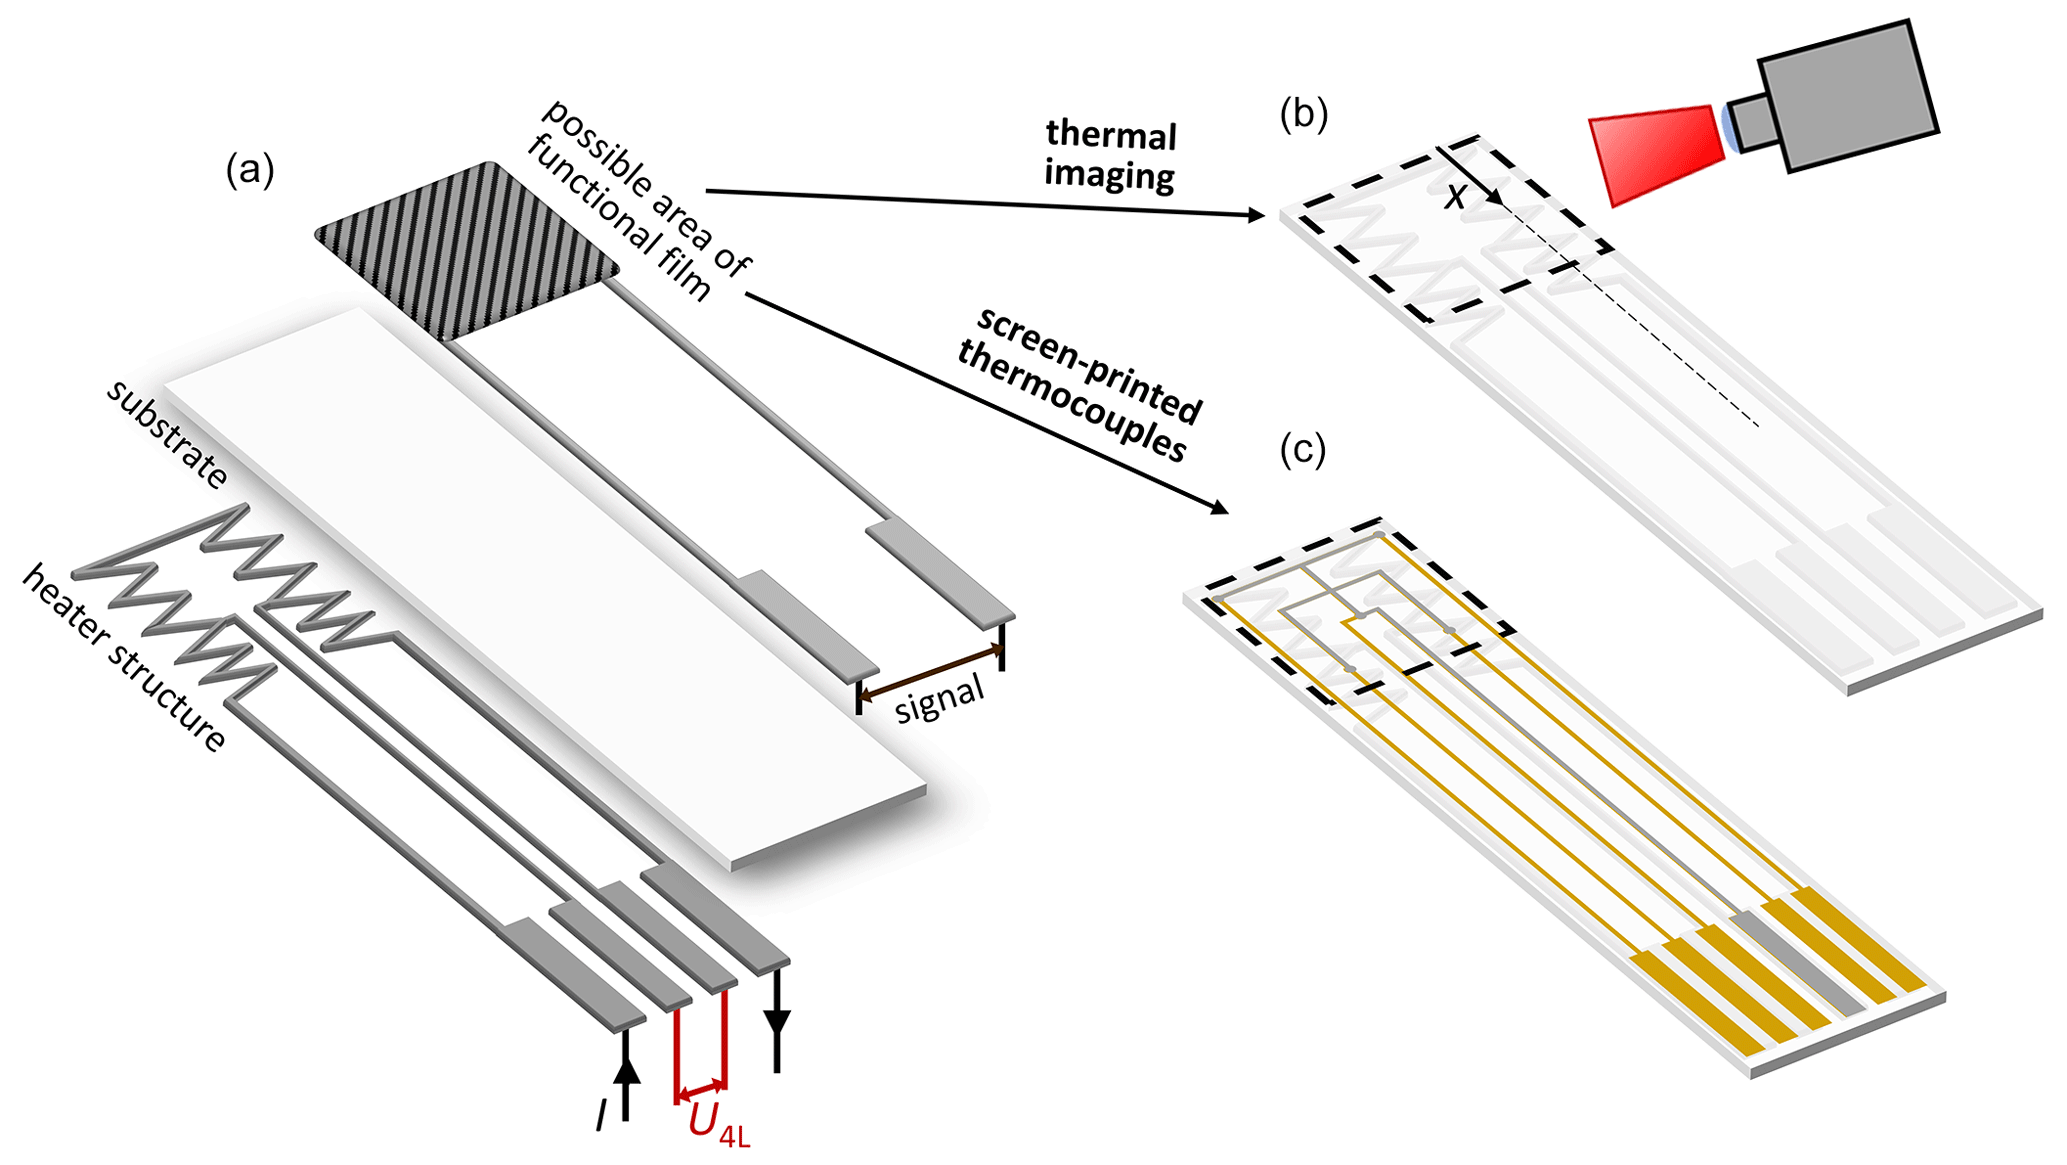
Figure 1(a) Schematic representation of a gas sensor based on an alumina substrate with heater structure and functional film, (b) sensor without functional film for thermal imaging, (c) sensor with integrated screen-printed thermocouple structures instead of the functional film.
Often, the functional film shows a temperature-dependent behavior towards the gas to be detected (Franke and Simon, 2004; Gerblinger et al., 1995; Moos et al., 2011; Frank et al., 1998). Therefore, the design of the heater structure is based on many different parameters, like sensor shape, mounting position and temperature range, to ensure the most homogeneous temperature distribution in the area of the functional film (Wiegärtner et al., 2015; d'Apolito and Hong, 2021).
However, application-related changes in operating conditions, such as varying flows in the exhaust gas or unknown installation angles of the sensor, also provide temperature inhomogeneities on the sensor surface (Hagen et al., 2018). Determining the temperature distribution under real conditions, i.e., inside a protection cap, is a major challenge due to poor accessibility. Therefore, two methods for spatially resolved temperature measurement will be investigated in more detail. For the following investigations of the temperature distribution, the setup is changed compared to the usual gas sensor shown as an example in Fig. 1a. For thermal imaging, the front side remains uncoated to ensure a homogeneous surface condition (see Fig. 1b). As a second variant, sensors are manufactured with screen-printed thermocouple structures integrated into the sensor setup, replacing the functional film (see Fig. 1c). The fundamentals of these two measurement methods are explained below.
2.2 Infrared temperature measurement
2.2.1 Theory
One way to determine the surface temperature of a solid is thermal imaging or thermography. Here, the effect of thermal radiation is used (Marek and Nitsche, 2019). The physical basis of thermal radiation is the thermally excited electromagnetic radiation of an object due to its temperature (Günzler and Gremlich, 2003). For solid non-transparent objects, this electromagnetic radiation is determined only by its surface temperature (Baehr and Stephan, 2019). For black bodies, Planck's radiation law describes the relationship between the temperature TIR of the body and its emitted spectral radiance (Hannoschöck, 2018).
For a contactless determination of the surface temperature of a sensor substrate, a thermal-imaging camera can be used. Since real objects do not behave like an ideal black radiator, material-specific radiation properties must be considered to calculate the total amount of heat. These are summarized in the emissivity ε, which indicates the ratio of the spectral radiances of a real and ideal thermal radiator (Bernhard, 2014). In theory, this value may depend on the wavelength, but this is usually neglected. Thus, for the total amount of heat transferred, the simplified relationship in Eq. (2) is obtained with a dependence on the Stefan–Boltzmann constant σ (Marek and Nitsche, 2019).
In addition to the thermal radiator, the transmission path to the measuring device also influences the properties of the electromagnetic radiation. In this case, surrounding objects, such as the protection cap or the radiation thermometer itself, also represent a heat emitter so that a net heat flux is established between the two objects (Windisch, 2017). Furthermore, media through which the radiation is transmitted, such as ambient air or transparent windows, must be considered. Similarly to the emissivity ε, the transmittance τ describes the ratio of two spectral radiances, in this case related to the value after and before the object. Since, in most cases, the ambient air serves as a transmission path and the transmittance shows a high dependence on the wavelength, the working range of many thermal-imaging cameras is in the high transmittance range between 3 and 5 µm or 7.5 and 14 µm (Bernhard, 2014). For the subsequent use of a transparent window, it is therefore necessary to ensure a suitable wavelength range.
2.2.2 Realization
In this work, a thermal-imaging camera (VarioCAM HD research 800, Infratec) was used. The camera operates in a wavelength range of 7.5–14 µm with a temperature measurement range between −40 and +2000 ∘C and with a measurement accuracy of ±1 %. The thermal-imaging camera has a resolution of 1024 × 768 pixels. For recording and storage of the thermographic images, the corresponding software IBRIS 3 was used (Infratec, 2022).
In order to determine the temperature distribution on the sensor substrates, the sensors were heated to temperatures above 500 ∘C by means of the platinum heating meander applied to the reverse side, and the temperature profile was examined. Thermal images were taken on the front side, where the sensitive film is usually located. Based on the data of Picon et al. (2021) and Werner et al. (2021), a value of ε=0.93 for alumina at 550–650 ∘C was used.
In a second step, thermal images of the sensor substrate were taken inside a protection cap. For this purpose, a window of 0.8 cm × 1.9 cm was cut out of a usually used metallic protection cap (see Fig. 2a) so that most of the sensor tip could be seen. The window was chosen so that as much of the sensor as possible was surrounded by the metallic cap, as in the real application and at the same time a part of the sensor tip, i.e., in the area of the functional film, could be thermographically examined. In order to keep the heat loss due to gas flows in this cut-out area as low as possible (since normally this area would be protected by the cap and the gas could only enter the interior through inlets), it is covered by an IR-permeable material (see Fig. 2b). The material should not only exhibit the highest possible transmission coefficient in the working area of the thermal-imaging camera but also be able to withstand high temperatures since it is directly exposed to the thermal radiation of the sensor. Non-toxicity was also required for handling reasons. Therefore, single crystalline NaCl (Korth Kristalle) was selected. It has a usable spectral range of 0.2–16 µm and a transmittance τ of about 90 % (Günzler and Gremlich, 2003). Also, maximum temperatures up to 400 ∘C are possible. Such values are not reached even at sensor operating temperatures of 600 ∘C due to the heat-insulating effect of the gas between the sensor and the NaCl IR window. One may note that the used gas temperatures are much lower, as given below. The NaCl disk was placed on the cut-out window so that it was possible to obtain thermal images realistically within a protection cap (see Fig. 2c). Based on the data sheet, a value of 0.93 for the transmittance of the window was stored in the camera settings (Korth Kristalle, 2021).
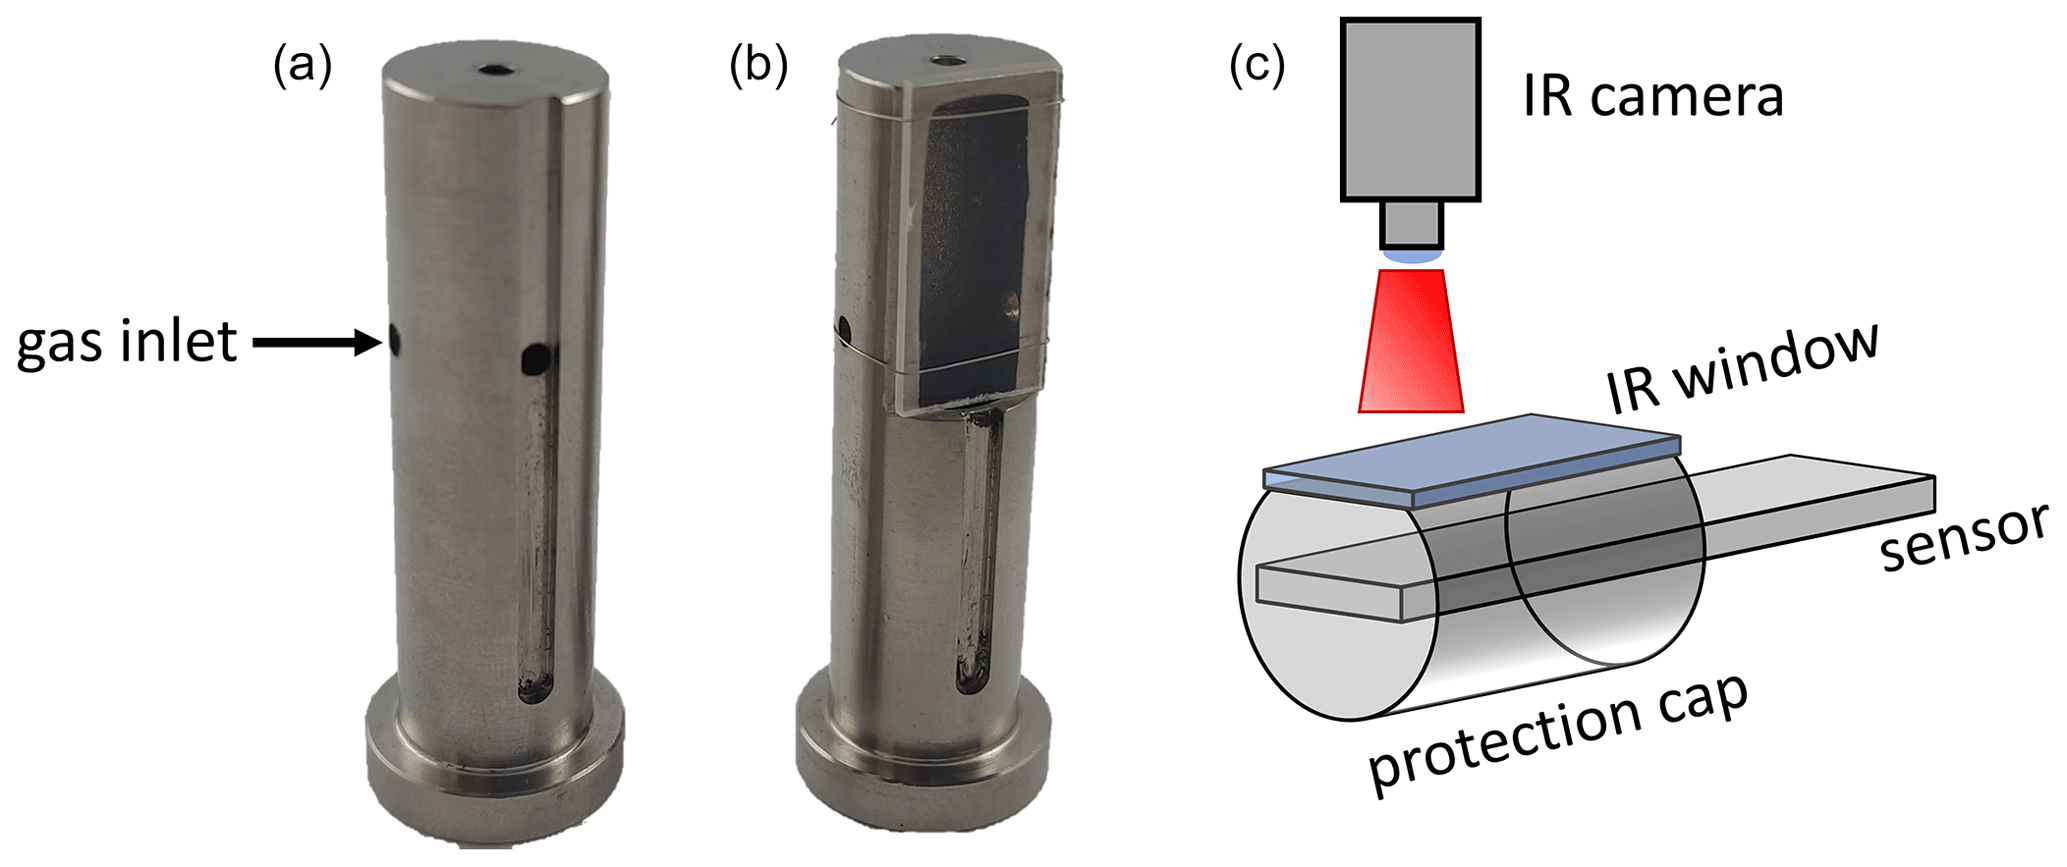
Figure 2(a) Usual protection cap with gas inlets for high-temperature sensors, (b) adapted protection cap with infrared-transmissive window made of NaCl, (c) schematic drawing of the setup for thermographic measurements.
2.3 Thermoelectric temperature measurement
As a second variant in addition to thermographic measurements, special sensors with integrated thermocouples were used. The basics are explained below.
2.3.1 Fundamentals
The Seebeck coefficient links the generation of a voltage between the contact point of two materials A and B with the temperature TTh,2 and the connection point at temperature TTh,1 (Schrüfer et al., 2022). One possibility to construct a thermocouple is shown in Fig. 3.
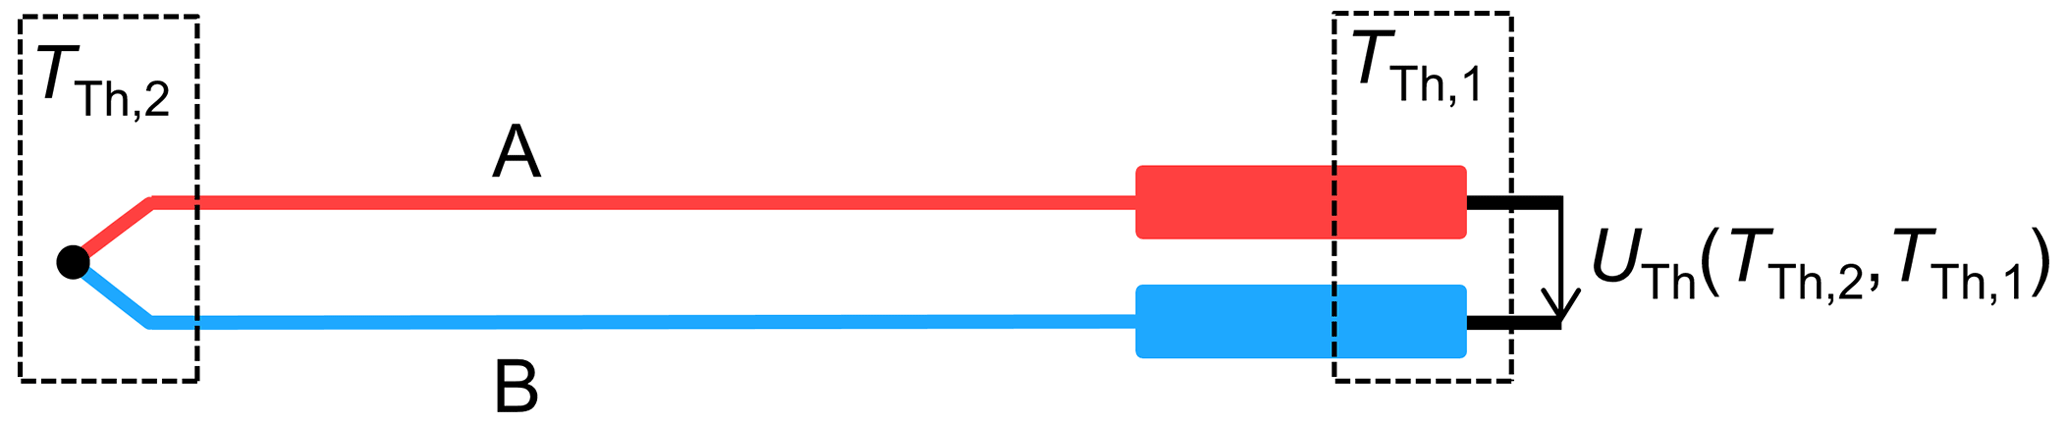
Accordingly, the so-called thermoelectric voltage UTh results as a function of the two temperatures TTh,1 and TTh,2 using Eq. (3).
Consequently, to determine the measuring point temperature TTh,2, it is necessary to measure the reference point temperature TTh,1, which is usually around room temperature. Due to the additional temperature dependence of the Seebeck coefficient , the calculation of the measuring point temperature based on these data is done with the help of an approximated polynomial from literature, where pi represents the coefficients of the polynomial (Bernhard, 2014).
Equation (4) refers to a temperature measurement where the reference junction has a temperature of ∘C. This circumstance must be considered using the following Eq. (5):
For the measurements, multiple thermocouples were applied by using thick film technology. The thermocouple materials were screen-printed onto the sensor substrate and then sintered (Kita et al., 2015b; Rettig and Moos, 2007).
2.3.2 Realization
Due to the high sensitivity and availability of the materials as conventional screen-printing pastes, gold (DuPont 5744R) and platinum (DuPont 9141) were chosen as two materials for the thermocouple structures. To estimate the temperature distribution on the sensing element, multiple sensing points were placed on a substrate (see Fig. 4).
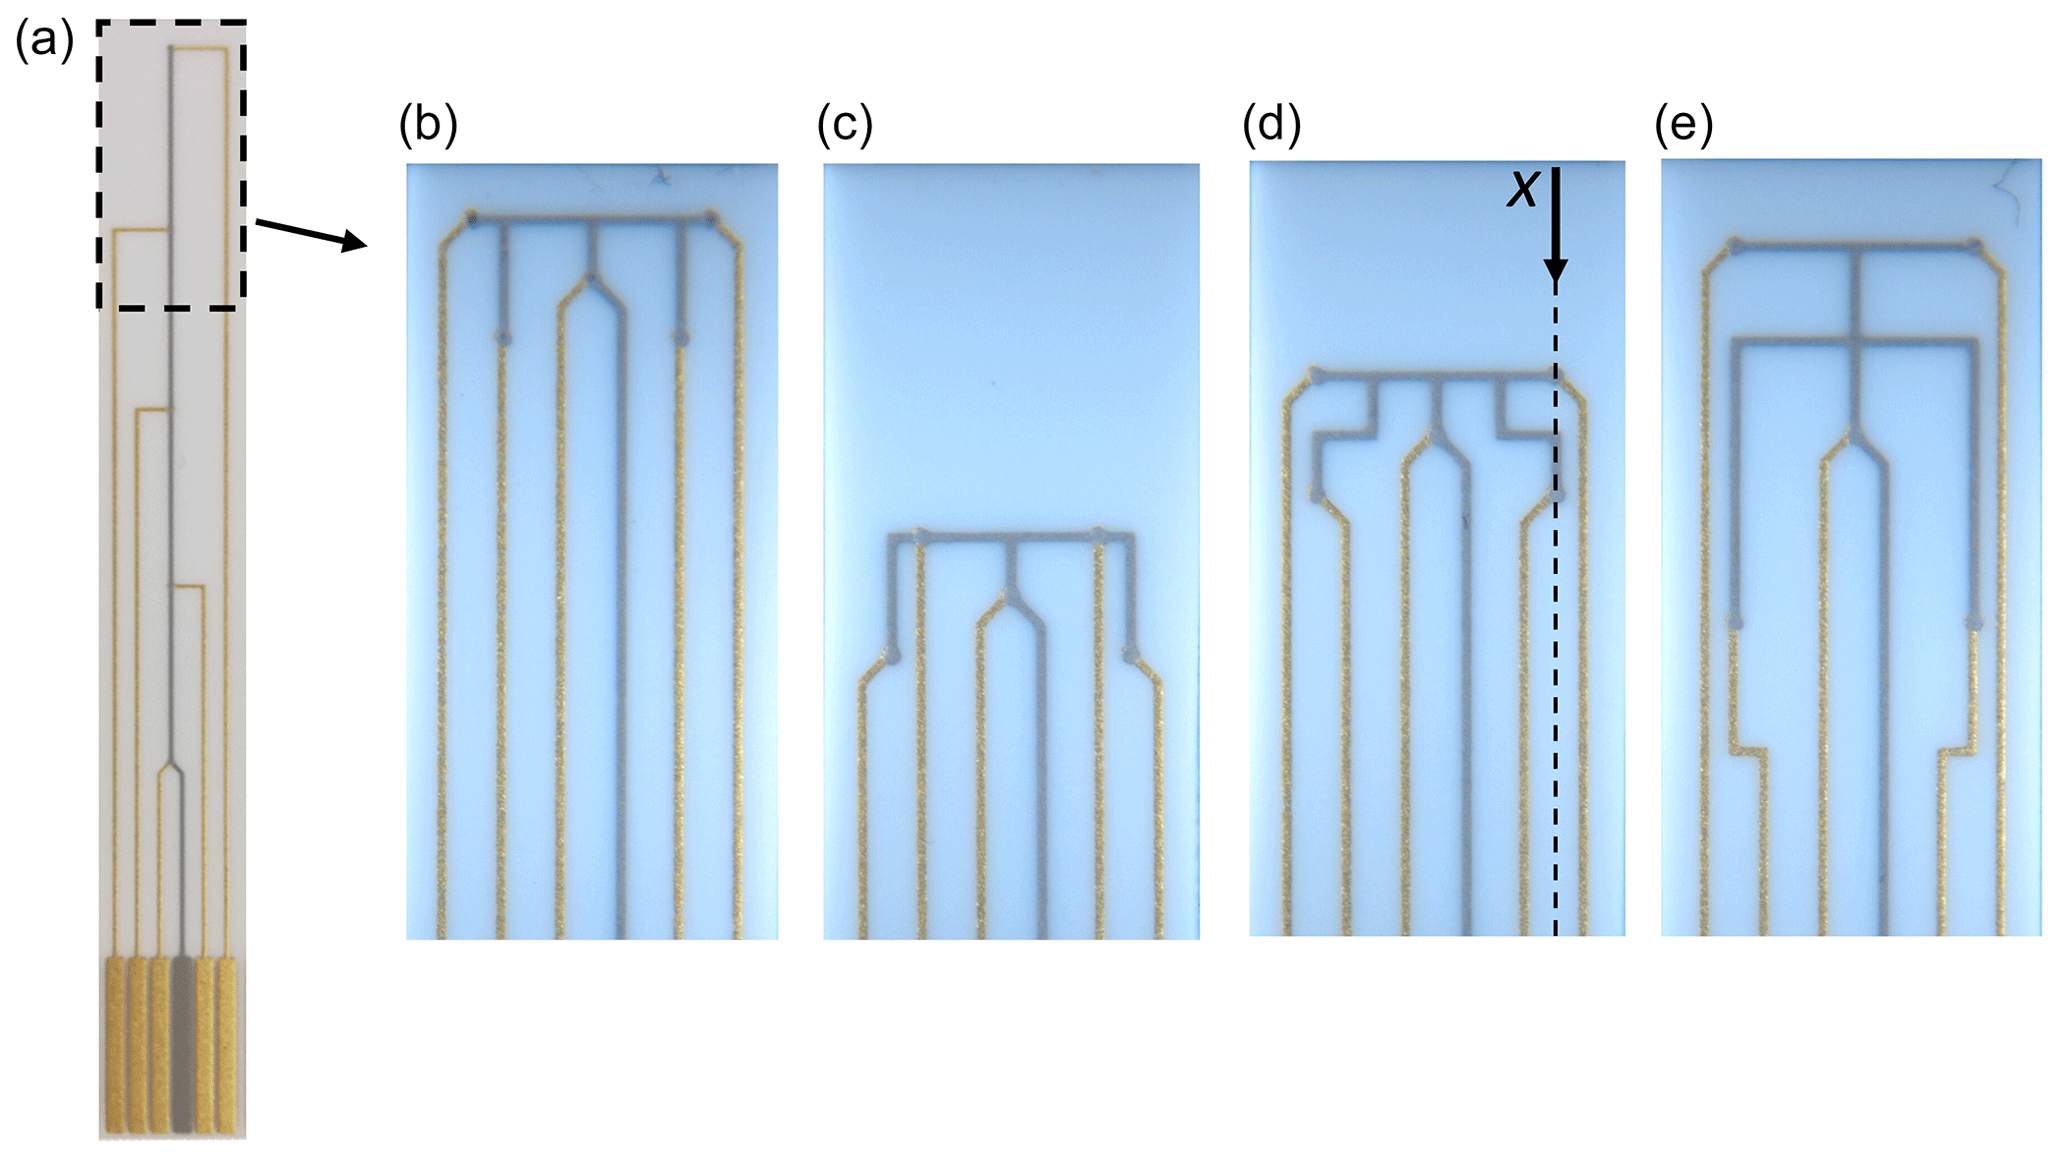
Figure 4Different setups of screen-printed gold and platinum thermocouple structures (a) over the entire sensor length and (b–e) for the functional film area.
Here, platinum is used as a common conductor for all measuring points. By means of the investigated substrate size (6.35 mm × 50.8 mm) and the existing contact, it was possible to accommodate five measuring points per sensor element. In addition, different sensor variants which target different areas of the sensor were produced. Most of the measuring points are in the area where the functional film is usually applied (see Fig. 4b–e). A further variant (see Fig. 4a) can be used to investigate the temperature development up to the contact point. With this, the influences of other effects, such as the housing temperature, can be analyzed. The measuring points are each located at a distance of 8 mm below each other.
3.1 Thermal imaging of a sensor
Depending on the application area of the sensor and the used functional film, the operating conditions, including heater temperature, installation position, etc., may vary. For the following measurements, the sensor without a functional film (see Fig. 1b) was operated around 600±50 ∘C. For this purpose, a constant voltage source was used and the four-wire resistance was determined and controlled at the same time. The installation position was chosen so that the sensor substrate was oriented horizontally (see Fig. 2c) and the side of the heater structure was located on the bottom.
The thermal images were initially validated in ambient air without using a protection cap. The temperature profiles in the area of a functional film and an example of a temperature distribution at 600 ∘C are shown in Fig. 5a and b.
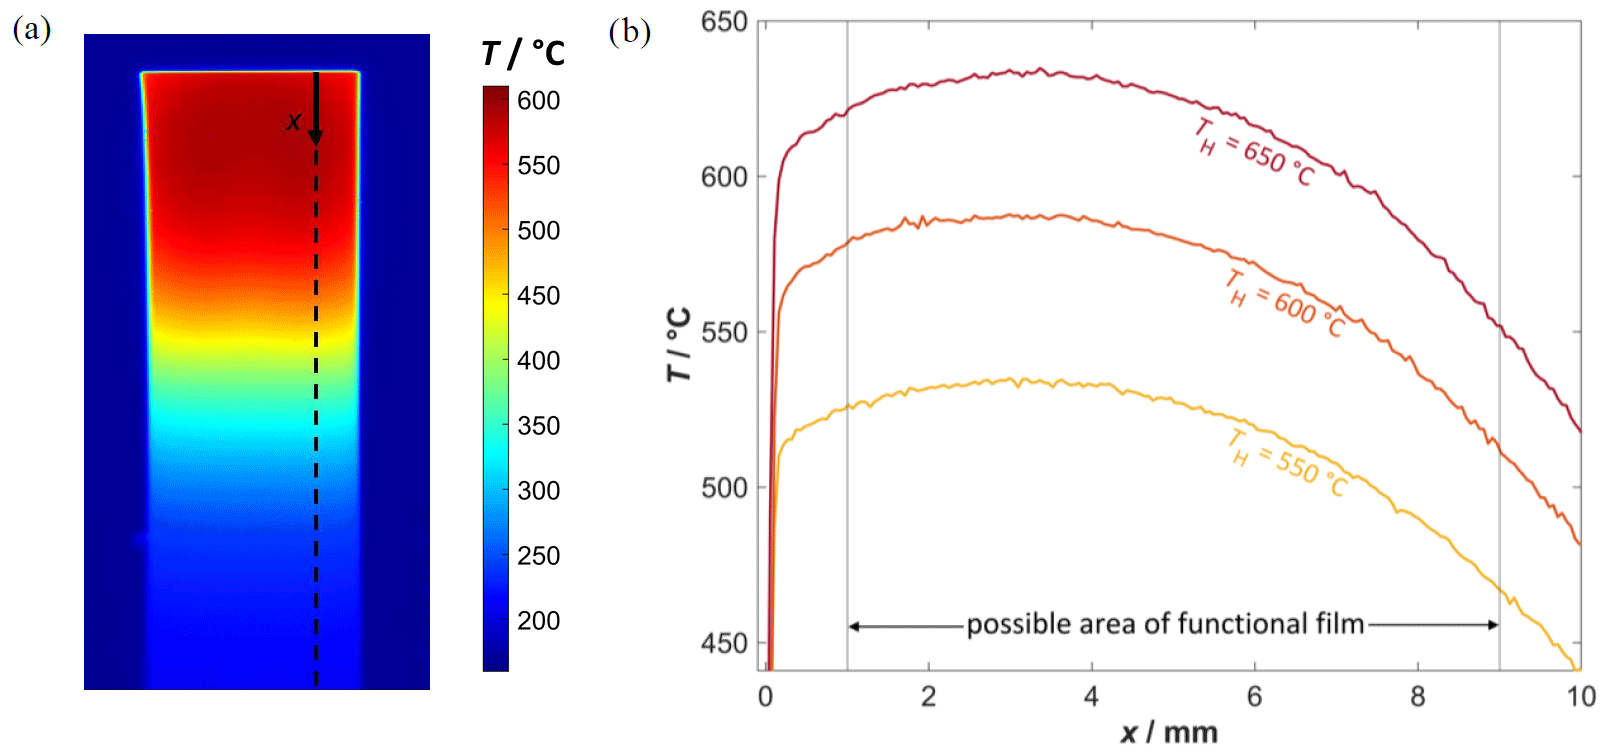
Figure 5(a) Infrared image at 600 ∘C with marked axis of temperature evaluation. (b) Diagram with temperature profiles along the sensor at a possible area of a functional film at three heater temperature levels (550, 600 and 650 ∘C).
For better comparability with the subsequent measurements of the screen-printed thermocouples, the temperature profiles of the thermal images are shown here as an example along the axis where a large proportion of the thermocouple measuring points are located (see Figs. 4d and 5b). For the sensor temperatures TH of 550, 600 and 650 ∘C that were derived using the four-wire resistance of the heater and calculated according to Eq. (1), similar temperature profiles occur, but, as is to be expected, it differs in the absolute temperatures. The maximum temperature difference in the possible area of the functional film exceeds 70 ∘C for each of the temperatures, which in turn would affect the properties of the functional film.
In addition, it can be seen that the temperature, calculated on the basis of the four-wire resistance of the heater structure on the back side (TH), is not reached on the front side. The thermal conductivity of the alumina substrate is between 8 and 10 W (m K)−1 around 600 ∘C (Kita et al., 2015a). This ensures that a part of the heat that flows away from the sensor tip to the contact points is also dissipated to the environment. D'Apolito and Hong (2021) were able to determine a similar result based on simulations, where temperature differences of several 10 K could occur between the front and back of the sensor.
These effects are to be minimized under real operating conditions by means of an appropriate protection cap around the sensor so that the temperature behavior is influenced as little as possible by varying flow conditions.
For this purpose, further measurements using the protection cap followed use of the infrared transmissive window shown in Fig. 2b. Figure 6 shows the corresponding temperature profiles (solid line) in comparison to the measurements without the protection cap (dotted lines).
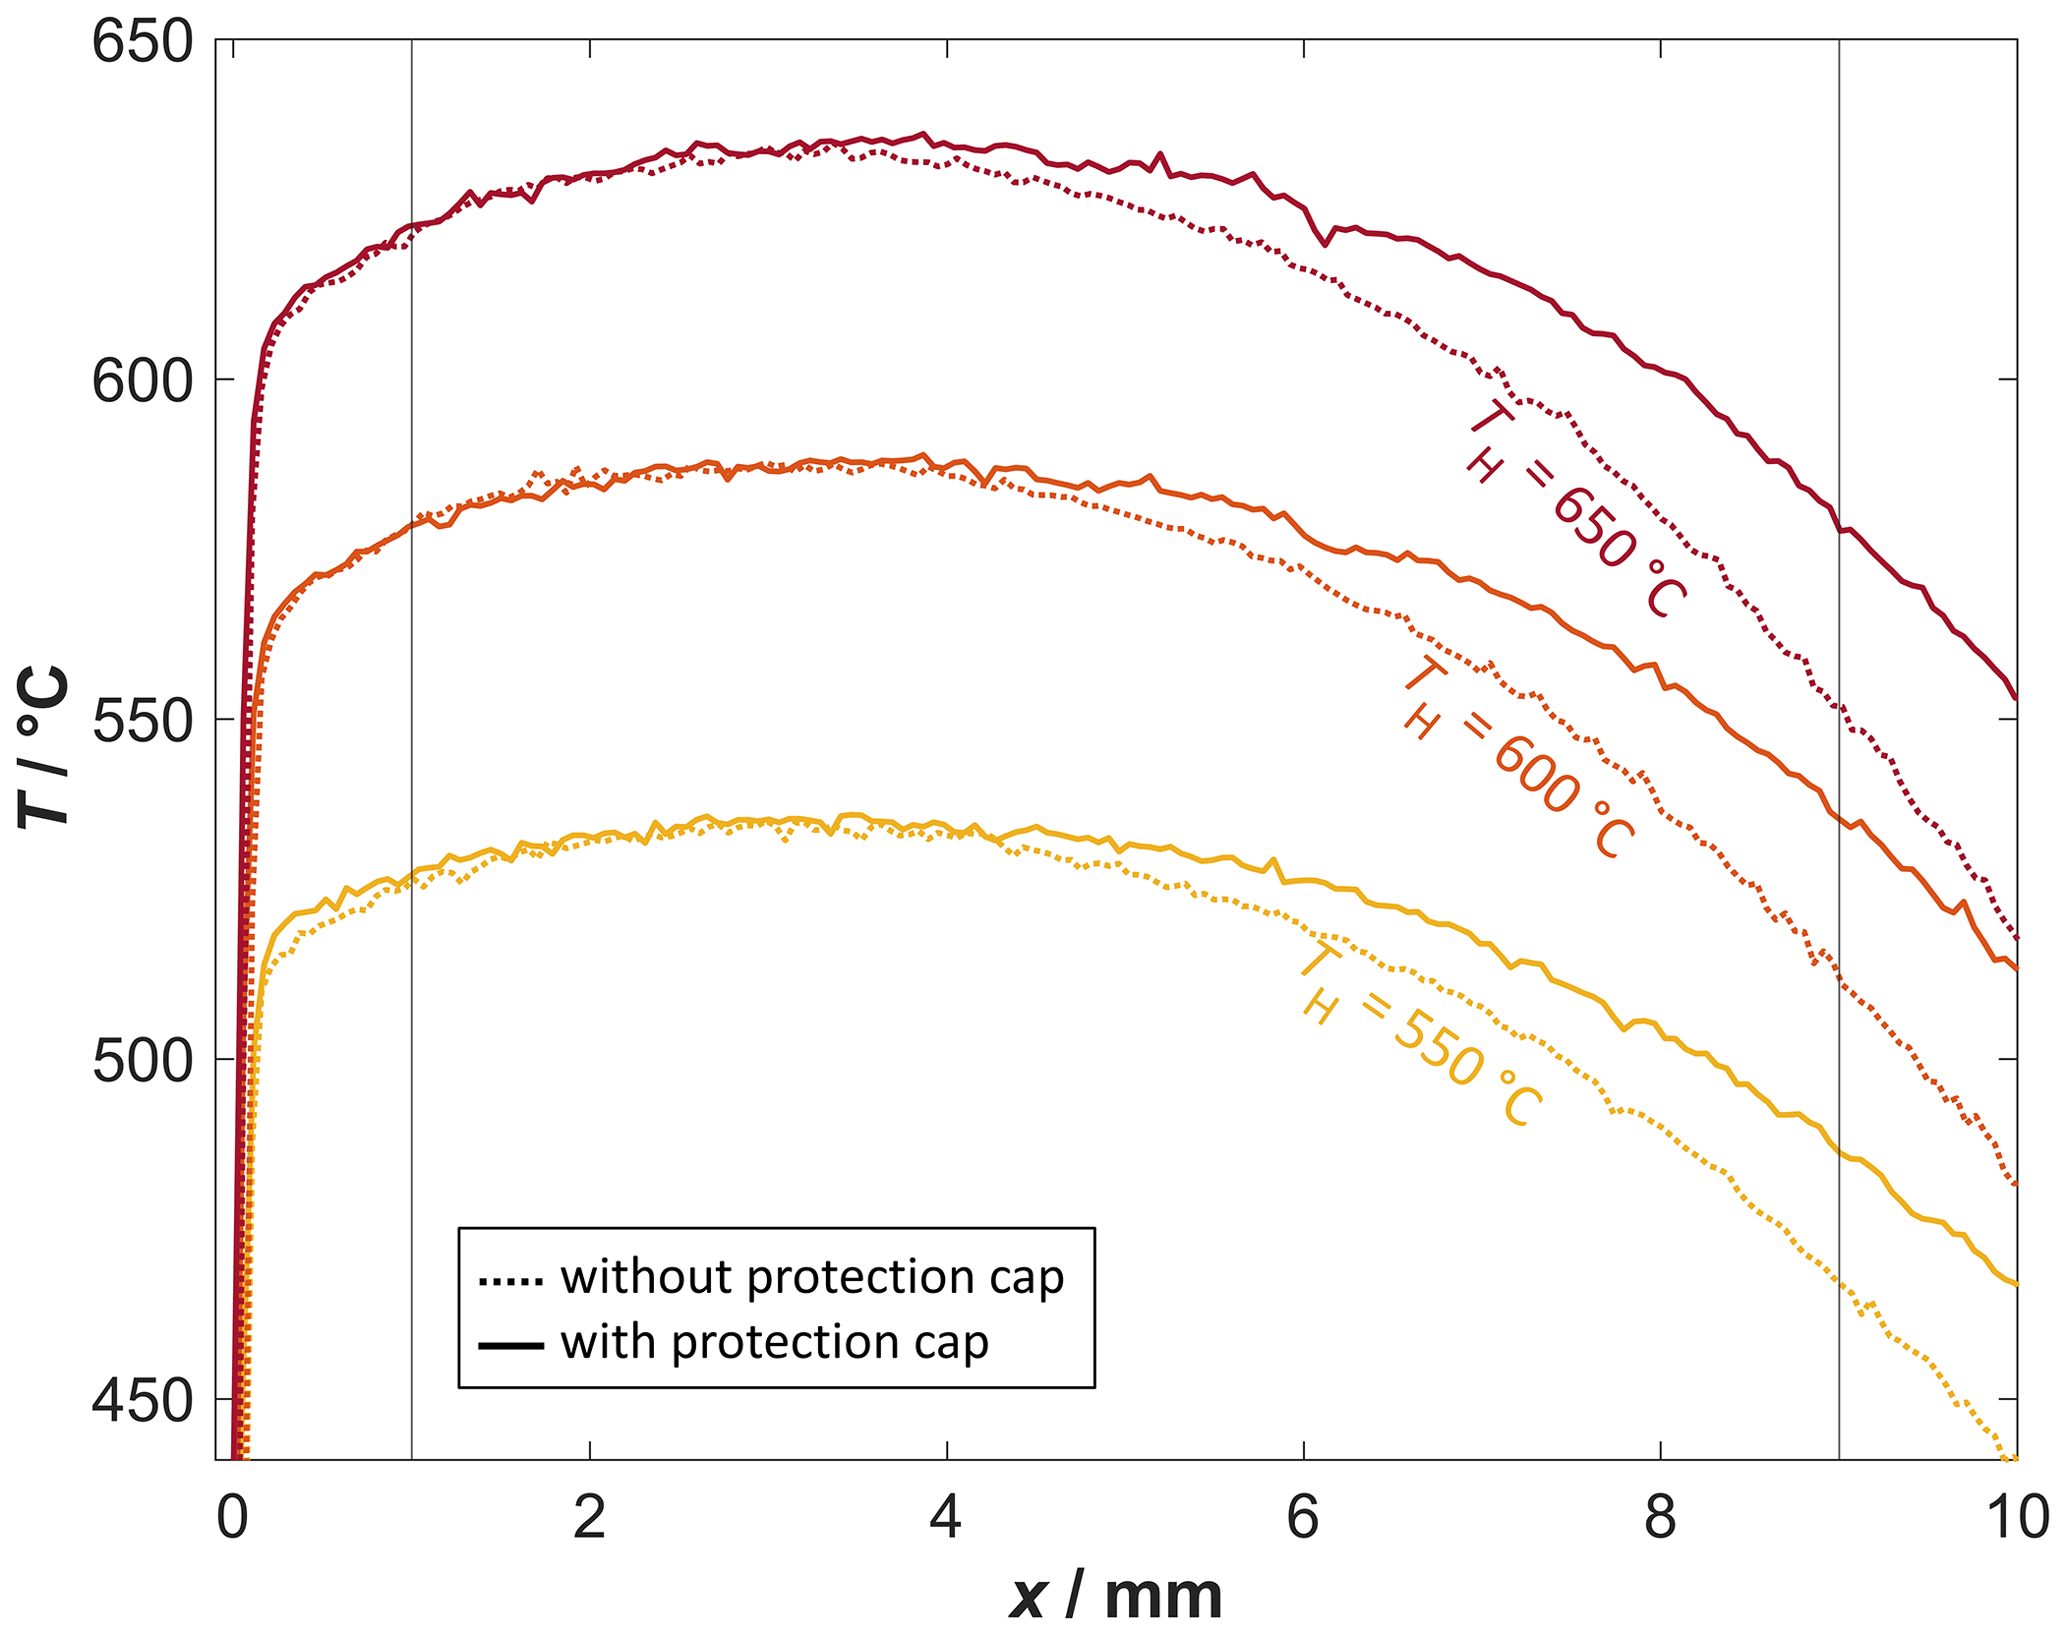
Figure 6Comparison of the temperature distribution curves without (dotted curve) and with (drawn curve) the protection cap at three temperatures.
The temperature curves with the protection cap show a similar behavior. However, the biggest difference compared to the thermal images without the protection cap is the temperature development along the sensor axis. The low heat dissipation to the environment due to the insulating effect (Windisch, 2017) of the protection cap ensures a higher temperature from x≈5 mm, which leads to an overall improved temperature homogeneity in the area of the functional film. In contrast, the maximum temperature of the functional film changes only slightly when using the protection cap, which indicates that a predominant part of the heat flows along the substrate to the contact points.
3.2 Comparison of thermal image and thermocouple sensors without protection cap
Now that it has been possible to obtain promising results on the temperature distribution by use of the thermal-imaging camera, a comparison is to be made with the screen-printed thermocouples. This method is also suitable for use in areas where no optical access to the sensor is available. Since the measurement setup is also not changed using these special sensors, the temperatures can be measured under realistic application conditions. For an initial comparison of the two measuring systems, measurement series are made again without the protection cap. Figure 7 shows the temperature curves from the thermal images (solid lines) together with the temperatures of the thermocouple sensors (dots).
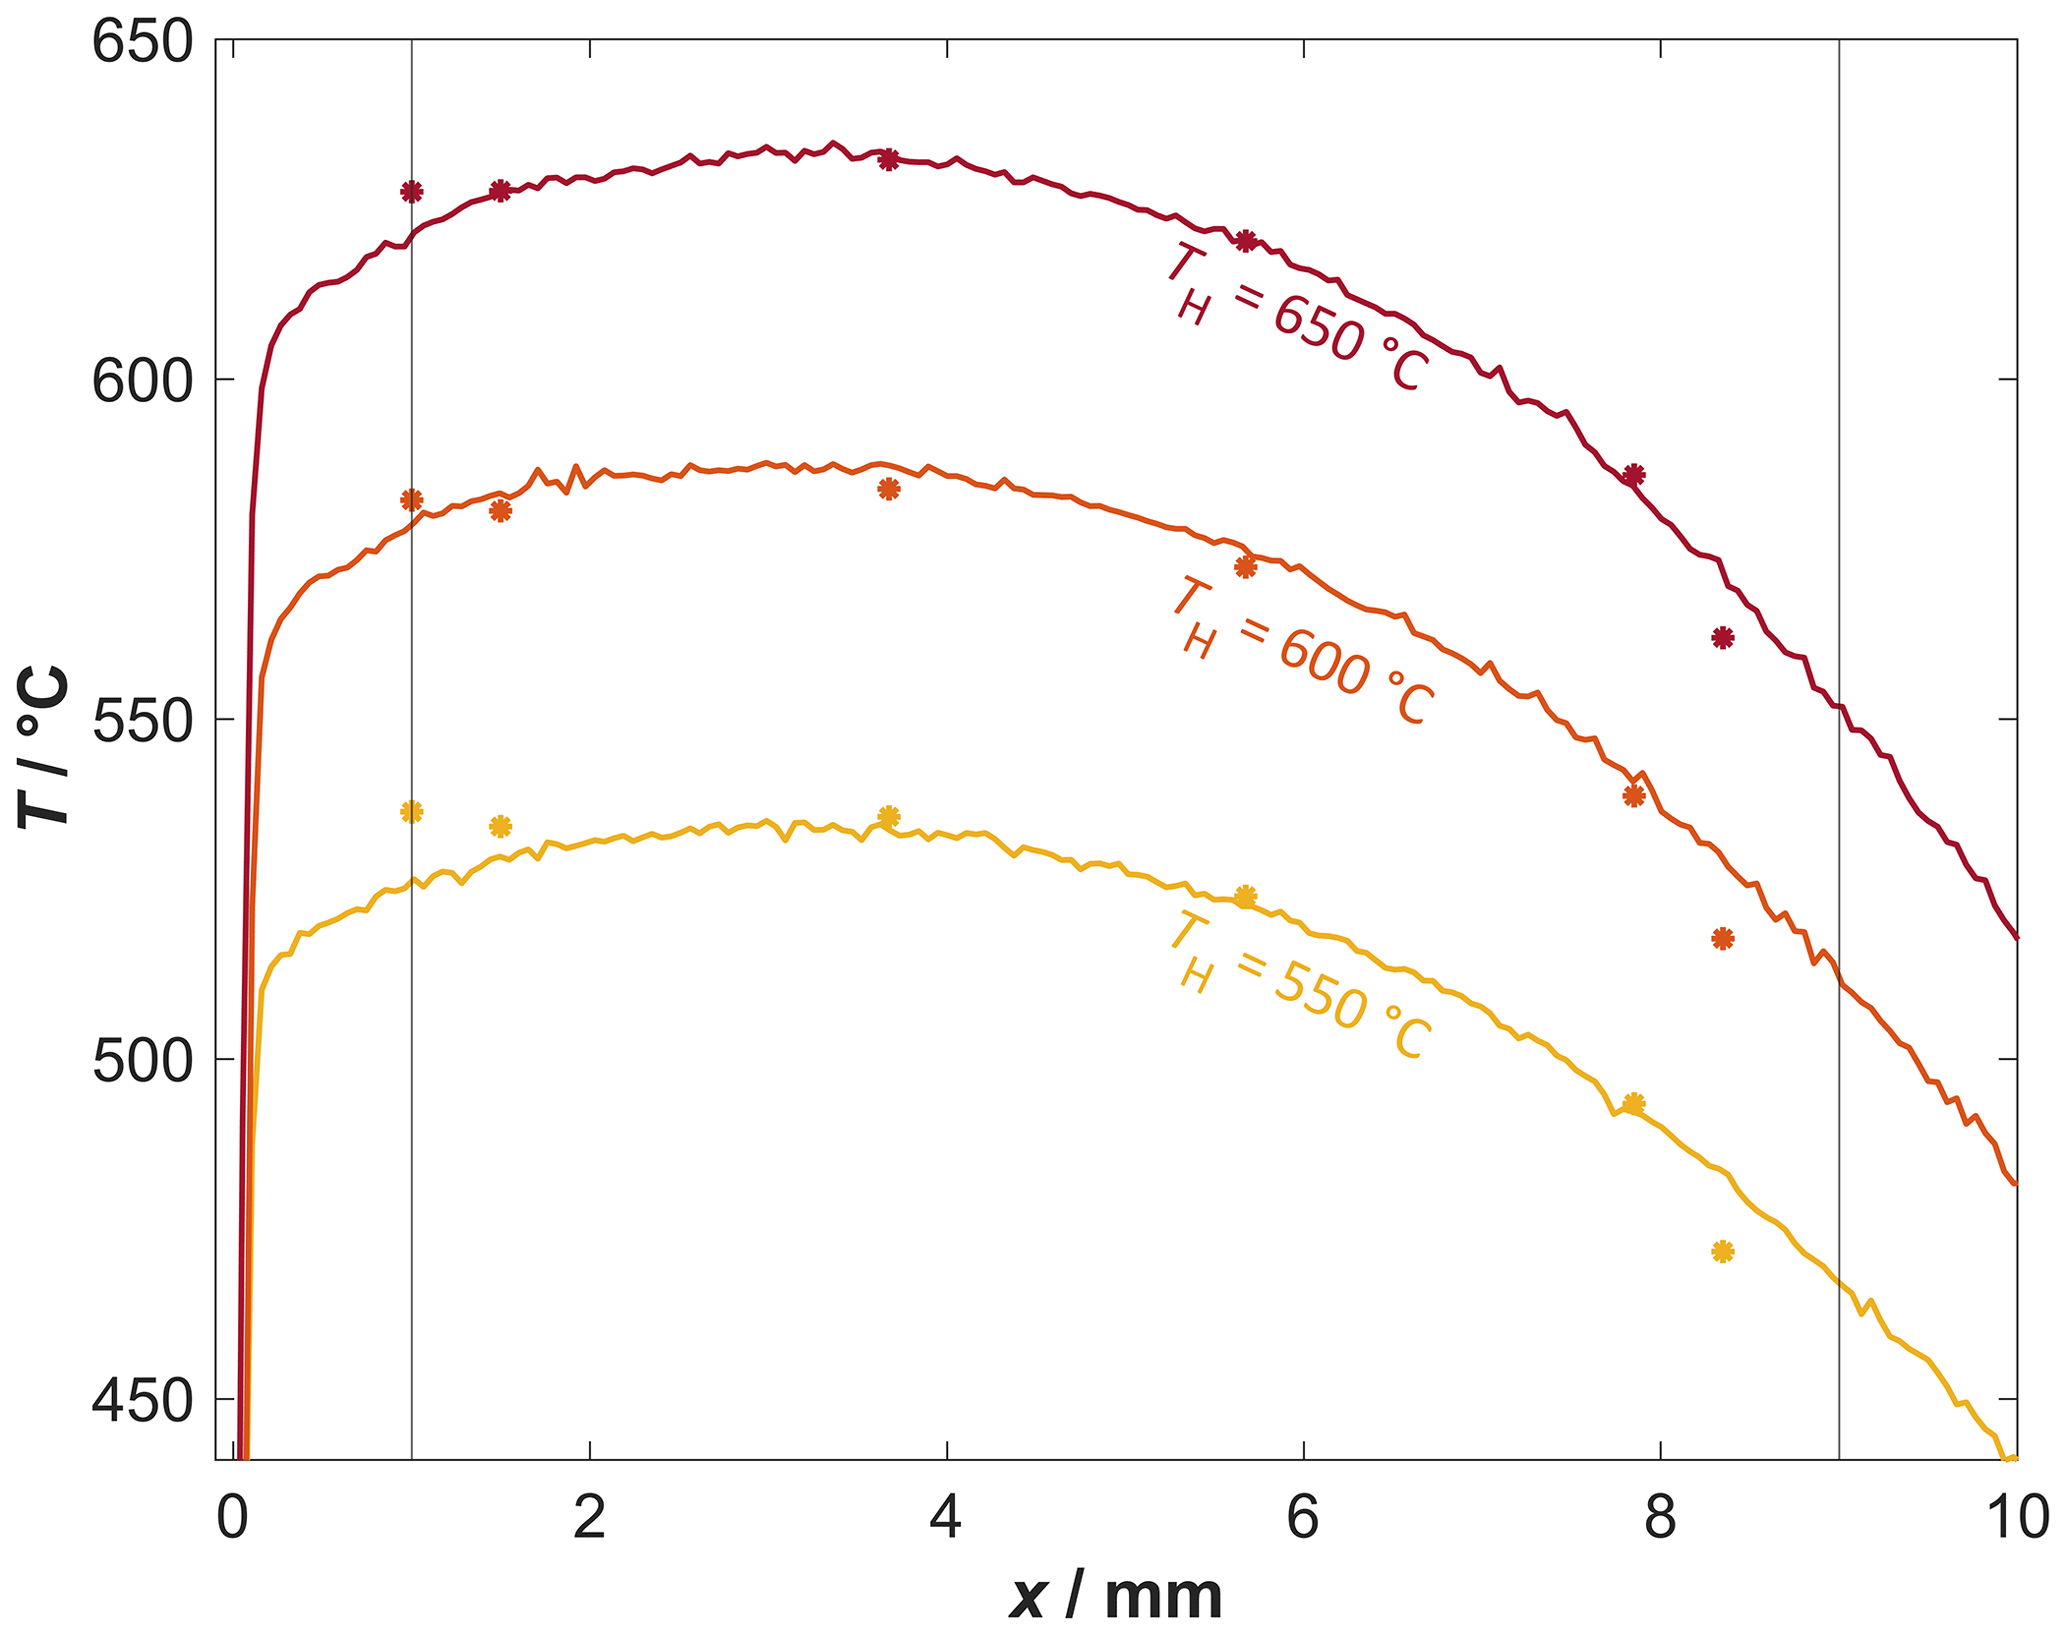
Figure 7Comparison of the temperature curves between the measurement data of the thermal image and the thermocouples without protection cap.
As already mentioned, the temperature curves of the thermal images were measured using a sensor without a screen-printed thermocouple structure or functional film. As a comparison to the thermal-imaging data, the measured temperatures of several thermocouple sensors are shown here. However, not all measuring points of a sensor are included, but in particular, the ones on the right half of the shown sensors from Fig. 4b–e are inserted; these are located along the axis, shown exemplarily in Fig. 4d.
Thereby, a good agreement of the two measuring methods can be observed for all three temperatures. Considering all the other measuring points, there is an average difference of about 6.9 ∘C between the two methods. This difference may be attributed to the measurement accuracy of the thermal-imaging camera (Infratec, 2022). Another possibility for the slight differences may be the fact that the measurement series of the thermal-imaging camera and of the thermocouple sensors did not take place at the same time. Therefore, deviations between the two measurement methods can occur due to fluctuations in the room temperature depending on the time of day or due to air flow in the surrounding area, caused, for example, by the room ventilation in the laboratory. To compensate for the influences of the air flow, the thermocouple data are averaged over a longer measurement period (1 min), while the thermographic images are averaged on the basis of three successive measurements.
Nevertheless, the results show that the thermocouple sensors are also suitable for determining and approximating the temperature profile along the sensor axis despite its lower spatial resolution. In a further series of experiments, the protection cap with the infrared-transmissive disk was used.
3.3 Comparison of thermal image and thermocouples with protection cap
Identically to the previous series of measurements, a comparison of the two measurement methods follows but now using the protection cap with the infrared-transmissive window. A thermal image of a sensor element with screen-printed thermocouples at 600 ∘C can be seen in Fig. 8.
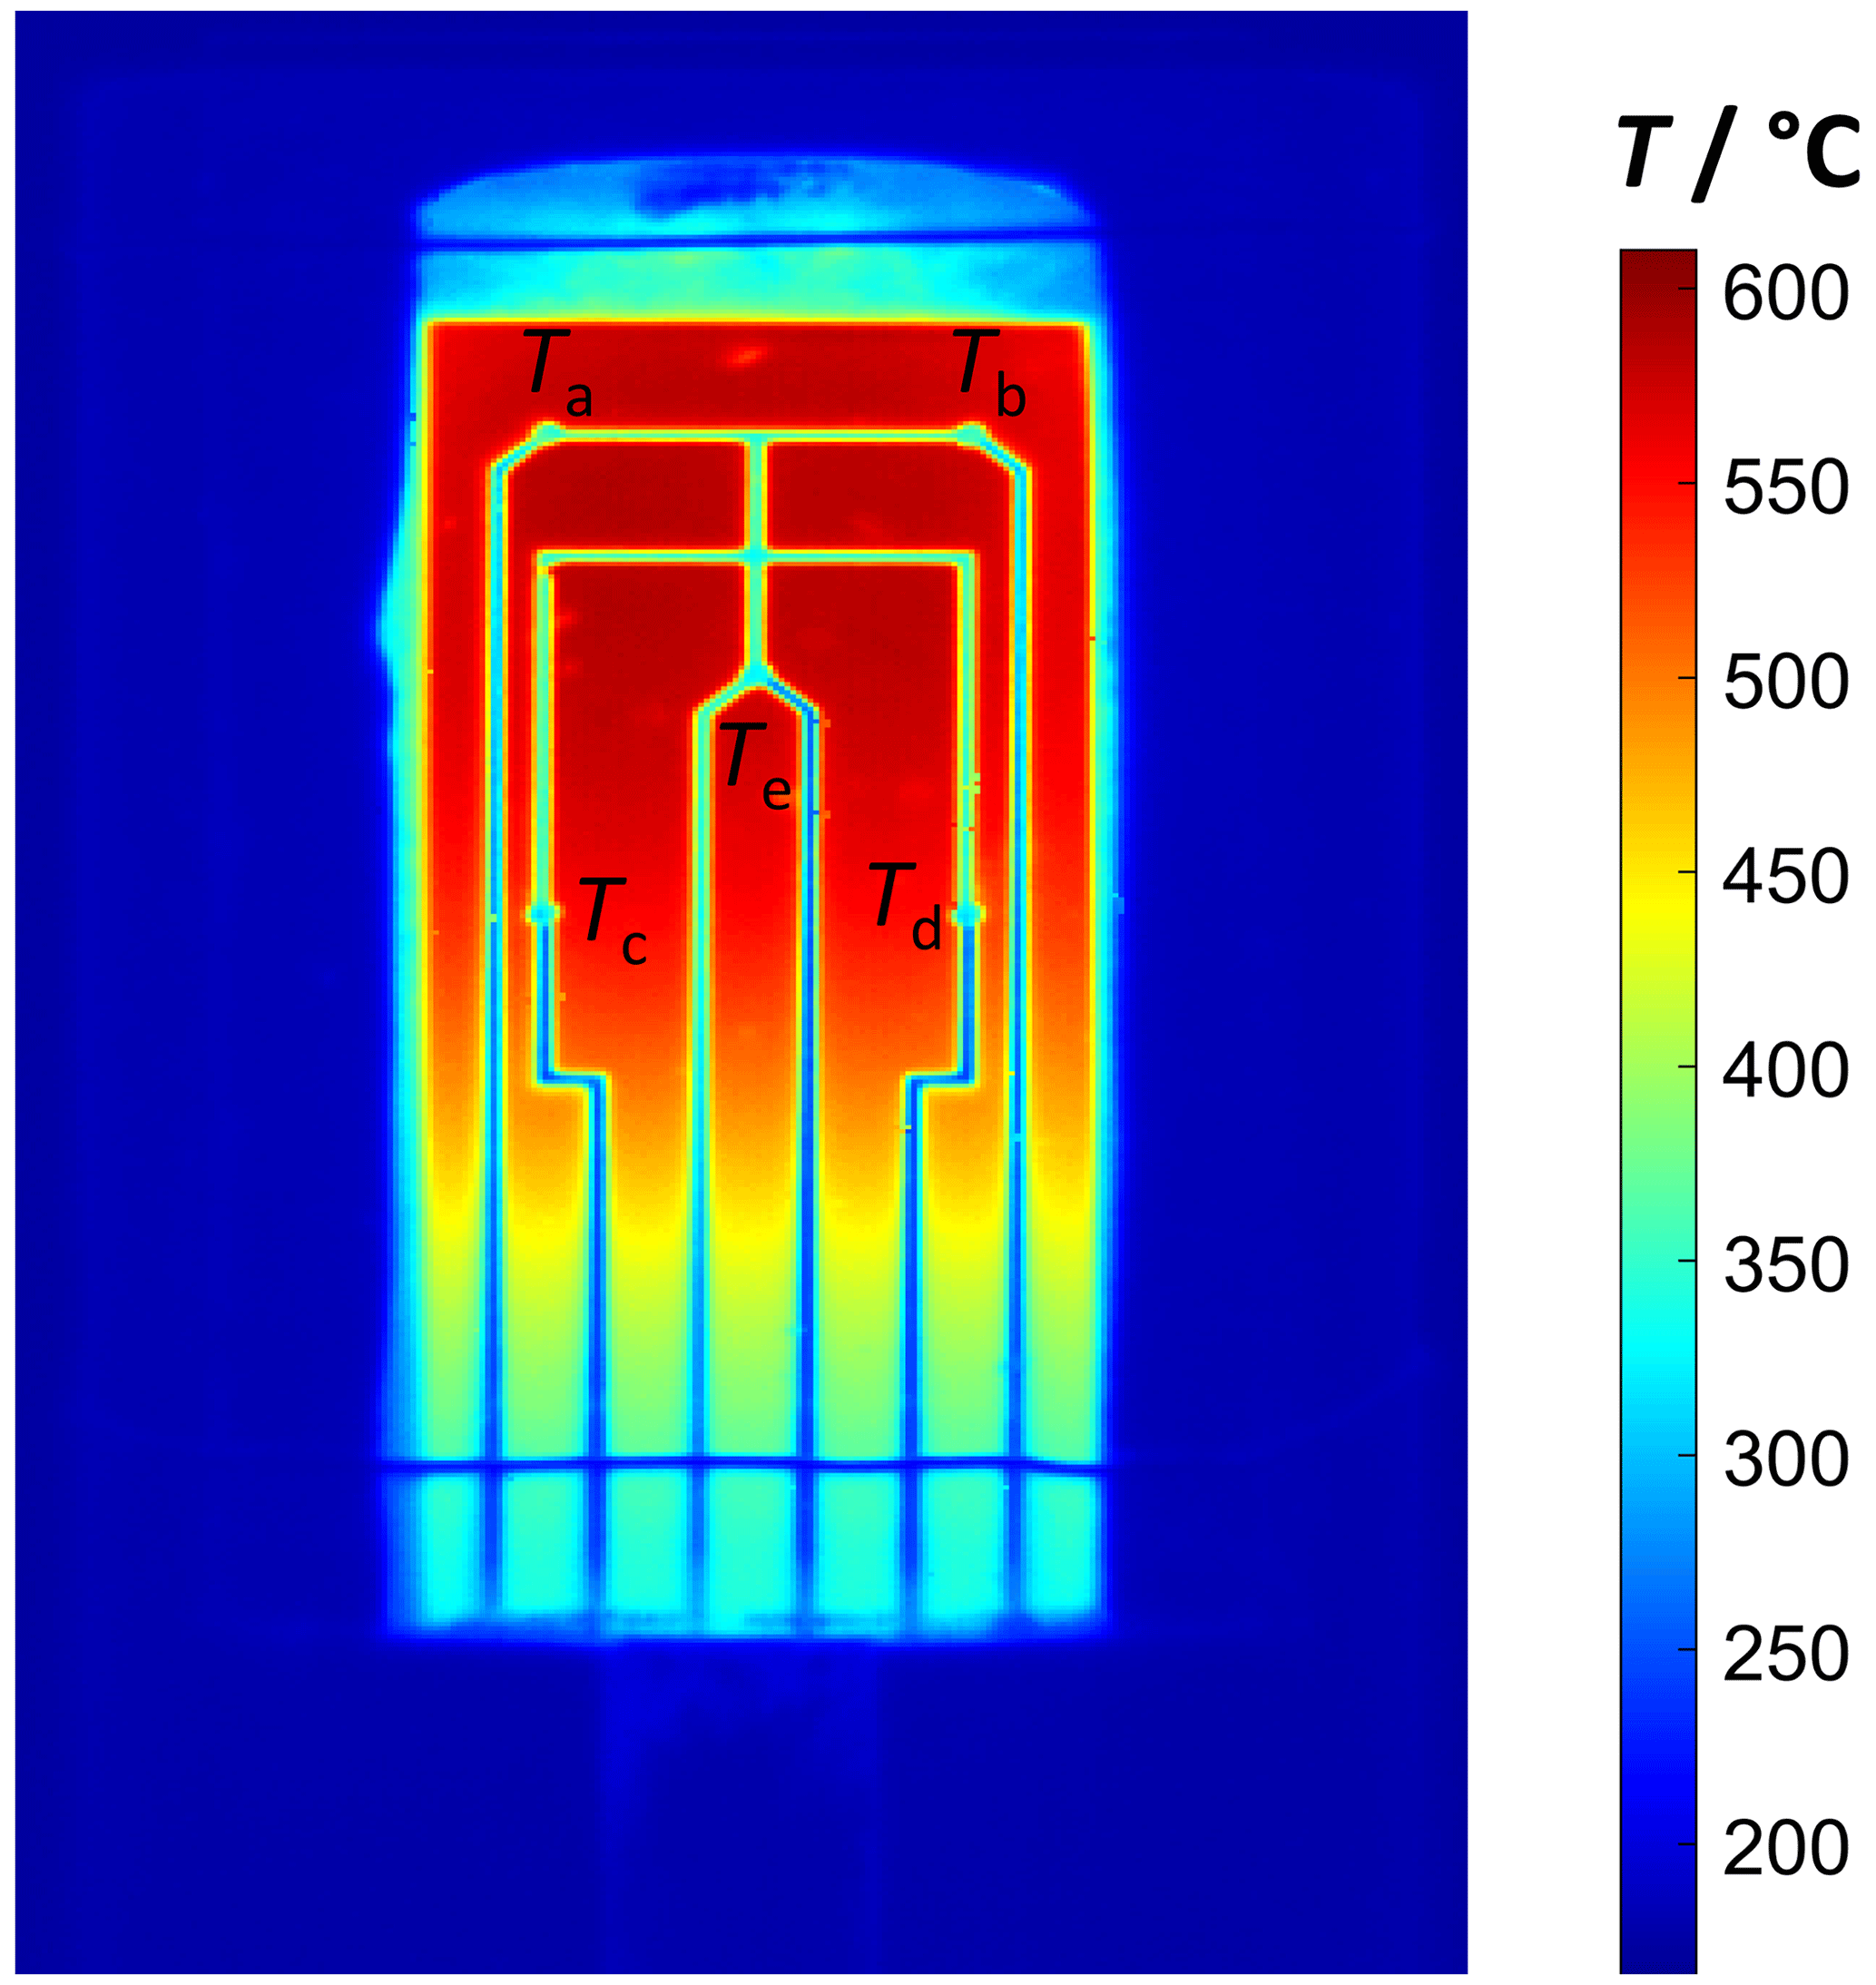
Figure 8Thermal image of a sensor of type from Fig. 4e with screen-printed thermocouples inside a protection cap with infrared-transmissive window at 600 ∘C.
Two effects must be considered when evaluating the data. Firstly, the thermocouple leads are clearly visible in the thermal image. Since the emissivity of the gold and platinum leads differs significantly from that of the alumina substrate, the output of the thermal-imaging camera is incorrect here. The emissivity of these screen-printed thermocouple materials is not known exactly, and the spatial dependence of this during the measurement can only be considered to a limited extent. Therefore, the corresponding temperatures are calculated here on the basis of averaging in an area around the measuring point and compared with the results of the thermocouple measuring points. The temperatures of the thermocouples (TTh) and the thermal images (TIR) are shown in Table 1. Here, the temperature values measured by the thermal-imaging camera and the thermocouple sensors inside the protection cap are compared.
On the other hand, impurities on the glass or the wires for mounting can influence the transmission behavior of the electromagnetic waves. As a result, the measured temperature is a little too low. This can be observed exemplarily in Fig. 8 at the upper edge of the sensor and also in the lower area of the window.
Table 1Comparison of the temperature values measured by the thermal-imaging camera and the thermocouple sensors inside the protection cap at 550, 600 and 650 ∘C.
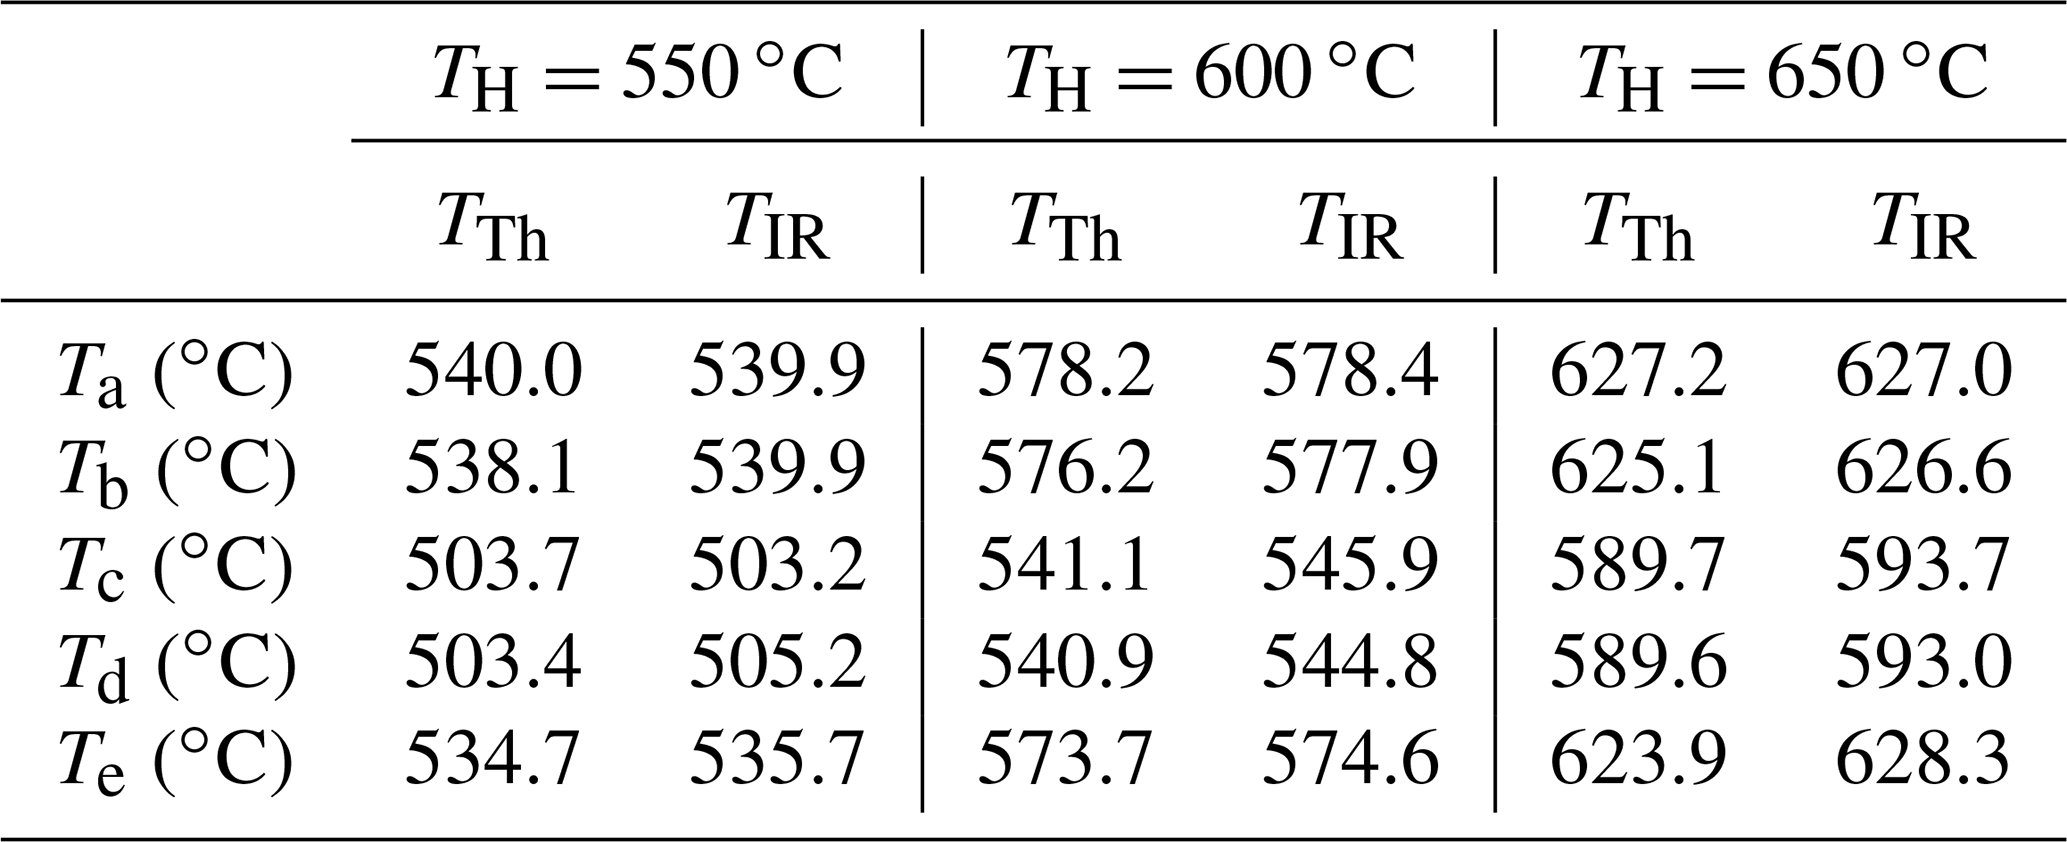
The temperatures obtained by both measurement methods in Table 1 also agree nicely here. The average deviation in this temperature range for the temperature values of the four sensors in the area of the functional film (see Fig. 4b–e) is 3.4 ∘C, where the measurement uncertainty for the thermocouple sensors is 0.2 ∘C and 2.5 ∘C for the thermal-imaging camera. In summary, it can be said that it was also possible to show that both measurement principles are suitable for determining the temperature distribution on the sensor surface.
3.4 Validation of the thermocouple sensor-setup as an outlook to further applications
For the following series of measurements, the influence of different gas flow velocities (0 to approx. 10 cm s−1 N2) on the temperature profile of the sensor should be investigated in more detail. For that purpose, a test rig is used in which various types of gas sensors can be characterized. Special fittings for mounting the sensors are provided on a cylindrical measuring chamber with an inner diameter of 40 mm. Identically to the measurements shown above, the sensor is installed horizontally. The gas flow to the sensor approaches from below so that the gas hits the reverse side, i.e., on the heater structure. However, due to the tubing with stainless steel pipes, this test rig provides no optical access to the sensor. Therefore, only the sensors with screen-printed thermocouples are used for this series of measurements. From the previously shown measurements, it was possible to reproduce the temperature curve well through the different sensor structures.
Measurements were performed both with and without the use of a protection cap. Since thermal imaging is not performed, a protection cap without the IR-permeable window is used (see Fig. 2a). In order to be able to approximate the temperature profile along the sensor in a better way, the measurement on the influence of the flow-dependent behavior is repeated with all different types of thermocouple sensors that are shown in Fig. 4.
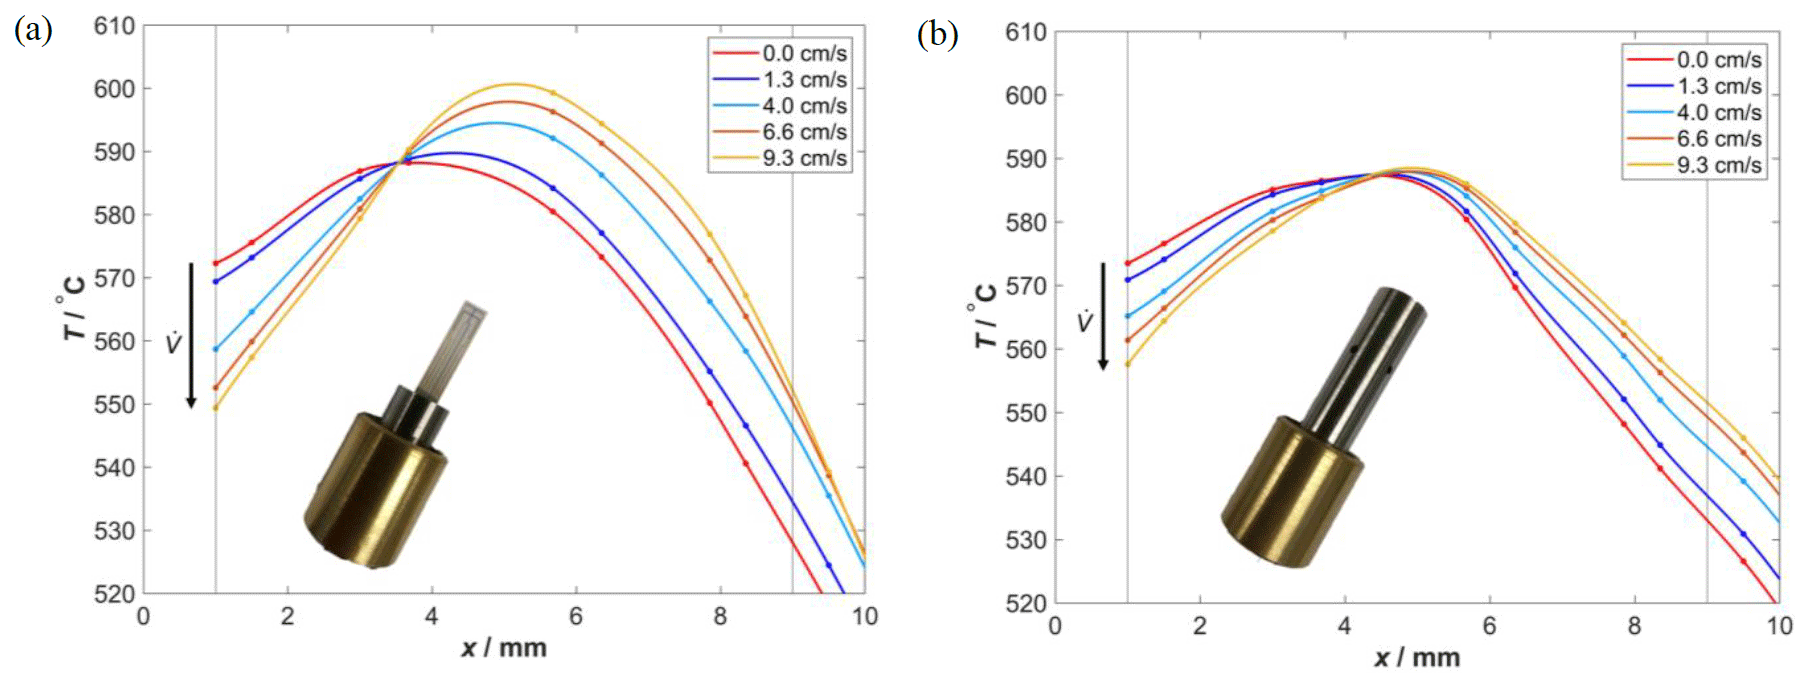
Figure 9Approximation to the temperature curves along the sensor inside a measuring chamber at different flow rates, determined on the basis of the thermocouple sensors at 600 ∘C (a) without a protection cap and (b) with a protection cap.
With the help of these sensors, the temperature curves along the sensor axis were approximated without using a protection cap in Fig. 9a. For comparison, the corresponding temperature curves with the protection cap are shown in Fig. 9b. Varying the flow rate changes the temperature profile of the sensor noticeably. As a result of the increasing flow velocities within the measuring chamber from 0 to 9.3 cm s−1, it can be seen in both diagrams that the temperature in the front area of the sensor (0.5 mm mm) decreases. In contrast, the temperature level in the rear area (x>4.0 mm) rises likewise.
This result is an unwanted side effect caused by the four-wire operation of the heater structure. As already mentioned, the four-wire control keeps the resistance of the entire heating loop constant regardless of the current gas flow conditions. Since the resistance is measured over a large area of the heater structure (0.5 mm mm), only an average value is considered here; this value does not include information about temperature gradients within the heater structure (see Sect. 2.1).
The front area of the sensor is more influenced by the air flow than the rear area of the substrate, both with and without the protection cap. This leads to an increased heat convection at the sensor tip and further to a reduction of the temperature (Marek and Nitsche, 2019). As a result, the resistance R4L of the heater structure decreases. The four-wire control compensates for this effect by increasing the two-wire current I and accordingly providing more power to the heater structure. However, this readjustment affects the entire area of the functional film. As a consequence, heat is also transferred from the heater structure to the part of the sensor that is less affected by the flow. Thus, the temperature level in the rear area of the sensor rises above the initial value, while the more flow-influenced part at the sensor tip still remains below the initial level even though the averaged resistance across the heater structure remained constant. Figure 9a and b show that, both with and without the use of a protection cap, this effect increases with higher flow velocities.
However, with the help of the protection cap, a more homogeneous flow-dependent temperature profile is obtained compared to the curves without the protection cap. The inlets on the side of the protection cap (see Fig. 2a) reduce the flow velocity at the surface of the sensor and consequently the influence on the temperature profile.
The temperature sensitivity of many gas-sensitive functional films poses a major problem in the operation of high-temperature gas sensors under harsh environmental conditions (Ghosh et al., 2019). Two different methods were investigated and compared to determine various influences on the temperature profile. First, the temperature-dependent radiation behavior of the sensor surface was chosen for spatially resolved temperature determination. As a second alternative, several special sensors were manufactured, each equipped with five screen-printed thermocouples.
Both systems offer different advantages and disadvantages, depending on the application. However, for the improved local resolution of a thermal-imaging camera, it is inevitable that optical access up to the sensor surface will be provided. In this case, this was achieved with the aid of an infrared-transmissive window in the protection cap. Although the use of identical sensor substrates with integrated thermocouples means that the local resolution of the temperature measurement points is reduced, these sensor types are more flexible in their application.
A good agreement between the two measurement systems was demonstrated. The deviation between the measuring systems was below 7 K for measurements both without and with a protection cap. The determination of the temperature profile along the sensor and the influence of a protection cap on the temperature profile, shown here as an example, could be determined with both measurement variants due to the small relative deviation between both methods. Furthermore, it was shown with the help of the thermocouple sensors that the flow within a measuring chamber also causes a significant change in the temperature profile along the sensor element, but this can be reduced by using a suitable protection cap.
With the help of these two measuring principles, it will be possible to investigate other factors in more detail in the future, e.g., sensor installation position and housing temperature. Based on these data, it is possible to develop specially adapted protection caps to reduce flow influences on the temperature profile while maintaining a high sensitivity to the gas component to be measured.
All relevant data presented in the article are stored according to institutional requirements and as such are not available online. However, all data used in this paper can be made available upon request to the authors.
Conceptualization: TW, JH, JK, GH and RM. Sensor preparation: TW, JH and JK. Measurements and formal analysis: TW and JH, in close discussion with GH and RM. Writing – original draft preparation: TW. Supervision: RM. All the authors have read and agreed to the submitted version of the paper.
The contact author has declared that none of the authors has any competing interests.
Publisher’s note: Copernicus Publications remains neutral with regard to jurisdictional claims in published maps and institutional affiliations.
This research was funded by Bundesministerium für Ernährung und Landwirtschaft (BMEL), Germany, under the project “Emissionsminderungsstrategien zur umweltverträglichen Verbrennung (UVV) auf Basis von aktuellen Forschungsergebnissen” (grant no. 22038518).
This research has been supported by the Bundesministerium für Ernährung und Landwirtschaft (grant no. 22038518).
This open-access publication was funded by the University of Bayreuth.
This paper was edited by Gabriele Schrag and reviewed by two anonymous referees.
Baehr, H. D. and Stephan, K.: Wärme- und Stoffübertragung, 10th edn., Springer, Berlin, Heidelberg, p. 621, https://doi.org/10.1007/978-3-662-58441-5, 2019.
Bai, L., Wang, J., Ma, X., and Lu, H.: Air Pollution Forecasts: An Overview, Int. J. Env. Res. Pub. He., 15, 780, https://doi.org/10.3390/ijerph15040780, 2018.
Bernhard, F.: Handbuch der Technischen Temperaturmessung, Springer, Berlin, Heidelberg, 891–899, 1183, 1367–1369, https://doi.org/10.1007/978-3-642-24506-0, 2014.
d'Apolito, L. and Hong, H.: Electro-thermo-mechanical modelling of automotive exhaust sensors, Engineering Research Express, 3, 25002, https://doi.org/10.1088/2631-8695/abf2cd, 2021.
Doronkin, D. E. and Casapu, M.: Present Challenges in Catalytic Emission Control for Internal Combustion Engines, Catalysts, 11, 1019, https://doi.org/10.3390/catal11091019, 2021.
Fine, G. F., Cavanagh, L. M., Afonja, A., and Binions, R.: Metal oxide semi-conductor gas sensors in environmental monitoring, Sensors, 10, 5469–5502, https://doi.org/10.3390/s100605469, 2010.
Franco, A. and Giannini, N.: Perspectives for the use of biomass as fuel in combined cycle power plants, Int. J. Therm. Sci., 44, 163–177, https://doi.org/10.1016/j.ijthermalsci.2004.07.005, 2005.
Frank, J., Fleischer, M., and Meixner, H.: Gas-sensitive electrical properties of pure and doped semiconducting Ga2O3 thick films, Sensor. Actuat. B-Chem., 48, 318–321, https://doi.org/10.1016/S0925-4005(98)00064-1, 1998.
Franke, M. E. and Simon, U.: Solvate-supported proton transport in zeolites, ChemPhysChem, 5, 465–472, https://doi.org/10.1002/cphc.200301011, 2004.
Gerblinger, J., Hausner, M., and Meixner, H.: Electric and Kinetic Properties of Screen-Printed Strontium Titanate Films at High Temperatures, J. Am. Ceram. Soc., 78, 1451–1456, https://doi.org/10.1111/j.1151-2916.1995.tb08836.x, 1995.
Ghosh, A., Zhang, C., Shi, S. Q., and Zhang, H.: High-Temperature Gas Sensors for Harsh Environment Applications: A Review, Clean – Soil, Air, Water, 47, 1800491, https://doi.org/10.1002/clen.201800491, 2019.
Günzler, H. and Gremlich, H.-U.: IR-Spektroskopie, 2nd edn., Wiley-VCH, Weinheim, 93–137, https://doi.org/10.1002/9783527662852, 2003.
Hagen, G., Harsch, A., and Moos, R.: A pathway to eliminate the gas flow dependency of a hydrocarbon sensor for automotive exhaust applications, J. Sens. Sens. Syst., 7, 79–84, https://doi.org/10.5194/jsss-7-79-2018, 2018.
Hagen, G., Herrmann, J., Zhang, X., Kohler, H., Hartmann, I., and Moos, R.: Application of a Robust Thermoelectric Gas Sensor in Firewood Combustion Exhausts, Sensors, 23, 2930, https://doi.org/10.3390/s23062930, 2023.
Hannoschöck, N.: Wärmeleitung und -transport: Grundlagen der Wärme- und Stoffübertragung, Springer, Berlin, Heidelberg, p. 238, https://doi.org/10.1007/978-3-662-57572-7, 2018.
Herrmann, J., Hagen, G., Kita, J., Noack, F., Bleicker, D., and Moos, R.: Multi-gas sensor to detect simultaneously nitrogen oxides and oxygen, J. Sens. Sens. Syst., 9, 327–335, https://doi.org/10.5194/jsss-9-327-2020, 2020.
InfraTec: Datasheet VarioCAM High Defintion, https://www.infratec.de/downloads/de/thermografie/flyer/vc-hd/infratec-variocam-hd-b-de-mail.pdf (last access: 25 January 2023), 2022.
Jerger, A., Kohler, H., Becker, F., Keller, H. B., and Seifert, R.: New applications of tin oxide gas sensors, Sensor. Actuat. B-Chem., 81, 301–307, https://doi.org/10.1016/S0925-4005(01)00970-4, 2002.
Johnson, T. V.: Review of diesel emissions and control, Int. J. Engine Res., 10, 275–285, https://doi.org/10.1243/14680874JER04009, 2009.
Jones, J. M., Lea-Langton, A. R., Ma, L., Pourkashanian, M., and Williams, A.: Pollutants Generated by the Combustion of Solid Biomass Fuels, Springer, London, 63–69, https://doi.org/10.1007/978-1-4471-6437-1, 2014.
Kita, J., Engelbrecht, A., Schubert, F., Groß, A., Rettig, F., and Moos, R.: Some practical points to consider with respect to thermal conductivity and electrical resistivity of ceramic substrates for high-temperature gas sensors, Sensor. Actuat. B-Chem., 213, 541–546, https://doi.org/10.1016/j.snb.2015.01.041, 2015a.
Kita, J., Wiegärtner, S., Moos, R., Weigand, P., Pliscott, A., LaBranche, M. H., and Glicksman, H. D.: Screen-printable Type S Thermocouple for Thick-film Technology, Procedia Engineer., 120, 828–831, https://doi.org/10.1016/j.proeng.2015.08.692, 2015b.
Korth Kristalle: Datasheet Transmissionsspektrum 2mm NaCl, https://www.korth.de/material/detail/Natriumchlorid (last access: 10 February 2023), 2021.
Lackner, M., Palotás, Á. B., and Winter, F.: Combustion, Wiley-VCH, Weinheim, 97–106, https://doi.org/10.1002/9783527667185, 2013.
Mamishev, A. V., Sundara-Rajan, K., Yang, F., Du, Y., and Zahn, M.: Interdigital sensors and transducers, P. IEEE, 92, 808–845, https://doi.org/10.1109/JPROC.2004.826603, 2004.
Marek, R. and Nitsche, K.: Praxis der Wärmeübertragung: Grundlagen – Anwendungen – Übungsaufgaben, 5th edn., Carl Hanser, München, 20–21, 244–247, https://doi.org/10.3139/9783446445529.fm, 2019.
Merker, G. P. and Teichmann, R.: Grundlagen Verbrennungsmotoren: Funktionsweise und alternative Antriebssysteme Verbrennung, Messtechnik und Simulation, 9th edn., Springer Fachmedien, Wiesbaden, 979–998, https://doi.org/10.1007/978-3-658-23557-4, 2019.
Moos, R.: A Brief Overview on Automotive Exhaust Gas Sensors Based on Electroceramics, Int. J. Appl. Ceram. Tec., 2, 401–413, https://doi.org/10.1111/j.1744-7402.2005.02041.x, 2005.
Moos, R., Izu, N., Rettig, F., Reiss, S., Shin, W., and Matsubara, I.: Resistive oxygen gas sensors for harsh environments, Sensors, 11, 3439–3465, https://doi.org/10.3390/s110403439, 2011.
Müller, V., Pieta, H., Schaub, J., Ehrly, M., and Körfer, T.: On-Board Monitoring to meet upcoming EU-7 emission standards – Squaring the circle between effectiveness and robust realization, Transport. Eng., 10, 100138, https://doi.org/10.1016/j.treng.2022.100138, 2022.
Picon, A., Alvarez-Gila, A., Arteche, J. A., Lopez, G. A., and Vicente, A.: A Probabilistic Model and Capturing Device for Remote Simultaneous Estimation of Spectral Emissivity and Temperature of Hot Emissive Materials, IEEE Access, 9, 100513–100529, https://doi.org/10.1109/ACCESS.2021.3096599, 2021.
Rettig, F. and Moos, R.: Direct Thermoelectric Hydrocarbon Gas Sensors Based on SnO2, IEEE Sens. J., 7, 1490–1496, https://doi.org/10.1109/JSEN.2007.906887, 2007.
Riegel, J., Neumann, H., and Wiedenmann, H.-M.: Exhaust gas sensors for automotive emission control, Solid State Ionics, 152–153, 783–800, https://doi.org/10.1016/S0167-2738(02)00329-6, 2002.
Ritter, T., Wiegärtner, S., Hagen, G., and Moos, R.: Simulation of a thermoelectric gas sensor that determines hydrocarbon concentrations in exhausts and the light-off temperature of catalyst materials, J. Sens. Sens. Syst., 6, 395–405, https://doi.org/10.5194/jsss-6-395-2017, 2017.
Schrüfer, E., Reindl, L., and Zagar, B.: Elektrische Messtechnik: Messungen elektrischer und nichtelektrischer Größen, 10th edn., Carl Hanser, München, p. 148, https://doi.org/10.3139/9783446474437, 2022.
Simon, U., Sanders, D., Jockel, J., Heppel, C., and Brinz, T.: Design strategies for multielectrode arrays applicable for high-throughput impedance spectroscopy on novel gas sensor materials, J. Comb. Chem., 4, 511–515, https://doi.org/10.1021/cc020025p, 2002.
United Nations Economic Commission for Europe: Regelung Nr. 49 der Wirtschaftskommission der Vereinten Nationen für Europa (UN/ECE) – Einheitliche Bestimmungen hinsichtlich der Maßnahmen, die gegen die Emission von gas- und partikelförmigen Schadstoffen aus Selbstzündungs- und aus Fremdzündungsmotoren zum Antrieb von Fahrzeugen zu treffen sind, p. 136, http://data.europa.eu/eli/reg/2013/49(2)/oj (last access: 17 May 2023), 2013.
Vassilev, S. V., Baxter, D., Andersen, L. K., and Vassileva, C. G.: An overview of the chemical composition of biomass, Fuel, 89, 913–933, https://doi.org/10.1016/j.fuel.2009.10.022, 2010.
Werner, R., Kita, J., Gollner, M., Linseis, F., and Moos, R.: Novel, low-cost device to simultaneously measure the electrical conductivity and the Hall coefficient from room temperature up to 600 ∘C, J. Sens. Sens. Syst., 10, 71–81, https://doi.org/10.5194/jsss-10-71-2021, 2021.
Wiegärtner, S., Hagen, G., Kita, J., Reitmeier, W., Hien, M., Grass, P., and Moos, R.: Thermoelectric hydrocarbon sensor in thick-film technology for on-board-diagnostics of a diesel oxidation catalyst, Sensor. Actuat. B-Chem., 214, 234–240, https://doi.org/10.1016/j.snb.2015.02.083, 2015.
Windisch, H.: Thermodynamik, 6th edn., Walter de Gruyter, Berlin, Boston, p. 303, https://doi.org/10.1515/9783110533576-202, 2017.