the Creative Commons Attribution 4.0 License.
the Creative Commons Attribution 4.0 License.
 | 25 Jan 2023
Resonant photoacoustic cells for laser-based methane detection
Katrin Schmitt
Mara Sendelbach
Christian Weber
Jürgen Wöllenstein
Thomas Strahl
Against the background of the steady increase in greenhouse gases in the atmosphere, a fast and inexpensive method for detecting methane is required. This applies to the direct measurement of the background concentration of methane in the atmosphere and also to the detection of leaks in natural gas pipelines. Photoacoustic (PA) sensors offer the possibility of highly sensitive gas detection and cost-effective design at the same time. In this work, we investigated a photoacoustic sensor for methane in low concentrations, focusing on a special cell design, the so-called T-cell. Different cylinder geometries of six T-cells and the influence on the sensor performance were examined. An interband cascade laser (ICL) with a central wavelength of 3270 nm was used for excitation and a micro-electromechanical systems (MEMS) microphone as detector. The detection limits achieved were below the methane background concentration in air of 1.8 ppm.
- Article
(1498 KB) - Full-text XML
-
Supplement
(546 KB) - BibTeX
- EndNote


Methane detection becomes increasingly important due to the increased occurrence of methane in the atmosphere and its high global warming potential (GWP). The Intergovernmental Panel on Climate Change (IPCC) has indicated a GWP for methane between 28–36 when considering its impact over a 100-year time frame, and in the short term (20 years) even between 84–87 (IEA, 2021). Methane is a colorless and odorless gas and is the main component of natural gas. Its negative effects on the climate are still often neglected, though it is the second largest anthropogenic contributor to global warming (Jorgenson, 2006). Today, the mean concentration in the atmosphere is determined via satellites, but there is still a lack of measurements at ground level, e.g. in tropical or polar regions, to better understand the contribution of wetlands and methane hydrates to the rising atmospheric methane background (Feng et al., 2022). Concerning anthropogenic emissions from global oil and gas operations, the IPCC estimates that it should be technically possible to capture a large share of methane emissions at no net cost, since the market value of the retained gas is higher than the cost for abatement measures. Large amounts originate from leaks in natural gas pipelines and installations, requiring the use of suitable detectors for finding such leaks (Thomas and Haider, 2014).
Apart from chemical sensors for methane detection (e.g. pellistors or semiconductor sensors), optical sensors that make use of the strong absorption of infrared radiation are well established to detect methane. Usually, the decrease in light intensity after the light has passed the gas sample is measured. A direct correlation between decreased light intensity and the sample gas concentration is given by the Beer–Lambert law, which is the basis for quantitative absorption spectroscopy (Ripperger and Germerdonk, 1983). Absorption spectroscopy can be realized in different ways. One is called tunable diode laser absorption spectroscopy (TDLAS). Here, a single absorption line of the gas is analyzed by tuning the laser wavelength across the absorption line (Lackner, 2007; Dong et al., 2016). Another common method for optical methane detection is the non-dispersive infrared (NDIR) measuring principle, also called filter photometer, in which one or several different gases can be measured using a broadband thermal emitter. The required wavelength selection is accomplished through the use of optical filters (Zhao et al., 2011; Wittstock et al., 2017; Ye et al., 2020). With Fourier transform infrared spectroscopy (FTIR), an entire spectrum can be analyzed at once, and the sample gas concentrations can be determined (Petersen et al., 2010).
Another possibility of methane detection which uses the absorption of infrared radiation is the photoacoustic principle (Wolff et al., 2013). Here, the gas absorbs infrared radiation at specific wavelengths, resulting in a rise in temperature. When the light source is turned off, the gas undergoes non-radiative relaxation, thereby decreasing its temperature. If the light source is modulated and the gas confined in a defined sample volume, these temperature fluctuations translate into pressure fluctuations, i.e. generating an acoustic signal, which can be easily detected by a sound transducer, e.g. a microphone (Miklós et al., 2001). Using a sound transducer instead of an optical detector has the advantages that it is independent of the wavelength used for excitation, it is cost-effective, and it is usually less susceptible to drift effects. Furthermore, modulation frequencies of the light source in the kHz range are possible when using a sound transducer as detector, and the acoustic signal is less dependent on the optical path length than when measuring the decrease in intensity (Schilt et al., 2006). This enables the implementation of compact systems with high sensitivities and short reaction times, as the sample volume can be kept very small (Dumitras et al., 2007). This offers a great potential for methane sensors suitable for both leak detection purposes and atmospheric measurements.
Basically, photoacoustic sensors can be operated in either non-resonant or resonant mode. Examples for non-resonant devices can be found in (Gassner et al., 2022; El-Safoury et al., 2020) and will not be treated further here. For resonant operation, the modulation frequency is adjusted so that it coincides with an eigenmode of the cell. The photoacoustic (PA) cell is then also called resonator as a standing acoustic wave forms in the cell. In this case, the sensitivity of the PA system depends greatly on the design of the acoustic resonator. Basically three resonator types can be found in photoacoustic gas detection: Helmholtz resonators, one-dimensional cylindrical resonators, and the cavity resonators (Li et al., 2011; Miklós et al., 2001). Due to its simple geometry, the cylindrical resonator is used most frequently. Several approaches exist to further increase the sensitivity with an optimized design, such as additional acoustic buffer volumes or the use of differential cells (Elia et al., 2009). Another, less common cell design is the T-cell, where two cylindrical resonators are arranged perpendicular to each other (Wolff et al., 2005; Baumann et al., 2006, 2008). The goal of this design is to use separate cylinders for signal generation and amplification. Like this, both cylinders can be optimized in view of a suitable resonance frequencies independent of each other, enabling a very compact setup. Resonant PA sensors can be operated using lasers or LEDs at the target gas wavelength. Lasers usually have a higher optical power density and a narrow spectral bandwidth compared to LEDs, but higher costs are incurred.
In the present work, six different T-cell designs for photoacoustic methane detection were both theoretically and experimentally investigated. The aim was to understand the photoacoustic signal generation and resonances in relation to the different cell geometries. Experimentally found resonances could be assigned to the calculated resonance modes of the cells. Another focus was on long-term stability and the detection limit for methane achievable with the different cells.
In the case of resonant photoacoustics, the modulation frequency is adjusted in such a way that it coincides with the eigenfrequencies of the PA cell, i.e. the geometry of the resonator is crucial for signal amplification (Miklós et al., 2001). A T-cell consists of an absorption cylinder in which the PA signal is generated through the absorption of electromagnetic radiation by the target gas and a resonance cylinder mounted perpendicularly in which the acoustic signal amplification takes place (cf. Fig. 1). In the following, the absorption cylinder is treated as a lossless, cylindrical cavity resonator in which all three different acoustic modes can form (longitudinal, azimuthal, radial). The pressure distributions of these modes are illustrated schematically in Fig. 1. The resonance frequencies can be calculated using
where LA and dA are the length and the radius of the absorption cylinder, the indices l, k, and r (which must be non-negative integers) denote the eigenvalues of the longitudinal, azimuthal, and radial modes, respectively, c is the sound velocity, and αkr is the kth zero of the derivative of the rth Bessel function divided by π. Values for αkr to calculate the eigenmodes were taken from Baumann et al. (2006).
The resonance cylinder can be assumed as a one-dimensional cylinder resonator with one open and one closed end. Only longitudinal modes can form in such a resonator. At the closed end of the resonance cylinder, there is a vibration antinode, leading to the highest possible PA signals. For this reason, the microphone is situated at the closed end. The resonance frequencies in this cylinder can be calculated according to
where LR is the length of the resonance cylinder and ΔLR the so-called end correction, which is added for each open end (Morse and Ingard, 1986). This end correction is added to the length LR of the resonance cylinder to account for the mismatch between the one-dimensional acoustic field inside the pipe, and the three-dimensional field outside that is radiated by the open end and can be approximated by ΔLR≅0.3dR , where dR is the diameter of the resonance cylinder.
The noise level of the PA system determines the minimum detectable concentration. Sources of noise are mainly external noise, gas flow noise, electrical noise, and noise caused by absorption by the cell walls. To determine the limit of detection (LOD), either the signal-to-noise ratio (SNR) or the signal to background ratio (SBR) can be used. In the following, the SBR was used and determined with laser radiation, but without absorbing gas in the cell. From the experimental data, the determination of the SBR and the resulting LOD was done as follows:
where a is the slope of the signal vs. concentration graph in the linearly approximated regime, and c the gas concentration. Zerogas denotes the signal obtained without gas flow through the cell. Often, the LOD is determined using 3σ, i.e. at SNR = 3 or SBR = 3.
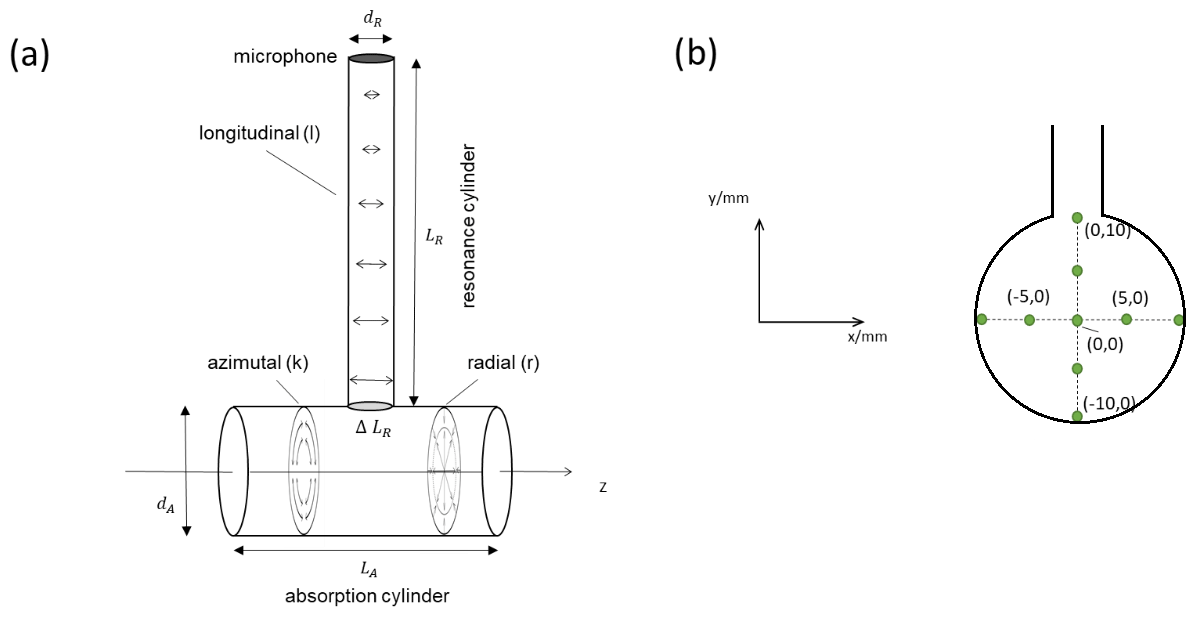
Figure 1(a) Scheme of the T-cell including possible acoustic modes (side view), with d denoting the cylinder diameters and L the cylinder lengths, ΔLR is the end correction. Light passes the absorption cylinder in z direction, (b) Front view on the absorption cylinder with different positions of the laser beam in x and y, as described in the experimental section.
3.1 Design and fabrication of photoacoustic cells
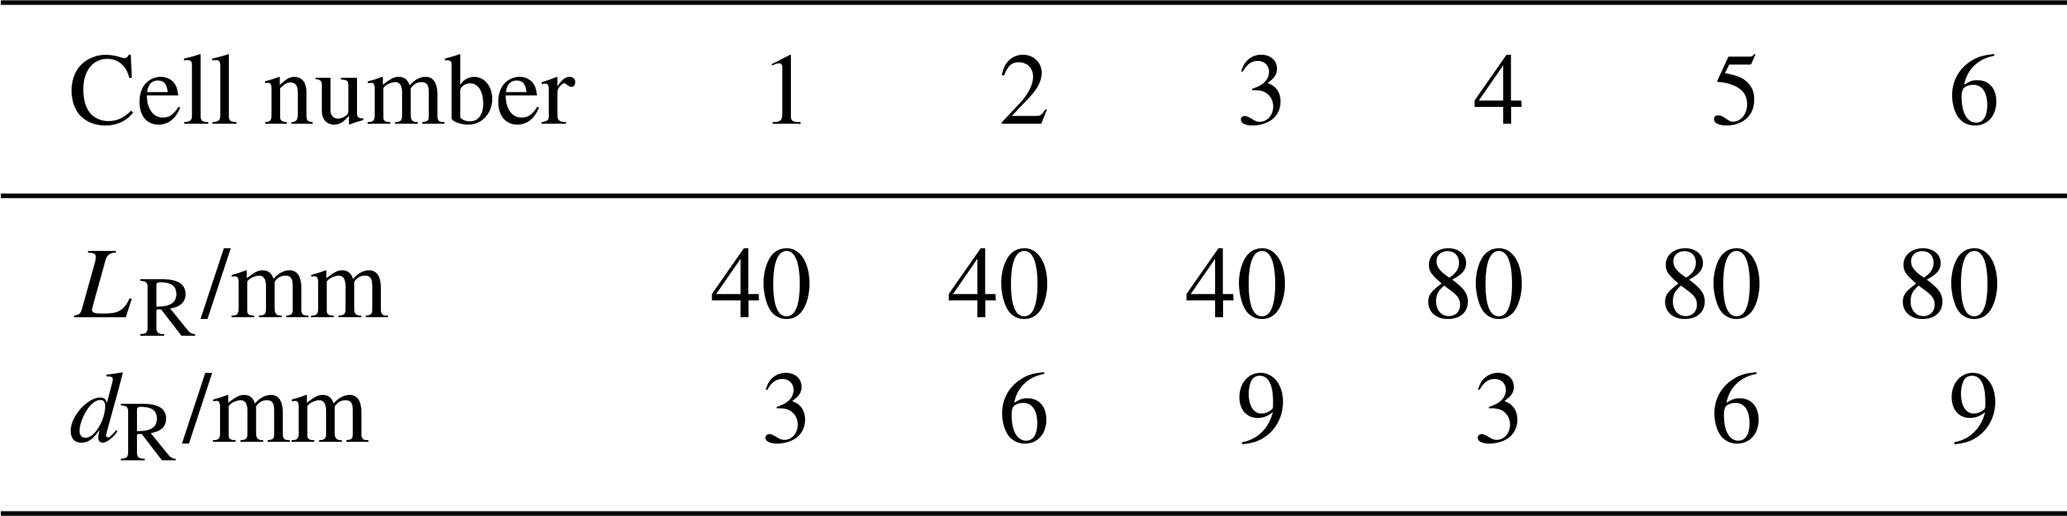
The photoacoustic cells were made of the aluminum alloy AlMgSi1 in four individual parts per cell, and screwed together. These parts were the resonance cylinder, a cover for the resonance cylinder for attaching the microphone circuit board, and two parts of the absorption cylinder into which the optical windows were mounted. The windows were bolted to these parts by a retaining ring in the cell. The recess for the windows and the windows themselves have a wedge to avoid parallel surfaces and thus unwanted interferences. The calcium fluoride windows have a diameter of 25.5 mm, a thickness of 4 mm, and are transparent in a wavelength range from 180 nm to 8 µm. Inlets and outlets (push-in fittings) were placed, with a slight offset from each other, on the sides of the absorption cylinder for gas exchange. The six cells with the different geometries were given a number for easier assignment and have the resonance cylinder dimensions shown in Table 1. Cells 1–3 and 4–6 each have the same resonance cylinder length but different diameters. The geometry of the absorption cylinder as well as the gas inlets are at the same for all cells. The absorption cylinder has a length LA of 20 mm and a diameter dA of 20 mm. The diameter of the cells was chosen comparatively large so that the cells can also be used with LEDs as light source, which cannot be collimated easily. The diameter of the gas inlets and outlets is 1.5 mm for all cells.
Table 1Resonance cylinder length LR and resonance cylinder diameter dR for the six different T-cells, in mm.
3.2 Experimental setup and procedure
In the experiments, a distributed feedback interband cascade laser (DFB-ICL) at 3270 nm and an optical power of P = 5.2 mW (nanoplus, Germany) was used. It offers a narrow line width and can be quickly tuned across fundamental absorption lines of methane. For photoacoustic signal detection, the micro-electromechanical systems (MEMS) microphone ICS-40720 (InvenSense, USA) was implemented. This is an ultra-low noise, bottom-ported microphone with differential analog output, and it was mounted on a circuit board with a hole. The circuit board is also used to amplify the photoacoustic signal. There are two amplifier stages on the circuit board. An instrumentation amplifier first amplifies the signal 10 times. Due to the high noise of the microphone at low frequencies, the first amplifier stage is followed by a second-order high-pass filter with multiple negative feedback. After filtering, the signal passes a second amplifier stage (50 times) of an inverting amplifier. The lock-in amplifier SR830 (Stanford Research Systems, USA) was used for signal evaluation. A HovaCAL calibration gas generator (IAS, Germany) was used to mix defined methane concentrations with N2 as carrier gas.
A scheme of the setup is given in Fig. S1 in the Supplement. The laser beam is directed onto the photoacoustic T-cell via two gold mirrors. The laser driver (ILX Lightwave LDC 3722, Newport, USA) simultaneously modulates the laser and controls the temperature. A 2f wavelength modulation was carried out. The test gases are transferred from the gas mixing station to the PA cell via polytetrafluoroethylene (PTFE) tubing at a flow rate of 300 mL min−1, which is still in the laminar regime to minimize flow noise. A buffer volume in the system's exhaust air was installed to further reduce noise interference.
The resonances in the PA cell were determined by recording frequency spectra at a methane concentration of 100 ppm. For this purpose, the photoacoustic signal was recorded with varying modulation frequency, with a 2f modulation, the following applies: facoustic=2fmodulation. Frequency scans with a resolution of 5 Hz in a frequency range of 1–400 Hz, a resolution of 10 Hz in a frequency range of 1300–6000 Hz, and a resolution of 50 Hz in a frequency range of 5500–12 000 Hz were carried out.
Spectra were recorded for different laser beam entry positions and for the six different cells. To determine the detection limit, the PA signal was recorded at varying methane concentrations from 1–100 ppm. The modulation frequency used for these measurements resulted from the previously measured frequency spectra. For the analysis of the long-term stability, the PA signal was measured in ambient air recorded over a longer period of time.
4.1 Frequency spectrum of the T-cells
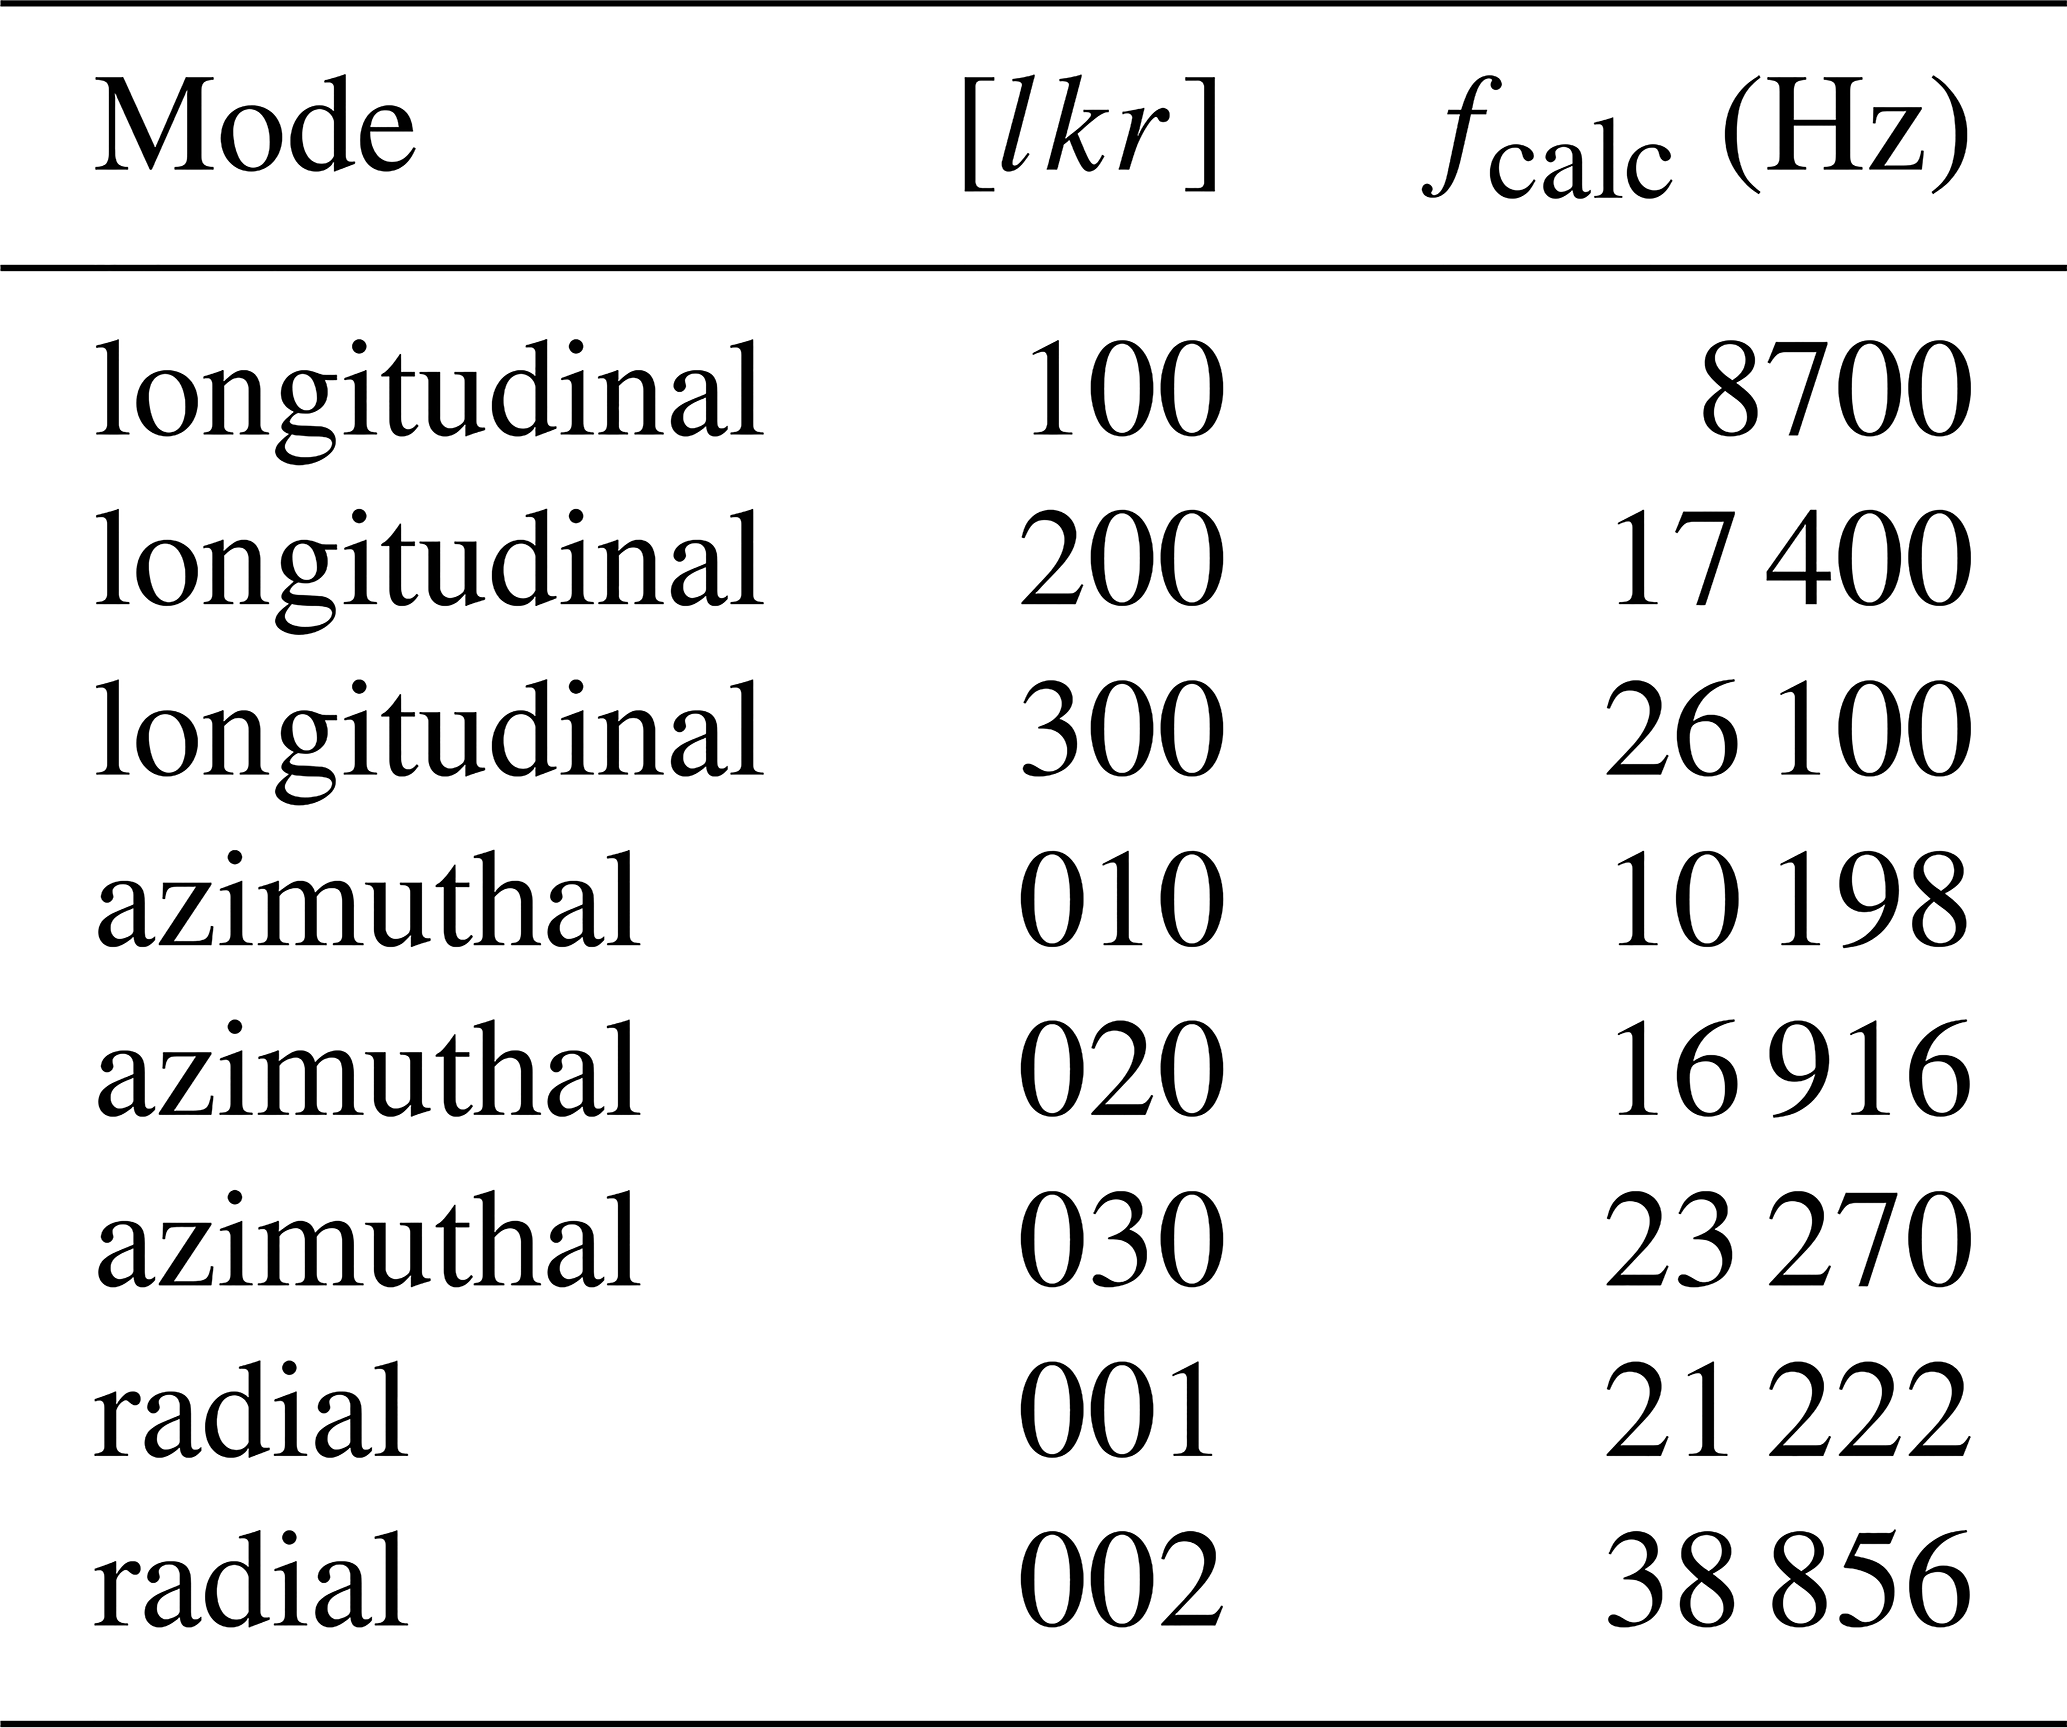
In a first step, the frequencies occurring in the PA cells were investigated. The absorption cylinder has the same dimensions for all six cells. According to Eq. (1), longitudinal, azimuthal, and radial modes can form. The values calculated using this formula are shown in Table 2. The speed of sound of nitrogen (348 m s−1) was used for the calculation.
Table 2Calculated resonance frequency fcalc of the first longitudinal, azimuthal, and radial modes in the absorption cylinder (with c = 348 m s−1 (N2)).
Exemplarily, the frequency spectrum of cell number 4 with a central laser beam position ((x,y) = (0,0)) is shown in Fig. 2a). Due to the cell design, mainly longitudinal modes are excited in the resonance cylinder, as expected. When comparing the occurring resonances from the measurement with the calculated values from Table 3, most of the resonances can be assigned. The signal intensity of the resonance modes decreases as the number of modes increases, since the PA signal is inversely proportional to the frequency and the frequency increases with higher modes (Miklós et al, 2001). The recorded frequency spectrum shows this decrease up to the eighth longitudinal mode with an exception at the fifth mode. Two resonances occur that cannot be assigned to any longitudinal mode (16 908 and 21 201 Hz). The resonance at 21 201 Hz has a much higher signal intensity compared to the surrounding modes. This suggests that it is caused by another acoustic mode. From the values listed in Table 2, it can be assumed that it is a radial mode in the absorption cylinder. The resonance at 16 908 Hz can be assigned to an azimuthal mode, also in the absorption cylinder. According to Table 2, there should be another azimuthal mode at 10 198 Hz, yet this could not be confirmed by the measurements. This could be caused by a weak excitation of this azimuthal mode. The highest signals were obtained for the first longitudinal and the first radial mode. The central laser beam position favors the excitation of the radial mode, whereas azimuthal modes should not be excited with a laser beam along the z axis of the absorption cylinder (Miklós et al., 2001). Nevertheless, the second azimuthal mode is clearly visible. This could be due to a slight deviation of the laser beam from the z axis.
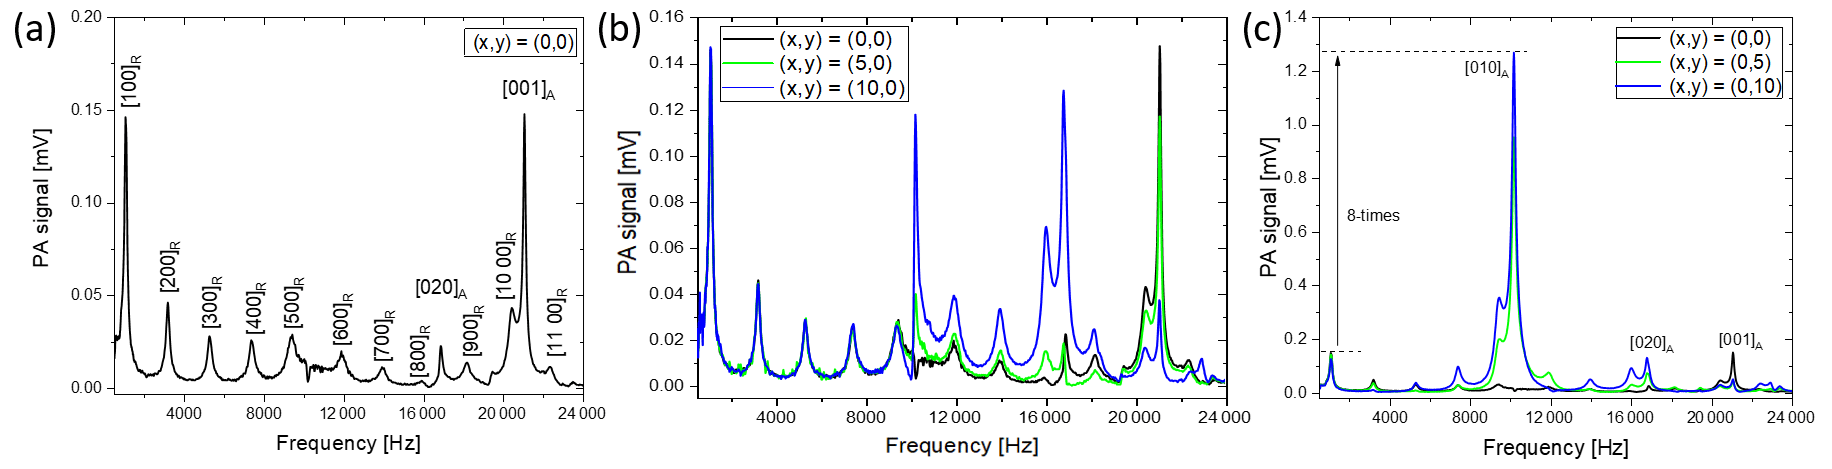
Figure 2Frequency spectra of cell number 4 at a methane concentration of 100 ppm and a flow of 300 mL min−1 at different laser beam positions. (a) (x,y) = (0,0), (b) (x,y) = (0,0), (5,0), and (10,0), and (c) (x,y) = (0,0), (0,5), and (0,10); lkr denotes the longitudinal, azimuthal, and radial modes; and the subscripts A and R denote the absorption and resonance cylinder.
Table 3Overview of the resonance modes of cell number 4 with the designation of the resonance mode and cylinder, the calculated resonance frequency fcalc, the measured resonance frequency fmeas, the difference between the calculated and measured resonance frequency Δf, and the percentage deviation of the calculated from the measured resonance frequency , for the laser beam position (x,y) = (0,10), with c=348 m s−1 (N2).
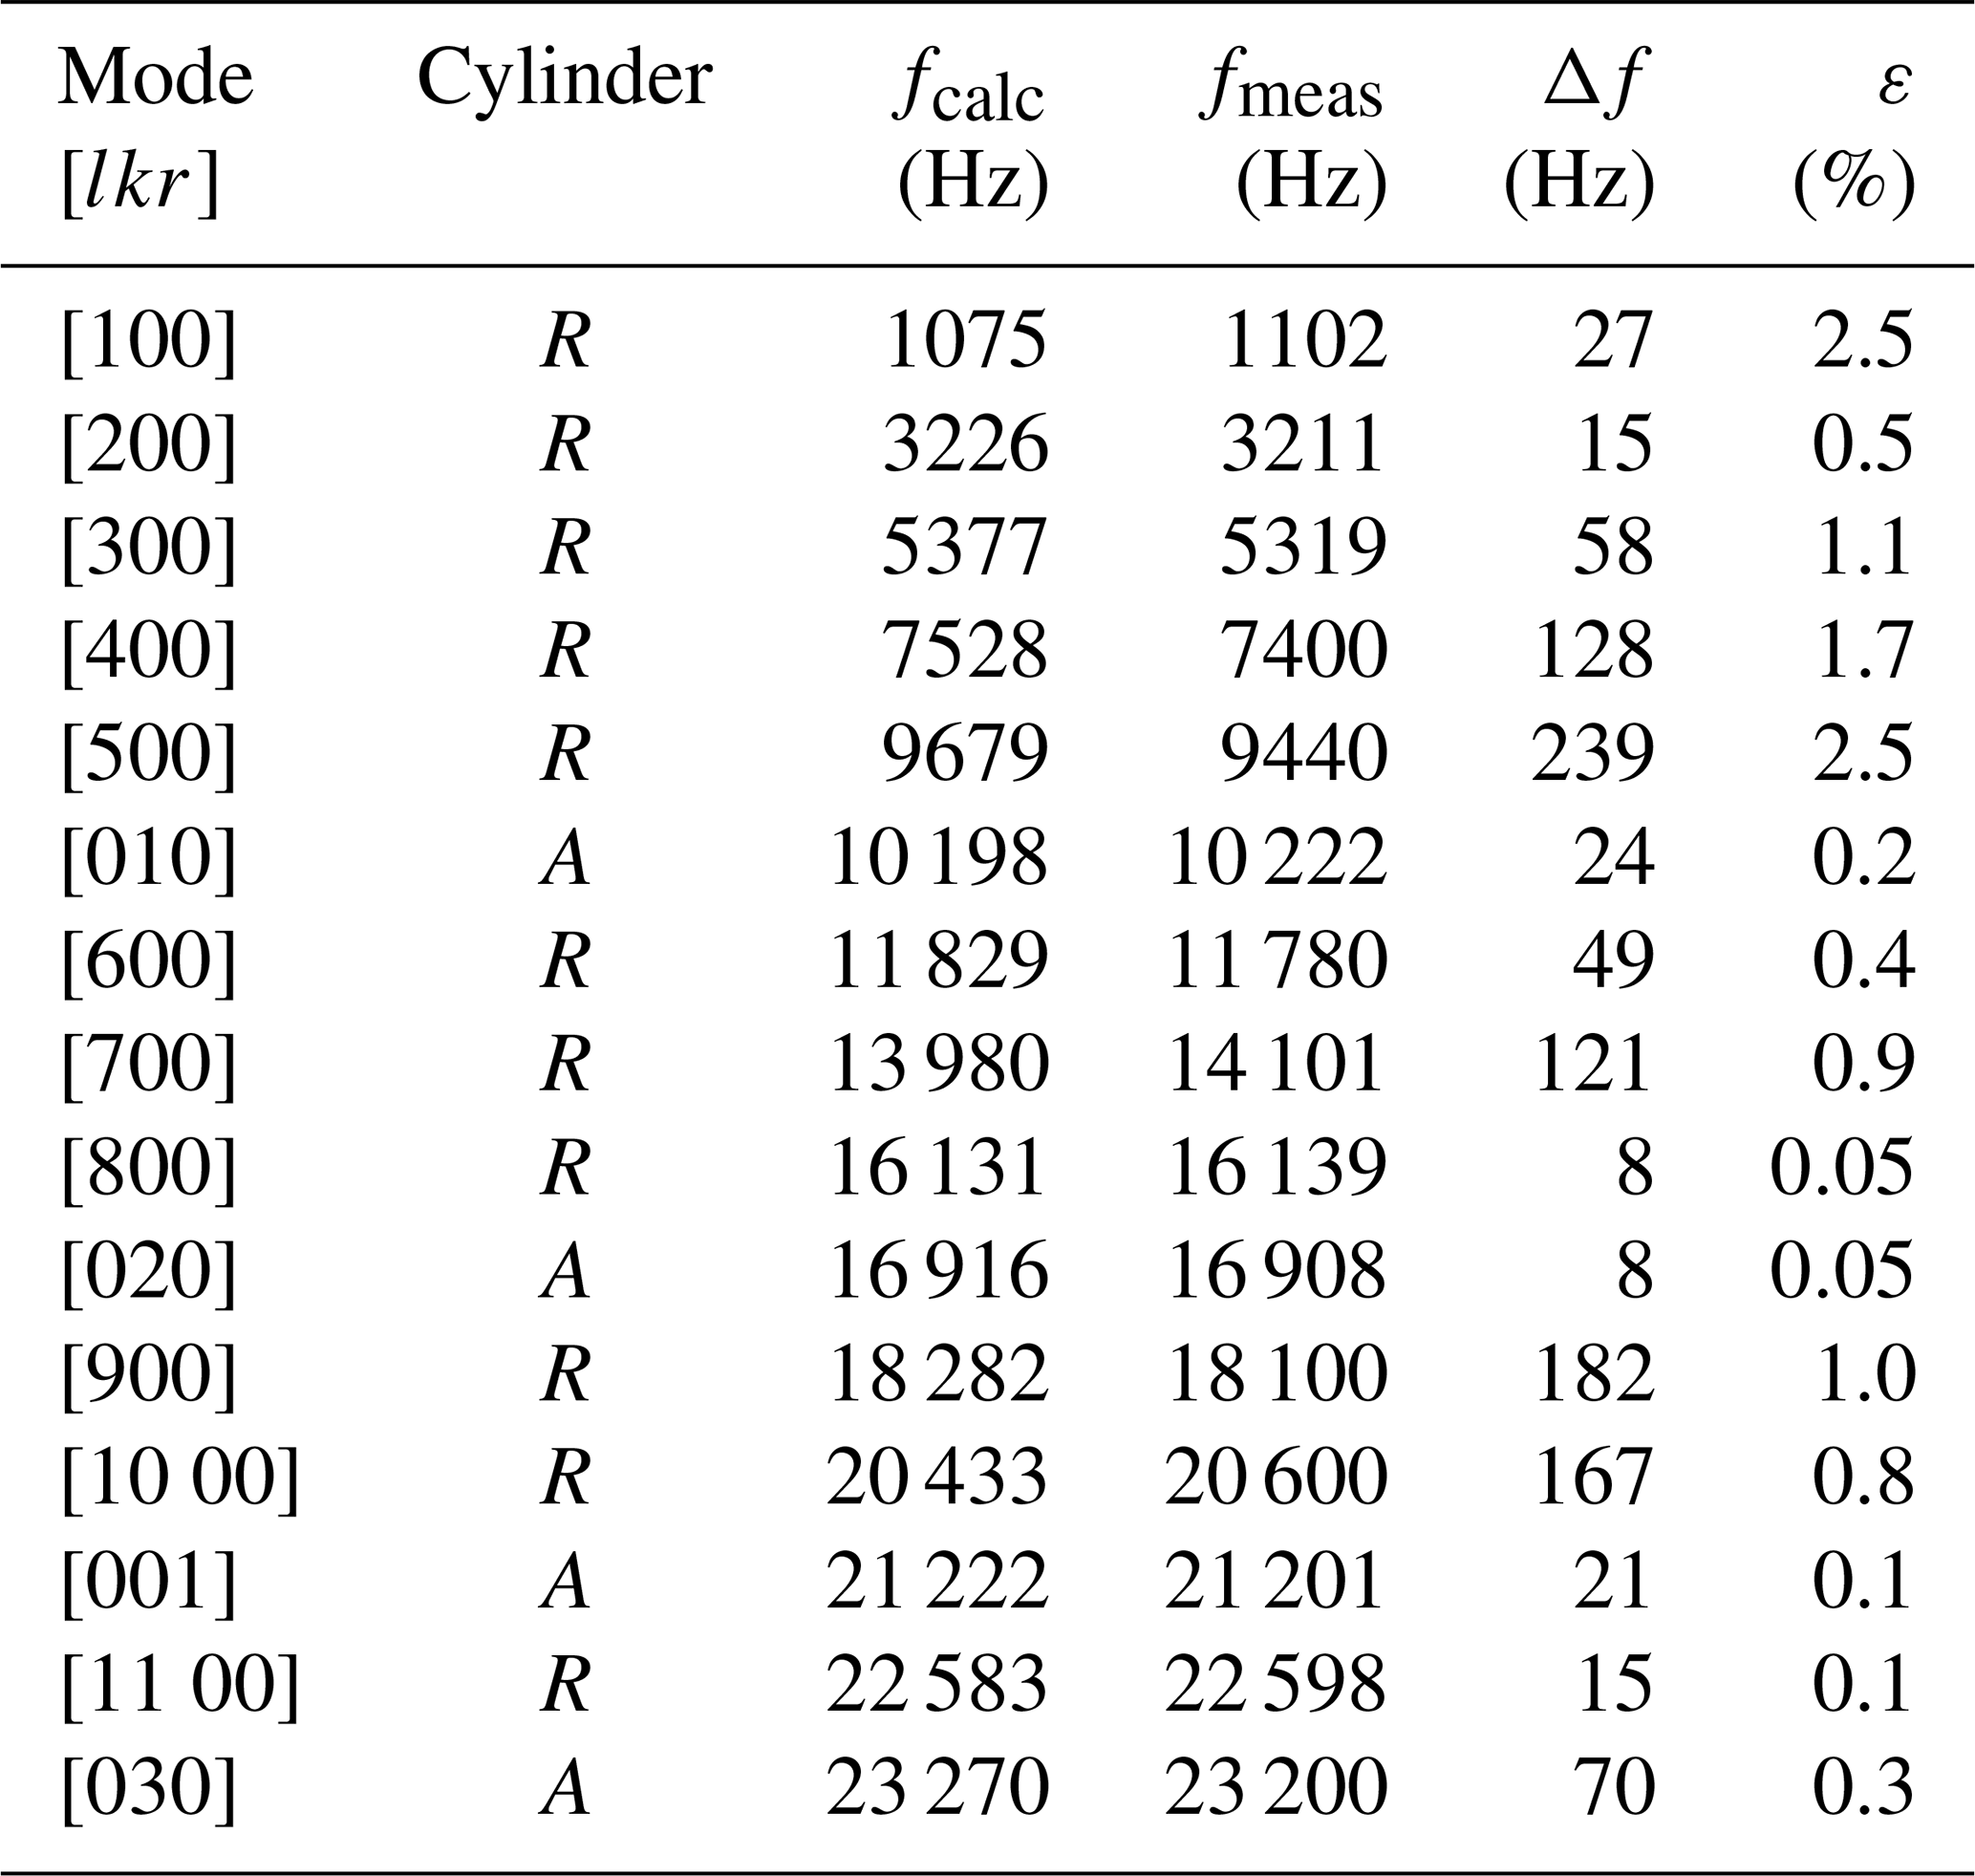
In order to investigate the phenomenon of the resonance modes in the absorption cylinder in more detail, frequency spectra were measured at different laser beam positions (as depicted in Fig. 1b). The x and y axes were examined separately. For the first four longitudinal modes, no changes in the PA signal can be seen comparing the laser beam positions (0,0), (), and () (Fig. 2b). At higher frequencies, the signal strengths of the individual modes vary. The largest deviations are at 10 222, 16 908, and 21 201 Hz. According to Table 2, the first two frequencies can be assigned to the first and second azimuthal modes of the absorption cylinder. At these frequencies, the signal is highest at () and decreases towards (0,0). This confirms the assignment to an azimuthal resonance mode, since these cannot be excited at (0,0). The resonance at 21 201 Hz can be assigned to the first radial mode of the absorption cylinder. The signal of the radial mode is highest at (0,0), confirming a correct assignment. The highest signals along the x axis were obtained for the first longitudinal mode and the first radial mode. Figure 2c shows the dependency of the frequencies on the laser beam position for (0,0), (0,5), and (0,10). The azimuthal modes in the absorption cylinder become more strongly excited for laser beam positions towards (0,10), the radial mode however is weaker. The behavior on the negative x and y axis corresponds to that on the positive x and y axis, respectively. The influence of the laser beam position on the signal intensity of the individual modes is significantly lower on the x axis. The highest PA signal was found at the first azimuthal mode measured in the absorption cylinder [010]A at a laser beam position (0,10), approximately 8 times higher than the signal at the first longitudinal mode in the resonance cylinder [100]R.
4.2 Comparison of the T-cells
In a T-cell, the absorption cylinder is not expected to enhance the photoacoustic signal through the excitation of a resonant mode. Yet we observed the highest PA signal at a resonant mode in the absorption cylinder. Since the microphone for signal detection is located at the end of the resonance cylinder, the acoustic wave from the absorption cylinder must be coupled into the resonance cylinder. Due to this, the different resonance cylinder geometries have an influence on the signal at the azimuthal mode of the absorption cylinder as well as on adjacent longitudinal modes, which can be clearly seen in Fig. 3 for the six different cells. At constant resonance cylinder length, the frequency and signal level of the [010]A mode changes with the diameter of the resonance cylinder. The signal increases as the adjacent longitudinal mode moves closer to the azimuthal mode. The highest signal for the short resonance cylinder was observed for cell number 1 (40_3): the [010]A and the [300]R mode coincide here.

Figure 3Comparison of the frequency spectra in the range of the first azimuthal mode of the six different cells recorded at a methane concentration of 100 ppm, a flow of 300 mL min−1, and a laser beam position of (x,y) = (0,10) (a) cell number 1 (40_3), cell number 2 (40_6), and cell number 3 (40_9), (b) cell number 4 (80_3), cell number 5 (80_6), and cell number 6 (80_9).
Figure 3a shows the comparison of the cells with LR=40 mm. The PA signal at the first azimuthal mode decreases with increasing diameter of the resonance cylinder. The signal of the adjacent longitudinal mode (300) behaves in the same way. The frequency of the azimuthal mode decreases with increasing diameter, that of the longitudinal increases with increasing diameter, i.e. the distance between the resonances of the two modes increases with increasing radius. For cell number 1, the two resonances even overlap. The closer the frequencies of the two modes together, the higher the PA signal.
In the cells with LR=80 mm, the cell with the smallest diameter also has the largest PA signal. In this case, the signal level of the adjacent longitudinal mode increases with increasing diameter, as can be seen in Fig. 3b. Here the azimuthal mode has a higher frequency than the adjacent longitudinal mode (500). As the diameter increases, the distance between the two modes becomes larger and the PA signal decreases. The diameter and length of the resonance cylinder affect the frequency and height of the PA signal at the first azimuthal mode. The PA signal in this mode is greatest for cell number 4.
Measurements in which the concentration was varied were carried out for the first longitudinal and the first azimuthal mode. Exemplarily, the result for cell number 3 is shown in Fig. 4a. In both modes, we see a linear behavior in the chosen concentration range. The slope of the linear fit is significantly higher in the azimuthal mode than in the longitudinal mode. Figure 4b shows the results for all cells at the first azimuthal mode.
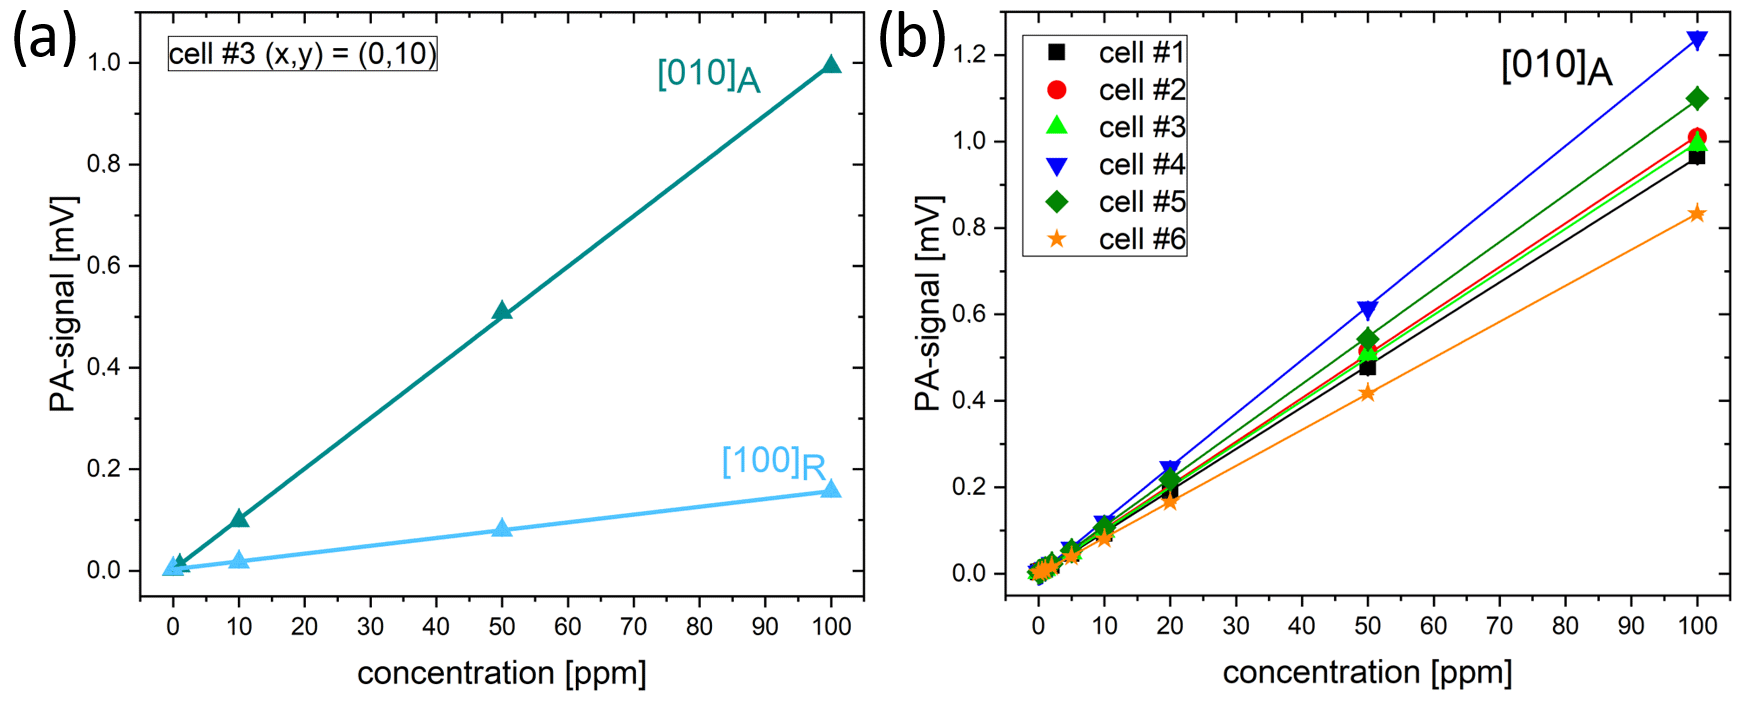
Figure 4(a) PA signals obtained for methane concentrations of 1, 10, 50, and 100 ppm for the first azimuthal mode in the absorption cylinder and the first longitudinal mode in the resonance cylinder in cell number 3. The signals are significantly higher in first azimuthal mode. (b) PA signals obtained for methane concentrations of 1, 5, 10, 20, 50, and 100 ppm for all cells. The highest signals were obtained for cell number 4. All measurements were performed using N2 as carrier gas and at a gas flow of 300 mL min−1 at a laser beam position of (x,y) = (0,10).
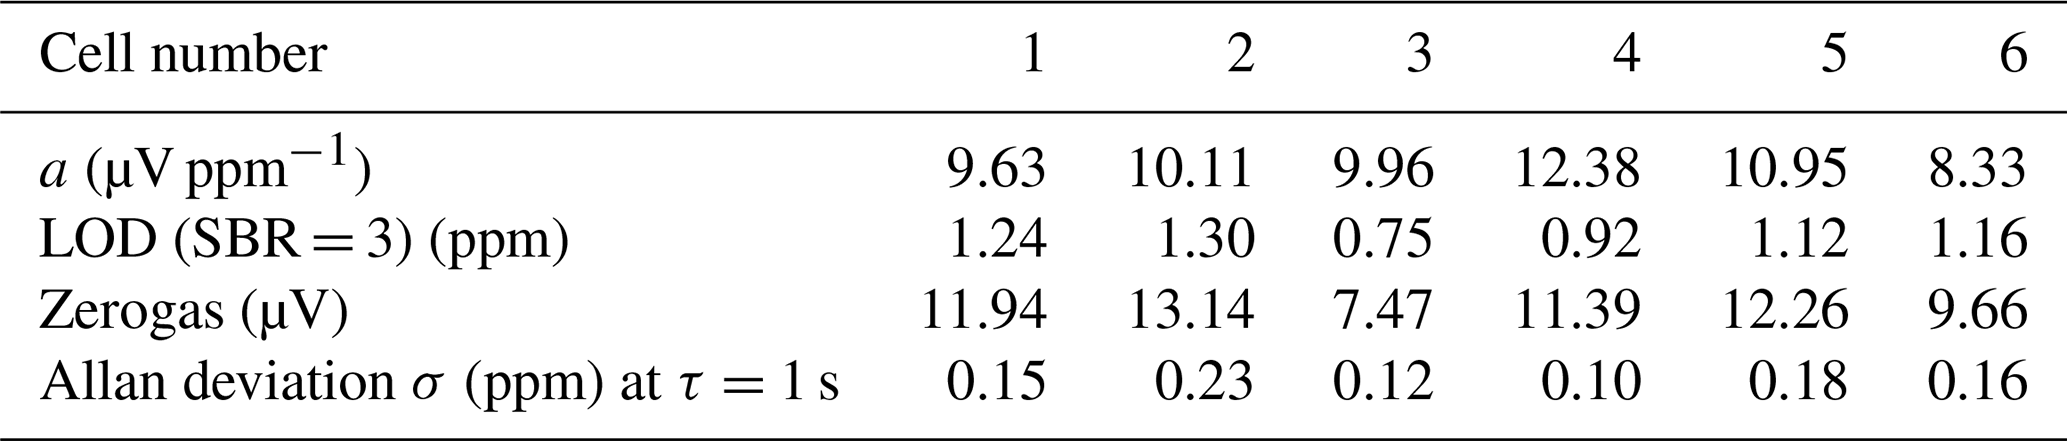
Although cell number 4 gave the best slope, it does not offer the best SBR. With an LOD of 0.92 ppm, it is higher than the LOD of cell number 3 (0.75 ppm). Cell number 3 appears to have significantly less background signal than cell number 4. Table 4 compares the slopes and achievable LODs (based on SBR = 3) for all cells, and the Allan deviation at an averaging time of 1 s, based on the data shown in Fig. 5a.
Table 4Parameters from the concentration curves for all cells: slope of the concentration curves a, LOD (based on SBR= 3, calculated according to Eq. 3), zerogas signal, and the Allan deviation at an averaging time of 1 s (taken from Fig. 5a).
One way to achieve a high sensitivity of a sensor system is to use long averaging times. Yet here a limiting factor is the stability, since in real systems long averaging times might cause misleading signals (Werle et al., 1993). To analyze the stability of the PA system, long-term measurements were carried out and the Allan (standard) deviation was calculated for evaluation. The so-called Allan plot can also be used to make statements about the dominating noise processes in the signal curve (Bozóki et al., 2011). Figure 5a shows the Allan plot of the six cells for measurements with closed cells containing ambient air.
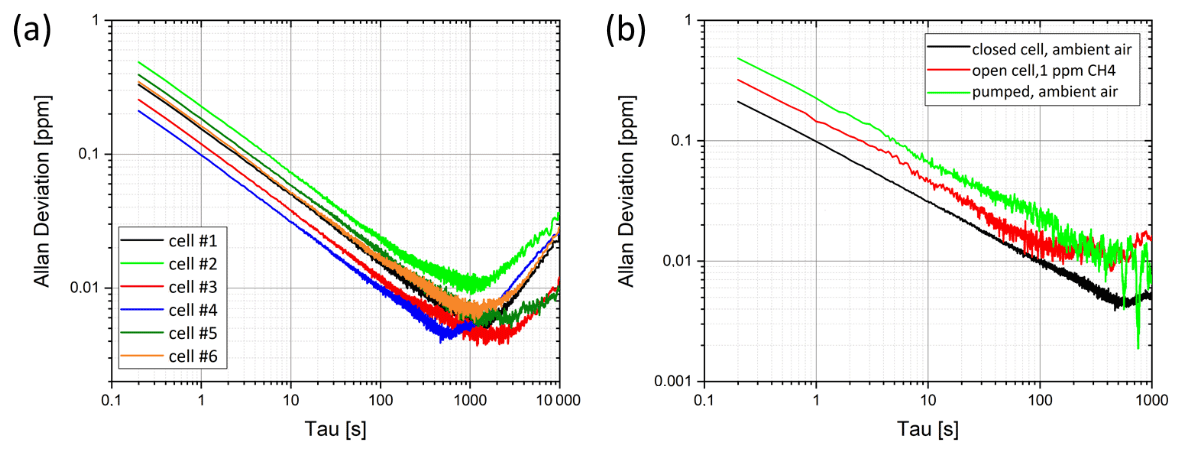
Figure 5(a) Allan deviation of all cells for ambient air, cells closed. (b) Allan deviation for different flow conditions in cell 4: at a flow rate of 300 mL min−1 and a methane concentration of 1 ppm, with ambient air pumped through the cell, and while the cell containing ambient air was closed. All measurements at laser beam position (x,y) = (0,10).
The Allan plots are very similar for all cells. First, the Allan deviation decreases with increasing averaging times, a longer averaging time leads to a better SNR. Yet for long averaging times (approx. >500 s), the Allan deviation increases again, i.e. the SNR increases again, indicating a drift behavior of the system. The slope of the drop for averaging times <500 s is −0.5, this value suggests that in this range white noise dominates. The smallest Allan deviations were reached with cell number 4, with 100 ppb at an averaging time of 1 s. Figure 5b shows the Allan plots for cell number 4 at different flow conditions through the cell (closed, flow of 300 mL min−1, pumped) As in Fig. 5a, the Allan plots run parallel up to an averaging time of ∼100 s. The smallest Allan deviations were reached with the closed cell. When the cell is perfused, flow noise causes a higher noise background and thus higher deviations. Generally, the LODs calculated based on the Allan deviation are lower than the LODs based on the SBR, because the SBR also includes errors from the calibration.
A laser-based, photoacoustic methane sensor based on resonant T-cells was realized and different cell designs were investigated. Resonances occurred in both the resonance and absorption cylinder. It has been shown that the modes in the absorption cylinder are dependent on the geometric position of the laser beam in the direction of the resonance cylinder and that the signal is significantly increased in the first azimuthal mode, exceeding the signals obtained from longitudinal modes in the resonance cylinder, which were expected to have a higher influence. Calculated and measured frequencies for the different geometries agreed well. The long-term behavior of all cells was investigated by measurements in the first azimuthal mode in ambient air. The Allan plot showed a drift starting at ∼1000 s averaging time. Using the first azimuthal mode of cell number 4 and a laser beam position of (x,y) = (0.10), a detection limit of ∼0.1 ppm methane could be achieved.
All code underlying the results is available as part of the article.
All data underlying the results are available as part of the article and no additional source data are required.
The supplement related to this article is available online at: https://doi.org/10.5194/jsss-12-37-2023-supplement.
KS prepared the paper and part of data visualization. MS carried out the experimental work including part of data visualization. TS designed and supervised the experiments. CW developed the electronics and signal evaluation. JW contributed with conceptualization of the project and funding acquisition. All authors revised the final paper.
The contact author has declared that none of the authors has any competing interests.
Publisher’s note: Copernicus Publications remains neutral with regard to jurisdictional claims in published maps and institutional affiliations.
This article is part of the special issue “Sensors and Measurement Systems 2022”. It is a result of the “Sensoren und Messsysteme 2022, 21. ITG/GMA-Fachtagung”, Nuremberg, Germany, 10–11 May 2022.
We acknowledge funding for this work from the Vector Foundation (“PaMeSan” (grant no. P2020-0130)) and from the European Union's Horizon 2020 research and innovation program (RedFinch (grant no. 780240)).
This research has been supported by the Vector Stiftung (grant no. P2020-0130) and Horizon 2020 (REDFINCH (grant no. 780240)).
This open-access publication was funded by the University of Freiburg.
This paper was edited by Leonhard Reindl and reviewed by three anonymous referees.
Baumann, B., Kost, B., Wolff, M., and Groninga, H.: Modeling and numerical investigation of photoacoustic resonators, INTECH Open Access Publisher, 17–38. doi10.5772/6798, 2008.
Baumann, B., Kost, B., Groninga, H., and Wolff, M.: Eigenmode analysis of photoacoustic sensors via finite element method. Rev. Sci. Instrum., 77, 044901, https://doi.org/10.1063/1.2186808, 2006.
Bozóki, Z., Pogány, A., and Szabó, G.: Photoacoustic Instruments for Practical Applications: Present, Potentials, and Future Challenges, Appl. Spectrosc. Rev., 46, 1–37, https://doi.org/10.1080/05704928.2010.520178, 2011.
Dong, L., Tittel, F. K., Li, C., Sanchez, N. P., Wu, H., Zheng, C., Yu, Y., Sampaolo, A., and Griffin, R. J.: Compact TDLAS based sensor design using interband cascade lasers for mid-IR trace gas sensing, Opt. Expr., 24, A528–A535, https://doi.org/10.1364/OE.24.00A528, 2016.
Dumitras, D. C., Dutu, D. C., Matei, C., Magureau, A. M., Petrus, M., and Popa, C.: Laser photoacoustic spectroscopy: principles, instrumentation, and characterization, J. Optoelectron. Adv. Mat., 9, 12, 3655–3701, WOS:000251768700001, 2007.
Elia, A., Luagarà, P. M., Franco, C. D., and Spagnolo, V.: Photoacoustic Techniques for Trace Gas Sensing Based on Semiconductor Laser Sources, Sensors, 9, 12, 9616–9628, https://doi.org/10.3390/s91209616, 2009.
El-Safoury, M., Weber, C., Kiesewetter, O., Hespos, Y., Eberhardt, A., Schmitt, K., and Wöllenstein, J.: Miniaturized photoacoustic detection of organofluorine-based refrigerants, J. Sens. Sens. Syst., 9, 89–97, https://doi.org/10.5194/jsss-9-89-2020, 2020.
Feng, L., Palmer, P. I., Zhu, S., Parker, R. J., and Liu, Y.: Tropical methane emissions explain large fraction of recent changes in global atmospheric methane growth rate, Nat. Commun., 13, 1–8, https://doi.org/10.1038/s41467-022-28989-z, 2022.
Gassner, S., Schaller, R., Eberl, M., von Koblinski, C., Essing, S., Ghaderi, M., Schmitt, K., and Wöllenstein, J.: Anodically Bonded Photoacoustic Transducer: An Approach towards Wafer-Level Optical Gas Sensors, Sensors, 22, 685, https://doi.org/10.3390/s22020685, 2022.
IEA: Methane Tracker 2021, IEA, Paris, https://www.iea.org/reports/methane-tracker-2021 (last access: 5 December 2022), 2021.
Jorgenson, A. K.: Global warming and the neglected greenhouse gas: A cross-national study of the social causes of methane emissions intensity, 1995, Soc. Forces, 84, 1779–1798, https://doi.org/10.1353/sof.2006.0050, 2006.
Lackner, M.: Tunable diode laser absorption spectroscopy (TDLAS) in the process industries–a review. Rev. Chem. Eng., 23, 65–147, https://doi.org/10.1515/REVCE.2007.23.2.65, 2007.
Li, J., Chen, W., and Yu, B.: Recent progress on infrared photoacoustic spectroscopy techniques, Appl. Spectrosc. Rev., 46, 440–471, https://doi.org/10.1080/05704928.2011.570835, 2011.
Miklós, A., Hess, P., and Bozóki, Z.: Application of acoustic resonators in photoacoustic trace gas analysis and metrology, Rev. Sci. Instrum., 72, 1937–1955, https://doi.org/10.1063/1.1353198, 2001.
Morse, P. M. and Ingard, K. U.: Theoretical acoustics, Princeton University Press, Princeton, New Jersey, ISBN 0-691-08425-4, 1986.
Petersen, A. K., Warneke, T., Frankenberg, C., Bergamaschi, P., Gerbig, C., Notholt, J., Buchwitz, M., Schneising, O., and Schrems, O.: First ground-based FTIR observations of methane in the inner tropics over several years, Atmos. Chem. Phys., 10, 7231–7239, https://doi.org/10.5194/acp-10-7231-2010, 2010.
Ripperger, S. and Germerdonk, R.: Quantitative gas analysis by infrared spectroscopy, Chem.-Ing.-Tech., 55, 58–561, 1983.
Thomas, S. and Haider, N. S.: Instruments for methane gas detection, J. Eng. Res. Appl., 4, 137–143, 2014.
Schilt, S., Besson, J.-P., and Thévenaz, L.: Near-infrared laser photoacoustic detection of methane: the impact of molecular relaxation, Appl. Phys. B, 82, 319–328, https://doi.org/10.1007/s00340-005-2076-y, 2006.
Wolff, M., Groninga, H. G., Baumann, B., Kost, B., and Harde, H.: Resonance Investigations using PAS and FEM, Acta Acust., 91, 99, http://hdl.handle.net/20.500.12738/2208 (last access: 5 December 2022), 2005.
Werle, P., Mücke, R., and Slemr, F.: The Limits of Signal Averaging in Atmospheric Trace-Gas Monitoring by Tunable Diode-Laser Absorption Spectroscopy (TDLAS), Appl. Phys. B, 57, 131–139, https://doi.org/10.1007/BF00425997, 1993
Wittstock, V., Scholz, L., Bierer, B., Perez, A. O., Wöllenstein, J., and Palzer, S.: Design of a LED-based sensor for monitoring the lower explosion limit of methane, Sens. Actuators B, 247, 930–939, https://doi.org/10.1016/j.snb.2017.03.086, 2017.
Wolff, M., Rhein, S., Bruhns, H., Nähle, L., Fischer, M., and Koeth, J.: Photoacoustic methane detection using a novel DFB-type diode laser at 3.3 μm. Sens, Actuators B: Chemical, 187, 574–577, https://doi.org/10.1016/j.snb.2013.04.084, 2013.
Ye, W., Tu, Z., Xiao, X., Simeone, A., Yan, J., Wu, T., Wu, F., Zheng, C., and Tittel, F. K.: A NDIR mid-infrared methane sensor with a compact pentahedron gas-cell. Sensors, 20, 5461, https://doi.org/10.3390/s20195461, 2020.
Zhao, Z. J., Liu, D. X., Zhang, J. L., Wang, Z. B., Li, X., and Tian, E. M.: Design of non-dispersed infrared (NDIR) methane gas sensor, Spectrosc. Spec. Anal., 31, 570–573, https://doi.org/10.3964/j.issn.1000-0593(2011)02-0570-04, 2011.